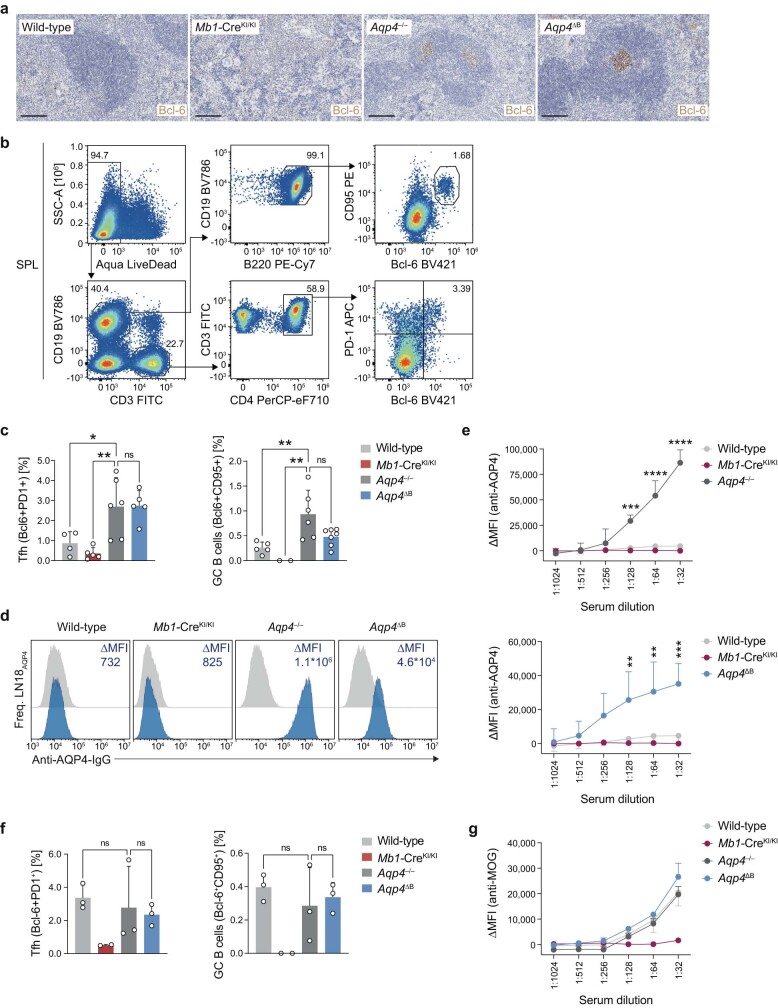
Extended Data Fig. 8. Characterization of germinal centre responses to full-length AQP4 immunization.
Wild-type, B cell-deficient (Mb1-CreKI/KI), Aqp4–/–, and Aqp4ΔB mice were immunized with full-length AQP4 or human recombinant full-length MOG protein and tested for germinal centre (GC) responses on d12 after immunization. (a) Representative immunostainings of Bcl-6 in spleens of full-length AQP4-immunized mice (n = 2 independent experiments, scale bar 100 µm). (b) Representative cytograms and gating strategy of splenic Tfh cells (live CD19–CD3+CD4+Bcl-6+PD-1+) and GC B cells (live CD19+CD3–B220+Bcl-6+CD95+). (c) Flow cytometric quantification of splenic Tfh cell and GC B cell frequencies in spleens of AQP4-immunized wild-type, B cell-deficient (Mb1-CreKI/KI), Aqp4–/–, and Aqp4ΔB mice. (d, e) The AQP4-specific serum response was tested with serial dilutions in a cell-based assay with sera isolated prior to (d-1) and on d21 after immunization with full-length AQP4. (d) Representative histograms of the anti-AQP4-serum response tested in LN18AQP4 cells at d-1 (grey histograms) and d21 (blue histograms). (e) Quantification of the anti-AQP4-serum response for Aqp4–/– (n = 2, upper panel) and Aqp4ΔB (n = 3, lower panel) alongside wild-type (n = 4) and Mb1-CreKI/KI (n = 2, depicted in both panels for reference), tested in serial dilutions as indicated on the x-axis. (f) Quantification of Tfh cell and GC B cell frequencies in secondary lymphoid tissues of MOG protein-immunized wild-type (n = 3), B cell-deficient Mb1-CreKI/KI (n = 2), Aqp4–/– (n = 3), and Aqp4ΔB (n = 3) mice. (g) The MOG-specific serum response was tested with serial dilutions in a cell-based assay with sera isolated on d-1 and d21 after immunization with full-length MOG protein. Quantification of the anti-MOG-serum response tested in serial dilutions as indicated on the x-axis. Data in (c, f) are shown as mean ± SD and tested by one-way ANOVA with Tukey’s post-test. Data in (e, g) are shown as delta mean fluorescence intensity (ΔMFI = MFId21 – MFId-1) ± SD and tested by two-way ANOVA with Sidak’s post-test. * P < 0.05, ** P < 0.01, *** P < 0.001, **** P < 0.0001. ns = not significant. Symbols indicate biological replicates.

