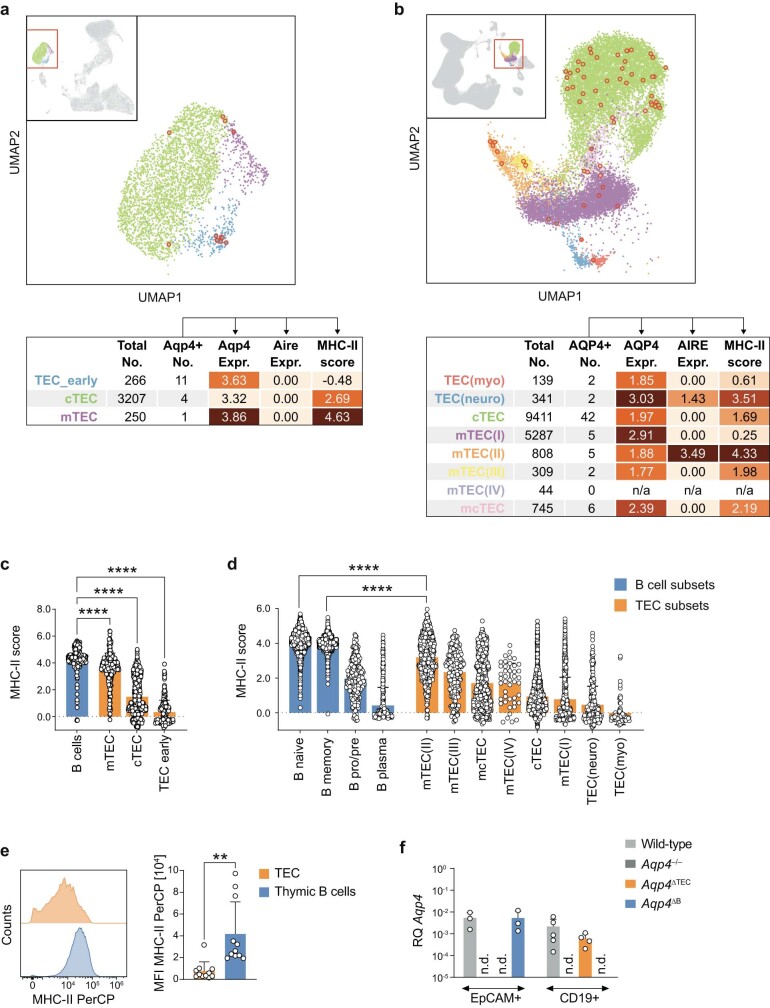
Extended Data Fig. 2. AQP4 and MHC-II expression in thymic B cells and thymic epithelial cells.
(a-d) Analysis of previously published mouse (a, c) and human (b, d) thymic scRNAseq datasets. (a, b) Upper panel: UMAP representation of TEC subsets as selected from the total dataset shown in the upper-left quadrant. The red square indicates the magnified region, and the red circles indicate Aqp4- and AQP4-expressing cells for mouse (a) and human data (b), respectively. Colour code of cells in UMAP as annotated in the table row titles below. Lower panel: Table showing the total population size in the dataset along with the number of Aqp4- and AQP4-expressing cells and (only for these positive cells) their mean expression level of Aqp4 and AQP4, as well as Aire and AIRE, and mean MHC-II score for mouse (a) and human subsets (b), respectively. (c, d) Comparison of MHC-II scores from B cell and TEC subsets irrespective of their Aqp4 or AQP4 status in mouse (c) and human (d). Each circle represents a cell in the dataset. Data shown as mean ± SD. **** P < 0.0001 following one-way ANOVA, specifically Dunnett’s multiple comparison test to compare B cells (n = 207) with all TEC subsets (N as indicated in the corresponding table above) in mouse (c) and Sidak’s multiple comparison test to compare all B cell subsets (n = 2161 for memory, n = 2152 for naive, n = 479 for plasma and n = 290 for pro/pre B cells) with all TEC subsets (n as indicated in the corresponding table above) in human (d). To maintain legibility, only two representative tests were indicated in (d), with naive and memory B cells also outranking all other TEC subsets at the same significance level. (e) Representative histogram overlay of MHC-II expression in TECs and thymic B cells and corresponding quantification. Data are shown as mean fluorescence intensity (MFI) ± SD, two-tailed unpaired t-test, ** P < 0.01. Symbols represent biological replicates. (f) Aqp4 expression in TECs and thymic B cells FACS-sorted from wild-type, Aqp4–/–, Aqp4ΔTEC, and Aqp4ΔB mice. Total RNA was isolated and probed for Aqp4. Aqp4 expression was normalized to astrocytes. Mean relative RQ ± SD. Symbols indicate biological replicates; zero-values are not depicted due to logarithmic scaling. n.d., not detected.

