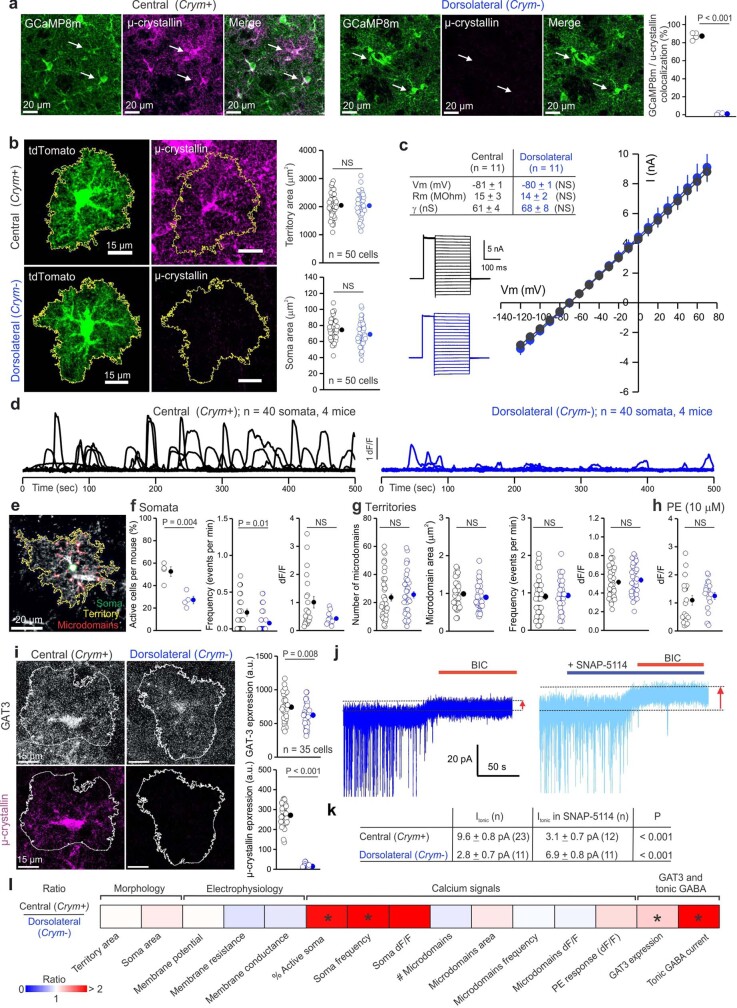
Extended Data Fig. 12. Functional properties of Crym+ and Crym− astrocytes.
a, GCaMP8m expression in central (Crym+) and dorsolateral (Crym−) astrocytes. Representative images for central and dorsolateral striatal astrocytes expressing cytosolic GCaMP8m (white arrows show GCaMP8m expressing astrocytes). Scatter graph shows the percent co-localization between GCaMP8m and µ-crystallin (n = 4 mice, two-tailed two-sample t-test, P = 1.3 ×10⁻⁸) There was no co-localization between μ-crystallin and GCaMP8m in the dorsolateral region, because astrocytes in this region do not express Crym. b, Representative images for central (Crym+) and dorsolateral (Crym−) striatal astrocytes expressing tdTomato (left) and µ-crystallin (right). Scatter graphs show the territory and soma area (n = 50 cells from 5 mice, two-tailed two-sample t-test). c, Whole-cell voltage clamp recordings from central and dorsolateral striatal astrocytes. Representative current waveforms, average current-voltage relationships, membrane potential (mV), membrane resistance (MOhm) and slope conductance (nS) are shown (n = 11 cells from 4 mice, two-tailed two-sample t-test). d, Traces representing the ΔF/F of Ca2+ signals in somata of central (Crym+) and dorsolateral (Crym−) astrocytes. Astrocytes from the central striatum were more active. e, Representative image of GCaMP8m expressing astrocyte showing somatic, territory and microdomain regions of interest. f, Scatter graphs show the percent of active cells per mouse when assessed over 500 s (n = 4 mice), the frequency of Ca2+ signals per cell, and their ΔF/F in somata (n = 40 cells from 4 mice, two-tailed two-sample t-test and two-tailed Mann-Whitney test). As seen in the representative traces in d, astrocytes in the central striatum were more active within their somata. g, Scatter graphs show the number, area, frequency, and ΔF/F of Ca2+ signals in astrocyte territories (n = 40 cells from 4 mice, two-tailed Mann–Whitney or two-tailed two-sample t-test); there were no differences. h, Scatter graphs of Ca2+ signals, represented by ΔF/F, evoked by 10 µM phenylephrine (PE). There were no differences (n = 20 cells from 4 mice; two-tailed two-sample t-test). i, Representative images (left) and quantification (right) of the expression of GAT3 and µ-crystallin in central and dorsolateral striatal astrocytes (n = 35 cells from 4 mice, two-tailed Mann–Whitney or two-tailed two-sample t-test, P = 6.5 ×10⁻¹³ for µ-crystallin). GAT3 was higher in the central striatal astrocytes. j, Current recordings in voltage clamp (−60 mV) from MSNs in dorsolateral striatal astrocytes. Dashed lines and arrows indicate the changes of baseline holding current induced by application of bicuculline (BIC = 25 µM) or bicuculline after a pre-application of GAT3 inhibitor SNAP-5114 (40 μM). For comparison, traces for central astrocytes are shown in Fig. 3. k, The inset table summarizes the tonic GABA currents for central and dorsolateral striatal astrocytes. Tonic GABA currents were larger in the central striatum and were reduced by a pre-application of the GAT3 blocker, SNAP-5114, indicating GAT3 contributed GABA to the extracellular space. However, in the dorsolateral striatum, tonic GABA currents were smaller and increased by pre-application of SNAP-5114, indicating that in this region GAT3 removed GABA from the extracellular space. l, Heat map shows the ratio of the various metrics for central (Crym+) vs dorsolateral (Crym−) astrocytes for all the parameters assessed above (* = P < 0.05). Statistical tests and P values for the heat map are from the corresponding data reported in the earlier panels in the figure. Average data are shown as mean ± s.e.m. and all statistics are reported in Supplementary Table 5.

