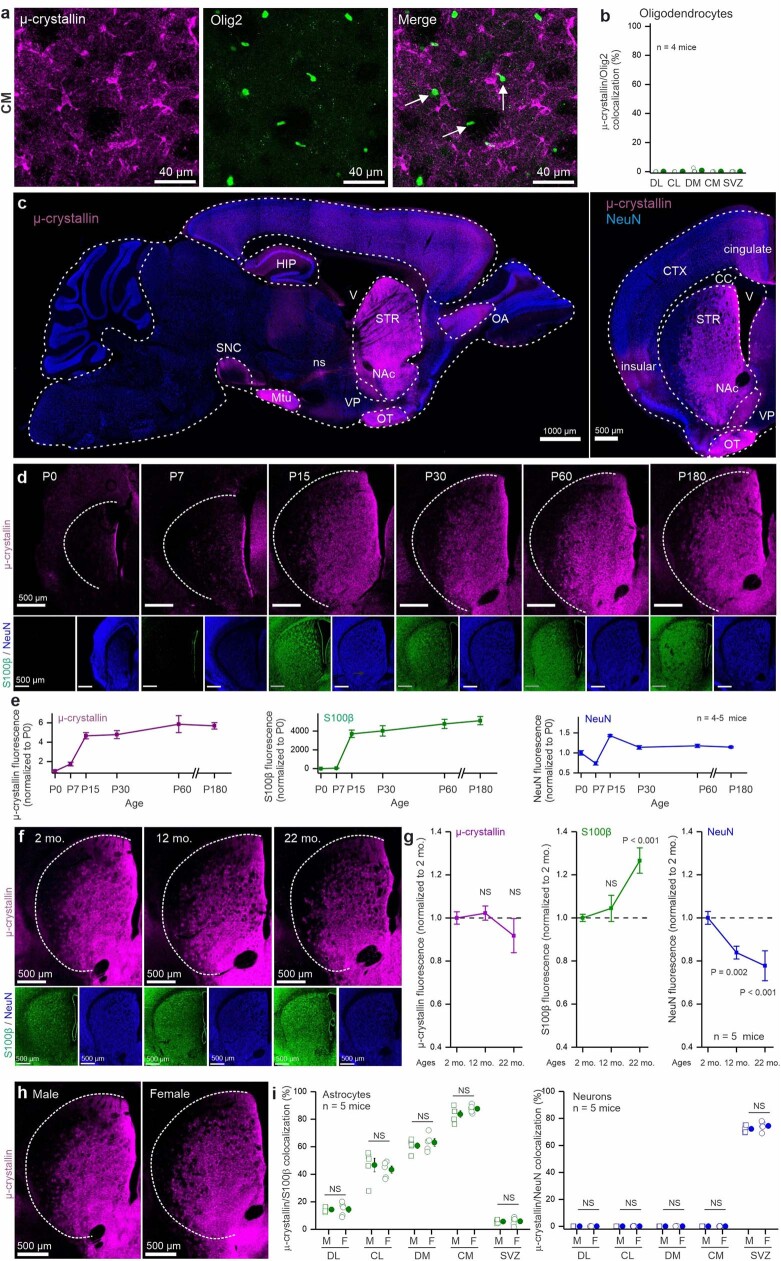
Extended Data Fig. 1. μ-crystallin immunostaining.
a,b, μ-crystallin is not expressed in Olig2+ oligodendrocytes on the basis of representative images (a) and average data across mice and across regions of the striatum (b; n = 4 mice) where μ-crystallin was expressed in astrocytes (see also main text of manuscript and Fig. 1). c, Sagittal (left) and coronal (right) whole brain images show µ-crystallin (magenta) and NeuN (blue) expression. (V, ventricle; HIP, hippocampus; CTX, cortex; STR, striatum; OA, olfactory area; VP: ventral pallidum; NAc, nucleus accumbens; SNC, substance nigra compact; ns, nigrostriatal bundle; MTu, medial tuberal nucleus; OT, olfactory tubercule). d, µ-crystallin (magenta), S100β (green) and NeuN (blue) striatal expression during postnatal development from P0 to P180 (from left to right). Scale bars = 500 µm. e, Quantification of µ-crystallin, S100β, and NeuN expression in the central striatum (n = 4 mice for P0, P15, P30, P60 and n = 5 mice for P7, P180). f–i, μ-crystallin expression in different ages (2, 12, and 22 months in f,g) as well as in male and female mice at 2 months (h,i). There was no significant change in μ-crystallin expression at 12 and 22 months of age in relation to 2-month-old mice, which are approximately the age used in most of our work (n = 5 mice; One-way ANOVA tests followed by Tukey’s post-hoc test, overall ANOVA P = 0.57 for µ-crystallin, 0.0021 for S100ß and 0.0018 for NeuN at 22 months old). There was also no difference in the expression of μ-crystallin between male and female mice (n = 5 mice; two-way ANOVA tests followed by Tukey’s post-hoc test). Average data are shown as mean ± s.e.m. and all statistics are reported in Supplementary Table 5.

