

Abstract
Background
Phenylbutazone is often prescribed to manage pain caused by hyperinsulinemia‐associated laminitis, but in diabetic people nonsteroidal anti‐inflammatory drugs increase insulin secretion and pancreatic activity.
Hypothesis/Objectives
Investigate the effect of phenylbutazone administration on insulin secretion in horses. It was hypothesized that phenylbutazone will increase insulin secretion in horses with insulin dysregulation (ID).
Animals
Sixteen light breed horses, including 7 with ID.
Methods
Randomized cross‐over study design. Horses underwent an oral glucose test (OGT) after 9 days of treatment with phenylbutazone (4.4 mg/kg IV q24h) or placebo (5 mL 0.9% saline). After a 10‐day washout period, horses received the alternative treatment, and a second OGT was performed. Insulin and glucose responses were compared between groups (ID or controls) and treatments using paired t test and analyses of variance with P < .05 considered significant.
Results
In horses with ID, phenylbutazone treatment significantly decreased glucose concentration (P = .02), glucose area under the curve (2429 ± 501.5 vs 2847 ± 486.1 mmol/L × min, P = .02), insulin concentration (P = .03) and insulin area under the curve (17 710 ± 6676 vs 22 930 ± 8788 μIU/mL × min, P = .03) in response to an OGT. No significant effect was detected in control horses.
Conclusion and Clinical Importance
Phenylbutazone administration in horses with ID decreases glucose and insulin concentrations in response to an OGT warranting further investigation of a therapeutic potential of phenylbutazone in the management of hyperinsulinemia‐associated laminitis beyond analgesia.
Keywords: endocrinology, equine metabolic syndrome, hyperinsulinemia, laminitis, nonsteroidal anti‐inflammatory drugs, obesity, oral glucose test
Abbreviations
- ANOVA
analysis of variance
- AUC
area under the curve
- BCS
body condition score
- Cmax
maximum concentration
- CNS
cresty neck score
- EP3
guanine receptor E‐class prostanoid 3
- GIP
glucose‐dependent insulinotropic polypeptide
- GLP‐1
glucagon‐like peptide 1
- GLP‐2
glucagon‐like peptide 2
- HAL
hyperinsulinemia‐associated laminitis
- ID
insulin dysregulation
- IR
insulin resistance
- LC‐MS
liquid chromatography mass spectrometry
- MFA
meclofenamic acid
- mFSIGTT
modified frequently sampled intravenous glucose tolerance test
- NSAID
nonsteroidal anti‐inflammatory drug
- OGT
oral glucose test
- PGE2
prostaglandin E2
1. INTRODUCTION
Hyperinsulinemia is characterized by an increased amount of circulating insulin, which can occur either in a basal (resting) state or after the consumption of carbohydrates (postprandially). 1 It can result from increased pancreatic stimulation, decreased insulin clearance, compensation of tissue insulin resistance (IR) or a combination of these mechanisms, which can be grouped under the term insulin dysregulation (ID). 1 , 2 Regardless of the cause of hyperinsulinemia, excessive concentrations of circulating insulin in the bloodstream have been recognized as a key factor in the development of laminitis, a condition now referred to as hyperinsulinemia‐associated laminitis (HAL). 3 , 4 Laminitis is a painful condition of the equine hoof where the primary and secondary lamellar structures separate, which in severe cases leads to rotation and sinking of the pedal bone. 5 To alleviate the extreme pain associated with laminitis, analgesic management is necessary, and phenylbutazone is a drug commonly used for this purpose in horses. 5 , 6 , 7 As a nonselective inhibitor nonsteroidal anti‐inflammatory drug (NSAID), phenylbutazone inhibits both cyclooxygenase 1 and 2. 8 , 9 Thus, phenylbutazone inhibits downstream synthesis of prostaglandins, products that have both homeostatic and inflammatory effects. 9 Prostaglandin E2 (PGE2), the main prostaglandin the formation of which is inhibited by phenylbutazone, acts on the guanine receptor E class prostanoid 3 (EP3) in the pancreas in a homeostatic capacity to inhibit insulin secretion. 10 Treatment with NSAIDs has been documented to increase insulin secretion from pancreatic cells in models of diabetes 11 and, in people with type‐2 diabetes, NSAIDs have been used to increase insulin secretion and decrease clearance. 12 Although important metabolic differences exist between type‐2 diabetes in humans and hyperinsulinemia in horses, it is crucial to investigate whether NSAIDs also would increase insulin secretion in horses, especially those receiving phenylbutazone for pain management of HAL.
Therefore, our objective was to investigate the effect of phenylbutazone administration on insulin secretion in horses and specifically in horses with ID. It is hypothesized that phenylbutazone administration will increase insulin secretion in response to an oral glucose test (OGT) and that this effect will be more marked in horses with ID.
2. METHODS
2.1. Study design
All of the procedures were approved by the Institutional Animal Ethics Committee. The study was undertaken using a non‐blinded randomized cross‐over design during summer (November and December, Southern Hemisphere), over 2 consecutive years. Light breed horses (n = 20) of various ages, sex, and breed were screened for enrollment. Horses enrolled in the study were housed in dirt yards, with ad libitum access to lucerne hay (analysis is found in Table S1) and water. Horses were exercised on an automated horse walker for 30 minutes 3 times a week at a walk.
To start the study, horses underwent a week of acclimatization in individual yards. Body weight, body condition score (BCS) 13 and cresty neck score (CNS) 14 were recorded. Horses then were assigned randomly to an initial treatment group using a random number generator. They initially received either 4.4 mg/kg phenylbutazone IV once daily or a placebo treatment of 5 mL of 0.9% saline IV once daily for 9 days. On Day 7 of treatment, blood samples were collected from all horses to quantify phenylbutazone plasma concentrations 24 hours after the last dose (on Day 6). On Day 9 of treatment, horses underwent a complete OGT as previously described. 2 , 15 , 16 Briefly, an IV catheter was placed for repeated blood sampling and horses received 0.75 g/kg of dextrose dissolved in 2 L of warm water via nasogastric tube. Blood samples were collected at 0, 15, 30, 60, 90, 120, 180, and 240 minutes for the measurement of glucose and insulin concentrations. Horses did not receive hay the morning of the OGT and were not offered feed during the test. Horses underwent a 10‐day washout period and then received the alternative treatment, following the above protocol (Figure S1).
2.2. Animals
Horses were identified as ID or controls based on their insulin concentration during the OGT and insulin sensitivity index from a modified frequently sampled intravenous glucose tolerance test (mFSIGTT), 15 when receiving the placebo treatment. Horses classified with ID had both an insulin concentration >80 μIU/mL at 120 minutes during the OGT (hyperinsulinemic) and an insulin sensitivity index <1.0 × 10⁻⁴ L/mU/min from a mFSIGTTT (insulin resistant; carried out as part of a concurrent study), with control horses conversely having both an insulin concentration <80 μIU/mL and a sensitivity index >1.0 × 10⁻⁴ L/mU/min. 16 , 17 , 18 Among the 20 horses screened, 7 horses were identified as ID (being both hyperinsulinemic and insulin resistant) and 9 as controls (being neither hyperinsulinemic nor insulin resistant). Four horses were excluded because they did not meet both above criteria to be classified as ID or conversely as controls (Table 1; Table S2).
TABLE 1.
Details of control horses and horses with ID.
| Control horses (n = 9) | Horses with ID (n = 7) | P value | |
|---|---|---|---|
| Age (year) | 13 [10.5‐15.0] | 15 [11.0‐19.0] | .28 |
| Weight (kg) | 538.8 [497.0‐564.6] | 596.4 [524.8‐676.8] | .17 |
| BCS | 5 [5‐5] | 8 [7‐8] | <.0001 |
| CNS | 2 [2‐2] | 3 [3‐4] | <.0001 |
| OGT 120‐min Insulin (μIU/mL) | 16.40 [7.58‐22.35] | 291.0 [216.0‐369.0] | .0002 |
| Insulin sensitivity index (×10−4 L/mIU/min) | 5.04 [2.63‐6.67] | 0.39 [0.14‐0.74] | .0002 |
Note: Presented as median [interquartile range]; Mann‐Whitney test carried out between groups, P < .05 considered significant.
Abbreviations: BCS, body condition score; CNS, cresty neck score.
2.3. Assays
Glucose concentrations were analyzed using fresh blood samples stall‐side, with a hand‐held glucometer previously validated for use in horses (AlphaTRAK, Zoetis Australia). 19 The glucometer has an assay range of 1.1‐41.6 mmol/L. Samples for insulin concentration analysis were collected into serum tubes (BD Vacutainer, New South Wales, Australia), allowed to clot at room temperature, centrifuged at 1370g for 10 minutes and then serum was collected into microtubes and stored at −80°C until analysis. Insulin concentrations were measured using the Immulite 1000 (Siemens Healthineers, Victoria, Australia), an automated chemiluminescence assay previously validated for use in horses. 20 It has an assay range of 2‐300 μIU/mL. To dilute samples with insulin concentrations >300 μIU/mL, the specific Immulite 1000 sample diluent for insulin (Item no. 10387034, Siemens Healthineers, Victoria, Australia) was used in a 1:2 ratio (150 μL diluent and 150 μL sample).
To measure phenylbutazone concentrations, blood was collected into pre‐chilled lithium heparin tubes (BD Vacutainer), kept on ice until centrifuged at 1370g for 10 minutes, and then plasma was collected into microtubes and stored at −80°C until analysis. Samples were measured using liquid chromatography mass spectrometry (LC‐MS) at the Racing Analytical Services Limited Laboratory. Instrumentation was Shimadzu Nexera X2 and Thermo Scientific Q Exactive HF‐X, with samples run on an InfinityLab Poroshell 120 EC‐C18 3 × 50 mm, 2.7 μm LC column. Further details are provided in Data S1.
2.4. Data analysis
Data analysis was performed using GraphPad Prism (Version 9.5; GraphPad Software, LLC). A Shapiro‐Wilk test was used to evaluate data for normality of continuous variables. Normally distributed data are presented as mean ± SD and other data as median (range). Statistical significance was considered as P < .05. The effect of treatment and time (glucose administration) on glucose and insulin concentrations was determined by 2‐way repeated analysis of variance (ANOVA) in the control horses and in the horses with ID separately, with Tukey's honest significant difference post hoc test carried out as appropriate. Glucose and insulin areas under the curve (AUC) were calculated using the trapezoidal method, and comparisons between treatments made using paired t‐tests. Results are presented for complete OGT (0‐240 minutes) and for the diagnostic period of the OGT (0‐120 minutes, diagnostic OGT).
3. RESULTS
3.1. Phenylbutazone
All horses had plasma phenylbutazone concentrations within or above previously reported ranges, 24 hours after the last dose (0.23‐0.96 μg/mL). 21 No significant difference was found in phenylbutazone concentrations between control horses and horses with ID (0.99 ± 0.51 vs 0.71 ± 0.19 μg/mL, P = .19).
3.2. ID status
A significant effect of ID status on both the glucose and insulin concentrations was found (P = .0003 and P < .0001, respectively), which was expected with the inclusion criteria. Also, an effect of time (glucose administration) on glucose and insulin concentrations was found in both the horses with ID and the controls (P < .0001 and P = .0002 for the horses with ID, respectively; P < .0001 and P < .0001 for the control horses, respectively), which was expected as part of the OGT.
3.3. Glucose
A significant effect of phenylbutazone administration on glucose concentrations was found in horses with ID during the complete OGT (P = .02) as well as during the diagnostic OGT (P = .01; Figure 1) with a significantly lower glucose concentration detected at 90 minutes (11.27 ± 2.50 vs 14.13 ± 2.66 mmol/L, phenylbutazone vs placebo respectively, P = .02) and 120 minutes (11.36 ± 3.03 vs 13.59 ± 2.27 mmol/L, phenylbutazone vs placebo respectively, P = .03). The glucose AUC for horses with ID was significantly lower when they were receiving phenylbutazone compared to the placebo during both the complete OGT (2429 ± 501.5 vs 2847 ± 486.1 mmol/L × min, respectively, P = .02) and the diagnostic OGT (1198 ± 224.5 vs 1412 ± 182.6 mmol/L × min, respectively, P = .01; Figure 2).
FIGURE 1.
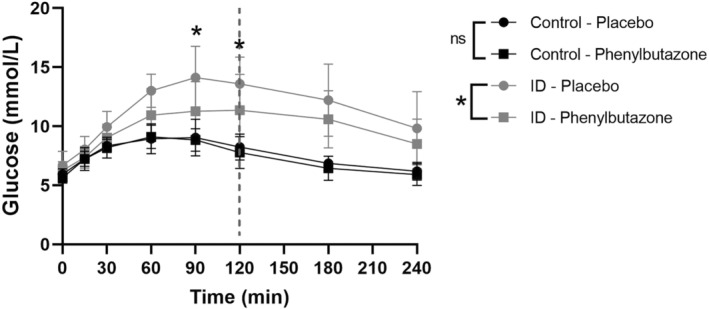
Blood glucose concentrations during the oral glucose test (OGT) for horses with insulin dysregulation (ID; gray circle for placebo and gray square for phenylbutazone) and control horses (black circle for placebo and black square for phenylbutazone). *P < .05 between phenylbutazone and placebo; ns, not significant; dotted line indicates the diagnostic OGT.
FIGURE 2.
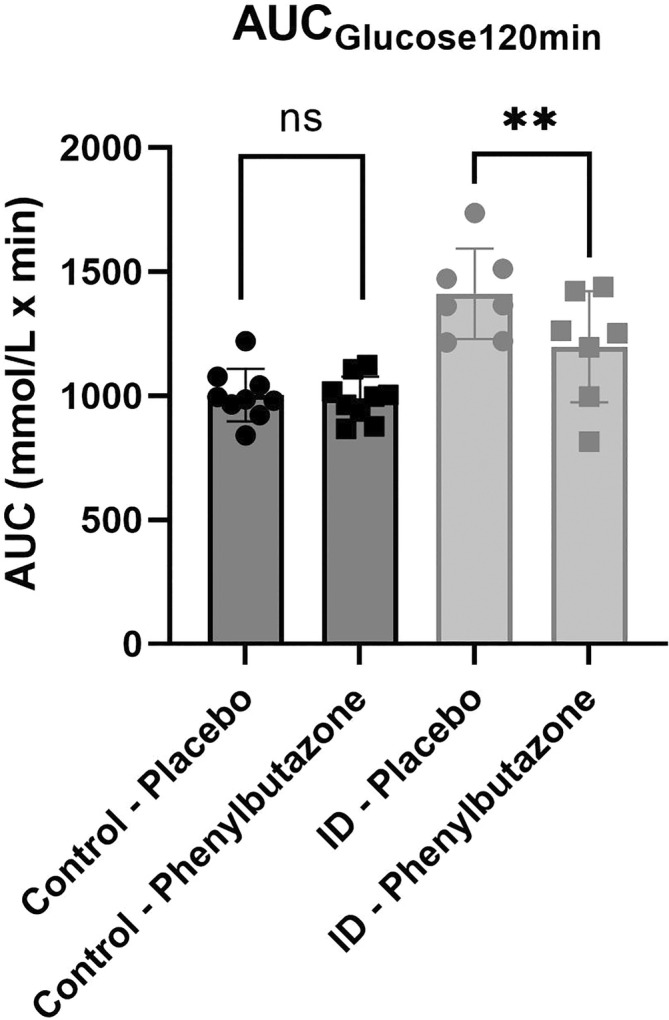
Blood glucose area under the curve (AUC) during the diagnostic (0‐120 minutes) oral glucose test (OGT), for horses with insulin dysregulation (ID; gray circle for placebo and gray square for phenylbutazone) and control horses (black circle for placebo and black square for phenylbutazone). **P < .01 between phenylbutazone and placebo; ns, not significant.
An effect of phenylbutazone administration on glucose concentrations was not detected in control horses in either the complete OGT (P = .42) or the diagnostic OGT (P = .60; Figure 1). No significant effect of treatment was detected in the glucose AUC during the complete OGT (1787 ± 144.4 vs 1848 ± 151.2 mmol/L × min, treatment vs placebo respectively, P = .34) or the diagnostic OGT (989.6 ± 88.63 vs 1003 ± 105.7 mmol/L × min, respectively, P = .75; Figure 2).
The maximum glucose concentration (Cmax) occurred by 120 minutes in all but 1 horse with ID on the placebo and a different horse with ID on phenylbutazone, both of which occurred at 180 minutes. The Cmax was significantly lower in horses with ID when receiving phenylbutazone compared to placebo (11.89 ± 2.51 vs 14.74 ± 2.06 mmol/L, respectively, P = .01; Figure 3) whereas this significant difference was not observed in control horses (9.36 ± .89 vs 9.33 ± 1.22).
FIGURE 3.
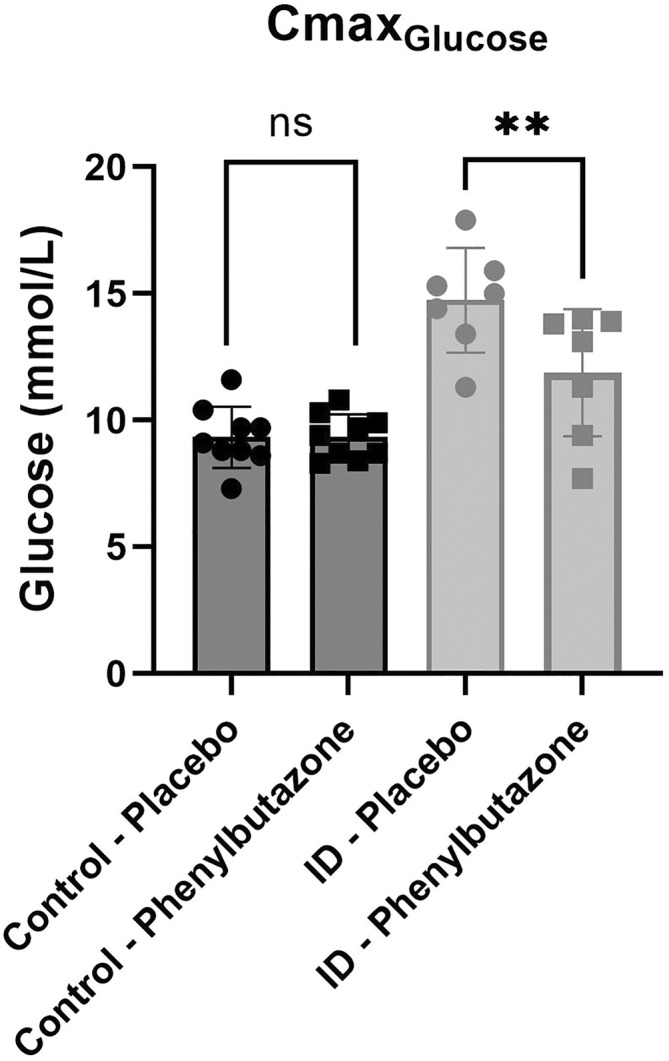
Maximum blood glucose concentrations (Cmax) during the oral glucose test (OGT) for horses with insulin dysregulation (ID; gray circle for placebo and gray square for phenylbutazone) and control horses (black circle for placebo and black square for phenylbutazone). **P < .01 between phenylbutazone and placebo; ns, not significant.
3.4. Insulin
A significant effect of phenylbutazone administration on insulin concentrations was found in horses with ID during the diagnostic OGT (P = .03; Figure 4), but this effect did not reach significance in the complete OGT (P = .07) and no time point reached significance with post hoc tests. The insulin AUC during the diagnostic OGT was significantly lower in horses with ID receiving phenylbutazone compared to placebo (17 710 ± 6676 vs 22 930 ± 8788 μIU/mL × min, respectively, P = .03; Figure 5), but this effect was not detected during the complete OGT (47 784 ± 22 170 vs 54 903 ± 18 119 μIU/mL × min, respectively, P = .19).
FIGURE 4.
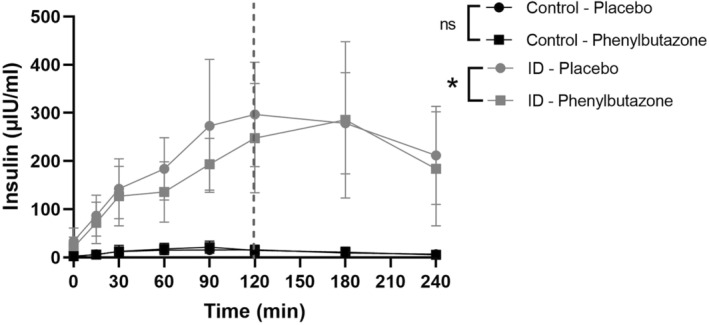
Serum insulin concentrations during the oral glucose test (OGT) of horses with insulin dysregulation (ID; gray circle for placebo and gray square for phenylbutazone) and control horses (black circle for placebo and black square for phenylbutazone). *P < .05 between phenylbutazone and placebo; ns, not significant; dotted line indicates diagnostic OGT.
FIGURE 5.
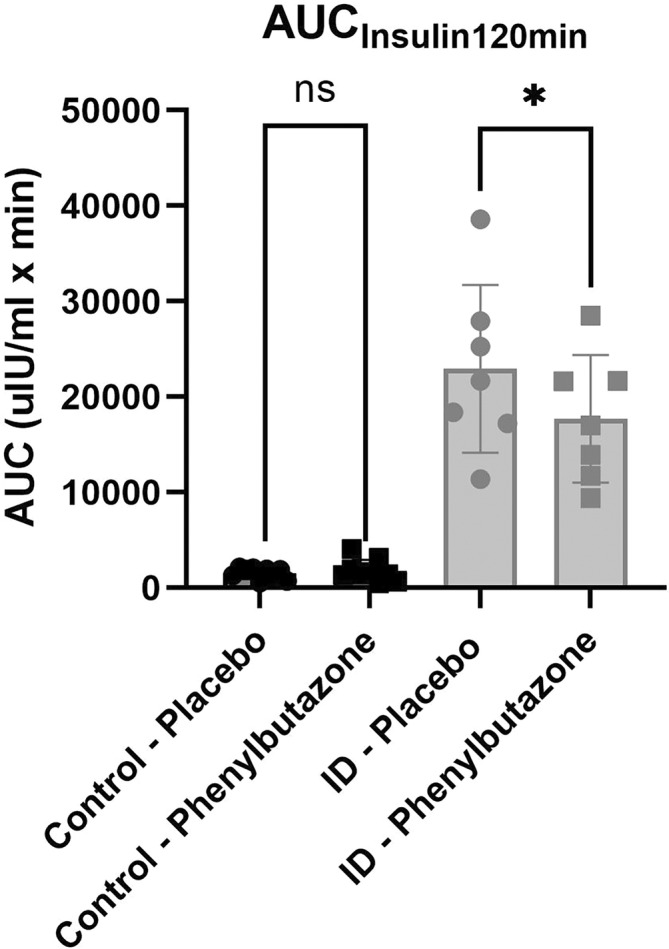
Serum insulin area under the curve (AUC) during the diagnostic (0‐120 minutes) oral glucose test (OGT), for horses with insulin dysregulation (ID; gray circle for placebo and gray square for phenylbutazone) and control horses (black circle for placebo and black square for phenylbutazone). *P < .05 between phenylbutazone and placebo; ns, not significant.
An effect of phenylbutazone administration on insulin concentrations was not detected in control horses in either the complete OGT (P = .55) or the diagnostic OGT (P = .56; Figure 4). No significant effect of treatment was detected on the insulin AUC during the complete OGT (3058 ± 2078 vs 2775 ± 1179 μIU/mL × min, respectively, P = .55) or the diagnostic OGT (1787 ± 1151 vs 1544 ± 594.1 μIU/mL × min, respectively, P = .48; Figure 5) in the control horses.
The Cmax for insulin occurred before 120 minutes for all of the control horses and between 90 and 180 minutes in the horses with ID. No significant effect of treatment on the insulin Cmax was identified in either the horses with ID (295.9 ± 148.1 vs 328.6 ± 114.9 μIU/mL, respectively, P = .32) or control horses (22.20 ± 12.17 vs 18.76 ± 7.47 μIU/mL, respectively, P = .29).
4. DISCUSSION
Our results show that horses with ID receiving phenylbutazone have decreased glucose and insulin responses to an OGT whereas no significant change was detected in control horses. This finding refutes our hypothesis and suggests that phenylbutazone acts in a unique fashion on the complex ID pathway in horses. To our knowledge this finding has not been reported previously.
The effect of phenylbutazone on glucose tolerance and insulin secretion has been described previously using an IV glucose tolerance test in healthy horses. 22 After 5 days of phenylbutazone treatment, baseline blood glucose concentrations were significantly lower, but no other significant differences in insulin glucose dynamics were detected. 22 The discrepancies between that study and ours could be explained by the fact that only healthy horses were used in the previous study and that study investigated IR, a different mechanism of ID.
Most of the research on the effect of NSAIDs on glucose insulin dynamics has been carried out in human patients with type‐2 diabetes or diabetic models in rodents. Meclofenamic acid (MFA) was investigated for its effect on ion channels in pancreatic beta cells. 11 It was found that MFA stimulated the pancreatic beta cells by inhibiting ATP channel activity, increasing insulin secretion. 11 As an in vitro study performed on mouse pancreatic cells, careful comparisons should be made with in vivo experiments performed on horses. In addition, that study was made in the context of hypoglycemia observed after NSAID administration because of increased insulin secretion. 11 Although in our study a decrease in glucose concentrations was observed, hypoglycemia was not detected and is much more uncommon in horses with ID than in human diabetic patients. This difference could be caused by different disease mechanisms: type‐2 diabetes is defined by persistent hyperglycemia, whereas ID is characterized by hyperinsulinemia.
It has been previously reported and was observed in our study, that horses with ID have increased glucose concentrations compared to normal horses. 2 It has been proposed that the gastrointestinal peptide glucagon‐like peptide 2 (GLP‐2) could be implicated because it has intestinotrophic effects increasing the epithelial area and has been reported to be increased in ponies with ID. 23 In our study, treatment with phenylbutazone decreased glucose concentrations in horses with ID, with no effect in control horses. Therefore, involvement of the GLP‐2 pathway might be possible and would require further investigation.
Incretins such as glucagon‐like peptide 1 (GLP‐1) and glucose‐dependent insulinotropic polypeptide (GIP) are increased in ponies with hyperinsulinemia and combined induce approximately 25% of insulin secretion (75% of insulin secretion being caused by changes blood glucose concentration). 2 Considering that PGE2 has an inhibitory effect on incretins, we assumed that inhibition of PGE2 would lead to an increase in insulin concentration, mediated by the role of incretins as reported in other species. 10 Furthermore, an increase in PGE2 concentrations has been reported in mice with experimentally induced type‐2 diabetes when fed a high‐fat diet, suggesting a link between PGE2 and insulin concentrations. Interestingly, in that study, when mice were treated with a NSAID, a decrease in PGE2 concentration along with a decrease in both insulin and glucose concentrations, was observed to an extent similar to our results. 24 Taken together, these results suggest a more complex association between PGE2 and insulin concentrations and brings into question the role of incretins in this association. This consideration is further supported by the effect of phenylbutazone treatment on glucose and insulin concentrations being more apparent during the diagnostic OGT than the complete OGT.
Insulin dysregulation in horses is comprised of both hyperinsulinemia and IR, which may occur individually or together, as a compensatory mechanism of each other. 1 Therefore, if phenylbutazone improved insulin sensitivity, it could decrease glucose concentrations by improving uptake into insulin‐sensitive cells and decrease insulin secretion in tissues requiring less stimulation to take up the glucose and decreased glucose‐induced pancreatic stimulation. Low‐grade inflammation has been associated with obesity and IR in horses, 25 , 26 as well as with diabetes and obesity in humans. 27 In a prediabetic rat model characterized by IR, treatment with salsalate improved glucose tolerance and insulin sensitivity and, in a mouse model, high‐fat diet‐induced insulin sensitivity was restored with treatment using valdecoxib. 28 , 29 Therefore, treatment with phenylbutazone might decrease glucose and insulin concentrations in horses with ID by acting on the relationship between inflammation and IR.
The main limitation of our study was the low number of horses. With only 7 horses with ID and 9 controls, caution should be taken when drawing conclusions. Also, there was a mixture of breed, age, sex, and insulin responses in the groups. Although this situation adds some variation, it also more closely reflects clinical environments. Our study also was conducted in non‐laminitic horses, and it is likely that, because of the presence of inflammatory mediators, phenylbutazone could alter glucose and insulin dynamics differently in horses with acute HAL. Measurement of those inflammatory markers would have strengthened our study, but was considered beyond the scope of our project and administration of placebo to actively laminitic horses was not considered ethical. Our study also ran over 2 years. Although this situation is not ideal, variables were controlled as much as possible, by undertaking each study in the months of November and December (summer in the southern hemisphere). Horses were kept in dirt yards to minimize the effect of pasture on insulin concentrations and were fed a controlled diet of lucerne hay. Horses were classified as having ID in our study if they had both hyperinsulinemia and IR. This classification might not reflect all horses with ID because it is possible to have 1 factor without the other. As a proof of principle, however, our study focused on more advanced and homogenous cases of ID, hence this classification. The repeatability of the OGT could be another limitation of our study, with a reported coefficient of variability of approximately 20%. 16 , 30 However, considering the repeatability of our results in the control group and the randomization, the observed effect was attributed to phenylbutazone rather than poor repeatability of the OGT. The concentrations of phenylbutazone in plasma were measured in the horses 24 hours after the previous dose to ensure sufficient concentrations to inhibit PGE2. Ideally, PGE2 concentrations would have been quantified, but doing so proved to be technically challenging and therefore is a limitation of this study.
Our study indicates that phenylbutazone administration decreases glucose and insulin responses to an OGT in horses with ID. This mechanism might be caused by modulation of incretin secretion leading to a decreased glucose uptake and insulin secretion or by an improvement in insulin sensitivity as a result of decreased subclinical inflammation. These results also suggest a possible therapeutic benefit of NSAIDs for ID in horses beyond pain management. Although long‐term NSAID use is not recommended because of associated risks to the gastrointestinal tract and kidneys, short‐term use does not appear detrimental. Our study warrants investigation of the mechanism of action of phenylbutazone on glucose and insulin dynamics and provides an area of possible investigation for future therapeutic options in horses with ID.
CONFLICT OF INTEREST DECLARATION
Authors declare no conflict of interest.
OFF‐LABEL ANTIMICROBIAL DECLARATION
Authors declare no off‐label use of antimicrobials.
INSTITUTIONAL ANIMAL CARE AND USE COMMITTEE (IACUC) OR OTHER APPROVAL DECLARATION
Approved by The University of Queensland IACUC, SVS/153/19.
HUMAN ETHICS APPROVAL DECLARATION
Authors declare human ethics approval was not needed for this study.
Supporting information
Table S1: Feed analysis (dry matter basis) of lucerne hay used in this study during both years. A sample from each batch of hay was taken for analysis at Feed Central, Toowoomba, Queensland, Australia.
Table S2: Details of the individual horses included in the study.
Figure S1: Flow diagram of study timeline.
Data S1: Shimadzu LC Method Parameters.
ACKNOWLEDGMENT
Funding provided by Morris Animal Foundation, grant ID: D19‐EQ‐302, The University of Queensland Graduate School Research Training Program (RTP) Scholarship and Destination Australia Scholarship. We acknowledge The University of Queensland's Equine Unit for support of the animal experiments, The University of Queensland's summer research students for assistance with animal experiments, and The University of Queensland Veterinary Laboratory Services for assistance with sample analysis. Open access publishing facilitated by The University of Queensland, as part of the Wiley ‐ The University of Queensland agreement via the Council of Australian University Librarians.
Kemp KL, Skinner JE, Bertin F‐R. Effect of phenylbutazone on insulin secretion in horses with insulin dysregulation. J Vet Intern Med. 2024;38(2):1177‐1184. doi: 10.1111/jvim.17013
REFERENCES
- 1. Frank N, Tadros EM. Insulin dysregulation. Equine Vet J. 2014;46:103‐112. [DOI] [PubMed] [Google Scholar]
- 2. de Laat MA, McGree J, Sillence M. Equine hyperinsulinemia: investigation of the enteroinsular axis during insulin dysregulation. Am J Physiol‐Endocrinol Metab. 2016;310:E61‐E72. [DOI] [PubMed] [Google Scholar]
- 3. de Laat MA, McGowan CM, Sillence MN, et al. Equine laminitis: induced by 48 h hyperinsulinaemia in Standardbred horses. Equine Vet J. 2010;42:129‐135. [DOI] [PubMed] [Google Scholar]
- 4. Stokes SM, Bertin FR, Stefanovski D, et al. Lamellar energy metabolism and perfusion in the euglycaemic hyperinsulinaemic clamp model of equine laminitis. Equine Vet J. 2020;52:577‐584. [DOI] [PubMed] [Google Scholar]
- 5. Hopster K, Driessen B. Pharmacology of the equine medical pain management for laminitis. Vet Clin North Am Equine Pract. 2021;37:549‐561. [DOI] [PubMed] [Google Scholar]
- 6. van Eps AW. Acute laminitis: medical and supportive therapy. Vet Clin North Am Equine Pract. 2010;26:103‐114. [DOI] [PubMed] [Google Scholar]
- 7. Soma LR, Uboh CE, Maylin GM. The use of phenylbutazone in the horse. J Vet Pharmacol Ther. 2012;35:1‐12. [DOI] [PubMed] [Google Scholar]
- 8. Beretta C, Garavaglia G, Cavalli M. COX‐1 and COX‐2 inhibition in horse blood by phenylbutazone, flunixin, carprofen and meloxicam: an in vitro analysis. Pharmacol Res. 2005;52:302‐306. [DOI] [PubMed] [Google Scholar]
- 9. Knych HK, Arthur RM, McKemie DS, et al. Phenylbutazone blood and urine concentrations, pharmacokinetics, and effects on biomarkers of inflammation in horses following intravenous and oral administration of clinical doses. Drug Test Anal. 2019;11:792‐803. [DOI] [PubMed] [Google Scholar]
- 10. Kimple ME, Keller MP, Rabaglia MR, et al. Prostaglandin E2 receptor, EP3, is induced in diabetic islets and negatively regulates glucose‐ and hormone‐stimulated insulin secretion. Diabetes. 2013;62:1904‐1912. [DOI] [PMC free article] [PubMed] [Google Scholar]
- 11. Li J, Zhang N, Ye B, et al. Non‐steroidal anti‐inflammatory drugs increase insulin release from beta cells by inhibiting ATP‐sensitive potassium channels: NSAIDs regulate insulin secretion. Br J Pharmacol. 2009;151:483‐493. [DOI] [PMC free article] [PubMed] [Google Scholar]
- 12. Bellucci PN, González Bagnes MF, Di Girolamo G, et al. Potential effects of nonsteroidal anti‐inflammatory drugs in the prevention and treatment of type 2 diabetes mellitus. J Pharm Pract. 2017;30:549‐556. [DOI] [PubMed] [Google Scholar]
- 13. Henneke DR, Potter GD, Kreider JL, et al. Relationship between condition score, physical measurements and body fat percentage in mares. Equine Vet J. 1983;15:371‐372. [DOI] [PubMed] [Google Scholar]
- 14. Carter RA, Geor RJ, Burton Staniar W, Cubitt TA, Harris PA. Apparent adiposity assessed by standardised scoring systems and morphometric measurements in horses and ponies. Vet J. 2009;179:204‐210. [DOI] [PubMed] [Google Scholar]
- 15. Pratt‐Phillips SE, Geor RJ, McCutcheon LJ. Comparison among the euglycemic‐hyperinsulinemic clamp, insulin‐modified frequently sampled intravenous glucose tolerance test, and oral glucose tolerance test for assessment of insulin sensitivity in healthy Standardbreds. Am J Vet Res. 2015;76:84‐91. [DOI] [PubMed] [Google Scholar]
- 16. de Laat MA, Sillence MN. The repeatability of an oral glucose test in ponies. Equine Vet J. 2017;49:238‐243. [DOI] [PubMed] [Google Scholar]
- 17. Burns TA, Geor RJ, Mudge MC, McCutcheon LJ, Hinchcliff KW, Belknap JK. Proinflammatory cytokine and chemokine gene expression profiles in subcutaneous and visceral adipose tissue depots of insulin‐resistant and insulin‐sensitive light breed horses. J Vet Intern Med. 2010;24:932‐939. [DOI] [PubMed] [Google Scholar]
- 18. Dunbar LK, Mielnicki KA, Dembek KA, Toribio RE, Burns TA. Evaluation of four diagnostic tests for insulin dysregulation in adult light‐breed horses. J Vet Intern Med. 2016;30:885‐891. [DOI] [PMC free article] [PubMed] [Google Scholar]
- 19. Hackett ES, McCue PM. Evaluation of a veterinary glucometer for use in horses. J Vet Intern Med. 2010;24:617‐621. [DOI] [PubMed] [Google Scholar]
- 20. Carslake H, Pinchbeck G, McGowan C. Evaluation of a chemiluminescent immunoassay for measurement of equine insulin. J Vet Intern Med. 2017;31:568‐574. [DOI] [PMC free article] [PubMed] [Google Scholar]
- 21. Chay S, Woods WE, Nugent TE, et al. Population distributions of phenylbutazone and oxyphenbutazone after oral and i.v. dosing in horses. J Vet Pharmacol Ther. 1984;7:265‐276. [DOI] [PubMed] [Google Scholar]
- 22. Zicker SC, Brumbaugh GW. Effects of phenylbutazone on glucose tolerance and on secretion of insulin in healthy geldings. Am J Vet Res. 1989;50:743‐746. [PubMed] [Google Scholar]
- 23. de Laat MA, Fitzgerald DM, Sillence MN, Spence RJ. Glucagon‐like peptide‐2: a potential role in equine insulin dysregulation. Equine Vet J. 2018;50:842‐847. [DOI] [PubMed] [Google Scholar]
- 24. Amiri L, John A, Shafarin J, et al. Enhanced glucose tolerance and pancreatic beta cell function by low dose aspirin in hyperglycemic insulin‐resistant type 2 diabetic Goto‐Kakizaki (GK) rats. Cell Physiol Biochem. 2015;36:1939‐1950. [DOI] [PubMed] [Google Scholar]
- 25. Vick MM, Murphy BA, Sessions DR, et al. Effects of systemic inflammation on insulin sensitivity in horses and inflammatory cytokine expression in adipose tissue. Am J Vet Res. 2008;69:130‐139. [DOI] [PubMed] [Google Scholar]
- 26. Suagee JK, Corl BA, Geor RJ. A potential role for pro‐inflammatory cytokines in the development of insulin resistance in horses. Animals. 2012;2:243‐260. [DOI] [PMC free article] [PubMed] [Google Scholar]
- 27. Rohm TV, Meier DT, Olefsky JM, Donath MY. Inflammation in obesity, diabetes, and related disorders. Immunity. 2022;55:31‐55. [DOI] [PMC free article] [PubMed] [Google Scholar]
- 28. Hüttl M, Markova I, Miklánková D, et al. Hypolipidemic and insulin sensitizing effects of salsalate beyond suppressing inflammation in a prediabetic rat model. Front Pharmacol. 2023;14:1117683. [DOI] [PMC free article] [PubMed] [Google Scholar]
- 29. Kim TJ, Lee HJ, Pyun DH, Abd el‐Aty AM, Jeong JH, Jung TW. Valdecoxib improves lipid‐induced skeletal muscle insulin resistance via simultaneous suppression of inflammation and endoplasmic reticulum stress. Biochem Pharmacol. 2021;188:114557. [DOI] [PubMed] [Google Scholar]
- 30. Bertin FR, de Laat MA. The diagnosis of equine insulin dysregulation. Equine Vet J. 2017;49:570‐576. [DOI] [PubMed] [Google Scholar]
Associated Data
This section collects any data citations, data availability statements, or supplementary materials included in this article.
Supplementary Materials
Table S1: Feed analysis (dry matter basis) of lucerne hay used in this study during both years. A sample from each batch of hay was taken for analysis at Feed Central, Toowoomba, Queensland, Australia.
Table S2: Details of the individual horses included in the study.
Figure S1: Flow diagram of study timeline.
Data S1: Shimadzu LC Method Parameters.