

This cohort study investigates the cardiovascular disease associations and genetic determinants of epicardial and pericardial adiposity.
Key Points
Question
What are the cardiovascular disease associations and genetic determinants of epicardial and pericardial adiposity?
Findings
In a cohort study of 44 725 participants, the quantity of epicardial and pericardial adipose tissue was associated with type 2 diabetes, heart failure, and coronary artery disease, but these associations were no longer significant after adjusting for abdominal visceral adipose tissue. Seven genetic loci for epicardial and pericardial adipose tissue implicated genes influencing adipocyte morphology, brownlike adipose tissue differentiation, and abdominal adiposity.
Meaning
Although local or paracrine effects have been suggested, epicardial and pericardial adiposity may signify a metabolically unhealthy adiposity phenotype comparable with abdominal visceral adiposity.
Abstract
Importance
Epicardial and pericardial adipose tissue (EPAT) has been associated with cardiovascular diseases such as atrial fibrillation or flutter (AF) and coronary artery disease (CAD), but studies have been limited in sample size or drawn from selected populations. It has been suggested that the association between EPAT and cardiovascular disease could be mediated by local or paracrine effects.
Objective
To evaluate the association of EPAT with prevalent and incident cardiovascular disease and to elucidate the genetic basis of EPAT in a large population cohort.
Design, Setting, and Participants
A deep learning model was trained to quantify EPAT area from 4-chamber magnetic resonance images using semantic segmentation. Cross-sectional and prospective cardiovascular disease associations were evaluated, controlling for sex and age. Prospective associations were additionally controlled for abdominal visceral adipose tissue (VAT) volumes. A genome-wide association study was performed, and a polygenic score (PGS) for EPAT was examined in independent FinnGen cohort study participants. Data analyses were conducted from March 2022 to December 2023.
Exposures
The primary exposures were magnetic resonance imaging–derived continuous measurements of epicardial and pericardial adipose tissue area and visceral adipose tissue volume.
Main Outcomes and Measures
Prevalent and incident CAD, AF, heart failure (HF), stroke, and type 2 diabetes (T2D).
Results
After exclusions, this study included 44 475 participants (mean [SD] age, 64.1 [7.7] years; 22 972 female [51.7%]) from the UK Biobank. Cross-sectional and prospective cardiovascular disease associations were evaluated for a mean (SD) of 3.2 (1.5) years of follow-up. Prospective associations were additionally controlled for abdominal VAT volumes for 38 527 participants. A PGS for EPAT was examined in 453 733 independent FinnGen cohort study participants. EPAT was positively associated with male sex (β = +0.78 SD in EPAT; P < 3 × 10−324), age (Pearson r = 0.15; P = 9.3 × 10−229), body mass index (Pearson r = 0.47; P < 3 × 10−324), and VAT (Pearson r = 0.72; P < 3 × 10−324). EPAT was more elevated in prevalent HF (β = +0.46 SD units) and T2D (β = +0.56) than in CAD (β = +0.23) or AF (β = +0.18). EPAT was associated with incident HF (hazard ratio [HR], 1.29 per +1 SD in EPAT; 95% CI, 1.17-1.43), T2D (HR, 1.63; 95% CI, 1.51-1.76), and CAD (HR, 1.19; 95% CI, 1.11-1.28). However, the associations were no longer significant when controlling for VAT. Seven genetic loci were identified for EPAT, implicating transcriptional regulators of adipocyte morphology and brown adipogenesis (EBF1, EBF2, and CEBPA) and regulators of visceral adiposity (WARS2 and TRIB2). The EPAT PGS was associated with T2D (odds ratio [OR], 1.06; 95% CI, 1.05-1.07; P =3.6 × 10−44), HF (OR, 1.05; 95% CI, 1.04-1.06; P =4.8 × 10⁻¹⁵), CAD (OR, 1.04; 95% CI, 1.03-1.05; P =1.4 × 10⁻¹⁷), AF (OR, 1.04; 95% CI, 1.03-1.06; P =7.6 × 10⁻¹²), and stroke in FinnGen (OR, 1.02; 95% CI, 1.01-1.03; P =3.5 × 10⁻³) per 1 SD in PGS.
Conclusions and Relevance
Results of this cohort study suggest that epicardial and pericardial adiposity was associated with incident cardiovascular diseases, but this may largely reflect a metabolically unhealthy adiposity phenotype similar to abdominal visceral adiposity.
Introduction
The increased global burden of obesity as a leading cause and modifiable risk factor for cardiovascular diseases is well recognized.1 Not all obesity is alike, however, and the distribution of adipose tissue may be as important as its quantity. Abdominal adiposity, in particular, is associated with higher cardiovascular disease risk than subcutaneous adiposity.1,2 Similarly, ectopic fat storage surrounding the heart has been suggested to confer independent cardiovascular risk.1
The combination of epicardial and pericardial adipose tissue (EPAT) comprises 2 adjacent adipose tissue compartments: epicardial adipose tissue (EAT) between the visceral pericardium and myocardium and pericardial adipose tissue (PAT) external to the parietal pericardium.3 In addition to the ectopic location of EPAT within the thoracic cavity, the vascular supply of EAT derives from branches of the coronary arteries similarly to the myocardium, which is in immediate proximity to EAT with no separating fascia.4 EAT displays features of brownlike or beige adipose tissue and has been hypothesized to have a cardioprotective role via thermogeneration and supply of free fatty acids.5 However, multiple studies have suggested that EAT might promote disease via the secretion of proinflammatory and profibrotic mediators.6
To date, more than 30 studies have reported relationships between total EPAT, PAT, or EAT and a range of cardiovascular outcomes.7,8,9,10,11 Meta-analyses have also demonstrated associations of EAT or PAT with myocardial infarction, coronary revascularization, atrial fibrillation, and cardiac death.11 However, these studies have been limited in sample size and clinically heterogeneous as participants have often been drawn from selected populations such as patients undergoing surgery or treatment for acute coronary syndromes.
The UK Biobank (UKB) is a large and deeply phenotyped population cohort with an ongoing cardiac magnetic resonance (CMR) imaging substudy.12,13 Coupled with advances in deep learning–based annotation methods, this data set enables the assessment of cardiovascular traits such as EPAT and abdominal visceral adipose tissue (VAT) at scale. Genotyping of UKB participants allows for the simultaneous evaluation of the heritable determinants of EPAT in a sample that is many times larger than previous cohorts.
In this study, we quantified EPAT in 44 725 UKB participants by using a deep learning model. We first assess the cross-sectional and prospective disease associations of EPAT with and without adjustment for body mass index (BMI). We then evaluate the genetic determinants of EPAT in UKB and the independent FinnGen study. Finally, we compare the incident disease associations of EPAT and VAT.
Methods
Study Design
We included participants from UKB and the FinnGen study. Primary analyses examining EPAT quantity were conducted in UKB, and secondary analyses examining a polygenic score (PGS) for EPAT were conducted in FinnGen. This study was approved by the Mass General Brigham institutional review board and followed the Strengthening the Reporting of Observational Studies in Epidemiology (STROBE) reporting guidelines.
UKB is a deeply phenotyped, prospective, population-level cohort that recruited approximately 500 000 participants aged 40 to 69 years in the UK between 2006 and 2010.12,13 A subset of participants within an imaging substudy underwent CMR with 1.5-Tesla scanners (Magnetom Aera [Siemens Healthcare]). Participants self-identified with the following race and ethnicity categories as defined by UKB: Asian or Asian British, Black or Black British, Chinese, multiethnic, White, or other ethnic group (no further details available on the composition of the other ethnic group). Data for different ethnic groups were assessed to inform the generalizability of epidemiological and genetic findings. Informed written consent was obtained from all study participants.
FinnGen is a collection of prospective Finnish epidemiological and disease-based cohorts and hospital biobank samples linked to electronic health records.14
Semantic Segmentation of EPAT
Four-chamber images at random parts of the cardiac cycle from 250 randomly selected participants from the UKB CMR substudy participants were manually annotated by a physician (J.T.R.). Segmentation maps were traced for the combined area of EPAT and adjacent mediastinal structures including the cardiac chambers (eMethods in Supplement 1). A total of 160 images were used for training, 40 images for validation, and 50 images kept in a holdout test set. A UNet-based (University of Freiburg) deep learning model from the fastai library, version 2.7.11, was constructed in PyTorch (Meta AI), version 1.13.1, using a ResNet50 encoder (Microsoft).15,16 The fine-tuned model was used to infer segmentation of the combined area of EPAT in the test set and all remaining UKB participants. Training parameters are detailed in the eMethods in Supplement 1.
We performed additional quality control for the EPAT segmentations including exclusion of misaligned or poor-quality slices, comparison of systolic and diastolic segmentations, and manual review of 1000 segmentations as detailed in the eMethods and eResults in Supplement 1 and eTable 1 in Supplement 2.
For a subset of 38 527 participants with EPAT segmentations, VAT volumes have also been previously quantified from 2-dimensional body magnetic resonance imaging (MRI) projections as described.2
Epidemiologic Analyses
In UKB, the following cardiovascular diseases were defined using a combination of International Statistical Classification of Diseases and Related Health Problems, Ninth (ICD-9) and Tenth Revision (ICD-10) codes, self-report, and procedure codes (eTable 2 in Supplement 2): atrial fibrillation of flutter (AF), coronary artery disease (CAD), heart failure (HF), stroke, and type 2 diabetes (T2D). The associations of prevalent cardiovascular diseases with EPAT were tested using linear regression models including EPAT as the outcome and age and sex as covariates. The associations of EPAT with incident diseases were tested using Cox proportional hazards models with time from imaging to diagnosis or censoring as the outcome and EPAT (SD scaled or percentile stratified), sex, and age as the predictors. Subsequent models included BMI or VAT as additional predictors. Participants with the corresponding disease at the time of imaging were excluded from incident disease analyses. Follow-up time was censored on September 30, 2021.
In FinnGen, cardiovascular diseases were ascertained using a combination of ICD-8, ICD-9, and ICD-10 codes from specialist inpatient, outpatient and cause-of-death registries, procedure codes, and medication reimbursement codes (eMethods in Supplement 1).
Genome-Wide Association Studies
We performed a genome-wide association study (GWAS) for EPAT using the additive genetic model implemented in regenie, version 3.2.5.17 In addition to EPAT, we performed new GWAS for height, weight, BMI, waist-hip ratio (WHR), and VAT in the CMR substudy participants to ensure comparability for genomic correlation analyses.
Statistical Analyses
Based on summary statistics from the custom GWAS in the UKB imaging substudy, using LD Score Regression with HapMap3 variants (HapMap3 is the third release of data from genome-wide single-nucleotide variant genotyping and targeted sequencing of DNA samples from diverse human populations as part of the International HapMap Project) and a European ancestry reference panel,18 we calculated single-nucleotide variant–based heritability for EPAT and genetic correlations between EPAT and other adiposity-related measurements.
We estimated PGS weights for EPAT using the PRS-CS tool, which infers posterior effect sizes for polygenic risk scores (PRS) under continuous shrinkage (CS) priors, in ‘auto’ mode, based on a publicly available UKB European ancestry linkage disequilibrium panel and 1 117 404 HapMap3 variants.19 PGSs were computed for all individuals in the FinnGen study. The associations of the EPAT PGS with cardiovascular diseases were evaluated using logistic regression models with sex, age at the end of study follow-up or death, genomic principal components 1 to 5, and the genotyping array as basic covariates. BMI was included as an additional covariate in adjusted models.
Variant positions were lifted over from the GRCh37 build to the GRCh38 build for polygenic scoring in FinnGen using the UCSC LiftOver tool (University of California, Santa Cruz).20 All statistical analyses not otherwise specified were carried out in R, version 4.3.0 for UKB and R, version 4.3.2 for FinnGen (R Project for Statistical Computing).21 Statistical significance was set at a 2-sided P value < 5 × 10⁻⁸ for the GWAS and at a 2-sided P value < .05 for all other analyses. Data were analyzed from March 2022 to December 2023.
Results
Semantic Segmentation of EPAT With Deep Learning
We quantified EPAT in 44 725 UKB participants by using a deep learning model (eFigure 1 in Supplement 1). We began by manually annotating EPAT in 200 four-chamber CMR images from randomly selected UKB participants at random phases of the cardiac cycle (Figure 1). We then fine-tuned a deep-learning model based on ResNet50 to annotate EPAT in the remaining participants. In a heldout test set of 50 individuals, the model achieved a Dice score of 0.80 compared with a human annotator, similar to a recently reported model based on UKB CMR data.22 We further excluded 788 participants whose 4-chamber images were not predicted to show at least 5 cm2 of each cardiac chamber as a quality control step to remove misaligned or poor-quality images (eMethods and eFigure 1 in Supplement 1). The area of EPAT (in cm2) was computed in all remaining 44 475 participants. In a manual review of resulting segmentations for 1000 participants, we observed a 1.3% major error rate (oversegmentation or undersegmentation by ≥50% of true area) and a 1.8% minor error rate for a low total error rate of 3.1%.
Figure 1. Annotation of Epicardial and Pericardial Adipose Tissue Area From 4-Chamber Cardiac Magnetic Resonance (CMR) Images.

The combined area of epicardial and pericardial adipose tissue (shaded in yellow) was quantified with deep learning in 44 475 UK Biobank participants. Four-chamber images at random parts of the cardiac cycle from 200 randomly selected participants of the UK Biobank CMR imaging substudy were first manually annotated (middle image). A U-Net–based (University of Freiburg) deep learning model was then constructed using a ResNet50 (Microsoft) encoder and fine-tuned model based on the manual annotations. The resulting model was used to infer segmentation of the combined area of epicardial and pericardial adipose tissue in all remaining images. Magnetic resonance images are reproduced by kind permission of UK Biobank.
Associations of EPAT With Demographic Characteristics and Anthropometric Measures
In the study sample of 44 475 individuals, mean (SD) age was 64.1 (7.7) years, 22 972 were female (51.7%), and 21 503 were male (48.3%) (eTable 3 in Supplement 2). Participants self-identified with the following race and ethnicity categories: 482 Asian or Asian British (1.1%), 301 Black or Black British (0.7%), 129 Chinese (0.3%), 204 multiethnic (0.5%), 43 014 White (96.7%), and 226 other ethnic group (0.5%). Participant characteristics by self-reported ethnic background are reported in eTable 4 in Supplement 2. Men had, on average, more EPAT compared with women (+0.78 SD units, P < 3 × 10−324) (eFigure 2 in Supplement 1). Older age was also associated with increased EPAT (Pearson r = 0.15; P = 9.3 × 10−229).
We observed moderate correlations with traditional anthropometric measures suggesting that EPAT may convey additional information: EPAT was associated with height (Pearson r = 0.31), weight (Pearson r = 0.57), BMI (Pearson r = 0.47), and WHR (Pearson r = 0.55; P < 3 × 10−324 for all). Simple linear estimates based on WHR tended to underestimate EPAT particularly in participants with high WHR.
Prevalent Cardiovascular Diseases and EPAT
We evaluated the associations of EPAT with 5 prevalent cardiovascular diseases at the time of imaging (Figure 2 and eTable 5 in Supplement 2). EPAT areas were significantly greater in individuals with prevalent T2D (+0.56 SD units in EPAT; P = 6.9 × 10−133), HF (+0.46 SD; P = 7.0 × 10⁻¹⁹), CAD (+0.23 SD; P = 5.2 × 10⁻³⁰), and AF (+0.18 SD; P = 1.2 × 10⁻¹²) but not in individuals with prevalent stroke (+0.09 SD; P = .08).
Figure 2. Associations of Epicardial and Pericardial Adipose Tissue (EPAT) With Prevalent and Incident Cardiovascular Diseases.
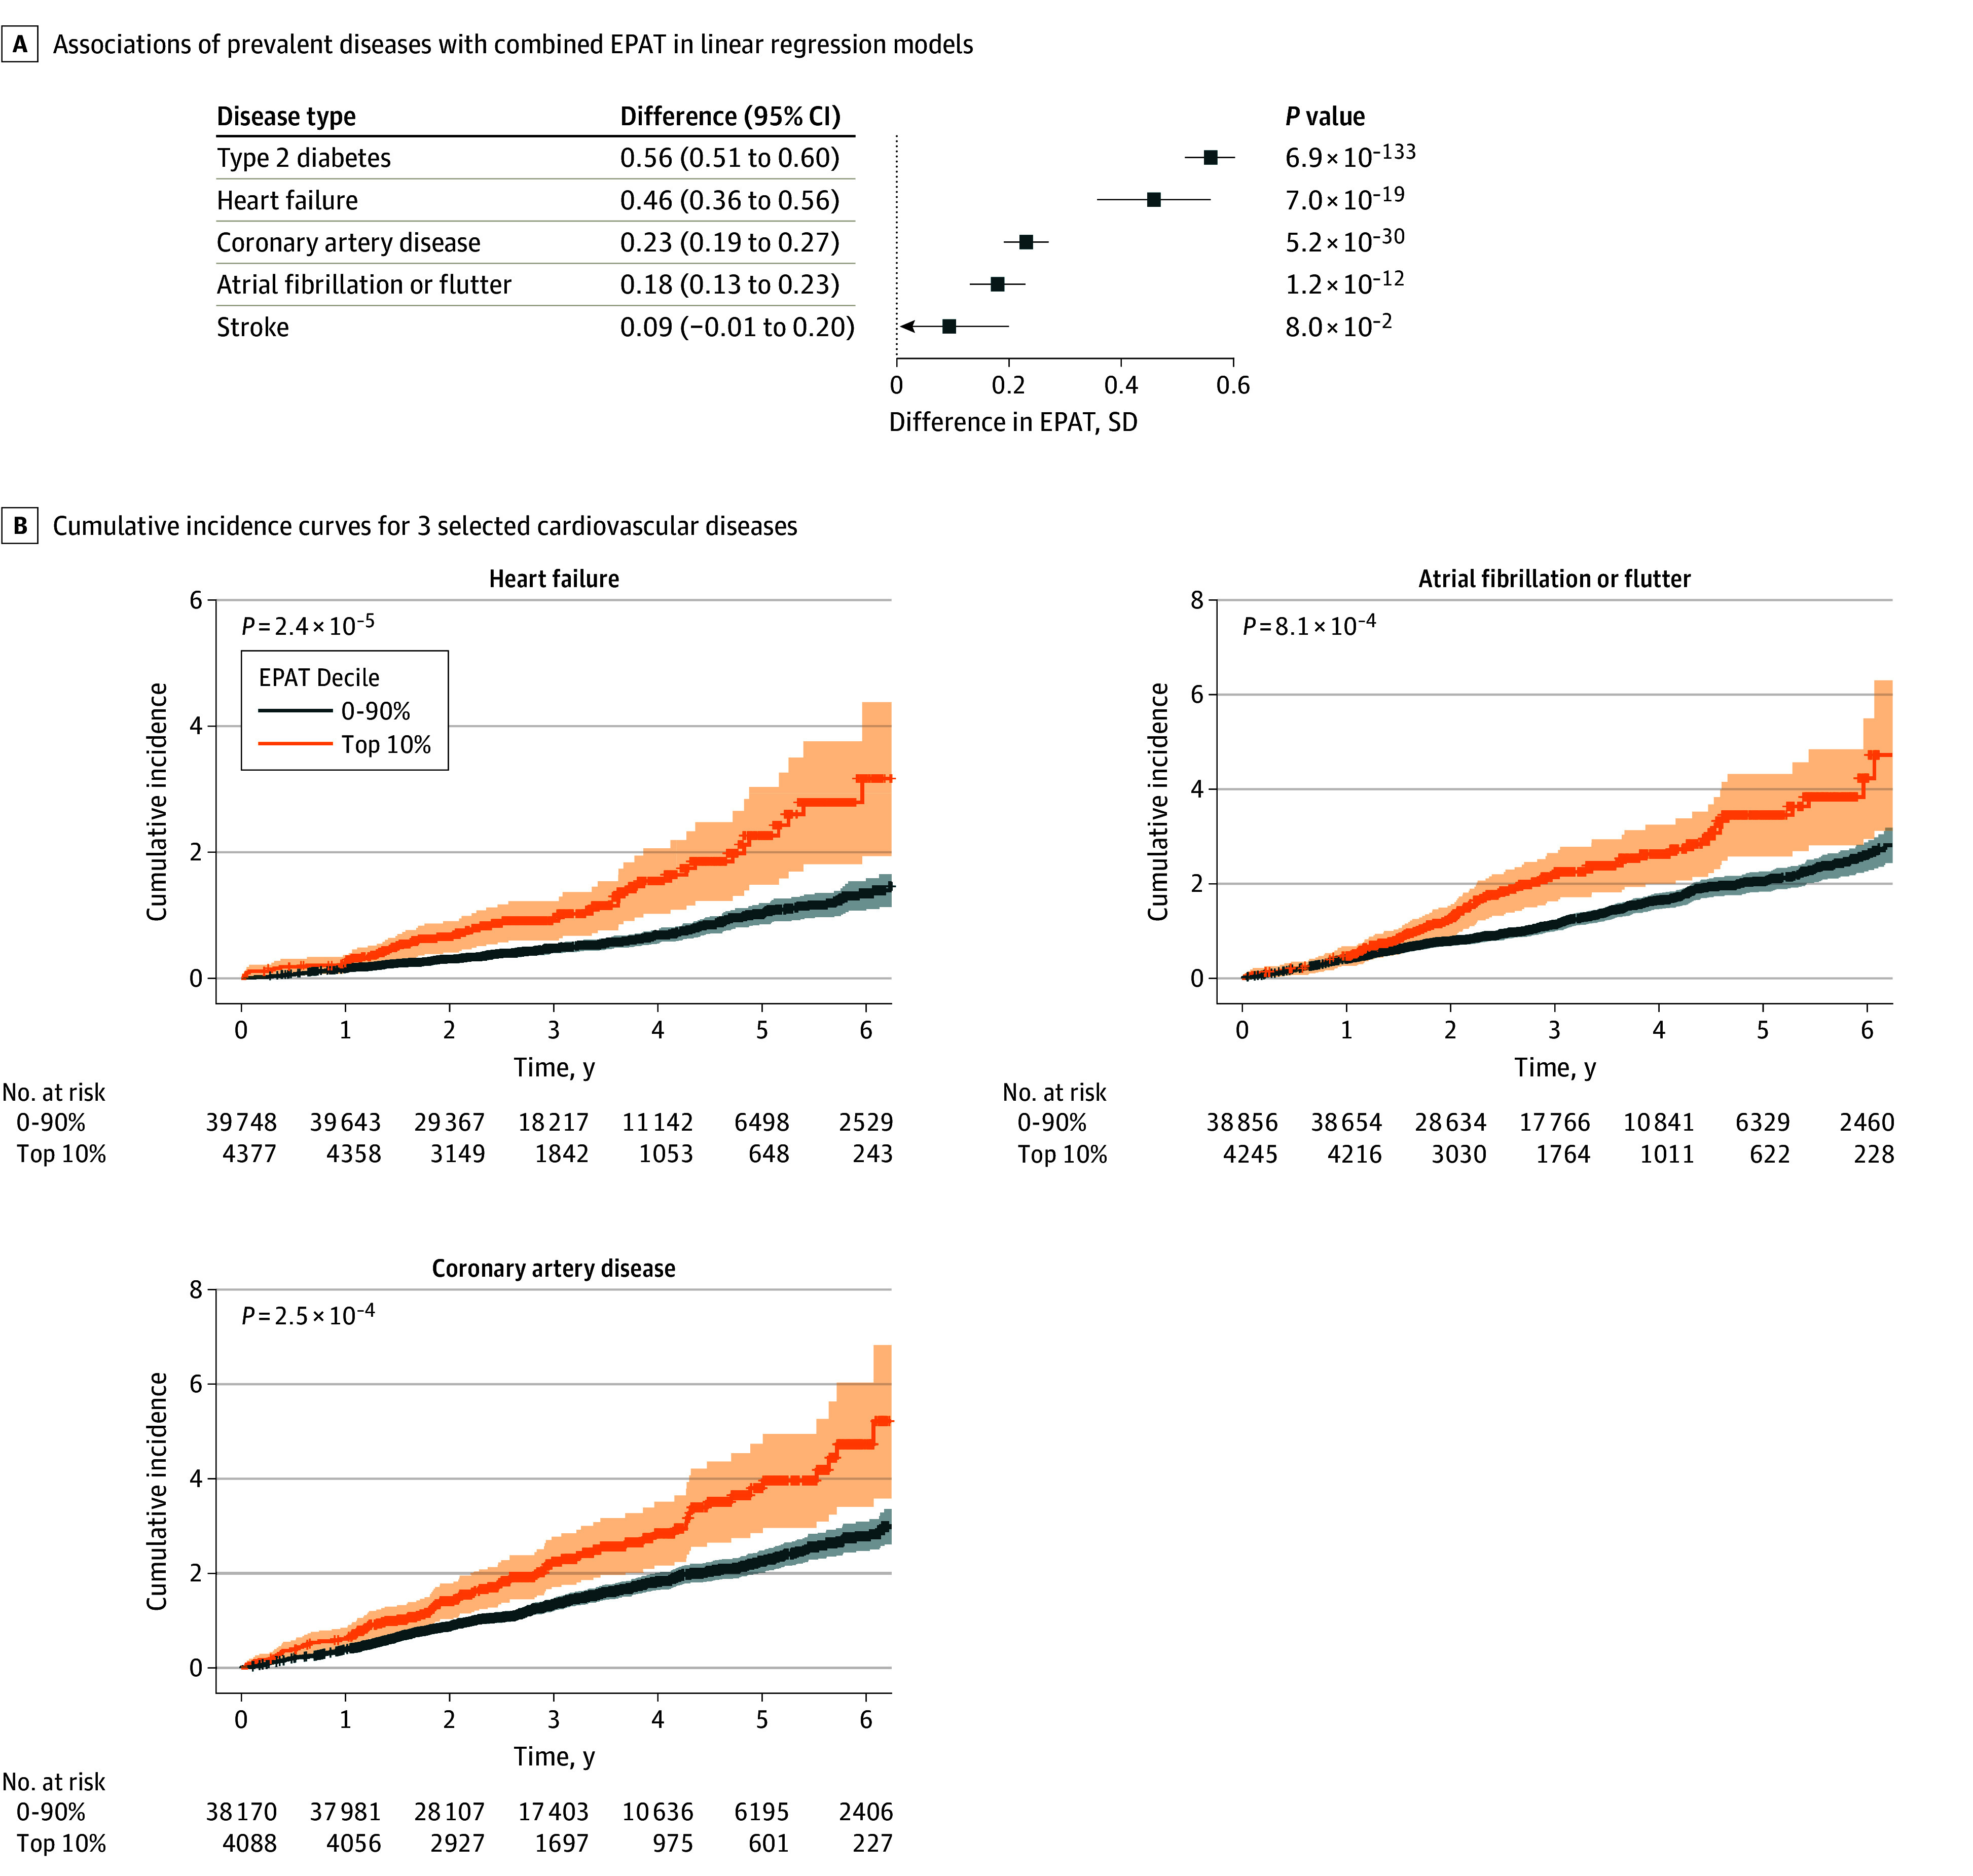
A, The associations of prevalent diseases with the combined area of EPAT were examined with linear regression models, including the respective disease, age, and sex, as predictors and EPAT as the outcome. Each bar corresponds to the difference in EPAT (in SD units) between those with prevalent disease and those without. Error bars correspond to positive 95% CIs. B, Cumulative incidence curves for 3 selected cardiovascular diseases are shown for participants stratified by EPAT deciles at the time of imaging (top 10% vs others). The shaded areas correspond to 95% CIs. Individuals with the corresponding disease at the time of imaging were excluded from the incident disease analyses. P values were estimated using Cox proportional hazards models with age and sex as covariates.
Associations of EPAT With Incident Cardiovascular Diseases
Prospective cardiovascular disease associations were evaluated for a mean (SD) of 3.2 (1.5) years of follow-up. In survival analyses, after excluding participants with prevalent diseases at the time of imaging, EPAT as a continuous measurement was associated with incident T2D (hazard ratio [HR], 1.63 per +1 SD increment in EPAT; 95% CI, 1.51-1.76; P = 7.2 × 10−36), HF (HR, 1.29; 95% CI, 1.17-1.43; P = 4.8 × 10⁻⁷), CAD (HR, 1.19; 95% CI, 1.11-1.28; P = 1.2 × 10⁻⁶), and AF (HR, 1.17; 95% CI, 1.08-1.26; P = 4.6 × 10⁻⁵) (eFigure 3 in Supplement 1 and eTable 6 in Supplement 2). We did not observe significant associations between EPAT and incident stroke (HR, 1.12; 95% CI, 0.99-1.27; P = .06). When including BMI as an additional covariate, EPAT remained associated with incident T2D (HR, 1.25; 95% CI, 1.14-1.38; P = 1.6 × 10⁻⁶), HF (HR, 1.16; 95% CI, 1.03-1.31; P = .01), and CAD (HR, 1.12; 95% CI, 1.03-1.22; P = 7.2 × 10⁻³) (eFigure 3 in Supplement 1). The results were also robust when relevant medication groups were included as covariates (eTable 7 in Supplement 2).
Recapitulating the patterns in analyses of EPAT as a continuous measurement, in analyses stratified by EPAT decile (Figure 2, eFigures 4-5 in Supplement 1, and eTable 8 in Supplement 2), those in the highest 10% vs those in lowest 0% to 90% of EPAT had significantly elevated risk of incident T2D (HR, 3.14; 95% CI, 2.50-3.95; P = 1.5 × 10⁻²²), HF (HR, 1.91; 95% CI, 1.41-2.57; P = 2.4 × 10⁻⁵), CAD (HR, 1.50; 95% CI, 1.21-1.87; P = 2.5 × 10⁻³), and AF (HR, 1.47; 95% CI, 1.17-1.84; P = 8.1 × 10⁻⁴) but no significant elevation in the risk of stroke (HR, 1.22; 95% CI, 0.83-1.78; P = .31). Only the associations with incident T2D and HF remained significant when adjusted for BMI (eTable 8 in Supplement 2).
GWAS of EPAT
We performed a GWAS of EPAT in 41 494 UKB participants who passed genotyping quality control and identified 7 loci at genome-wide significance (P < 5 × 10⁻⁸) (Figure 3, eResults and eFigure 7 in Supplement 1, and eTable 9 in Supplement 2). These included the 2 previously reported loci for EPAT (with lead variants in or near TRIB2 and EBF1) and 5 novel EPAT loci (eFigure 6 in Supplement 1). The single-nucleotide variant–based heritability of EPAT on the observed scale was 0.15 (SE = 0.02).
Figure 3. Manhattan Plot of the Genome-Wide Association Study of Epicardial and Pericardial Adipose Tissue in UK Biobank.

A genome-wide association study of the combined area of epicardial and pericardial adipose tissue was performed in 41 494 UK Biobank participants. Each variant is plotted as a data point, with the corresponding −log10(P) shown on the y-axis and the genomic position shown on the x-axis grouped by chromosomes. The genome-wide significance threshold (P = 5 × 10⁻⁸) is shown with a darker dashed line and a suggestive threshold (P = 1 × 10⁻⁵) is shown with a lighter dashed line. Genomic loci with at least 1 variant reaching genome-wide significance are labeled with the name of the nearest gene, and all variants within 500 kilobases of the lead variant are colored in a darker blue for visualization purposes. The y-axis is truncated to only show variants with a P value ≤.1.
We used the nearest protein-coding gene and Polygenic Priority Score (PoPS) approaches to prioritize likely causal genes in the 7 association loci.23 The genes WARS2, TRIB2, RBM6, MIER3, EBF1, EBF2, and CEBPA were most strongly prioritized by PoPS in their respective loci (eTable 10 in Supplement 2). The nearest-gene approach and PoPS were concordant for WARS2, TRIB2, and EBF1.
Recapitulating correlations between measured EPAT and many anthropometric variables, we also observed moderate genetic correlations between EPAT and weight (genetic correlation = 0.48; SE = 0.04; P = 5.9 × 10⁻³⁰), BMI (genetic correlation = 0.50; SE = 0.04; P = 4.3 × 10⁻³⁰), and WHR (genetic correlation = 0.60; SE = 0.05; P = 2.7 × 10⁻³⁰) (eTable 11 in Supplement 2). In contrast, EPAT was not genetically correlated with measured height (genetic correlation = 0.05; P = .31).
We conducted additional sensitivity analyses to identify genetic loci associated with EPAT segmented in cardiac systole and diastole (eMethods in Supplement 1). We also conducted GWAS after removing the top 5% of EPAT values. These analyses showed similar genetic architecture compared with the primary GWAS (eResults and eFigure 11 in Supplement 1).
To include all available data, we conducted a meta-analysis of EPAT together with a previous meta-analysis of up to 12 204 participants and identified 1 additional locus (CYP26B1) (eResults and eFigures 8-9 in Supplement 1 and eTable 12 in Supplement 2).24
Disease Associations of a PGS for EPAT
We constructed a genome-wide PGS for EPAT based on the summary statistics from the UKB GWAS. We subsequently evaluated the disease associations of the EPAT PGS in 453 733 participants of genetically inferred Finnish ancestry from Data Freeze 11 of the independent FinnGen study (eFigure 1 in Supplement 1 and eTable 13 in Supplement 2).14 In logistic regressions, the EPAT PGS was significantly associated with T2D (odds ratio [OR], 1.06; 95% CI, 1.05-1.07; P =3.6 × 10−44), HF (OR, 1.05; 95% CI, 1.04-1.06; P =4.8 × 10⁻¹⁵), CAD (OR, 1.04; 95% CI, 1.03-1.05; P =1.4 × 10⁻¹⁷), AF (OR, 1.04; 95% CI, 1.03-1.06; P =7.6 × 10⁻¹²), and stroke in FinnGen (OR, 1.02; 95% CI, 1.01-1.03; P =3.5 × 10⁻³) per 1 SD in PGS (Figure 4A and eTable 14 in Supplement 2). These positive associations remained significant even when including BMI as an additional covariate. In BMI-adjusted analyses, the EPAG PGS was associated with T2D (OR, 1.02; 95% CI, 1.01-1.03; P = 7.0 × 10⁻⁶), HF (OR, 1.03; 95% CI, 1.02-1.05; P = 1.1 × 10⁻⁶), CAD (OR, 1.03; 95% CI, 1.02-1.04; P = 1.7 × 10⁻¹⁰), AF (OR, 1.02; 95% CI, 1.01-1.04; P = .006), and stroke (OR, 1.02; 95% CI, 1.01-1.03; P = .005) (Figure 4B and eTable 14 in Supplement 2).
Figure 4. Associations of a Polygenic Score for Epicardial and Pericardial Adipose Tissue (EPAT) With Cardiovascular Diseases in FinnGen.
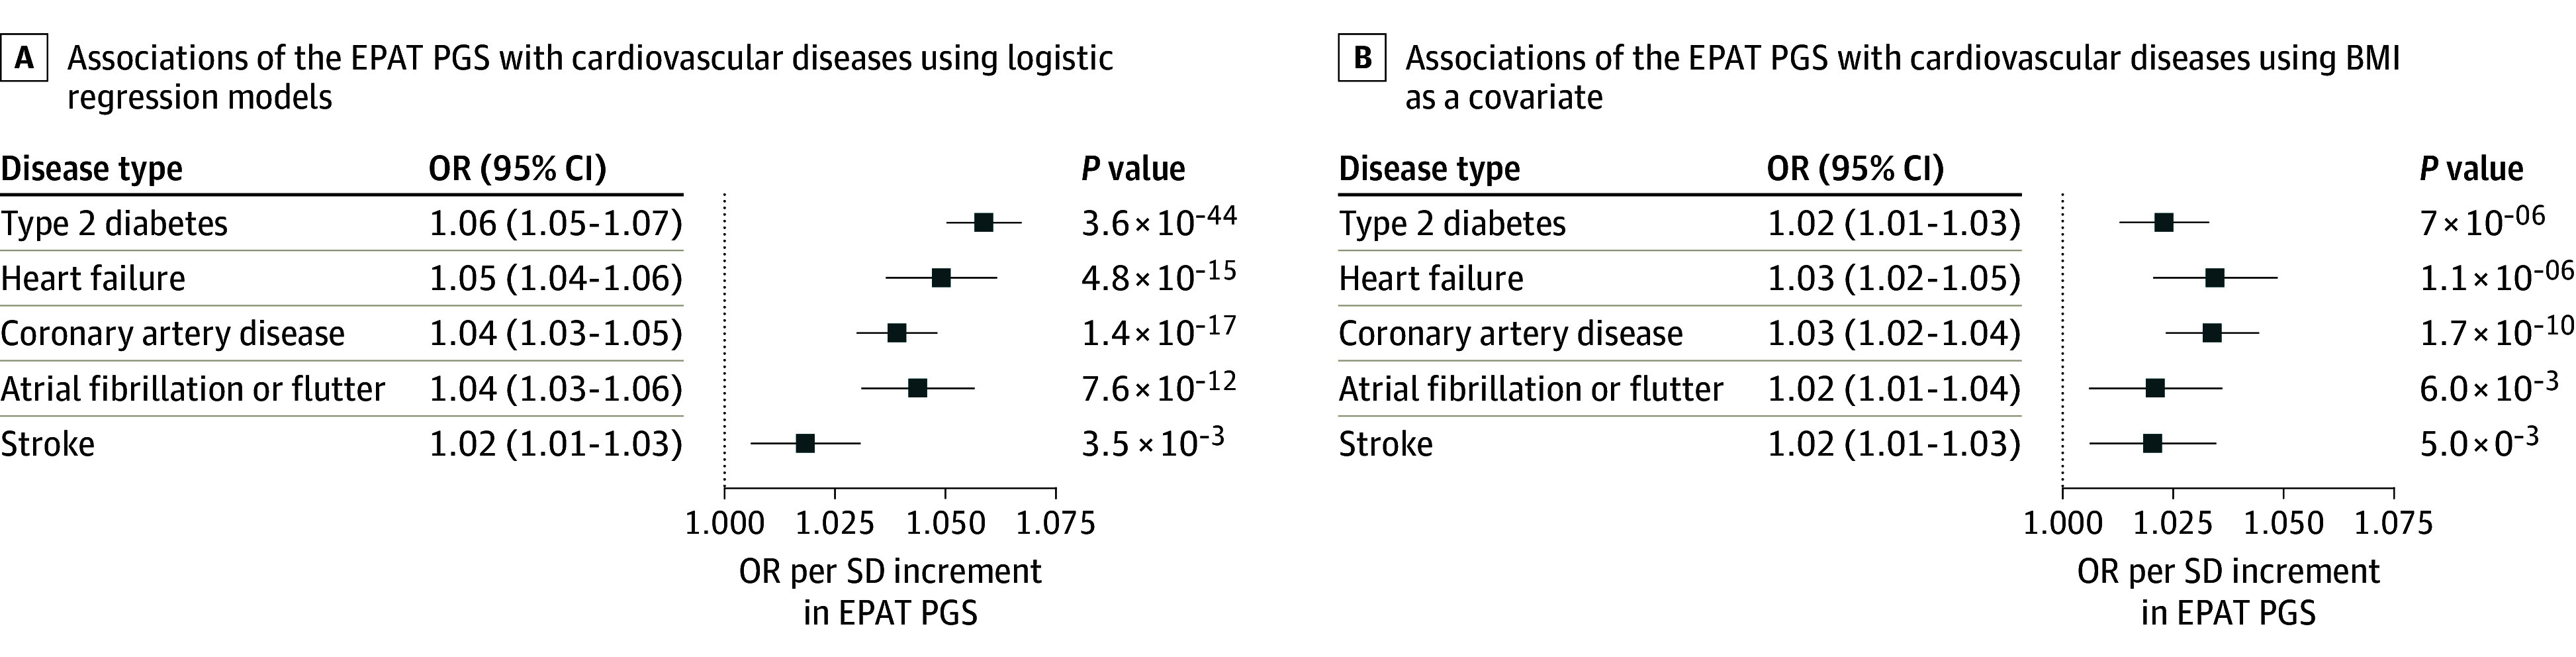
A polygenic score (PGS) for the combined area of EPAT was constructed using the PRS-CS tool, which infers posterior effect sizes for polygenic risk scores (PRS) under continuous shrinkage (CS) priors, based on summary statistics from the genome-wide association study of EPAT in UK Biobank and subsequently applied to 453 733 participants in the FinnGen study. A, The associations of the EPAT PGS with cardiovascular diseases were evaluated using logistic regression models with sex, age at the end of study follow-up or death, genomic principal components 1 to 5, and the genotyping array as basic covariates. B, The associations of the EPAT PGS with cardiovascular diseases were examined including body mass index (BMI) as an additional covariate. Odds ratios (ORs) are shown per SD increment in EPAT PGS.
Comparison of EPAT and VAT
Having been struck by the similarity of EPAT and abdominal adiposity with respect to clinical outcomes and genetic determinants, we finally compared EPAT with VAT in 38 527 participants in whom the volume of VAT had been directly quantified in a previous MRI study.2 We observed high correlation between measured EPAT and VAT (Pearson r = 0.72; P < 5 × 10−324) (eFigure 10 in Supplement 1), with similar genetic correlation estimates based on GWAS summary statistics (genetic correlation = 0.72; SE = 0.04; P = 5.2 × 10−94) (eTable 11 in Supplement 2).
Finally, when we included EPAT and VAT as simultaneous predictors in survival models, EPAT was no longer associated with any cardiovascular outcome, whereas VAT remained significantly associated with the risk of T2D (OR, 2.16; 95% CI, 1.90-2.44; P = 1.2 × 10⁻³³), HF (OR, 1.37; 95% CI, 1.17-1.61; P = 1.1 × 10⁻⁴), CAD (OR, 1.25; 95% CI, 1.12-1.39; P = 8.4 × 10⁻⁵), and AF (OR, 1.28; 95% CI, 1.14-1.44; P = 4.2 × 10⁻⁵) (Figure 5 and eTable 15 in Supplement 2).
Figure 5. Incident Disease Associations of Epicardial and Pericardial Adipose Tissue (EPAT) and Abdominal Visceral Adipose Tissue (VAT) in a Joint Model.

The associations of the combined area of EPAT and the volume of abdominal VAT with incident diseases were tested using Cox proportional hazards models with time from imaging to diagnosis or censoring as the outcome and EPAT, VAT, sex, and age as the predictors. A, Hazard ratios (HRs) are shown separately for EPAT (in SD units). B, HRs are shown separately for VAT (in SD units). Participants with the corresponding prevalent disease at the time of imaging were excluded from analyses.
Discussion
In this cohort study, we examined the cardiovascular associations and genetic determinants of EPAT in more than 40 000 individuals from a large, prospective and uniformly phenotyped cohort. These analyses enabled several insights. We expanded prior knowledge demonstrating associations of EPAT with incident HF, T2D, and CAD independently of BMI; however, these associations were no longer significant after controlling for VAT. Genetic loci suggest that variation in EPAT is influenced by regulators of adipocyte morphology, brownlike adipose tissue differentiation, and abdominal adiposity. Our findings were consistent with EPAT as a thoracic fat depot reflective of metabolically unhealthy adiposity, similar to VAT.
Considerable interest has been focused on EAT as a potential local driver of cardiovascular disease. EAT has been hypothesized to contribute to AF by local secretion of profibrotic or inflammatory factors.6 Paracrine or vasocrine release of cytokines and immune response factors from EAT to coronary arteries has been suggested to drive the development of atherosclerosis.5 However, EPAT and VAT have comparable associations with cardiovascular risk factors and the metabolic syndrome,22,25 which raises the question of whether many of the observed disease associations may reflect global consequences of unhealthy visceral adiposity rather than more localized cardiac effects.
Here, we identified EPAT to be associated with incident T2D, HF, and CAD even after controlling for BMI. Our findings for T2D and HF are in keeping with recently reported associations with incident T2D in 42 598 UKB participants and with incident CAD and HF with preserved ejection fraction in 6785 to 6814 participants of the Multiethnic Study of Atherosclerosis (MESA).7,10 Finally, although we replicated an association between EPAT and prevalent AF,8 EPAT was not associated with incident AF when controlling for BMI, in keeping with an analysis of 7991 participants from MESA and Jackson Heart Study.26
Importantly, however, we found no significant associations between EPAT and incident cardiovascular diseases when accounting for VAT. These findings are in contrast to a recent UKB imaging study that suggested that EPAT might be independently associated with unhealthy cardiac structure and function,22 although the study did not report direct comparisons. To our knowledge, we reported the first head-to-head comparison of EPAT and VAT in a large sample of over 38 000 participants who underwent both cardiac and abdominal imaging. Our findings suggest that the observed associations between the quantity of EPAT and incident cardiovascular diseases may be more reflective of general metabolically unhealthy visceral adiposity rather than of local or paracrine effects.
The similarity of EPAT and VAT was also highlighted by genetic loci. We replicated 2 known genetic loci and identified 5 novel loci for EPAT. Previously, a meta-analysis of 11 596 participants from heterogeneous imaging cohorts reported genetic loci containing TRIB2 and EBF1 but provided no effect estimates for further assessments.24 Among 7 genomic loci for EPAT, all have been previously associated with WHR,27 and 4 have been associated with VAT in a previous UKB study.28 Of note, despite high genome-wide correlation, the genetic loci for EPAT and VAT are not entirely overlapping as demonstrated by stronger genetic signals in the WARS2, TRIB2, and EBF1 loci for EPAT. This suggests that both shared and distinct biological pathways may contribute to the quantities of EPAT and VAT.
Prioritization of potentially causal genes in the EPAT association loci highlighted interconnected biological pathways. On separate chromosomes, we prioritized the transcription factor encoding genes EBF1 and EBF2. EBF1 is a regulator of adipose cell morphology and lipolysis,29 and decreased levels of EBF1 have been observed in white adipose tissue hypertrophy. EBF2 is a promoter of brownlike/beige adipose cell differentiation.30 CEBPA, prioritized in another locus, encodes for the transcription factor CCAAT/enhancer binding protein α (C/EBPα), which shares binding sites with peroxisome proliferator-activated receptor gamma (PPARγ) and acts as a costimulator of adipogenesis and adipocyte differentiation.31,32 In a previously identified EPAT locus, we also prioritized TRIB2, which is a promoter of CCAAT/enhancer-binding protein β, which transactivates the expression of both C/EBPα and PPARγ.33 WARS2 encodes the mitochondrial trytophanyl–transfer RNA synthetase; a variant Wars2 mouse model has been found to exhibit reduced food intake, resistance to diet-induced obesity, and changes in relative visceral adiposity.34 Finally, a PGS for EPAT was associated with higher risk of cardiovascular diseases in the independent FinnGen study, with patterns closely resembling those of measured EPAT in UKB. Overall, the GWAS loci for EPAT may contain a subset of drivers of metabolically unhealthy adiposity.
Limitations
The findings should be interpreted in the context of the study design. First, in our quantitation of EPAT, we were not able to differentiate between EAT and PAT. Second, EPAT quantitation was based on a single CMR slice. The relative localization of EPAT surrounding the heart may carry added significance. However, single-slice measurements of EAT and PAT have been found to be highly correlated with their volumes.35 Third, the accuracy of EPAT segmentation was not perfect. Different segmentation accuracy for EPAT and VAT may affect their respective performance in joint models. Reassuringly, we noted a low rate of major errors on manual review, and the identification of known and novel GWAS loci suggests that the increased sample size still outweighs reduced accuracy for genomic discovery. Fourth, participants in the UKB are healthier than the overall population,36 which may affect the external validity of disease risk estimates. Lastly, UKB participants were mostly of European ancestry, which may limit the generalizability of the findings to other ancestries.
Conclusions
In conclusion, results of this cohort study suggest that EPAT was associated with the risk of T2D, HF, and CAD independently of BMI. However, these associations were no longer significant when controlling for VAT. Individual variation in EPAT is likely influenced by genes regulating abdominal adiposity, adipocyte morphology, and brownlike adipogenesis. The intrathoracic accumulation of EPAT may reflect a metabolically unhealthy adiposity phenotype, similar to VAT.
eMethods
eResults
eFigure 1. Study Flowchart
eFigure 2. Associations of Epicardial and Pericardial Adipose Tissue With Age, Sex, and Anthropometric Measurements
eFigure 3. Associations of Epicardial and Pericardial Adipose Tissue With Incident Diseases
eFigure 4. Associations of Percentile-Stratified Epicardial and Pericardial Adipose Tissue With Incident Diseases
eFigure 5. Cumulative Incidences of Cardiovascular Diseases Stratified by Epicardial and Pericardial Adipose Tissue Decile at Baseline
eFigure 6. Locus plots From the Genome-Wide Association Study of Epicardial and Pericardial Adipose Tissue in UK Biobank
eFigure 7. Quantile-Quantile Plot of P Values From the Genome-Wide Association Study of Epicardial and Pericardial Adipose Tissue in UK Biobank
eFigure 8. Manhattan Plot of the Meta-Analysis of Genome-Wide Association Studies of Epicardial and Pericardial Adipose Tissue
eFigure 9. Quantile-Quantile Plot of the Meta-Analysis of Genome-Wide Association Studies of Epicardial and Pericardial Adipose Tissue
eFigure 10. Association of Epicardial and Pericardial Adipose Tissue Area With Visceral Adipose Tissue Volume Quantified From Magnetic Resonance Images
eFigure 11. Genome-Wide Association Studies Corresponding to Additional Sensitivity Analyses
eReferences
eTable 1. Observed Errors in a Manual Review of 1000 Automated Epicardial and Pericardial Adipose Tissue Segmentations
eTable 2. UK Biobank Disease Definitions
eTable 3. Characteristics of the Study Sample at the Time of Imaging
eTable 4. Characteristics of the Study Sample at the time of Imaging and Stratified by Self-Reported Ethnic Background
eTable 5. Prevalent Disease Association Results in the UK Biobank
eTable 6. Associations of Epicardial and Pericardial Adipose Tissue Area With Incident Diseases
eTable 7. Associations of Epicardial and Pericardial Adipose Tissue Area With Incident Diseases Controlling for Medications
eTable 8. Associations of Percentile-Stratified Epicardial and Pericardial Adipose Tissue Area With Incident Diseases
eTable 9. Lead Variants From the Genome-Wide Association Study of Epicardial and Pericardial Adipose Tissue Area in UK Biobank
eTable 10. Polygenic Priority Scores for Genes in Genome-Wide Significant Loci in the Genome-Wide Association Study of Epicardial and Pericardial Adipose Tissue Area in UK Biobank
eTable 11. Genetic Correlations Between Epicardial and Pericardial Adipose Tissue Area and Anthropometric Traits
eTable 12. Lead Variants From the Meta-Analysis of Genome-Wide Association Studies of Epicardial and Pericardial Adipose Tissue
eTable 13. FinnGen Participant Characteristics
eTable 14. Predictive Utility of a Polygenic Score for Epicardial and Pericardial Adipose Tissue in FinnGen
eTable 15. Simultaneous Prediction of Incident Cardiovascular Diseases With Pericardial Adipose Tissue and Abdominal Visceral Adipose Tissue
FinnGen.
Data Sharing Statement.
References
- 1.Powell-Wiley TM, Poirier P, Burke LE, et al. ; American Heart Association Council on Lifestyle and Cardiometabolic Health; Council on Cardiovascular and Stroke Nursing; Council on Clinical Cardiology; Council on Epidemiology and Prevention; and Stroke Council . Obesity and cardiovascular disease: a scientific statement from the American Heart Association. Circulation. 2021;143(21):e984-e1010. doi: 10.1161/CIR.0000000000000973 [DOI] [PMC free article] [PubMed] [Google Scholar]
- 2.Agrawal S, Klarqvist MDR, Diamant N, et al. BMI-adjusted adipose tissue volumes exhibit depot-specific and divergent associations with cardiometabolic diseases. Nat Commun. 2023;14(1):266. doi: 10.1038/s41467-022-35704-5 [DOI] [PMC free article] [PubMed] [Google Scholar]
- 3.Antoniades C, Tousoulis D, Vavlukis M, et al. Perivascular adipose tissue as a source of therapeutic targets and clinical biomarkers. Euro Heart J. 2023;44(38):3827-3844. doi: 10.1093/eurheartj/ehad484 [DOI] [PMC free article] [PubMed] [Google Scholar]
- 4.Iacobellis G, Corradi D, Sharma AM. Epicardial adipose tissue: anatomic, biomolecular, and clinical relationships with the heart. Nat Clin Pract Cardiovasc Med. 2005;2(10):536-543. doi: 10.1038/ncpcardio0319 [DOI] [PubMed] [Google Scholar]
- 5.Iacobellis G. Local and systemic effects of the multifaceted epicardial adipose tissue depot. Nat Rev Endocrinol. 2015;11(6):363-371. doi: 10.1038/nrendo.2015.58 [DOI] [PubMed] [Google Scholar]
- 6.Iacobellis G. Epicardial adipose tissue in contemporary cardiology. Nat Rev Cardiol. 2022;19(9):593-606. doi: 10.1038/s41569-022-00679-9 [DOI] [PMC free article] [PubMed] [Google Scholar]
- 7.Ding J, Hsu FC, Harris TB, et al. The association of pericardial fat with incident coronary heart disease: the Multiethnic Study of Atherosclerosis (MESA). Am J Clin Nutr. 2009;90(3):499-504. doi: 10.3945/ajcn.2008.27358 [DOI] [PMC free article] [PubMed] [Google Scholar]
- 8.Thanassoulis G, Massaro JM, O’Donnell CJ, et al. Pericardial fat is associated with prevalent atrial fibrillation: the Framingham Heart Study. Circ Arrhythm Electrophysiol. 2010;3(4):345-350. doi: 10.1161/CIRCEP.109.912055 [DOI] [PMC free article] [PubMed] [Google Scholar]
- 9.Antonopoulos AS, Antoniades C. The role of epicardial adipose tissue in cardiac biology: classic concepts and emerging roles. J Physiol. 2017;595(12):3907-3917. doi: 10.1113/JP273049 [DOI] [PMC free article] [PubMed] [Google Scholar]
- 10.Kenchaiah S, Ding J, Carr JJ, et al. Pericardial fat and the risk of heart failure. J Am Coll Cardiol. 2021;77(21):2638-2652. doi: 10.1016/j.jacc.2021.04.003 [DOI] [PMC free article] [PubMed] [Google Scholar]
- 11.Chong B, Jayabaskaran J, Ruban J, et al. Epicardial adipose tissue assessed by computed tomography and echocardiography are associated with adverse cardiovascular outcomes: a systematic review and meta-analysis. Circ Cardiovasc Imaging. 2023;16(5):e015159. doi: 10.1161/CIRCIMAGING.122.015159 [DOI] [PubMed] [Google Scholar]
- 12.Bycroft C, Freeman C, Petkova D, et al. The UK Biobank resource with deep phenotyping and genomic data. Nature. 2018;562(7726):203-209. doi: 10.1038/s41586-018-0579-z [DOI] [PMC free article] [PubMed] [Google Scholar]
- 13.Raisi-Estabragh Z, Harvey NC, Neubauer S, Petersen SE. Cardiovascular magnetic resonance imaging in the UK Biobank: a major international health research resource. Eur Heart J Cardiovasc Imaging. 2021;22(3):251-258. doi: 10.1093/ehjci/jeaa297 [DOI] [PMC free article] [PubMed] [Google Scholar]
- 14.Kurki MI, Karjalainen J, Palta P, et al. ; FinnGen . FinnGen provides genetic insights from a well-phenotyped isolated population. Nature. 2023;613(7944):508-518. doi: 10.1038/s41586-022-05473-8 [DOI] [PMC free article] [PubMed] [Google Scholar]
- 15.Paszke A, Gross S, Massa F, et al. Pytorch: an imperative style, high-performance deep learning library. Accessed March 28, 2022. https://proceedings.neurips.cc/paper/2019/hash/bdbca288fee7f92f2bfa9f7012727740-Abstract.html
- 16.Howard J, Gugger S. Fastai: a layered API for deep learning. Information (Basel). 2020;11(2):108. doi: 10.3390/info11020108 [DOI] [Google Scholar]
- 17.Mbatchou J, Barnard L, Backman J, et al. Computationally efficient whole-genome regression for quantitative and binary traits. Nat Genet. 2021;53(7):1097-1103. doi: 10.1038/s41588-021-00870-7 [DOI] [PubMed] [Google Scholar]
- 18.Bulik-Sullivan BK, Loh PR, Finucane HK, et al. ; Schizophrenia Working Group of the Psychiatric Genomics Consortium . LD Score regression distinguishes confounding from polygenicity in genome-wide association studies. Nat Genet. 2015;47(3):291-295. doi: 10.1038/ng.3211 [DOI] [PMC free article] [PubMed] [Google Scholar]
- 19.Ge T, Chen CY, Ni Y, Feng YA, Smoller JW. Polygenic prediction via Bayesian regression and continuous shrinkage priors. Nat Commun. 2019;10(1):1776. doi: 10.1038/s41467-019-09718-5 [DOI] [PMC free article] [PubMed] [Google Scholar]
- 20.Rosenbloom KR, Armstrong J, Barber GP, et al. The UCSC Genome Browser database: 2015 update. Nucleic Acids Res. 2015;43(Database issue):D670-D681. doi: 10.1093/nar/gku1177 [DOI] [PMC free article] [PubMed] [Google Scholar]
- 21.R Core Team . R: a language and environment for statistical computing. Accessed April 4, 2023. https://cir.nii.ac.jp/crid/1574231874043578752
- 22.Ardissino M, McCracken C, Bard A, et al. Pericardial adiposity is independently linked to adverse cardiovascular phenotypes: a CMR study of 42 598 UK Biobank participants. Eur Heart J Cardiovasc Imaging. 2022;23(11):1471-1481. doi: 10.1093/ehjci/jeac101 [DOI] [PMC free article] [PubMed] [Google Scholar]
- 23.Weeks EM, Ulirsch JC, Cheng NY, et al. Leveraging polygenic enrichments of gene features to predict genes underlying complex traits and diseases. Nat Genet. 2023;55(8):1267-1276. doi: 10.1038/s41588-023-01443-6 [DOI] [PMC free article] [PubMed] [Google Scholar]
- 24.Chu AY, Deng X, Fisher VA, et al. Multiethnic genome-wide meta-analysis of ectopic fat depots identifies loci associated with adipocyte development and differentiation. Nat Genet. 2017;49(1):125-130. doi: 10.1038/ng.3738 [DOI] [PMC free article] [PubMed] [Google Scholar]
- 25.Rosito GA, Massaro JM, Hoffmann U, et al. Pericardial fat, visceral abdominal fat, cardiovascular disease risk factors, and vascular calcification in a community-based sample: the Framingham Heart Study. Circulation. 2008;117(5):605-613. doi: 10.1161/CIRCULATIONAHA.107.743062 [DOI] [PubMed] [Google Scholar]
- 26.Heckbert SR, Wiggins KL, Blackshear C, et al. Pericardial fat volume and incident atrial fibrillation in the Multiethnic Study of Atherosclerosis and Jackson Heart Study. Obesity (Silver Spring). 2017;25(6):1115-1121. doi: 10.1002/oby.21835 [DOI] [PMC free article] [PubMed] [Google Scholar]
- 27.Pulit SL, Stoneman C, Morris AP, et al. ; GIANT Consortium . Meta-analysis of genome-wide association studies for body fat distribution in 694 649 individuals of European ancestry. Hum Mol Genet. 2019;28(1):166-174. doi: 10.1093/hmg/ddy327 [DOI] [PMC free article] [PubMed] [Google Scholar]
- 28.Agrawal S, Wang M, Klarqvist MDR, et al. Inherited basis of visceral, abdominal subcutaneous and gluteofemoral fat depots. Nat Commun. 2022;13(1):3771. doi: 10.1038/s41467-022-30931-2 [DOI] [PMC free article] [PubMed] [Google Scholar]
- 29.Gao H, Mejhert N, Fretz JA, et al. Early B cell factor 1 regulates adipocyte morphology and lipolysis in white adipose tissue. Cell Metab. 2014;19(6):981-992. doi: 10.1016/j.cmet.2014.03.032 [DOI] [PMC free article] [PubMed] [Google Scholar]
- 30.Stine RR, Shapira SN, Lim HW, et al. EBF2 promotes the recruitment of beige adipocytes in white adipose tissue. Mol Metab. 2015;5(1):57-65. doi: 10.1016/j.molmet.2015.11.001 [DOI] [PMC free article] [PubMed] [Google Scholar]
- 31.Lin FT, Lane MD. CCAAT/enhancer binding protein alpha is sufficient to initiate the 3T3-L1 adipocyte differentiation program. Proc Natl Acad Sci U S A. 1994;91(19):8757-8761. doi: 10.1073/pnas.91.19.8757 [DOI] [PMC free article] [PubMed] [Google Scholar]
- 32.Tontonoz P, Hu E, Spiegelman BM. Stimulation of adipogenesis in fibroblasts by PPAR gamma 2, a lipid-activated transcription factor. Cell. 1994;79(7):1147-1156. doi: 10.1016/0092-8674(94)90006-X [DOI] [PubMed] [Google Scholar]
- 33.Guo L, Li X, Tang QQ. Transcriptional regulation of adipocyte differentiation: a central role for CCAAT/enhancer-binding protein (C/EBP) β. J Biol Chem. 2015;290(2):755-761. doi: 10.1074/jbc.R114.619957 [DOI] [PMC free article] [PubMed] [Google Scholar]
- 34.Mušo M, Bentley L, Vizor L, et al. A Wars2 mutant mouse shows a sex and diet specific change in fat distribution, reduced food intake, and depot-specific upregulation of WAT browning. Front Physiol. 2022;13:953199. doi: 10.3389/fphys.2022.953199 [DOI] [PMC free article] [PubMed] [Google Scholar]
- 35.Vach M, Luetkens JA, Faron A, et al. Association between single-slice and whole heart measurements of epicardial and pericardial fat in cardiac MRI. Acta Radiol. 2023;64(7):2229-2237. doi: 10.1177/02841851211054192 [DOI] [PubMed] [Google Scholar]
- 36.Fry A, Littlejohns TJ, Sudlow C, et al. Comparison of sociodemographic and health-related characteristics of UK Biobank participants with those of the general population. Am J Epidemiol. 2017;186(9):1026-1034. doi: 10.1093/aje/kwx246 [DOI] [PMC free article] [PubMed] [Google Scholar]
Associated Data
This section collects any data citations, data availability statements, or supplementary materials included in this article.
Supplementary Materials
eMethods
eResults
eFigure 1. Study Flowchart
eFigure 2. Associations of Epicardial and Pericardial Adipose Tissue With Age, Sex, and Anthropometric Measurements
eFigure 3. Associations of Epicardial and Pericardial Adipose Tissue With Incident Diseases
eFigure 4. Associations of Percentile-Stratified Epicardial and Pericardial Adipose Tissue With Incident Diseases
eFigure 5. Cumulative Incidences of Cardiovascular Diseases Stratified by Epicardial and Pericardial Adipose Tissue Decile at Baseline
eFigure 6. Locus plots From the Genome-Wide Association Study of Epicardial and Pericardial Adipose Tissue in UK Biobank
eFigure 7. Quantile-Quantile Plot of P Values From the Genome-Wide Association Study of Epicardial and Pericardial Adipose Tissue in UK Biobank
eFigure 8. Manhattan Plot of the Meta-Analysis of Genome-Wide Association Studies of Epicardial and Pericardial Adipose Tissue
eFigure 9. Quantile-Quantile Plot of the Meta-Analysis of Genome-Wide Association Studies of Epicardial and Pericardial Adipose Tissue
eFigure 10. Association of Epicardial and Pericardial Adipose Tissue Area With Visceral Adipose Tissue Volume Quantified From Magnetic Resonance Images
eFigure 11. Genome-Wide Association Studies Corresponding to Additional Sensitivity Analyses
eReferences
eTable 1. Observed Errors in a Manual Review of 1000 Automated Epicardial and Pericardial Adipose Tissue Segmentations
eTable 2. UK Biobank Disease Definitions
eTable 3. Characteristics of the Study Sample at the Time of Imaging
eTable 4. Characteristics of the Study Sample at the time of Imaging and Stratified by Self-Reported Ethnic Background
eTable 5. Prevalent Disease Association Results in the UK Biobank
eTable 6. Associations of Epicardial and Pericardial Adipose Tissue Area With Incident Diseases
eTable 7. Associations of Epicardial and Pericardial Adipose Tissue Area With Incident Diseases Controlling for Medications
eTable 8. Associations of Percentile-Stratified Epicardial and Pericardial Adipose Tissue Area With Incident Diseases
eTable 9. Lead Variants From the Genome-Wide Association Study of Epicardial and Pericardial Adipose Tissue Area in UK Biobank
eTable 10. Polygenic Priority Scores for Genes in Genome-Wide Significant Loci in the Genome-Wide Association Study of Epicardial and Pericardial Adipose Tissue Area in UK Biobank
eTable 11. Genetic Correlations Between Epicardial and Pericardial Adipose Tissue Area and Anthropometric Traits
eTable 12. Lead Variants From the Meta-Analysis of Genome-Wide Association Studies of Epicardial and Pericardial Adipose Tissue
eTable 13. FinnGen Participant Characteristics
eTable 14. Predictive Utility of a Polygenic Score for Epicardial and Pericardial Adipose Tissue in FinnGen
eTable 15. Simultaneous Prediction of Incident Cardiovascular Diseases With Pericardial Adipose Tissue and Abdominal Visceral Adipose Tissue
FinnGen.
Data Sharing Statement.