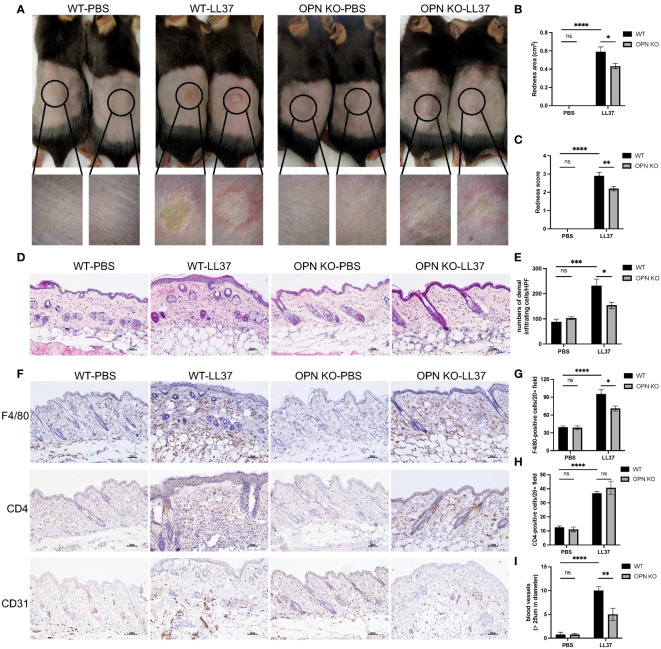
In the published article, there was an error in Figure 2A as published. The magnified image for the WT-PBS group was misused in the OPN KO-PBS group in the lower panel of Figure 2A . The corrected Figure 2 and its caption appear below.
Figure 2.
OPN knockdown attenuated rosacea-like skin redness and inflammatory cell infiltration in mice. (A) LL37 was injected intradermally into the dorsal skin of WT mice and OPN KO mice to induce a rosacea-like phenotype. The skin lesions were collected two days after injection with PBS or LL37. The lower panel is a magnified image of the circular area in the upper panel. The severity of the rosacea-like phenotypes was assessed according to the redness area (B) and redness score (C). Data represent the mean ± SEM. *p < 0.05, **p < 0.01, ****p < 0.0001. Ns, no significance. (D) HE staining for the histological analysis of WT mice and OPN KO mice injected with PBS or LL37. Scale bar: 50μm. (E) The number of dermal inflammatory infiltration in each group was quantified (n = 4 for each group). Data represent the mean ± SEM. Two-way ANOVA with Tukey’s post hoc test was used for statistical analyses. *p < 0.05, ***p < 0.001. Ns, no significance. (F) Representative images of immunohistochemistry of F4/80, CD4, and CD31 in WT mice and OPN KO mice injected with PBS or LL37. Scale bar: 50μm. (G) The infiltration of F4/80-positive cells was quantified in each group (n = 4 for each group). Data represent the mean ± SEM. Two-way ANOVA with Tukey’s post hoc test was used for statistical analyses. *p < 0.05, ****p < 0.0001. Ns, no significance. (H) The infiltration of CD4-positive cells was quantified in each group (n = 4 for each group). Data represent the mean ± SEM. Two-way ANOVA with Tukey’s post hoc test was used for statistical analyses. ****p < 0.0001. Ns, no significance. (I) The number of CD31-positive blood vessels (>25um in diameter) was quantified in each group (n = 4 for each group). Data represent the mean ± SEM. Two-way ANOVA with Tukey’s post hoc test was used for statistical analyses. **p < 0.01, ****p < 0.0001. Ns, no significance.
The authors apologize for this error and state that this does not change the scientific conclusions of the article in any way. The original article has been updated.
Publisher’s note
All claims expressed in this article are solely those of the authors and do not necessarily represent those of their affiliated organizations, or those of the publisher, the editors and the reviewers. Any product that may be evaluated in this article, or claim that may be made by its manufacturer, is not guaranteed or endorsed by the publisher.


