

Abstract
Introduction
Cigar sales have increased in the USA in recent years. A growing proportion of cigar sales are of flavoured varieties, many bearing ambiguous or ‘concept’ flavour descriptions (eg, Jazz). This study assessed US cigar sales by flavour category (ie, concept flavoured, characterising flavoured and tobacco), at national, regional and state levels.
Methods
Sales of cigarillos, large cigars and little cigars from chain, franchise and convenience stores, mass merchandisers, supermarkets, drug, dollar and club stores, and military commissaries during 2012–2016 were acquired from the Nielsen Company. US national-level and state-level sales, including District of Columbia, were analysed by flavour category. Flavour descriptors were classified as ‘tobacco’, ‘characterising’ or ‘concept’, based on Universal Product Code (UPC)-linked characteristics and brand website and consumer review descriptions.
Results
Cigar sales increased by 29% during 2012–2016, driven by a 78% increase in cigarillo sales. The proportion of concept-flavoured sales increased from 9% to 15%, while the proportion of sales decreased for tobacco (50% to 49%) and characterising flavours (eg, cherry) (41% to 36%). Cigarillos had the greatest increase in unique concept flavour descriptions (17 to 46 unique UPCs), with most sales occurring among Sweet, Jazz and Green Sweets concept flavours. By US region, total and concept-flavoured cigarillo sales were highest in the South.
Conclusions
Flavoured cigars are increasingly labelled with concept flavours, including in areas with flavoured tobacco sales restrictions. Cigarillos are driving recent increases in US cigar and concept-flavoured cigar sales. It is important to consider concept flavours when addressing flavoured tobacco product sales and use.
INTRODUCTION
Combustible tobacco products, such as cigarettes and cigars, are responsible for the overwhelming burden of death and disease from tobacco use in USA.1 Self-reported data indicate that the prevalence of current cigar use has remained flat in USA over the past decade;2 however, analysis of tobacco excise tax data reveals that from 2000 to 2015 total cigar consumption increased 85.2%.3 Furthermore, self-reported data indicate that cigar smoking varies across population groups. For example, in 2015, prevalence of past 30-day cigar smoking among US young adults aged 18–25 years was 8.9%, and 4.3% among those aged 26 years and older.4 Moreover, in 2017, 7.8% of non-Hispanic black high school students reported past 30-day use of cigars, which was the most commonly used tobacco product among this population group.5
Flavours can mask the harshness of tobacco, and flavoured tobacco products are preferred over non-flavoured varieties by youth and young adults.6 7 Most respondents to a large population survey who report having ever used a tobacco product state that the first product used was ‘flavoured to taste like menthol, mint, clove, spice, candy, fruit, chocolate, alcohol (such as wine or cognac), or other sweets’.8 Furthermore, the prevalence of current tobacco use (that is, smoking/using tobacco products some days or everyday) is significantly higher for those whose first tobacco product was flavoured.8 During 2013–2014, 65.4% of first-time cigar users aged 12–17 years smoked a flavoured cigar, and 71.7% of past 30-day cigar users smoked flavoured cigars.9 Indicators of retail sales are consistent with self-reported flavoured brand preferences for adult cigar smokers.10 During 2011–2015, the proportion of flavoured cigar sales significantly increased, with almost half of all cigarillo sales being flavoured.11 Moreover, during 2008–2015, the number of available unique cigar flavour names in USA, detected from Nielsen scanner data, increased 131%, from 108 to 205 unique flavours.12
Under the 2009 Family Smoking Prevention and Tobacco Control Act (FSPTCA), characterising flavours (eg, grape, cherry, chocolate) other than tobacco or menthol, are prohibited in cigarettes in USA. However, the sale of flavoured non-cigarette tobacco products, including cigars, is not currently prohibited at the federal level. The continued availability of menthol cigarettes and flavoured non-cigarette tobacco products following implementation of the FSPTCA appears to have contributed to the growing use of these products by youth.13 This apparent substitution of flavoured non-cigarette tobacco products for flavoured cigarettes could be addressed through possible actions by the US Food and Drug Administration to regulate flavoured tobacco products.14
Even in the absence of federal regulation of flavoured non-cigarette tobacco products, the FSPTCA preserves the authority of states and localities to implement policies related to flavoured tobacco product sales. Accordingly, several local jurisdictions and the state of Maine have enacted ordinances or laws restricting sales of flavoured tobacco products, including policies that restrict sales throughout the jurisdiction, or limit flavoured product sales in certain subgeographies (ie, within school buffer zones) or to adult-only facilities.15 Most of these policies prohibit the sale of non-cigarette tobacco products with characterising flavours, and some policies also restrict the sale of menthol cigarettes. However, a number of these policies exempt specific flavours (eg, rum, wine, menthol) and product types (eg, premium cigars), or limit the sales restriction to an inclusionary list of specific flavours or product types.16
Coinciding with the increasing number of state and local regulations of flavoured tobacco product sales, concept-flavoured cigars—that is, cigars with non-characterising flavour descriptions—have appeared in the marketplace.12 A chemical analysis of 16 cigars labelled with concept descriptors (eg, Royale) showed that 14 had flavour chemical profiles comparable to those of cigars with characterising flavour descriptions.17 Since most state and local flavour tobacco restrictions define flavours using characterising descriptors, flavoured cigars with concept descriptors may not be recognised as flavoured products subject to regulation when state and local policies are codified. Therefore, these products may be excluded from flavoured product sales restrictions or avoid detection by retailers and enforcement agencies.12 18 19
Ongoing monitoring of tobacco product sales can inform our understanding of evolving market conditions and can help evaluate the impact of tobacco prevention and control policies. To that end, tobacco retail sales data have been widely used to study cigar sales patterns11 20 21 and can complement self-reported assessments of cigar smoking among youth and adults. Recent scientific literature has documented an increase in the sales of concept-flavoured cigars in USA;18 however, it is not known whether concept-flavoured cigar sales are more prevalent for a specific cigar type (eg, little cigars, cigarillos or large cigars) or how the sales of these products may vary across US regions or states. To address this existing gap in the scientific literature, this study assessed US national, regional, and state-level trends in retail sales of cigars with concept-flavour descriptors.
METHODS
Data source
Cigar sales by Universal Product Code (UPC) were acquired from the Nielsen Company (Nielsen) at the US national and state levels, including the District of Columbia. Nielsen collects point-of-sale data from a census of affiliated stores (eg, all convenience stores [C-stores] of a specific chain), as well as a representative sample of unaffiliated stores, and then applies proprietary weighting methods to project total sales for specified geographical areas and retailer types (eg, C-stores or supermarkets). Data included sales from: (1) Chain, franchise and independent C-stores; and (2) All other outlets combined (AOC). The AOC category includes: mass merchandisers; supermarkets; drug, dollar and club stores; and Department of Defense commissaries.
National and state-level sales for C-stores and AOC were combined and analysed. State-level data from Alaska and Hawaii were not available, and thus, sales from these states were not included in the analyses. Sales data were reported in 4-week aggregates from the period ending 11 February 2012through the period ending 7 January 2017. Hereafter, the study period is referred to as 2012–2016 for simplicity.
Measures
Cigar types
In addition to dollar and unit sales metrics, sales data included UPC-level product descriptions. Nielsen uses what is written on a product’s packaging to inform each UPC description. Each UPC was preclassified by Nielsen as either a little cigar, cigarillo or large cigar. Detailed information on each UPC’s product type, brand, sub-brand, flavour, pack size, filter status and tip status was used to confirm or edit each cigar’s preclassified status. Little cigars were most often sold in packs of 20 and were filtered. Cigarillos were most often sold in packs of two and were the only product to have a tip. Large cigars were most often sold as singles with no filter or tip. Brand-level investigations using product websites aided in product categorisation when the appropriate classification was unclear, which accounted for approximately 5% of all UPCs.
Flavour classification
Concept flavour classifications were based on a consensus among two coders from the study team who reviewed the Nielsen-provided descriptors for each cigar product. To classify products into flavour descriptor categories, the coders first identified products with characterising flavour descriptors, defined as those with label names related to fruit, food, beverages or spices. The coders then identified all products with no flavour descriptors or with a flavour descriptor related to the tobacco itself (eg, natural, original). All remaining products were classified as having concept flavour descriptors.
Concept descriptors were further classified as concept-flavoured and concept-tobacco based on descriptions provided by manufacturer websites and/or consumer reviews. When manufacturer websites and/or user reviews described the product as having a characterising flavour (ie, fruit, food, beverage or spice), the product was coded as concept-flavoured. For example, products with descriptors ‘Wild Rush’ or ‘Jazz’ were coded as concept-flavoured because brand websites and/or user reviews described these products as tasting like watermelon or fruity, respectively. Cigars described as ‘sweet’ were categorised as concept-flavoured products. Items were coded as concept-tobacco when brand websites and/or consumer reviews described these products as having a taste or smell indicative of tobacco, such as the flavour descriptor, ‘Black Signature,’ which is described as mild or high-quality tobacco. Among all products with concept flavour descriptors, 91.5% were deemed concept-flavoured, while 8.5% were deemed concept-tobacco. Concept-tobacco sales in 2016 were included in the overall tobacco flavour category.
Analysis
Unit sales, henceforth referred to as ‘units’ or ‘sales’ or ‘unit sales,’ were generated by standardising Nielsen-reported units (quantity sold for a given UPC) to represent the most commonly observed package size by cigar type. After standardisation, a unit equalled one 20-pack of little cigars, two cigarillos or one large cigar. Unit sales were aggregated to create average monthly sales by year, flavour category (ie, concept flavoured, characterising flavoured and tobacco), subproduct (ie, little cigars, cigarillos and large cigars) and geography (ie, state, region or total USA). For brand-level analysis of concept-flavoured cigar sales, data were aggregated by brand, subproduct and geography. Units were reported per capita using annual national and state total population estimates from the US Census Bureau for 2012 through 2016.22 Because retail scanner data do not provide age information on the ultimate consumer of the product, and because minimum age of tobacco sale laws are not uniform across the USA, total population estimates were used in calculating per capita units. T-tests were used to determine significant changes in average monthly unit sales between 2012 and 2016.
RESULTS
National cigar sales
Average monthly cigar unit sales in USA increased during 2012–2016; cigarillo sales were a primary driver of this increase (table 1). Specifically, during 2012–2016, average monthly per capita cigar sales increased from 0.373 units to 0.481 units (an increase of 29% (P<0.01)); this increase was primarily driven by cigarillo sales, which increased from 0.216 units to 0.384 units per person (78%, P<0.01). During this same time period, sales of large and little cigars decreased, 42% and 20%, respectively (P<0.01).
Table 1.
Average monthly per capita cigar unit sales, total US and census regions, 2012 and 2016
| Total USA | Northeast | Midwest | South | West | |||||||||||
|---|---|---|---|---|---|---|---|---|---|---|---|---|---|---|---|
| 2012 | 2016 | % change | 2012 | 2016 | % change | 2012 | 2016 | % change | 2012 | 2016 | % change | 2012 | 2016 | % change | |
| Total | |||||||||||||||
| Total | 0.373 | 0.481 | 29** | 0.300 | 0.340 | 14** | 0.350 | 0.414 | 18** | 0.555 | 0.741 | 34%** | 0.155 | 0.222 | 44** |
| Tobacco | 0.187 | 0.234 | 25** | 0.167 | 0.159 | −5* | 0.167 | 0.195 | 16** | 0.280 | 0.377 | 35** | 0.067 | 0.091 | 35** |
| Characterising | 0.152 | 0.175 | 15** | 0.114 | 0.136 | 19** | 0.140 | 0.149 | 7** | 0.229 | 0.263 | 15** | 0.068 | 0.082 | 21** |
| Concept | 0.034 | 0.073 | 113** | 0.018 | 0.045 | 144** | 0.042 | 0.069 | 63** | 0.046 | 0.102 | 122** | 0.020 | 0.049 | 150** |
| Cigarillos | |||||||||||||||
| Total | 0.216 | 0.384 | 78** | 0.113 | 0.232 | 106** | 0.209 | 0.319 | 53** | 0.344 | 0.619 | 80** | 0.093 | 0.172 | 85** |
| Tobacco | 0.103 | 0.180 | 75** | 0.058 | 0.095 | 64** | 0.094 | 0.144 | 53** | 0.168 | 0.304 | 81** | 0.040 | 0.073 | 82** |
| Characterising | 0.090 | 0.145 | 61** | 0.050 | 0.106 | 111** | 0.084 | 0.118 | 41** | 0.143 | 0.228 | 60** | 0.038 | 0.059 | 56** |
| Concept | 0.024 | 0.060 | 155** | 0.004 | 0.030 | 583** | 0.031 | 0.057 | 86** | 0.034 | 0.087 | 158** | 0.015 | 0.040 | 171** |
| Large cigars | |||||||||||||||
| Total | 0.132 | 0.076 | −42** | 0.167 | 0.094 | −43** | 0.101 | 0.066 | −35** | 0.180 | 0.094 | −48** | 0.053 | 0.043 | −19** |
| Tobacco | 0.069 | 0.044 | −37** | 0.097 | 0.056 | −42** | 0.050 | 0.038 | −24** | 0.093 | 0.058 | −37** | 0.024 | 0.016 | −35** |
| Characterising | 0.053 | 0.021 | −60** | 0.056 | 0.025 | −56** | 0.040 | 0.018 | −55** | 0.075 | 0.023 | −69** | 0.024 | 0.018 | −25** |
| Concept | 0.010 | 0.012 | 13** | 0.0137 | 0.0142 | 3 | 0.0105 | 0.0096 | −9* | 0.012 | 0.013 | 11** | 0.005 | 0.009 | 85** |
| Little cigars | |||||||||||||||
| Total | 0.026 | 0.021 | −20** | 0.020 | 0.013 | −32** | 0.040 | 0.029 | −28** | 0.030 | 0.028 | −9** | 0.008 | 0.007 | −19** |
| Tobacco | 0.015 | 0.010 | −30** | 0.012 | 0.008 | −35** | 0.024 | 0.014 | −42** | 0.019 | 0.015 | −20** | 0.003 | 0.002 | −30** |
| Characterising | 0.010 | 0.009 | −12** | 0.007 | 0.005 | −29** | 0.016 | 0.013 | −17** | 0.011 | 0.011 | −1 | 0.006 | 0.005 | −16** |
| Concept | 0.000 | 0.001 | 189** | 0.0002 | 0.0003 | 66** | 0.001 | 0.002 | 125** | 0.000 | 0.002 | 296** | 0.0001 | 0.0002 | 294** |
Significant change in average monthly equivalent sales between 2012 and 2016 (P<0.05).
Significant change in average monthly equivalent sales between 2012 and 2016 (P < 0.01).
Note: One unit = 1 large cigar or 2 cigarillos or 20 little cigars.
Note: Cigar flavour descriptors were classified as ‘tobacco’ if they were listed as ‘original’, ‘natural’, had no flavour descriptor, or had a concept-tobacco descriptor as described by brand websites and user reviews; or ‘concept’ if they were not classified as characterising or tobacco and were described as having a characterising flavour on brand websites or user reviews; ‘characterising’ if they related to fruit, food, beverages or spices.
The proportion of average monthly unit sales attributed to concept-flavoured cigar sales increased from 9.1% in 2012 to 15.1% in 2016 (figure 1). In 2016, cigarillos had the highest proportion of concept-flavoured unit sales (15.6%). While the proportion of concept-flavoured large cigar and little cigar unit sales also increased during 2012–2016, sales of these products were low relative to concept-flavoured cigarillo sales. In 2016, average monthly per capita concept-flavoured cigarillo sales were 0.06 units, while concept-flavoured sales were 0.012 units among large cigar sales and 0.001 units among little cigar sales (table 1).
Figure 1.
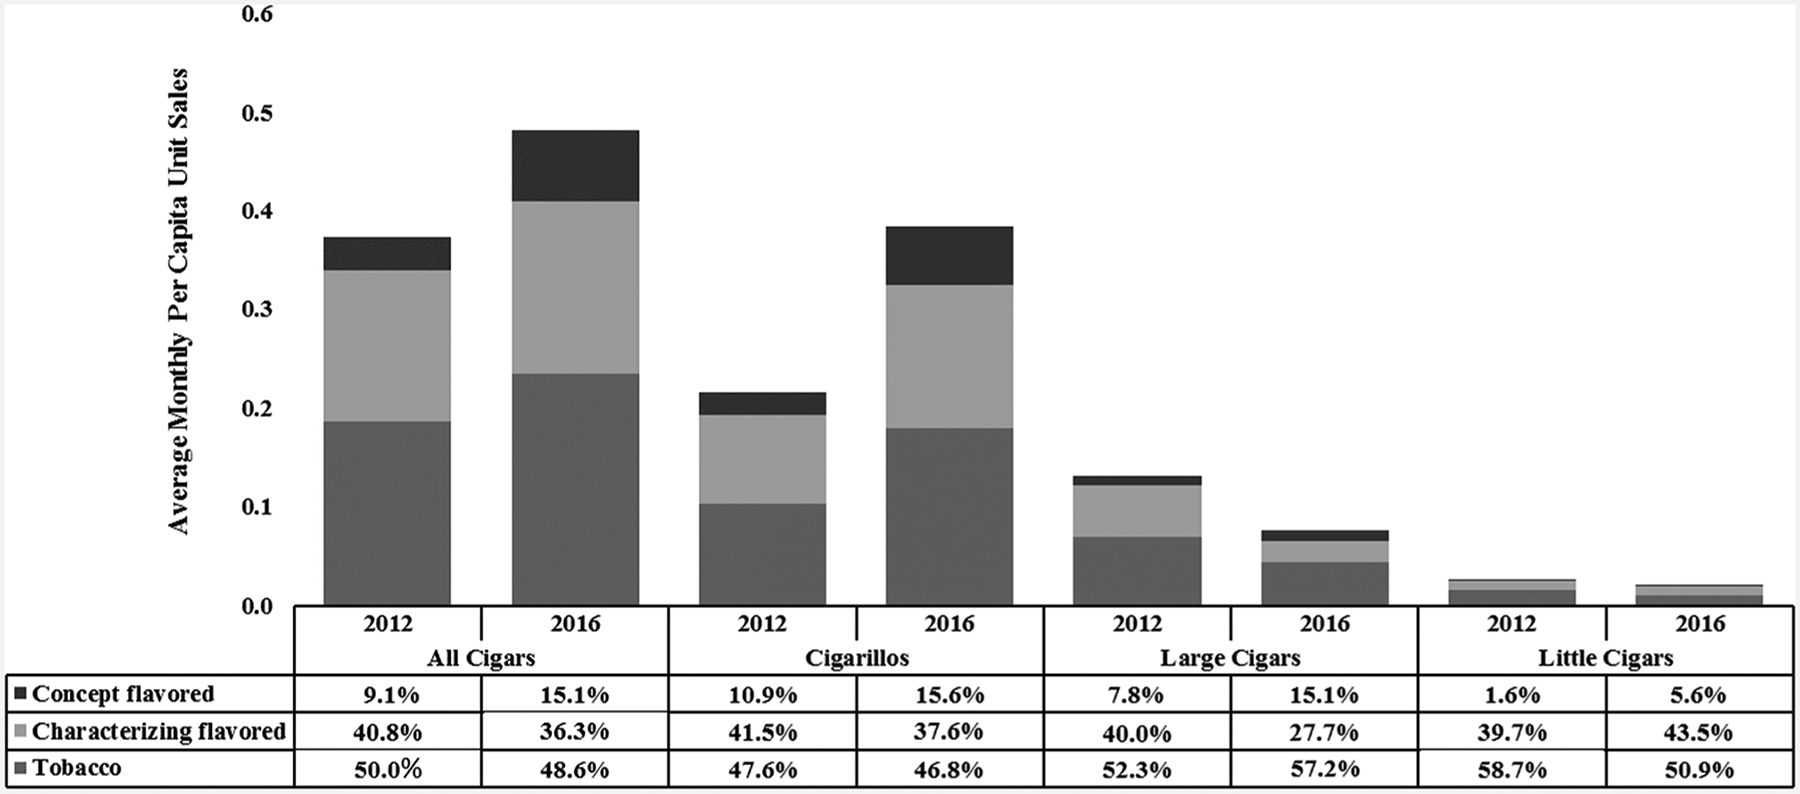
Average monthly per capita cigar unit sales by flavour status and cigar type, USA, 2012 and 2016. Note: One unit equals 1 large cigar or 2 cigarillos or 20 little cigars. Note: Cigar flavour descriptors were classified as ‘tobacco’ if they were listed as ‘original,’ ‘natural,’ had no flavour descriptor or had a concept-tobacco descriptor as described by brand websites and user reviews; ‘characterising’ if they related to fruit, food, beverages or spices; or ‘concept’ if they were not classified as characterising or tobacco and were described as having a characterising flavour on brand websites or user reviews.
Regional cigar sales
Total cigar unit sales increased in all four US regions from 2012 to 2016 (P<0.01), with cigarillo sales driving the increase (table 1). Each assessed flavour category (concept, characterising and tobacco) of cigarillos experienced increases in unit sales over the study period in every region (P<0.01). Concept-flavoured large and little cigar unit sales also increased within each region (P<0.01), with the exception of large cigars in the Northeast and Midwest. Decreases in sales of large and little cigars with characterising and tobacco flavour descriptions were observed in all regions during 2012–2016 (P<0.01), except for in the South where sales of little cigars with characterising flavour descriptions did not change.
Across all regions in 2016, per capita concept-flavoured cigarillo unit sales ranged from 2.1 to 6.8 times higher than concept-flavoured large cigar sales, and from 27.7 to 165.8 times higher than concept-flavoured little cigar sales. During 2012–2016, average monthly per capita concept-flavoured cigarillo unit sales increased 583% in the Northeast, 171% in the West, 158% in the South and 86% in the Midwest (P<0.01). Total cigarillo unit sales varied across regions in 2016, with notably high sales in the South. Total per capita cigarillo unit sales in the South were 1.9, 2.7 and 3.6 times higher than in the Midwest, Northeast and West, respectively. Correspondingly, annual concept-flavoured cigarillo unit sales in 2016 were 1.5, 2.2 and 2.9 times higher in the South than in the Midwest, West and Northeast, respectively.
In each state, average monthly per capita sales of concept-flavoured cigarillos increased during 2012–2016 (P<0.01), and per capita sales were generally highest among Southern states, with the highest sales rates occurring in Mississippi, Georgia, Arkansas and Alabama (figure 2). Within other regions, the highest average monthly per capita unit sales of concept-flavoured cigarillos occurred in Maine and New Hampshire (Northeast), Nebraska and Kansas (Midwest), and Nevada and Washington (West).
Figure 2.
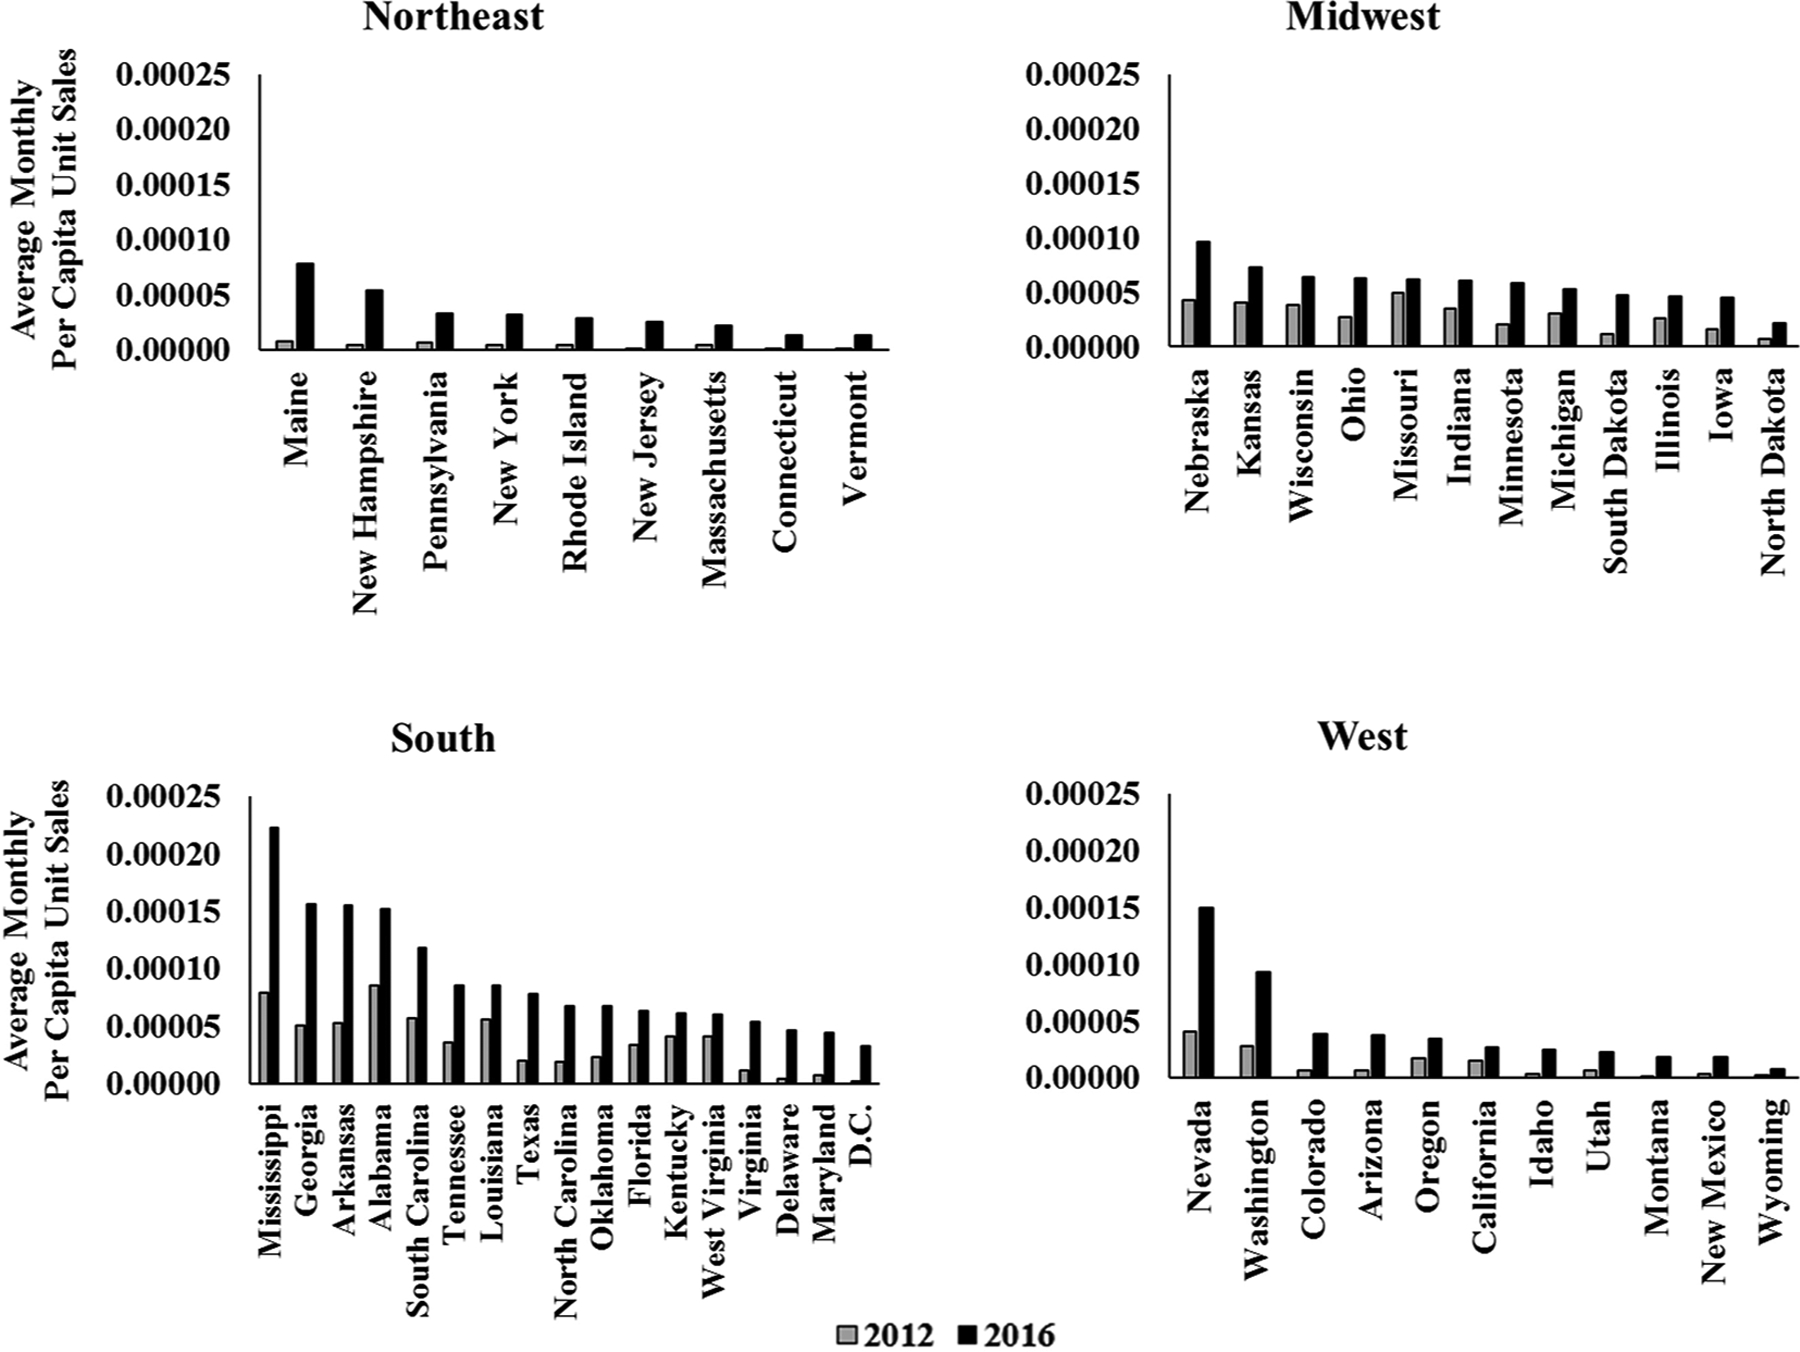
Average monthly per capita concept-flavoured cigarillo unit sales, US states, 2012 and 2016. Note: One unit = two cigarillos. Note: Average monthly equivalent unit sales per capita were significantly higher in 2016 than in 2012 for all states (P<0.01).
Concept-flavoured cigarillo sales
Nationally, more than 75% of concept-flavoured cigarillo unit sales were concentrated in a few flavours (figure 3). In 2016, the top selling cigarillos had concept-flavoured names of Sweet, Green Sweet, Tropical, and Tropical Twist (multiple brands); Jazz (Middleton’s Black & Mild brand); and Wild Rush, Tropical Fusion, Island Bash and Tropical Storm (Swisher Sweets brand). These nine flavour descriptors accounted for 94.7% of all concept-flavoured cigarillo unit sales in 2016. The remaining 5.3% of unit sales were divided among 37 additional concept flavour descriptors sold during the study period. In 2016, the three top-selling brands for concept-flavoured cigarillo sales accounted for 85% of concept-flavoured cigarillo unit sales; the nine top-selling brands accounted for 97.5% of sales; and 27 other brands shared the remaining 2.5% of concept-flavoured cigarillo sales.
Figure 3.
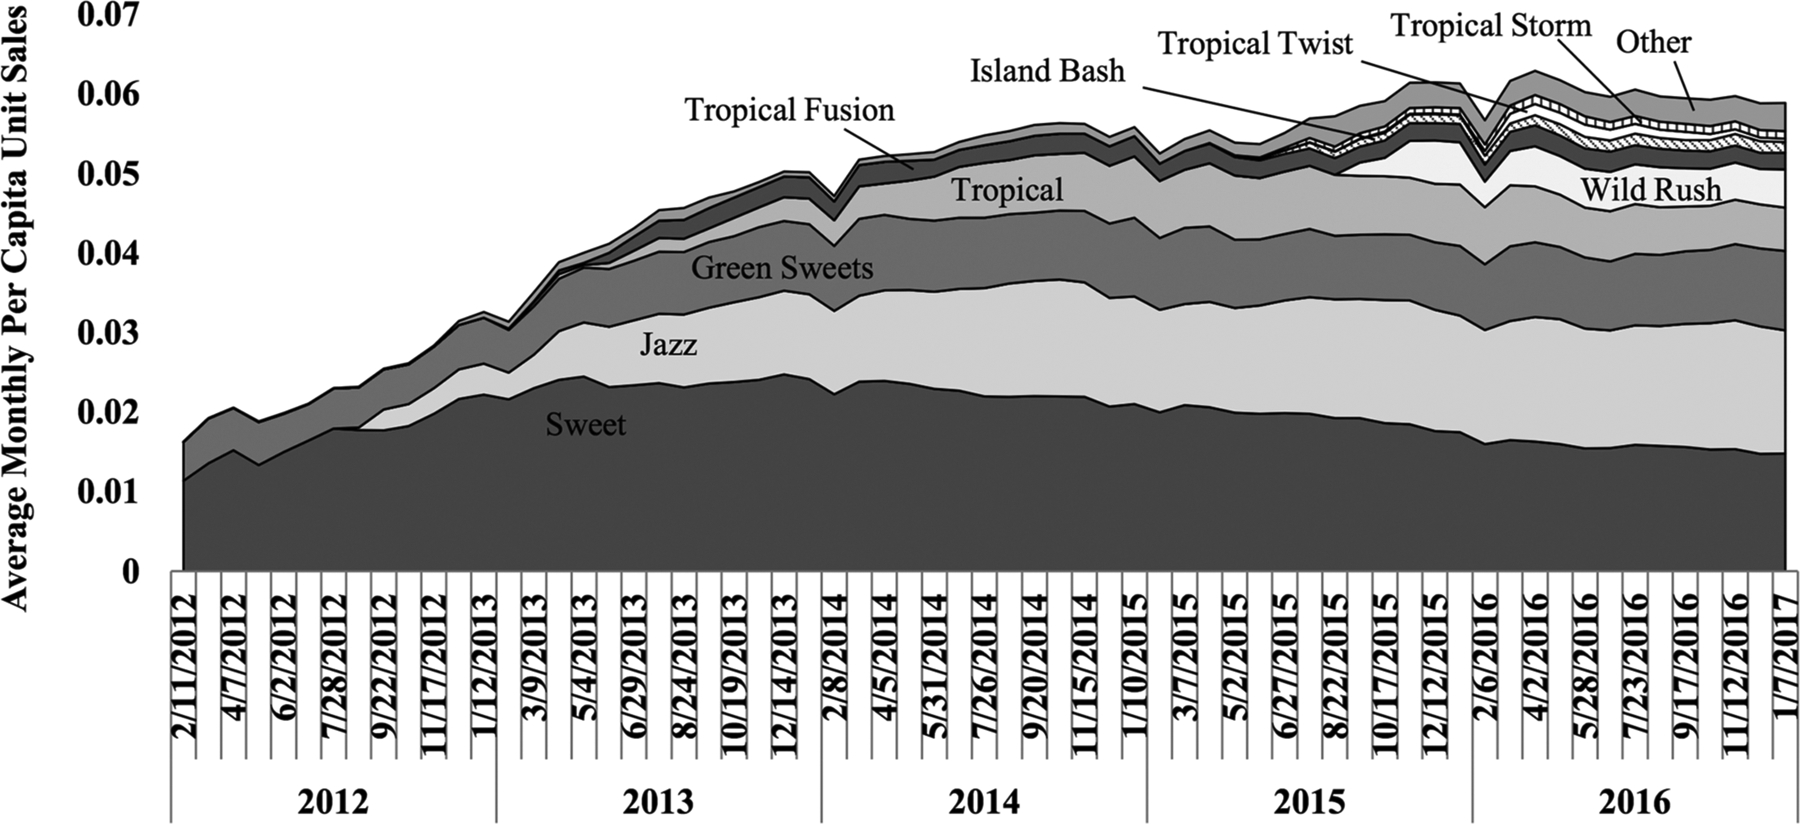
Average monthly per capita concept-flavoured cigarillo unit sales by top concept flavours, USA, 2012–2016 Note: one unit = two cigarillos.
DISCUSSION
The findings from this study reveal that during 2012–2016, total US cigar unit sales grew by 29%, which was largely driven by increasing sales of cigarillos. During this same period, average monthly unit sales of all cigar subtypes (cigarillos, large cigars and little cigars) with concept flavours increased from 9% to 15%, while sales of cigars with tobacco and characterising flavours decreased. Moreover, while the market for concept-flavoured cigarillo unit sales proliferated—growing from 17 to 46 available unique concept-flavoured cigarillo descriptors sold from the start to the end of the study period—the market was dominated by a few cigarillo flavours and brands. In late 2016, the three top-selling cigarillo concept flavours (Sweet, Jazz and Green Sweets) accounted for 68% of concept-flavoured cigarillo unit sales, while the three top-selling brands accounted for 85% of concept-flavoured cigarillo unit sales. These findings highlight the rapidly changing nature of the cigar market in recent years, including variation across US regions and states. The findings suggest that, as jurisdictions expand sales restrictions on flavoured non-cigarette tobacco products, it is important to account for the existence and prominent growth in sales of concept-flavoured products.
This study documents increases in overall US cigar product unit sales in recent years, which are consistent with previously published studies.12 18 Additionally, the findings demonstrate that US regional and state-specific trends mirror national findings with certain notable exceptions. For example, in 2016, average monthly per capita unit sales for all cigarillos, as well as for concept-flavoured cigarillos, were each highest in the South; however, the per cent increase in per capita concept-flavoured cigarillo unit sales during 2012–2016 was highest in the Northeast (583%). Moreover, among northeastern states, Maine had the greatest gain in the level of unit sales of concept-flavoured cigarillos during 2012–2016, despite having the only state-wide policy restricting sales of flavoured, non-premium cigars, which was enacted in 2007. Given the marked and dynamic variation in sales across regions and states, continued surveillance of cigar sales, particularly concept flavours, is critical to help inform tobacco control policy, planning and practice at the subnational levels.
In addition to the state-wide restriction in Maine described above, an increasing number of US localities have, in recent years, enacted restrictions on sales of flavoured tobacco products; however, many of these policies exclude specific flavours (eg, rum, wine) or limit the restriction to an inclusionary list of specific flavours. Sales restriction policies may be weakened by inclusive lists of flavoured products that become outdated, exclude certain flavours or contain other language that reduces the comprehensiveness of the restriction. This weakness can increase the detection burden on retailer compliance and enforcement agencies and create opportunities for renamed or repackaged products to provide consumers with alternatives that avoid sales restrictions.23
Our findings show that the growth in sales of products labelled with concept-flavour names is coincident with the enactment of many state and local flavoured non-cigarette tobacco product sales restrictions throughout the USA, suggesting that the increased marketing of products labelled with concept-flavour names may be a response to flavoured product sales restrictions. This may also explain why we saw the greatest increases in the level of sales in the Northeast, as jurisdictions in this region enacted the plurality of flavoured non-cigarette tobacco product sales restrictions in the USA through the end of 2016. Indeed, the flavoured cigar sales law enacted by the State of Maine in 2007 was subsequently amended in 2009 when the policy specified that a cigar is deemed to have a characterising flavour if the cigar is advertised or marketed as having or producing the ‘taste or aroma of candy, chocolate, vanilla, fruit, berry, nut, herb, spice, honey, or an alcoholic drink’.24 Thus, cigars labelled with a concept-flavour name could circumvent Maine’s sales restriction if the advertising or marketing of the product flavour is ambiguous.
The marked increase in sales of concept-flavoured cigarillos observed in this study during 2012–2016 suggests that such products are becoming increasingly available and sold across the USA. Increasing sales of all cigarillos, which are generally sold in small pack sizes and at lower per-pack prices than cigarettes, may reflect aggressive marketing of these products to price-sensitive consumers and in targeted communities.25 Moreover, the introduction of some concept flavours, such as Rasta Sweet and Tropical Twist, may be a marketing strategy to appeal to particular demographic groups.9 The growth in sales of concept-flavoured cigarillos, even in jurisdictions with long-standing flavoured product sales restrictions, has the potential to undermine efforts to reduce combustible smoking rates in the USA, especially among populations and in regions with the greatest burden. In an attempt to address this issue, many localities in Massachusetts have prohibited concept-flavoured product sales based on their taste or aroma, rather than their specific descriptors.20 Further evaluation of the impact of these approaches on flavoured tobacco sales and use is warranted.
This study is subject to at least four limitations. First, there are no universal definitions for cigar subtypes, and the designation in this study was limited to the package labelling and product characteristics provided in the Nielsen scanner data; however, the categorisation methods were consistent with established cigar subtype descriptions.26 Second, the data used in this analysis do not include online sales or sales from smaller tobacco shops, and thus, may not be generalisable to the entire US cigar market. Third, Nielsen scanner data were projected to each geography using proprietary methods; however, these data have been extensively used in the scientific literature,7 11 27–29 as well as by financial sector analysts.30 Fourth, the results rely on the classification of products into categories based on the authors’ interpretation of product descriptors included in the Nielsen scanner data and information from manufacturer and user review websites. It is possible that these sources may not adequately convey flavour descriptors in some circumstances, thus leading to imprecise product classification in these instances. This approach, however, has been used in other studies that have classified tobacco products with flavour descriptors.18
This study determined that cigar unit sales in the USA increased during 2012–2016, with increasing cigarillo sales being the primary contributor to this trend. During the same period, the proportion of concept-flavoured cigar unit sales increased and the proportion of tobacco and characterising-flavoured unit sales decreased. The availability and use of cigar products with concept descriptors may be in response to the proliferation of local flavoured tobacco product sales restrictions. These findings reinforce the importance of accounting for the growing availability of concept-flavoured tobacco products when designing and enforcing policies that address flavoured tobacco products.
What this paper adds.
Cigar sales have increased in the USA in recent years. Ambiguous or ‘concept’ cigar flavours have emerged during this time, including in jurisdictions with sales restrictions on flavoured non-cigarette tobacco products.
This study finds that in the USA, cigarillo sales have been a major contributor to increasing cigar sales over the past 5 years. Moreover, flavoured cigarillos were the primary contributor to an observed increase in the sales of cigars with ambiguous flavour descriptors, or ‘concept’ flavours.
These findings underscore the importance of considering concept flavours in the design and enforcement of policies to address flavoured tobacco product sales.
Acknowledgements
The authors thank Sallie Fiore of RTI International for her editorial assistance.
Funding
Support was provided by the Centers for Disease Control and Prevention (CDC), in part, through contracts 200-2014-F-6122, 200-2016-F-92371 and 200-2013-M-53964B, and by the US National Institutes of Health (NIH) through the National Cancer Institute’s State & Community Tobacco Control Initiative to RTI International (U01-CA154281). The findings and conclusions in this report are those of the authors and do not necessarily represent the official position of CDC or NIH.
REFERENCES
- 1.U.S. Department of Health and Human Services (USDHHS). The health consequences of smoking—50 years of progress. A report of the Surgeon General. Atlanta, GA: U.S. Department of Health and Human Services, Centers for Disease Control and Prevention, National Center for Chronic Disease Prevention and Health Promotion, Office on Smoking and Health. Printed with corrections, 2014. [Google Scholar]
- 2.Cullen J, Mowery P, Delnevo C, et al. Seven-year patterns in US cigar use epidemiology among young adults aged 18–25 years: a focus on race/ethnicity and brand. Am J Public Health 2011;101:1955–62. [DOI] [PMC free article] [PubMed] [Google Scholar]
- 3.Wang TW, Kenemer B, Tynan MA, et al. Consumption of combustible and smokeless tobacco - United States, 2000–2015. MMWR Morb Mortal Wkly Rep 2016;65:1357–63. [DOI] [PMC free article] [PubMed] [Google Scholar]
- 4.Center for Behavioral Health Statistics and Quality. Key substance use and mental health indicators in the United States: results from the 2015 National Survey on Drug Use and Health HHS Publication No. SMA 16–4984, NSDUH Series H-51). Rockville, MD: Substance Abuse and Mental Health Services Administration, 2016. [Google Scholar]
- 5.Wang TW, Gentzke A, Sharapova S, et al. Tobacco product use among middle and high school students - United States, 2011–2017. MMWR Morb Mortal Wkly Rep 2018;67:629–33. [DOI] [PMC free article] [PubMed] [Google Scholar]
- 6.U.S. Department of Health and Human Services (USDHHS). Preventing tobacco use among youth and young adults. A report of the Surgeon General. Atlanta, GA: U.S. Department of Health and Human Services, Centers for Disease Control and Prevention. National Center for Chronic Disease Prevention and Health Promotion, Office on Smoking and Health, 2012. [Google Scholar]
- 7.Delnevo CD, Giovenco DP, Ambrose BK, et al. Preference for flavoured cigar brands among youth, young adults and adults in the USA. Tob Control 2015;24:389–94. [DOI] [PMC free article] [PubMed] [Google Scholar]
- 8.Villanti AC, Johnson AL, Ambrose BK, et al. Flavored tobacco product use in youth and adults: findings from the first wave of the PATH study (2013–2014). Am J Prev Med 2017;53:139–51. [DOI] [PMC free article] [PubMed] [Google Scholar]
- 9.Ambrose BK, Day HR, Rostron B, et al. Flavored tobacco product use among us youth aged 12–17 years, 2013–2014. JAMA 2015;314:1871–3. [DOI] [PMC free article] [PubMed] [Google Scholar]
- 10.Bonhomme MG, Holder-Hayes E, Ambrose BK, et al. Flavoured non-cigarette tobacco product use among US adults: 2013–2014. Tob Control 2016;25:ii4–13. [DOI] [PMC free article] [PubMed] [Google Scholar]
- 11.Kuiper NM, Gammon D, Loomis B, et al. Trends in sales of flavored and menthol tobacco products in the United States during 2011–2015.. Nicotine Tob Res 2017. [DOI] [PMC free article] [PubMed] [Google Scholar]
- 12.Delnevo CD, Giovenco DP, Miller Lo EJ. Changes in the mass-merchandise cigar market since the tobacco control act. Tob Regul Sci 2017;3(2 Suppl 1):8–16. [DOI] [PMC free article] [PubMed] [Google Scholar]
- 13.Courtemanche CJ, Palmer MK, Pesko MF. Influence of the flavored cigarette ban on adolescent tobacco use. Am J Prev Med 2017;52:e139–46. [DOI] [PMC free article] [PubMed] [Google Scholar]
- 14.Food and Drug Administration. Regulation of flavors in tobacco products (21 CFR Parts 1100, 1140, and 1143). Fed Regist 2018;83 https://www.federalregister.gov/documents/2018/03/21/2018-05655/regulation-of-flavors-in-tobacco-products [Google Scholar]
- 15.Public Health Law Center—Tobacco Control Legal Consortium. Regulating flavored tobacco products. 2017. http://www.publichealthlawcenter.org/sites/default/files/resources/Regulating-Flavored-Tobacco-Products-2017.pdf (accessed 6 Oct 2017).
- 16.Public Health Law Center—Tobacco Control Legal Consortium. Regulating flavored tobacco products. 2017. http://www.publichealthlawcenter.org/sites/default/files/resources/US-Sales-Restrictions-Flavored-Tobacco-Products-2017.pdf (accessed 6 Oct 2017).
- 17.Farley SM, Schroth KR, Grimshaw V, et al. Flavour chemicals in a sample of non-cigarette tobacco products without explicit flavour names sold in New York City in 2015. Tob Control 2018;27:170–6. [DOI] [PMC free article] [PubMed] [Google Scholar]
- 18.Viola AS, Giovenco DP, Miller Lo EJ, et al. A cigar by any other name would taste as sweet. Tob Control 2016;25:605–6. [DOI] [PMC free article] [PubMed] [Google Scholar]
- 19.Rogers T, Brown BM, McCrae TM, et al. Compliance with a sales policy on flavored non-cigarette tobacco products. Tob Regul Sci 2017. [DOI] [PMC free article] [PubMed] [Google Scholar]
- 20.Gammon DG, Loomis BR, Dench DL, et al. Effect of price changes in little cigars and cigarettes on little cigar sales: USA, Q4 2011-Q4 2013. Tob Control 2016;25:538–44. [DOI] [PMC free article] [PubMed] [Google Scholar]
- 21.Wang TW, Falvey K, Gammon DG, et al. Sales trends in price-discounted cigarettes, large cigars, little cigars, and Cigarillos-United States, 2011–2016. Nicotine Tob Res 2017. [DOI] [PMC free article] [PubMed] [Google Scholar]
- 22.U.S. Census Bureau. Annual estimates of the resident population: April 1, 2010 to July 1, 2016. 2017. http://www.census.gov/popest/data/national/totals/2014/index.html (accessed 11 Jan 2016).
- 23.Schwartz R, Chaiton M, Borland T, et al. Tobacco industry tactics in preparing for menthol ban. Tob Control 2018;27:577. [DOI] [PubMed] [Google Scholar]
- 24.State of Maine, Office of the Attorney General. Exempted cigars/exempted flavored cigars. 2010. http://www.maine.gov/tools/whatsnew/attach.php?id=240591&an=1 (accessed 4 Jun 2018).
- 25.Cantrell J, Kreslake JM, Ganz O, et al. Marketing little cigars and cigarillos: advertising, price, and associations with neighborhood demographics. Am J Public Health 2013;103:1902–9. [DOI] [PMC free article] [PubMed] [Google Scholar]
- 26.Center for Disease Control and Prevention. Cigars fact sheet. 2016. https://www.cdc.gov/tobacco/data_statistics/fact_sheets/tobacco_industry/cigars/index.htm (accessed 5 Oct 2017).
- 27.Huang J, Tauras J, Chaloupka FJ. The impact of price and tobacco control policies on the demand for electronic nicotine delivery systems. Tob Control 2014;23:iii41–7. [DOI] [PMC free article] [PubMed] [Google Scholar]
- 28.Loomis BR, Rogers T, King BA, et al. National and state-specific sales and prices for electronic cigarettes-U.S., 2012–2013. Am J Prev Med 2016;50:18–29. [DOI] [PMC free article] [PubMed] [Google Scholar]
- 29.Day HR, Ambrose BK, Schroeder MJ, et al. Point of sale scanner data for rapid surveillance of the E-cigarette market. Tob Regul Sci 2017;3:325–32. [DOI] [PMC free article] [PubMed] [Google Scholar]
- 30.Herzog B Nielsen: tobacco “all channel” data through August 12, 2017. Charlotte, NC: Wells Fargo Securities, LLC, 2017. [Google Scholar]