

Abstract
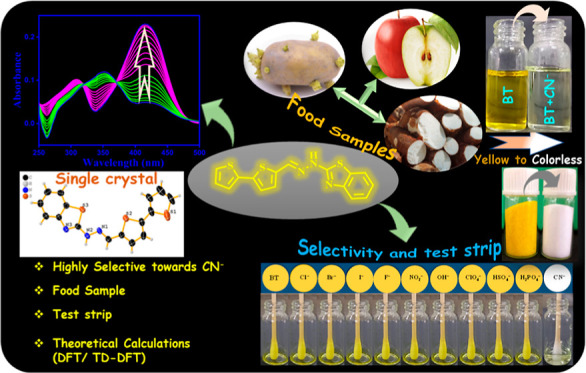
A newly synthesized Schiff’s base 2-(2-([2,2′-bithiophen]-5-ylmethylene)hydrazinyl)benzothiazole (BT) was obtained from the condensation reaction between 2-hydrazinobenzothiazole and 2,2-bithiophene-5-carboxaldehyde. The prepared probe BT was subjected to a confirmation of the structural arrangement through NMR, FTIR, ESI-HRMS, and single-crystal XRD spectral analysis. The BT colorimetric sensor showed selectivity and sensitivity toward the cyanide (CN–) ion over other common anions such as ClO4–, Cl–, Br–, F–, I–, NO2–, OH–, HSO4–, and H2PO4– in a partial aqueous system CH3CN/H2O (8:2, v/v). The probe BT detects CN– with the lowest detection range as low as 1.33 × 10⁻⁸ M (3.59 ppm); in comparison to that given by WHO guidelines, it is significantly lower. The stoichiometric interaction between the probe BT and analyte CN– was found to be 1:1 (BT/CN–) binding mode using Jobs plot, and further association binding affinity was calculated to be 6.64 × 10⁻³ M–1. Additionally, these results were further supported by the FTIR and DFT calculations, as well as the 1H NMR titration analysis, which complemented the binding data. The sensor probe BT was successfully employed in a cotton swab test kit approach and also in smartphone-assisted applications for the determination of CN– ions. Finally, the outstanding sensing properties of probe BT aided the quantitative detection of CN– ions, and it could be further applied to a variety of food samples, including apple seeds, sprouting potatoes, and cassava.
1. Introduction
The anions responsible for the advancement of many biological and environmental processes are essential. Cyanide (CN–) ions are one of the most noxious inorganic anions for living beings.1 A number of physiological processes can be disrupted as a result, including hypoxia, vascular necrosis, vision impairment, respiratory failure, endocrine disorders, nerve damage, and even death.2 There are several chemicals that are capable of blocking the electron transport chain during cellular respiration as a result of blocking the functioning area within cytochrome c. The heme group iron can be bound to Fe3+, which can have a negative impact on the oxygen supply.1 Additionally, it disrupts electron transport in mitochondrial membranes, resulting in a decrease in respiration in all aerobic organisms. In living things, it may cause death upon absorption through the skin, lungs, and digestive tract.3 In the event that it emits unexpected or unintended emissions, those emissions could poison the water supply, which would endanger the ecosystem. In drinkable water, CN– at 1.9 μM has been determined to be acceptable by the World Health Organization (WHO).4 It is still common to use cyanide compounds in many industries, such as electroplating, plastic manufacture, polymer production, and medicine.5 Due to its wide industrial applications, and the harm it poses to humans and the environment, it is desirable to build a highly precise, fast sensor to detect CN– in ambient samples.6 Analytical and spectroscopic techniques have all been employed to detect cyanide, such as voltammetry, chromatography, colorimetry,7,8 and UV–visible and fluorescence spectroscopy.9,10 By utilizing absorbance and emission spectroscopic techniques, anions can easily be detected and quantified in various solvent systems, including biological systems, at low cost and with high sensitivity.11 Despite their low sensitivity and high cost, these approaches have limited applications.12 Although colorimetric sensors have been attractive not only for their affordability but also for their high selectivity, sensitivity, and ease of use, they have gained considerable attention over the past few years.13
The molecular design for detecting CN– is based on two criteria, as demonstrated by previously published reports. A donor and acceptor unit are attached to a binding unit such as an alkene14−16 or a functional group containing liable hydrogen.17,18 In addition to nucleophilic substitution of CN– at alkene carbons or by capturing liable hydrogen as HCN, performing intramolecular charge transfer (ICT) results in changes in photophysical properties that allow CN– to be detected. In the literature, there are few reports on deprotonation followed by ICT with CN–, which have special properties in terms of specificity and sensitivity.19,20 Therefore, a new probe was designed, as illustrated in Scheme 1, where hydrazine (–C=N–NH−) is linked to hydrazine-benzothiazole and bithiophene, which act as both acceptors and donors. Furthermore, all three units have pharmacological significance.21,22 Hence, this paper explores new Schiff base-derived colorimetric probes (BT) for CN– recognition, its synthesis, characterization, and sensing performance.
Scheme 1. Schematic Synthetic Method of Probe BT.

2. Experimental Section
2.1. Chemicals and Methods of Analytical Measurements
All the starting materials 2-hydrazinobenzothiazole were received from TCI Chemicals, Chennai. 2,2-Bithiophene-5-carboxaldehyde was received from Sigma-Aldrich. The TBA salts (tetrabutylammonium salts) were used as anion sources such as ClO4–, Cl–, Br–, I–, NO2–, OH–, F–, CN–, HSO4–, and H2PO4– ions, which were purchased from Sigma-Aldrich and used as received. In the study, the obtained chemicals were of the highest purity and were used without further purification prior to their use. For the FT-IR analysis, we used the Nicolet iS50 spectrum spectrophotometer (FT-IR) (Thermo Scientific, USA). It measures the spectrum from 4000 to 400 cm–1. The structure confirmation was performed by 1H and 13C (400 and 100 MHz, respectively) measurements performed with a Bruker AVANCE-II 400 spectrometer in deuterated dimethyl sulfoxide (DMSO-d6). ESI-HRMS data were analyzed using the Waters Xevo G2-XS mass spectrometer. By using the JASCO V-7000 spectrophotometer, the absorbance spectral response was measured. To measure the pH of the solutions, a Sartorius basic bench top pH-meter PB-10 m was utilized.
The preparation of stock solutions for various anions in double distilled water was used to prepare 1 × 10⁻³ M solution of competitive anions like NO2–, OH–, HSO4–, F–, H2PO4–, CN–, Cl–, ClO4–, Br–, and I– was used as their tetrabutylammonium salts as an anion source. In a similar way, the probe stock solution was made in CH3CN (1 × 10⁻³ M); this solution was further diluted in accordance with the requirements. Moreover, the working sample concentration prepared using CH3CN/H2O (8:2, v/v) was fixed as per the water tolerance studies.
2.2. Synthesis of BT
To a round-bottom flask equipped with a magnetic stirrer bar was added 5 mL of ethanol, with respective addition of both starting materials 2,2-bithiophene-5-carboxaldehyde (0.1 g, 1 equiv) and 2-hydrazinobenzothiazole (0.085 g, 1 equiv), which was stirred for 5 min, and then 20 mL of conc. H2SO4 was dropped into the reaction mixture. Further, this reaction was vigorously stirred for 1 h at ambient temperature. The improvement of the reaction was monitored by a TLC technique. The resulting solid was filtered out, treated with ethanol three times, dried, and further crystallized once more with acetonitrile. Different spectroscopic measurements were used to verify the desired product (BT): yield 93%. FT-IR (cm–1) (Figure S1): 3020 (−NH), 1481 (C–H), 1684 (C–C), and 1617 (C=N). 1H NMR (400 MHz, DMSO-d6) δ (Figure S2): 11.48 (s, 1H), 8.20 (s, 1H), 7.59 (s, 1H), 7.58 (t, J = 7.14 Hz, 1H), 7.40 (t, J = 8, 1H), 7.31 (d, J = 5.32 Hz, 1H), 7.13 (d, J = 7.11, 2H), 7.12 (t, J = 7.4, 2H). 13C NMR (100 MHz, DMSO-d6) (Figure S3): 165.19, 159.77, 150.60, 141.28, 140.52, 134.21, 128.81, 126.75, 125.49, 125.25, 122.86, 122.61, 121.15, 119.90, 119.35, 117.79. The HRMS study reveals that the experimentally found mass was 361.1454 and the calculated mass was found to be 361.1460 (Figure S4).
3. Results and Discussion
A simple Schiff base was used to synthesize the designed probe BT, as shown in Scheme 1. The BT structure was confirmed by using Sc-XRD analysis methods. Sensing studies were conducted after successful confirmation of the target molecule.
3.1. Single-Crystal X-ray Diffraction Studies of Probe BT
The gold color crystal of probe BT was obtained by a slow evaporation method using acetonitrile as a solvent at room temperature. Single-crystal X-ray structural data of the probe BT were collected on a CMOS-based Bruker D8 Venture PHOTON 100 diffractometer equipped with an INCOATEC microfocus source with graphite monochromated Mo Kα radiation (λ = 0.71073 Å) operating at 50 kV and 30 mA. Figure 1 shows the molecular graphic of RT4 drawn by using ORTEP3v2. The Apex228 package was used for cell refinements and data reductions. The structure was solved by direct methods using the SHELXS-9729/1 or Superflip30 program with the OLEX231 graphical user interface. Structural refinements were carried out using SHELXL-2018.32. The crystallographic details are summarized in Table S1. CCDC 2286272 was deposited.
Figure 1.
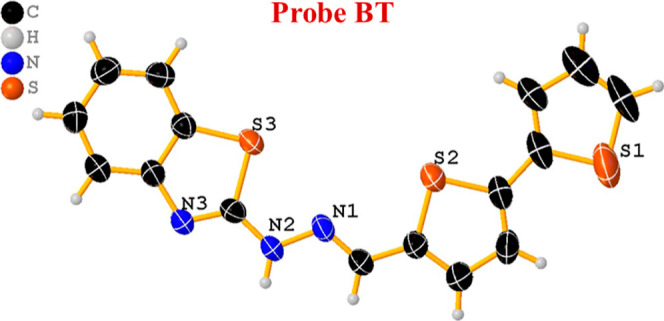
Single-crystal X-ray structure of probe BT.
3.2. Colorimetric Sensing of CN–
In order to determine the detection ability of probe BT, highly selective and sensitive studies were evaluated using a UV–visible spectrophotometer. We investigated the sensing ability of BT to detect different anions including Br–, I–, F–, OH–, HSO4–, and CN–, Cl–, ClO4–, NO2, and H2PO4– in a partial aqueous system with 8:2 v/v ratio of CH3CN/H2O, as displayed in Figure 2a. When CN– is added to the probe displayed by BT, the yellow color rapidly changes into colorless. With the individual addition of the aforementioned competitive anion species, there were no visible detectable color changes noticed. As a result of this observation, the probe proved to be highly selective for CN– ions. Based on the naked-eye results, the free probe BT exhibits two absorbance bands centered at 308 nm, which correspond to n–π* and at 416 nm corresponding to π–π* transitions, as displayed in Figure 2b. The 10 equiv of CN– ion into the BT, the π–π* transition experienced a blue shift, while n–π* diminished to a large extent. The competing anions did not display any spectral alterations in the presence of probe BT, indicating that it was only selective for the CN– ion in the partial-aqueous media.
Figure 2.

(a) Photographic image of visual color changes of probe BT in the presence of various anion sources; (b) absorption spectral response of probe BT (2 × 10⁻⁵ M; CH3CN/H2O; 8:2, v/v) with various anions 10.0 equiv. (c) Absorption spectral evidence of the anion CN– ion (0–15 equiv) titrate against probe BT.
To further investigate the binding interaction of BT with CN–, UV–vis spectrophotometric titration of BT was carried out by subsequent addition of the CN– ion (Figure 3b). With the incremental addition of the CN– ion (0–15 equiv) to the probe, there was a noteworthy blue-shift change clearly noticed with two clear isosbestic points at 374 and 314 nm. These results strongly indicated the formation of new species. We carried out interference studies on probe BT to determine its selectivity for CN–. In order to test probe BT, 10 equiv of the proper competing anions were first used, followed by CN– ions. Its absorption band at 350 nm is similar to that of the BT–CN– system.
Figure 3.

(a) Benesi–Hildebrand (BH) plot for BT with CN– and (b) linear plot based on the titration of BT with variations in the concentrations of CN–.
From UV–vis spectral titration data, the association constant (Ka) value was calculated using the standard equation BH was applied to find the Ka = 6.64 × 10³ M–1 as shown in Figure 2a. According to the spectral data, the LOD of BT–CN– was calculated at 1.33 × 10⁻⁸ M (3.59 ppm) (Figure 3b). It was necessary to measure the BT absorption spectrum 10 times to determine the standard deviation (SD) of the blank sample. The linear plot of the BT intensity at 416 and 350 nm could be seen by plotting it against the concentration of CN–. The LOD was calculated using the formula below
where σ is the SD of a blank sample and S is the slope of the calibration line (0–15 μM), as determined through nonlinear regression analysis.23
3.3. Job’s Plot and Response Time
To measure the affinity of CN– ions for probe BT, the Jobs plot method was performed using stock solutions of BT and CN– (1 × 10⁻⁵ M in partially aqueous acetonitrile). The equilibrium concentration of BT and CN– was determined using a plot of the absorption intensity vs mole fraction of the cyanide ions at 350 nm (Figure 4a). The cross-section points in Jobs plot at 0.5 mole fraction undoubtedly demonstrates a 1:1 stoichiometric binding ratio between BT and CN– ions.
Figure 4.

(a) Job’s plot displays a 1:1 binding ratio of BT with cyanide ion (CN–). (b) Time response of BT with CN–.
A study was carried out to examine the relationship between probe BT and probe CN– in terms of time-dependence. Figure 4b shows that the absorbance intensities of BT were enhanced after the addition of CN– ions, which reached their lowest values after 40 s and remained stable after 160 s. Thus, in real-time monitoring, the probe BT was able to detect CN– ions in the ambient environment. As a result of the faster interaction between the analyte and probe, the detection time was lesser to 40 s. As a result, BT could detect CN– ions in partial aqueous environments more rapidly.
3.4. Reversibility and Effect of pH
To assess the reversibility of probe BT to CN– ions, trifluoroacetic acid (TFA) was used as a protonating agent. Therefore, BT was confirmed in the presence of CN– and TFA. It was clear that at 416 nm, the free sensor was yellow in color. In this study, it was discovered that when CN– was added to the sensor, the absorption peak remained the same at 308 and 416 nm of the probe, which may shift it to 350 nm and change its color to colorless absorbance intensity only.BT was demonstrated to undergo deprotonation and protonation, and its reversibility was shown to be effective without sensitivity loss (Figure 5a,b). The BT can detect CN– ions selectively in real samples based on multiple cyclic experiments.
Figure 5.

(a) Reversibility studies of probe BT with TFA before and after the addition of CN– ions. (b) Plausible interaction mechanism of CN– with probe and reversible with TFA.
A pH test was conducted to examine the impact of pH changes on CN– ion sensing abilities, although CN– ion sensing was available at the original pH of the solution. The pH range of sample solutions was 1–11, determined using the PBS buffer solution. In order to regulate the pH, appropriate amounts of NaOH and HCl were added. Due to the fact that the PBS buffer absorbs only a small amount of visible and UV light and does not adversely affect biochemical reactions, it was chosen as the buffer. When CN– ions were added to the BT solution, the absorption peak at 350 nm considerably enhanced in the pH range of 5.0–11.0. Over the pH range of 5–11, BT and BT–CN– solutions were yellow and colorless, respectively. Considering the pH range of 5.0–11.0, the chemosensor BT may prove useful in biological, chemical, and environment sample analysis as a colorimetric sensor for CN– ion detection (Figure S5).
3.5. Interference Studies of BT with CN–
The possibility of interference was investigated by using UV–vis spectra. The BT–CN– complex solution does not change as more anions are introduced. It was still possible to keep the absorbance values consistent despite increasing the amount of competing anions (Figure 6). As a result of these observations, the probe BT was used as a chemosensor in aqueous media to detect CN–. We tested the probe (BT) absorbance response using a variety of cations, including Al(III), Cr(III), Na(II), Ca(II), Hg(II), Fe(III), Mg(II), Cu(II), Cd(II), Pb(II), Zn(II), and Mn(II). However, as can be seen in Figure S6, there are no metal ions that interact with this probe.
Figure 6.

Interference studies of BT and CN– with other anion interactions’ absorbance at 350 nm.
3.6. Binding Mechanism
To gain better insight into the sensing mechanism (Scheme 2) of probe BT to CN–, the 1H NMR titration spectra, IR spectrum, and HRMS mass were studied. In the 1H NMR titration spectra (Figure 7), before the addition of cyanide anions, the 1H NMR chemical shifts of the –NH protons on BT were at δ 11.4 ppm. With the addition of CN–, the –NH proton completely disappeared by deprotonation. Upon the gradual addition of CN–, all aromatic protons exhibited an upfield shift on different levels, which suggests an increase in the electron density in the thiophene ring and benzothiazole ring through charge delocalization in the conjugated system.
Scheme 2. Plausible Binding Mechanism of CN– with Probe BT.

Figure 7.

1H NMR spectra of probe BT and BT–CN– in DMSO–d6.
This observation indicates the deprotonation of –NH protons toward the sensing of cyanide anions. It may be presumed that upon deprotonation, the lone pair of nitrogen is readily available for donation. These lone pairs are further involved in ICT from the nitrogen site to the benzothiazole, resulting in an enhancement in the chromophore intensity. Moreover, the BT–CN system upon interaction with a protonating agent like TFA had a significant change in intensity along with a colorimetric change from yellow to colorless, and the same was observed in NMR titration. This further illustrates that due to the deprotonation effect, there is an aromatic ring electron density increase, so that it moves to the high field. In addition, we also performed infrared spectroscopy experiments to prove the mechanism. In the IR spectrum of BT, the stretching vibration absorption peaks of –NH and HC=N appeared in 3020 and 1617 cm–1, respectively. However, when BT met with CN–, the stretching vibration peaks of –NH and HC=N absorption miraculously disappeared. This is clear proof of the interaction of BT with CN– resulting from the deprotonation effect. Moreover, from the HRMS data, we can also see an obvious peak at m/z 340.0101 assignable to BT-H+, BT + HCN– (m/z 366.2107), and BT + HCN– + TBA (m/z 608.2401). This also supports the deprotonation phenomena of BT. This common phenomenon could be explained by the proposed sensing mechanism shown in Scheme 2.
Based on hydrazide as a binding site, probe BT was compared with previously published CN– colorimetric and fluorescence probes in nanomolar level detection in Table S2, In colorimetric detections where showed in Table S3 other previous reports are showed in Table S4. The comparison indicated that BT had better performance in terms of sensitivity, selectivity, LOD, and response time. In addition, cotton-swab-based test strips and food samples have been extensively used for the detection of CN–.
3.7. Theoretical Study
In order to further examine the sensor characteristics of the BT toward the CN– ion detection mechanism and changes in its photophysical characteristics, density functional theory calculations and time-dependent density functional theory calculations (TD-DFT) were carried out. The geometry of molecules in the BT and BT–CN– series was optimized at the B3LYP/6-31G** level of theory.24,25 Moreover, frequency calculations were performed at the same level to verify the minimization of energy. The optimized ground-state geometries of the free probe BT and cyanide-associated probe BT–CN– are shown in Figure 8.
Figure 8.

(a,b) Structural optimization of free probe BT and after deprotonation with CN– ions using the B3LYP/6-31G** level of theory.
The geometry of both free probe BT and its deprotonated BT was extremely prearranged. As compared to the HOMO electron, the bithiophene electron has a greater electron density. In LUMO, both bithiophene and 2-hydrazinobenzothiazole moieties contained almost the same number of electrons. The electron density in BT–CN– was pushed toward hydrazinobenzothiazole due to the electronegativity of CN–. As a result of the two nitro substituents, bithiophene has an electron density of 0 in LUMO. A comparison is made between the theoretically calculated band gap values for HOMO and LUMO and the experimental results shown by Tauc’s plots (Figures 9 and 10). The calculated band gap was in good agreement with the experimentally observed values of BT (3.2186 3.5703 eV) and BT–CN– (4.0454 4.0027 eV). The highest absorbance of free probe BT is observed at 416 nm, which is mostly related to the 97.5% electronic transition from HOMO to LUMO with an oscillator strength of 0.698.
Figure 9.

(a,b) Band gap energy of BT and BT–CN– from Tauc’s plots.
Figure 10.
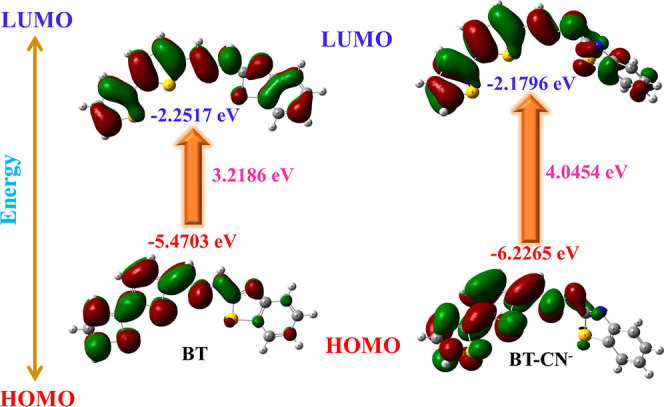
Probe BT and its CN– complex orbital distribution and band gap energies at the B3LYP/6-31G** level of theory.
The BT–CN– complex, on the other hand, displays absorption peaks at 350 nm that are primarily related to electronic transitions (94.8%) from HOMO to LUMO with oscillator strengths of 0.0510. The highest electronic charge distribution of complex BT–CN– is HL with 91%. However, probe BT has a major electronic charge distribution of H-1L, which accounts for 97.5% of its electronic charge. A detailed description of probe BT and its ability to calculate electronic structure, higher-energy states, orbital shifts, and oscillator strength in conjunction with BT–CN– calculations is provided in Tables S5 and S6.
3.8. Paper Strips-Based Investigations
In order to perform the real-time hands-on application of the colorimetric probe BT, a ready-to-dip test kit was made with probe-fabricated cotton swabs dipped in several anion solutions. The naked eye test clearly revealed that the probe is selective toward CN– ions and the visual changes of color from yellow to colorless for CN–. In the case of other tested competitive ions, detectable changes were noticed without any interference (Figure 11).
Figure 11.

Naked eye representation of BT cotton swab test kit images in the presence of competing anions and CN–.
Furthermore, the various concentrations of CN– ion solutions also verified the gradual color change and detection ability of the cotton swab-loaded probe (Figure 12a). In addition, they also showed the solid-state sensing ability of the probe (Figure 12b). As a result, the sensor strips have promising future applications in the on-the-spot monitoring and quantification of CN– ions in water. As a result, “incredibly simple” test kits were quite alluring for CN– ion detection in water without the requirement of specialized tools. Additionally, we are interested in checking whether the test strip fabricated with probe BTcan be used to monitor the spoilage of food samples. For this, the fabricated strip was tied with thread and sagging above 1 cm of the test samples (Figure 12c). This was left for 12 h at room temperature, and the fabricated test strip color turned from yellow to colorless, which was due to the presence of CN– ion vapors or humidity drops. This experiment clearly suggested that the designed probe BT can effectively sense CN– ions in various food samples, and it can be used to monitor the spoilage of food samples like cassava and potatoes.
Figure 12.
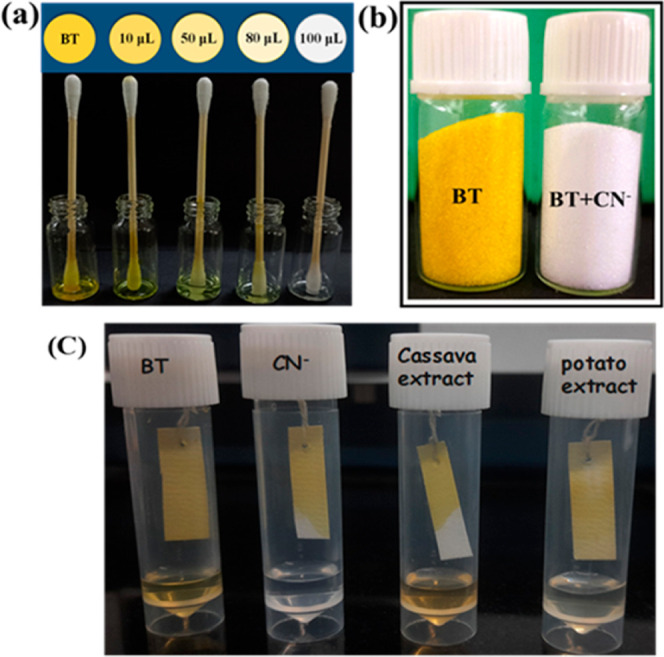
(a) BT with the addition of CN– in different concentrations; (b) solid-state visual changes in the color of BT before and after being treated with CN– ions; and (c) BT fabricated test paper for monitoring CN– ions in various environments.
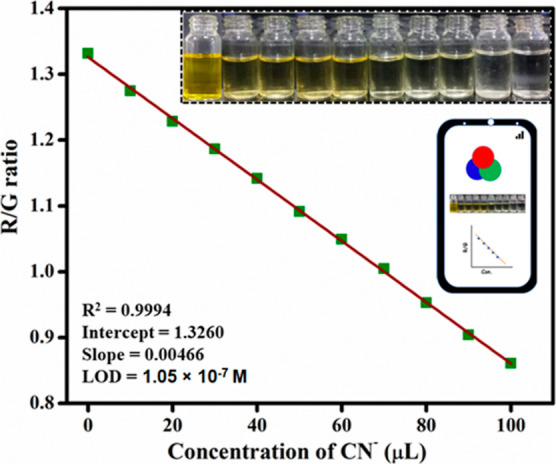
3.9. Smartphone-Assisted CN– Ion Recognition
We developed a smartphone-based color assist application for detecting CN– in a CH3CN/H2O (8:2, v/v) solvent system as a result of the distinct color change of BT with CN–. The gradual addition of CN– alters the concentration of the BT test solution from 0 to 100 μL. RGB (red, green, and blue) values were measured. As seen in Figure 13, the presence of CN– ions caused the probe BT yellow color solution to turn colorless. The R/G plot was shown against the ratio of BT versus various concentrations of CN– ions, and these values show a reasonable linear curve (R2 = 0.9994). The limit of detection was determined from this linear plot and found to be 1.05 × 10⁻⁷ M. The aforementioned findings suggested that the Android mobile phone-assisted color software would be able to offer a cheap and immediate detection of CN– ions in actual samples.
Figure 13.
Smartphone-assisted colorimetric detection of CN– ions calibration plot.
3.10. Food Sample Analysis
To further examine the performance of probe BT in detecting endogenous CN–, we used cyanogenic glycoside-containing food samples such as apple seeds, sprouting potatoes, and cassava. A 1.0 g sample of the foods was crushed first, and then 50 mL of water and 0.1 g of NaOH were added. During the fermentation process, the solution turned murky (muddy in color) after 5 days. After the mixture was filtered, the CN– containing solution was centrifuged, collected, and further diluted before testing. By adding the cyanide-containing solution to BT, a significant portion of CN– was absorbed at 350 nm. As shown in Figure 14a,b, CN– is clearly visible in the bar graph representation of the food sample. Therefore, BT may be utilized as a real-time and straightforward visual color change sensor to measure CN– in food samples. It was demonstrated that the probe BT was suitable for the sensing and measurement of CN– ions in environmental samples based on colorimetric changes.
Figure 14.

(a) Absorbance spectral response of free probe BT with various staple food samples along with CN– ions. (b) Bar graph representation of the food sample absorbance at 350 nm.
4. Conclusions
In summary, we have designed, constructed, and structurally characterized a benzothiazole-based colorimetric probe BT that responds to CN– ions with high sensitivity and selectiveness. It was demonstrated that a combination of absorbance spectroscopic results and naked-eye detection of lower concentrations of CN– ions can be achieved. Furthermore, this colorimetric detection method for CN– ions is sensitive and does not suffer from the presence of other common anions. Therefore, the developed probe BT detected CN– ions very efficiently even at their lower limits of 1.33 × 10⁻⁸ M (3.59 ppm); this is lower than the WHO recommendations for drinking water. The sensing mechanism was strongly corroborated by the Jobs plot, FTIR, 1H NMR titration spectra, and DFT calculations, which demonstrated that a 1:1 BT–CN– complex had formed. Investigations with probe BT-based colorimetric test strips show that they have tremendous opportunities in applications related to the environment. Moreover, the BT sensor has been used for the determination of CN– in various food samples, such as cassava, sprouting potatoes, and apple seeds, with satisfactory results. Hence, the novel BT probe has potential applications in environmental monitoring and food processing.
Acknowledgments
We gratefully thank the Vellore Institute of Technology, Vellore, for providing us with research facilities and VIT-SAIF-Vellore Institute of Technology, Vellore. Dr. R.B. thankfully acknowledges the Indian Council of Medical Research—Research Associateship (ICMR-RA) (sanction no. 45/21/2022-BIO/BMS), New Delhi.
Supporting Information Available
The Supporting Information is available free of charge at https://pubs.acs.org/doi/10.1021/acsomega.3c06057.
FT-IR, 1H NMR, and 13C NMR spectra, mass spectroscopy analyses, effect of pH, interference studies, and comparison of BT with other reported probes (PDF)
The authors declare no competing financial interest.
Supplementary Material
References
- Zalmi G. A.; Nadimetla D. N.; Kotharkar P.; Puyad A. L.; Kowshik M.; Bhosale S. V. Aggregation-Induced Emission-Based Material for Selective and Sensitive Recognition of Cyanide Anions in Solution and Biological Assays. ACS Omega 2021, 6, 16704–16713. 10.1021/acsomega.0c06080. [DOI] [PMC free article] [PubMed] [Google Scholar]
- Chen L.; Tian X.; Xia D.; Nie Y.; Lu L.; Yang C.; Zhou Z. Novel Colorimetric Method for Simultaneous Detection and Identification of Multimetal Ions in Water: Sensitivity, Selectivity, and Recognition Mechanism. ACS Omega 2019, 4, 5915–5922. 10.1021/acsomega.9b00312. [DOI] [PMC free article] [PubMed] [Google Scholar]
- Kumar A.; Kumar R.; Kumar S. Cyanide-Ion-Induced J-Aggregation of Merocyanine Dye for Paper-Based Colorimetric Detection in Water. ChemistrySelect 2021, 6, 3022–3032. 10.1002/slct.202100147. [DOI] [Google Scholar]
- Gupta V. K.; Singh A. K.; Gupta N. Colorimetric sensor for cyanide and acetate ion using novel biologically active hydrazones. Sens. Actuators, B 2014, 204, 125–135. 10.1016/j.snb.2014.07.029. [DOI] [Google Scholar]
- Hoysrijan B.; Sirikulkajorn A. Colorimetric and fluorogenic detection of nitrite anion in water and food based on Griess reaction of fluorene derivatives. J. Food Compos. Anal. 2023, 117, 105123. 10.1016/j.jfca.2022.105123. [DOI] [Google Scholar]
- Shiraishi Y.; Nakamura M.; Hayashi N.; Hirai T. Coumarin-Spiropyran Dyad with a Hydrogenated Pyran Moiety for Rapid, Selective, and Sensitive Fluorometric Detection of Cyanide Anion. Anal. Chem. 2016, 88, 6805–6811. 10.1021/acs.analchem.6b01279. [DOI] [PubMed] [Google Scholar]
- Shaily; Kumar A.; Ahmed N. Indirect Approach for CN- Detection: Development of “Naked-Eye” Hg2+-Induced Turn-Off Fluorescence and Turn-On Cyanide Sensing by the Hg2+ Displacement Approach. Ind. Eng. Chem. Res. 2017, 56, 6358–6368. 10.1021/acs.iecr.7b00188. [DOI] [Google Scholar]
- Tomasulo M.; Raymo F. M. Colorimetric Detection of Cyanide with a Chromogenic Oxazine. Org. Lett. 2005, 7, 4633–4636. 10.1021/ol051750m. [DOI] [PubMed] [Google Scholar]
- Lee J. H.; Jang J. H.; Velusamy N.; Jung H. S.; Bhuniya S.; Kim J. S. An intramolecular crossed-benzoin reaction based KCN fluorescent probe in aqueous and biological environments. Chem. Commun. 2015, 51, 7709–7712. 10.1039/C5CC02234G. [DOI] [PubMed] [Google Scholar]
- Lin W.-C.; Hu J.-W.; Chen K.-Y. A ratiometric chemodosimeter for highly selective naked-eye and fluorogenic detection of cyanide. Anal. Chim. Acta 2015, 893, 91–100. 10.1016/j.aca.2015.08.044. [DOI] [PubMed] [Google Scholar]
- Korkmaz C.; Ay Ö.; Ersoysal Y.; Köroğlu M. A.; Erdem C. Heavy metal levels in muscle tissues of some fish species caught from north-east Mediterranean: Evaluation of their effects on human health. J. Food Compos. Anal. 2019, 81, 1–9. 10.1016/j.jfca.2019.04.005. [DOI] [Google Scholar]
- Wang S.; Xu H.; Yang Q.; Song Y.; Li Y. A triphenylamine-based colorimetric and “turn-on” fluorescent probe for detection of cyanide anions in live cells. RSC Adv. 2015, 5, 47990–47996. 10.1039/C5RA05807D. [DOI] [Google Scholar]
- Lee K.-S.; Kim H.-J.; Kim G.-H.; Shin I.; Hong J.-I. Fluorescent Chemodosimeter for Selective Detection of Cyanide in Water. Org. Lett. 2008, 10, 49–51. 10.1021/ol7025763. [DOI] [PubMed] [Google Scholar]
- Jeyasingh V.; Murugesan K.; Lakshminarayanan S.; Selvapalam N.; Das G.; Piramuthu L. A molecular phototropic system for cyanide: Detection and sunlight driven harvesting of cyanide with molecular sunflower. Spectrochim. Acta, Part A 2020, 234, 118207. 10.1016/j.saa.2020.118207. [DOI] [PubMed] [Google Scholar]
- Chemchem M.; Yahaya I.; Aydıner B.; Doluca O.; Seferoğlu N.; Seferoğlu Z. Substituent dependent selectivity of fluorescent chemosensors derived from coumarin for biologically relevant DNA structures and anions. Sens. Actuators, B 2020, 305, 127316. 10.1016/j.snb.2019.127316. [DOI] [Google Scholar]
- Li C.; Yin P.; Li T.; Wei T.; Hu T.; Chen J.; Qin X.; Niu Q. Rapid and sensitive detection of hypochlorite in ∼100% aqueous solution using a bithiophene-based fluorescent sensor: Application to water analysis and live-cell imaging. J. Mol. Liq. 2020, 320, 114396. 10.1016/j.molliq.2020.114396. [DOI] [Google Scholar]
- Li C.; Niu Q.; Li T.; Wei T.; Hu T.; Chen J.; Qin X.; Yang L. A novel dual-function bithiophene-Meldrum’s acid based chemosensor for highly sensitive, colorimetric and fluorimetric detection of cyanide and hypochlorite and its applications. Dyes Pigm. 2020, 180, 108459. 10.1016/j.dyepig.2020.108459. [DOI] [Google Scholar]
- Guo Z.; Hu T.; Sun T.; Li T.; Chi H.; Niu Q. A colorimetric and fluorometric oligothiophene-indenedione-based sensor for rapid and highly sensitive detection of cyanide in real samples and bioimaging in living cells. Dyes Pigm. 2019, 163, 667–674. 10.1016/j.dyepig.2018.12.057. [DOI] [Google Scholar]
- Christopher Leslee D. B.; Karuppannan S.; Kothottil M. M. Carbazole-hydrazinobenzothiazole a selective turn-on fluorescent sensor for Hg2+ ions-Its protein binding and electrochemical application studies. J. Photochem. Photobiol., A 2021, 415, 113303. 10.1016/j.jphotochem.2021.113303. [DOI] [Google Scholar]
- Borah N.; De S.; Gogoi A.; Das G. A series of benzothiazole-based Schiff bases for the colorimetric sensing of fluoride and acetate ions: acetate-induced turn-on fluorescence for selectivity. New J. Chem. 2020, 44 (43), 18703–18713. 10.1039/D0NJ03516E. [DOI] [Google Scholar]
- Tamizhselvi R.; Arumugam Napoleon A. A simple sulfonohydrazide Schiff base molecular probe for colorimetrically selective recognition of Cu2+ ion in Semi-Aqueous medium. Inorg. Chem. Commun. 2022, 139, 109330. 10.1016/j.inoche.2022.109330. [DOI] [Google Scholar]
- Dhanasekaran K.; Napoleon A. A. Pyrene derived imine functionalized moiety for highly selective colorimetric detection of Cu2+ ion real time sample with supportive DFT studies. Inorg. Chem. Commun. 2023, 151, 110481. 10.1016/j.inoche.2023.110481. [DOI] [Google Scholar]
- Tamizhselvi R.; Arumugam Napoleon A. Ninhydrin and isatin appended 2-Hydrazinobenzothiazole based simple Schiff bases for colorimetric selective detection of Cr3+ and Pb2+ ions. Inorg. Chem. Commun. 2022, 145, 109983. 10.1016/j.inoche.2022.109983. [DOI] [Google Scholar]
- Bhaskar R.; Sarveswari S. 3-Formyl Quinoline Based Reusable Selective Colorimetric Sensor for Cyanide Ion and Its Application to the Molecular Logic Gate. Sens. Lett. 2019, 17, 344–351. 10.1166/sl.2019.4068. [DOI] [Google Scholar]
- Karuppusamy P.; Sarveswari S. A 4-phenyl thiophene appended 2,4-dinitrophenylhydrazone as a colorimetric chemosensor for selective detection of cyanide ion and its application for real-life samples. J. Mol. Struct. 2022, 1248, 131494. 10.1016/j.molstruc.2021.131494. [DOI] [Google Scholar]
Associated Data
This section collects any data citations, data availability statements, or supplementary materials included in this article.