

Abstract

CO2 adsorbents comprising various alkaline sorption active phases supported on mesoporous Al2O3 were prepared. The materials were tested regarding their CO2 adsorption behavior in the mid-temperature range, i.e., around 300 °C, as well as characterized via XRD, N2 physisorption, CO2-TPD and TEM. It was found that the Na2O sorption active phase supported on Al2O3 (originated following NaNO3 impregnation) led to the highest CO2 adsorption capacity due to the presence of CO2-philic interfacial Al–O––Na+ sites, and the optimum active phase load was shown to be 12 wt % (0.22 Na/Al molar ratio). Additional adsorbents were prepared by dispersing Na2O over different metal oxide supports (ZrO2, TiO2, CeO2 and SiO2), showing an inferior performance than that of Na2O/Al2O3. The kinetics and thermodynamics of CO2 adsorption were also investigated at various temperatures, showing that CO2 adsorption over the best-performing Na2O/Al2O3 material is exothermic and follows the Avrami model, while tests under varying CO2 partial pressures revealed that the Langmuir isotherm best fits the adsorption data. Lastly, Na2O/Al2O3 was tested under multiple CO2 adsorption–desorption cycles at 300 and 500 °C, respectively. The material was found to maintain its CO2 adsorption capacity with no detrimental effects on its nanostructure, porosity and surface basic sites, thereby rendering it suitable as a reversible CO2 chemisorbent or as a support for the preparation of dual-function materials.
1. Introduction
CO2 capture from flue gases is gaining significant interest during our attempt to curb CO2 emissions into the atmosphere.1 A common approach for the capture of CO2 involves its adsorption from solid materials.2 They can generally be separated into two categories, materials that capture CO2 at lower temperatures (e.g., room temperature), which include zeolites, activated carbons, and metal–organic frameworks,2−4 and those that are suitable for capturing CO2 at higher temperatures (e.g., 200 °C and up to 800 °C) via chemical adsorption, which include alkaline oxides/carbonates and ceramic materials.2,5,6 The so-called medium-temperature CO2 capture refers to adsorption temperatures between roughly 200 and 400 °C.5 At this temperature range, the most widely investigated materials are MgO-type oxides promoted with alkali metal nitrates.7−9
Another class of materials that can capture CO2 at this mid-temperature range includes alkaline oxides or carbonates that are dispersed over a high surface area support, most commonly Al2O3 (MgO, CaO, Na2CO3/NaHCO3/Na2O, K2CO3/KHCO3/K2O, etc.).10−16 These dispersed supported alkaline adsorbents have been reported to capture CO2 at much lower temperatures compared to their bulk counterparts, due to the higher exposed surface of the respective active adsorbent phase.11,12,14,17 It has been shown that CO2 is adsorbed as weakly bound carbonates over such dispersed alkaline phases and, as such, the supported adsorbent can be reversibly regenerated under mild conditions.12,15 For example, Gruene et al.12 reported that CaO dispersed over Al2O3 can capture CO2 up to 1.7 times more efficiently at 300 °C compared to bulk CaO powder, while it can also be reversibly regenerated after calcination at just 650 °C, thus circumventing the problems related to CaO sintering. Moreover, Keturakis et al.15 investigated Na2O/Al2O3 sorbents for medium-temperature CO2 chemisorption at 200 and 400 °C and found that CO2 is mostly adsorbed in the form of bicarbonates and bidentate/polydentate carbonates at Al–O– sites and on Na2CO3 supported nanoparticles.
A very important advantage of such supported CO2 adsorbents is their potential application in sorption enhanced reactions, mostly following the additional incorporation of a catalytically active phase.18−21 Alternating layers of Pt/Al2O3 and CaO/Al2O3, as well as Ni–CaO–Al2O3, have, for example, been employed for sorption-enhanced water–gas shift and steam reforming of ethanol; the capture of the CO2 product was working to drive the reaction to the forward direction via the Le’ Chatelier principle.22,23 Another important application of such supported adsorbents is in the emerging field of dual-function materials.19 The flagship examples are Ru/CaO/Al2O3 and Ru/Na2O/Al2O3, which have been extensively studied for the integrated CO2 capture and methanation process, where CO2 is first captured by the sorption active phase, followed by its conversion into methane upon H2 inflow by the catalytically active phase.19,24,25 Various other combinations of supported adsorbents and active metal phases have been reported over the recent years, including RuNi/Na2O/Al2O3, Ru/BaO/Al2O3, Ru/Al2O3 + NaNO3/MgO, Ru/CeO2 + (Li, Na, K)NO3/MgO, etc.19,26−28 Even Na–Al2O3 (Na2CO3/Al2O3) alone, without any additional metallic active phase, has been investigated during the integrated CO2 capture and conversion to syngas process.29
Despite these materials holding such great promise with a multitude of potential applications, there appears to be a lack of comparative studies focusing on their fundamental role as CO2 adsorbents at moderate temperatures. An earlier work from Horiuchi et al.10 does exist, but a proper structure–function relationship and sorbent structure optimization are lacking. Some contemporary relevant works focus on the specific application of integrated CO2 capture and conversion into CH4.24,25,30,31 As such, this work involves a comparative study of multiple sorption active phases supported on Al2O3, as well as some other metal oxides (ZrO2, TiO2, CeO2, and SiO2). The materials are thoroughly characterized and an optimization of the type of sorption active phase and its load is performed. Moreover, the kinetics and thermodynamics of CO2 adsorption over the optimized Na2O/Al2O3 adsorbent are investigated. Lastly, the best-performing adsorbent is evaluated during multiple adsorption–desorption cycles at 300 and 500 °C respectively.
2. Experimental Section
2.1. Preparation Methods
The mesoporous Al2O3 support was purchased from AKZO Nobel N.V. Detailed information on the properties of the material have been provided in ref (32). For the purposes of the work presented herein, the Al2O3 pellets were first crushed into fine powder and then calcined at 500 °C for 4 h under static air.
MgO/Al2O3 (MgAl), CaO/Al2O3 (CaAl), Na2CO3/Al2O3 (NaCAl), and K2CO3/Al2O3 (KCAl) were prepared via wet impregnation of Mg(NO3)2·6H2O, Ca(NO3)2·4H2O, Na2CO3, and K2CO3 on calcined Al2O3. Calculated amounts of the precursor salts in order to obtain 10 wt % load of the respective sorption active phase were first dissolved in 100 mL of deionized H2O, followed by the dispersion of the Al2O3 support. A rotary evaporator was then used to remove the water and the remaining slurry was dried at 120 °C overnight before undergoing calcination at 500 °C for 4 h.
Na2O/Al2O3 (NaNAl) and K2O/Al2O3 (KNAl) were then prepared via wet impregnation of nitrate salts (NaNO3 and KNO3) on Al2O3 in order to investigate the effect of the precursor salt on the CO2 adsorption capacity. The amount was calculated so that the same alkali load (Na and K, respectively) as NaCAl and KCAl was achieved, which roughly corresponds to 6 wt % Na2O and 7 wt % K2O. Finally, the Na2O load on Al2O3 was varied via impregnating different amounts of NaNO3 in order to prepare 3 wt % Na2O/Al2O3 (Na3Al), 12 wt % Na2O/Al2O3 (Na12Al) and 24 wt % Na2O/Al2O3 (Na24Al) adsorbents.
For the investigation of other support structures, ZrO2, TiO2, and SiO2 supports were supplied by St. Gobain NorPro. All commercial supports were first crushed into fine powder and calcined at 500 °C for 4 h under static air prior to use. The CeO2 support was prepared via direct calcination of Ce(NO3)3·6H2O (after being crushed into fine powder) at 500 °C for 4 h under static air. Na2O/ZrO2 (NaZr), Na2O/TiO2 (NaTi), Na2O/CeO2 (NaCe), and Na2O/SiO2 (NaSi) were prepared via wet impregnation of NaNO3 on the respective calcined supports, in order to obtain the same 6 wt % Na2O load, like in NaNAl (6 wt % Na2O/Al2O3). Additional information on the properties of the commercial Al2O3, ZrO2, TiO2, and SiO2 supports as well as of the synthesized CeO2 support used in this work are provided in Table S1.
2.2. Characterization Techniques
X-ray diffraction (XRD) was performed employing a Rigaku MiniFlex II system (Tokyo, Japan) equipped with Cu Kα1 radiation that was operated at 20 mA and 30 kV.
N2 physisorption isotherms were collected via an Autosorb iQ by Quantachrome Instruments (Anton Paar) at 77 K. The samples were first outgassed at 300 °C for 4 h. In the range of p/p0 = 0.07–0.3, the specific surface areas (SSA) were calculated via the Brunauer–Emmett–Teller (BET) method.33 The non-local density functional theory (NLDFT) method applying the model for silica cylindrical pores on the adsorption branch was used to determine the pore size distribution by utilizing the ASiQWin software.33
CO2 temperature-programmed desorption (CO2-TPD) experiments were performed using an Autochem 2920 apparatus (Micromeritics, Atlanta, USA). The material (0.12 g) was first pretreated at 500 °C under He. A gas mixture of 10 vol % CO2/Ar was then passed over of the pretreated material at 300 °C for 1 h and remained during the slow cooling to 30 °C. After He purging for 20 min, the temperature was increased to 900 °C under He flow using a temperature ramp of 30 °C/min with the thermal conductivity detector (TCD) signal being recorded continuously. Quantification of desorbed CO2 was performed using a calibrated gas mixture (5% CO2/He).
Transmission electron microscopy (TEM) was performed using a FEI-Tecnai TF-20 TEM microscope with a field emission gun (200 kV). All the samples were first dispersed in ethanol, placed on a carbon-coated 400 mesh copper grid and then left to dry.
Attenuated total reflectance Fourier-transform infrared spectroscopy (ATR–FTIR) was carried out on a Bruker Vertex 80v FTIR spectrometer. A background spectrum was collected prior to spectra acquisition in order to compensate for the ambient humidity fluctuations. A spectral resolution of 4 cm–1 (32 scans per run) was employed during the spectra collection in the range of 4000–400 cm–1.
2.3. Adsorption Tests
Dynamic CO2 adsorption tests were conducted in a fixed-bed quartz reactor (I.D. = 0.9 cm). 0.5 g of the sorbent material were loaded into the quartz reactor and pretreated under an Ar flow (50 mL/min) at 500 °C for 30 min. Afterward, the reactor was cooled down under Ar flow until the desired temperature of adsorption (usually 300 °C, unless stated otherwise). The flow was then changed to 50 mL/min of CO2/Ar (usually 1 vol %, unless stated otherwise) and the CO2 signal was recorded. The gas hourly space velocity (GHSV) during adsorption was calculated at approximately 3200 h–1. Finally, the reactor was purged under Ar flow (50 mL/min) for 5 min. For the cyclic CO2 adsorption–desorption experiments, the reactor temperature was increased to 500 °C after CO2 adsorption under an Ar flow (50 mL/min) and remained at this temperature for 15 min for CO2 desorption, before being decreased again to 300 °C for the next cycle to begin.
Gas analysis at the reactor outlet was performed using a QMS 300 Prisma mass spectrometer analyzer of the Pfeiffer Group, with the CO2 signal being recorded at m/z = 44. Calibration was performed with certified CO2/Ar gas mixtures, with Ar as the internal standard. The breakpoint was taken as the time when the CO2 concentration (Ct) reached 5% of the initial one (C0). The CO2 adsorption capacity (mg CO2/ g sorbent) was calculated via the following formula
| 1 |
where Cin is the inlet CO2 concentration expressed in mg CO2 per mL. Fin is the total inlet flow rate expressed in mL per min. Ct is the CO2 molar concentration at any given time. C0 is the CO2 inlet molar concentration. Wads is the weight of the adsorbent in grams. qt refers to the CO2 adsorption capacity up to a specific time.
3. Results and Discussion
3.1. Effect of the Alkaline Phase Supported on Al2O3
3.1.1. Breakthrough Evaluation of the Materials
The CO2 breakthrough curves following dynamic CO2 adsorption over the sorbent materials comprising different sorption active phases supported on Al2O3 are shown in Figure 1, while the CO2 adsorption capacity values are presented in Table 1. It can be observed that the Al2O3 support alone has a meager CO2 adsorption capacity of 1.2 mg/g. The dispersion of MgO (10 wt % or 0.14 Mg/Al molar ratio) leads to a modest increase in the adsorption capacity at just 4.4 mg/g. This low increase can be explained by the fact that a considerable amount of MgO could react with Al2O3 to form the MgAl2O4 spinel phase, thus reducing the surface-exposed MgO amount.34 The MgO that does reside at the surface also tends to present rather slow CO2 adsorption kinetics.7,8 For dispersed CaO, Na2CO3, and K2CO3 phases (10 wt %; molar ratios of 0.10 for Ca/Al, 0.11 for Na/Al and 0.08 for K/Al), the CO2 adsorption capacity is substantially increased and follows the order NaCAl (14.1 mg/g) > CaAl (12.8 mg/g) > KCAl (12.0 mg/g). For CaO dispersed over Al2O3, such an enhancement in sorption capacity has also been previously reported by Gruene et al.,12 which was attributed to the high CaO dispersion. A similar conclusion has been reached by Bermejo-Lopez et al.,25 namely, that Na2CO3 dispersed over Al2O3 can more effectively bind CO2 at this mid-temperature range. They also attempted to shed light on the CO2 adsorption chemistry over Na2CO3/Al2O3, which involves Na2CO3, Na2O, NaOH, and possibly NaHCO3 species.25,35 In general, the basic strength of metal oxides/carbonates tends to increase as we move down the group in the periodic table. The fact that this trend is not followed here can be attributed to the contribution of the Al2O3 support in the formation of active CO2-philic sites for the adsorption process.
Figure 1.
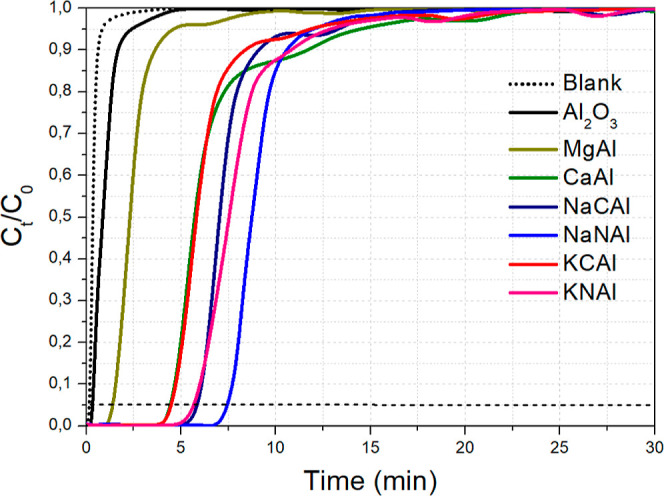
CO2 breakthrough curves for different alkaline compounds dispersed over Al2O3. Adsorption conditions: 0.5 g adsorbent, 50 mL/min of 1 vol % CO2/Ar flow, T = 300 °C.
Table 1. Quantity of Adsorbed/Captured CO2 (QCO2) Calculated During the Adsorption Tests (CO2 Breakthrough Curves)a.
| sorbent | QCO2(mg/g) | SBET (m2/g) | VP (cm3/g) | Dave (nm) | DCO2(mg/g) |
|---|---|---|---|---|---|
| Al2O3 | 1.2 | 262 | 0.66 | 10.1 | 3.3 |
| MgAl | 4.4 | 218 | 0.55 | 10.1 | 7.9 |
| CaAl | 12.8 | 189 | 0.52 | 11.0 | 12.1 |
| NaCAl | 14.1 | 232 | 0.60 | 10.3 | 20.4 |
| NaNAl | 16.8 | 236 | 0.58 | 9.8 | 20.6 |
| KCAl | 12.0 | 267 | 0.65 | 9.7 | 18.7 |
| KNAl | 15.2 | 235 | 0.59 | 10.0 | 18.3 |
Specific surface area (SBET), pore volume (VP) and average pore diameter (Dave) determined via N2 physisorption. Amount of desorbed CO2 during the CO2-TPD (chemisorption) tests from the weak and moderately strong basic sites (DCO2).
3.1.2. Effect of the Alkali Precursor
Prompted by the high CO2 adsorption capacity of the supported alkali metal carbonates dispersed over Al2O3, we proceeded to investigate the effect of different precursor compounds for the Na and K alkalis, namely, the corresponding alkali metal nitrates of Na and K (NaNO3 and KNO3). This approach of investigating the effect of different precursor compounds is quite common in the literature regarding CaO-based adsorbents,36 while it has also been followed for dual-function materials with Al2O3 support.37 This way, we aimed to achieve the same alkali load as NaCAl and KCAl (namely, 4.3 wt % Na and 5.7 wt % K, corresponding to molar ratios of 0.11 for Na/Al and 0.08 for K/Al) by impregnating NaNO3 (NaNAl) and KNO3 (KNAl) instead of Na2CO3 and K2CO3 over Al2O3. This would roughly correspond to 6 wt % Na2O and 7 wt % K2O. It was found that the use of nitrates as precursors led to a further increase in the CO2 adsorption capacity to 16.8 mg/g for NaNAl (compared to 14.1 mg/g for NaCAl) and 15.2 mg/g for KNAl (compared to 12.0 mg/g for KCAl).
It is evident, that NaNAl (namely, 6 wt % Na2O/Al2O3 or 0.11 Na/Al molar ratio), prepared via NaNO3 impregnation over high surface area Al2O3, displays the highest CO2 adsorption capacity over this series of adsorbents at 16.8 mg CO2/g sorbent. Keturakis et al.15 and Proano et al.38 have investigated similar sorbent formulations and concluded that CO2 is bound over Na2O/Al2O3 at the interfacial Al–O––Na+ sites and/or Al–O– ionic sites. It has also been indicated that Na2O/Al2O3 can effectively function as a sorbent material in sorption-enhanced reactions and integrated CO2 capture and conversion applications.15,22,24,25 This is further corroborated by this work, as Na2O/Al2O3 (NaNAl) displayed the highest CO2 adsorption capacity over various other sorbents dispersed over Al2O3.
3.1.3. Characterization of the Adsorbents
The samples were then characterized via N2 physisorption, XRD, and CO2-TPD (Figure 2). Figure 2a presents the N2 physisorption isotherms and pore size distribution graphs. For the sake of clarity, only the Al2O3 support and NaNAl (6 wt % Na2O/Al2O3 or 0.11 Na/Al molar ratio) are presented and the rest of the materials can be found in Figure S1, since the isotherms largely overlap with each other. The isotherms are of type IV with hysteresis loops typical of those obtained from mesoporous materials.33 The BET surface area of Al2O3 was calculated at 262 m2/g and it dropped only modestly by around 10% in the case of NaNAl up to a maximum of 28% for CaAl following the alkaline phase impregnation. The pore volume followed a similar downward trend depending on the sorbent. For Al2O3, it was calculated at 0.66 cm3/g, whereas for the example of NaNAl, it dropped to 0.58 cm3/g (12% drop). The average pore diameter was found around 10 nm in all cases, meaning that the materials contain mostly small mesopores. The impregnation of the alkaline phases on Al2O3 therefore did not cause a substantial textural change, as the sorbents largely retained the favorable textural characteristics of the high surface area Al2O3 support. The N2 physisorption results can be found summarized in Table 1.
Figure 2.

(a) N2 adsorption–desorption isotherms with pore size distribution (inset) for the Al2O3 support and NaNAl sorbent. (b) XRD patterns for the different alkaline compounds dispersed over Al2O3. (c,d) CO2-TPD profiles with (d) focus on the temperature region below 500 °C.
During XRD characterization (Figure 2b), we primarily observe the diffractions attributed to crystalline γ-Al2O3, with the main reflections at approximately 2θ = 37, 46, and 67°.39 These diffractions are observed in all of the prepared materials with a sorption-active phase impregnated over γ-Al2O3. For MgAl, the diffractogram suggests the presence of only crystalline γ-Al2O3, with no observed crystalline phases of MgO or MgAl2O4,34 possibly due to their high dispersion. For CaAl, multiple diffraction peaks can be observed. The diffractogram can best be described by the presence of CaAlxOy crystallites with variable stoichiometry,40,41 alongside the crystalline γ-Al2O3 phase. Multiple diffraction peaks can also be found in NaCAl. Besides γ-Al2O3, most of the other reflections could be tentatively assigned to Na2CO3.29,42,43 The broad diffraction peak at approximately 2θ = 32° could be attributed to Na2O,44 since the same peak can also be observed in the NaNAl sorbent. For NaNAl, it appears that the decomposition of highly dispersed NaNO3 can for the most part yield the sorption-active Na2O phase, alongside the interfacial Al–O––Na+ sites (the most intense Na2O reflection at 2θ = 46°44 possibly overlaps with the one for γ-Al2O3 in our case), which can also be verified via the absence of other crystalline sodium reflections.38,43 Lastly, in the case of KCAl and KNAl, reflections other than those for γ-Al2O3 can hardly be detected. This could mean that the crystalline phases that can possibly be formed, namely, K2CO3 for KCAl and K2O for KNAl and KCAl, are highly dispersed over γ-Al2O3.24,29,45
From CO2-TPD (Figure 2c,d), we can gain information regarding the surface basic sites of our materials.46 Please note, that CO2 adsorption in this case was performed at 300 °C, in order to simulate the conditions during the dynamic CO2 capture tests, and that CO2 was also made to flow during the cooldown period. From Figure 2c, we can observe that the sorbents present peaks of variable intensity below 500 °C, which correspond to weak and moderately strong basic sites attributed to the desorption of weakly bound bicarbonates and bidentate/polydentate carbonates, respectively.15,20,38,47 After 500 °C, another mostly sharper peak is observed in all cases. This peak however is observed above the calcination temperature (500 °C), and, as will be shown later in more clarity, can best be ascribed to the decomposition of the remaining impregnated precursor phase (i.e., that of the alkaline nitrates and carbonates).48−50 Therefore, by taking into account the calcination temperature (500 °C) and the desired desorption temperature upon reversible operation, as well as to avoid the contribution of the decomposition of the alkaline precursor salts, only the weak and moderately strong basic sites up to 500 °C were considered during the peak integration.
Figure 2d zooms in at the region of weak and moderately strong basic sites, where it is shown that the best-performing NaNAl sorbent presents the largest peaks due to the desorption of bicarbonates and carbonates under different binding configurations.15 An example of the peak fitting/peak deconvolution performed for the CO2-TPD profile of the NaNAl sorbent, where the peak integration for the weak and moderately strong basic sites was based, is displayed in Figure S2. Following peak integration for these sites (weak and moderately strong ones, Table 1), the desorbed CO2 amount from the different materials largely agrees with the adsorbed CO2 amount calculated via the breakthrough curves, and it also follows the same trend for the different adsorbents. The higher values observed for the desorbed CO2 amount from the chemisorption tests (CO2-TPD), compared to adsorbed CO2 via the breakthrough curves, can be ascribed to the higher CO2 partial pressure during the adsorption step of CO2-TPD and the fact that CO2 was also made to flow during cooldown, meaning that CO2 adsorbed at temperatures lower than 300 °C is also considered.51 In conclusion, the highest CO2 adsorption capacity observed during the breakthrough curve for NaNAl is also reflected by the highest population of weak and moderately strong basic sites, namely, interfacial Al–O––Na+ sites and/or Al–O– ionic sites.15,38
3.1.4. Effect of the Support Chemical Nature
An additional attempt was made to disperse Na2O (via NaNO3 impregnation) over different metal oxide supports, namely, ZrO2, TiO2, CeO2 and SiO2, and create NaZr, NaTi, NaCe and NaSi sorbents with a 6 wt % Na2O load (molar ratios of Na/Zr = 0.25, Na/Ti = 0.16, Na/Ce = 0.35 and Na/Si = 0.12). The corresponding breakthrough curves can be found in Figure S3. It is clear that no other sorbent could match the CO2 adsorption capacity of Na2O/Al2O3 (NaNAl). This could be explained by the favorable formation of interfacial Al–O––Na+ sites and Al–O– ionic sites in Na–Al2O3, highly favorable for CO2 adsorption,15,38 that are unmatched by any other metal oxide combination with Na2O, among the metal oxide supports tested herein (ZrO2, TiO2, CeO2 and SiO2).24 The CO2 adsorption capacity followed the order: NaNAl (16.8 mg/g) > NaZr (10.5 mg/g) > NaCe (8.3 mg/g) > NaTi (3.2 mg/g) > NaSi (0.5 mg/g). As the change in the metal oxide support did not offer any advantages regarding the CO2 adsorption capacity, these supported adsorbents were not further evaluated.
3.2. Effect of Adsorbent Load
3.2.1. Breakthrough Evaluation of the Materials
In the next stage, we proceeded to vary the load of the Na2O adsorbent, (i.e., the sorption active phase that is dispersed over the high surface area Al2O3 carrier) from 3 wt % (0.05 Na/Al molar ratio) to 24 wt % (0.52 Na/Al molar ratio). The CO2 breakthrough curves are depicted in Figure 3 and the values for the CO2 adsorption capacity can be found in Table 2. During the change from 3 wt % Na2O to 6 wt % Na2O (and compared to the bare support), a quasi-linear trend can be observed for such low Na2O loads, as the CO2 adsorption capacity is increased from 9.2 mg/g (for Na3Al) to 16.8 mg/g (for Na6Al or NaNAl) due to the creation of new Al–O––Na+ sites.15,38
Figure 3.
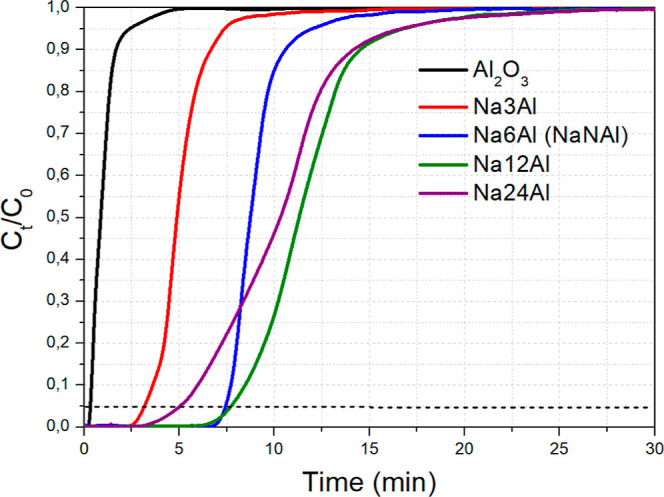
CO2 breakthrough curves for Na2O/Al2O3 with different Na2O loads. Adsorption conditions: 0.5 g adsorbent, 50 mL/min of 1 vol % CO2/Ar flow, T = 300 °C.
Table 2. Quantity of Adsorbed/Captured CO2 (QCO2) Calculated during the Adsorption Tests (CO2 Breakthrough Curves)a.
| sorbent | QCO2(mg/g) | SBET (m2/g) | VP (cm3/g) | Dave (nm) | DCO2(mg/g) |
|---|---|---|---|---|---|
| Al2O3 | 1.2 | 262 | 0.66 | 10.1 | 3.3 |
| Na3Al | 9.2 | 239 | 0.64 | 10.7 | 12.3 |
| Na6Al (NaNAl) | 16.8 | 236 | 0.58 | 9.8 | 20.6 |
| Na12Al | 22.0 | 133 | 0.43 | 12.9 | 31.4 |
| Na24Al | 19.5 | 39 | 0.16 | 16.3 | 20.8 |
Specific surface area (SBET), pore volume (VP) and average pore diameter (Dave) determined via N2 physisorption. Amount of desorbed CO2 during the CO2-TPD (chemisorption) tests from the weak and moderately strong basic sites (DCO2).
As the Na2O load is further doubled to 12 wt % (Na12Al, 0.22 Na/Al molar ratio), the CO2 adsorption capacity is further increased to 22.0 mg/g. This corresponds to a 31% increase, which is nowhere near double the adsorption capacity of 6 wt % Na2O/Al2O3 (0.11 Na/Al molar ratio). This can be explained via the aggregation of adsorbent particles, which can restrict the population of highly active Al–O––Na+ interfacial sites and cause pore blockage and a drop in the exposed surface area. Another thing to observe is the much slower kinetics of CO2 adsorption is this case, as depicted via the smoother increase in CO2 concentration over time for Na12Al, compared to the sharp increase for Na6Al (or NaNAl).14,16 As a result, the breakpoint time between the two materials is rather similar. It can, however, be inferred, that the typically higher than 1 vol % CO2 concentrations found in most flue gases can benefit the adsorption kinetics52,53 (as will also be shown later).
Through a further doubling of the Na2O load to 24 wt % (Na24Al, 0.52 Na/Al molar ratio), the CO2 adsorption capacity drops to 19.5 mg/g and the adsorption kinetics become even more sluggish (and thus the breakpoint time becomes even lower), which is probably a result of a large drop in the surface area and the population of sorption active sites through the formation of larger particles.14,16 Indeed, as will be shown later, Na24Al has a considerably lower surface area than the other adsorbents tested herein and also a lower population of surface basic sites of weak and moderate strength compared to Na12Al (Table 2), which can negatively affect the CO2 adsorption capacity and the breakpoint time for this material. A decrease in the CO2 adsorption capacity upon increasing the Na2O load over Al2O3 after a specific point has also been reported in other works in the literature.15,54
3.2.2. Characterization of the Adsorbents
Figure 4a presents the N2 physisorption isotherms, as well as the pore size distribution graphs for the samples with varying Na2O load. All the samples present type IV isotherms with a hysteresis loop. It is evident, that as the Na2O load increases, the porosity in terms of both SSA (SBET) and pore volume (VP) decreases, whereas the pore size distribution shifts toward larger pores. Up to 6 wt % Na2O (Na6Al, 0.11 Na/Al molar ratio), the surface area and pore volume drop only modestly, since the low Na2O load is not able to block the support’s mesopores.55 For 12 wt % Na2O (Na12Al, 0.22 Na/Al molar ratio), SBET decreases to 133 m2/g, whereas VP drops to 0.43 cm3/g. Despite this, the Na12Al sample retains a relatively high porosity due to the initially highly porous Al2O3 structure; its high CO2 adsorption capacity being due to a combination of high Na2O load (thus a plethora of adsorption sites) and sufficient porosity.14 When the Na2O load is increased to 24 wt % (Na24Al, 0.52 Na/Al molar ratio), the porosity collapses to just 39 m2/g SBET and 0.16 cm3/g VP. The poor textural properties of this material thus contribute to its reduced CO2 adsorption capacity and sluggish CO2 adsorption kinetics, as observed during the CO2 breakthrough experiments (Figure 3).
Figure 4.

(a) N2 adsorption–desorption isotherms and pore size distribution (inset) for Na2O/Al2O3 with different Na2O loads. (b) XRD patterns. (c,d) CO2-TPD profiles with (d) focus on the temperature region below 500 °C.
Based on the XRD characterization (Figure 4b), the crystalline reflections of the γ-Al2O3 support can be observed in all samples. As described previously, in Na6Al (NaNAl) the presence of a weak reflection at 2θ = 32° and the absence of other sharp crystalline sodium reflections suggest the presence of “Na2O” as the sorption active phase,38,44 which originates from the decomposition of the dispersed impregnated NaNO3 phase. For Na3Al, the absence of these Na2O small reflections probably means that Na2O does form (or rather Al–O––Na+ sites), but the particles have a smaller crystallite size and higher dispersion due to the lower active phase load. For higher loads of the sorption active phase, we can now observe the presence of sharp reflections ascribed to crystalline NaNO3 with the most intense reflection being located at 2θ = 29°,56 since bulk NaNO3 requires high temperatures for its decomposition.57 As such, in these materials, large NaNO3 crystallites coexist with the dispersed Na2O phase. As will be shown later (TEM characterization, Figure 5), these sharp reflections arise from the presence of a few very large NaNO3 particles, which can, however, be decomposed after the CO2 adsorption treatment (at least for Na12Al), leaving the majority of the sodium phase existing in the form of Na2O.
Figure 5.

TEM images of the (a) Al2O3 support and the (b) Na6Al and (c,d) Na12Al sorbents.
The CO2-TPD profiles (Figure 4c) give us information about the surface basic sites of the Na2O/Al2O3 sorbents with an increasing Na2O load. These profiles present very intense peaks at elevated temperatures for Na12Al (≈590 °C) and especially for Na24Al (≈670 °C), which can be attributed to the decomposition of the NaNO3 phase (leftover precursor phase following the wet impregnation synthesis).57 This can be expected, since these two adsorbents contain much larger quantities of NaNO3 compared to the other materials with a lower sodium load, as was evidenced by the sharp NaNO3 reflections during the XRD characterization (Figure 4b). Bulk NaNO3 has previously been reported to decompose at temperatures above 600 °C.57 It can also be observed that NaNO3 decomposes at higher temperatures with increasing load, since it presents rather more “bulk” characteristics and lower dispersion.58 As a result, NaNO3 decomposition for Na24Al (large TCD peak) occurs at higher temperatures compared to Na12Al, which presents rather smaller NaNO3 particles (higher dispersion) based on the NaNO3 reflection intensity during XRD.58 The decomposition of the NaNO3 phase is expected to result in the release of gaseous nitrogen species (e.g., N2, NO, NO2, N2O) and oxygen (O2), which results in a very sharp and intense signal on the TCD detector.58−60
In order to exclude the contribution of the NaNO3 decomposition, we then studied the surface basic properties up to 500 °C (Figure 4d). In this region, as described earlier, Al2O3 presents some weak basic sites due to the desorbed bicarbonates, while Na6Al (NaNAl) additionally presents basic sites of moderate strength due to the preadsorbed carbonates over the Al–O––Na+ sites.15,38 Na3Al presents an intermediate peak intensity, while the largest peak intensity for the weak and moderately strong basic sites is observed for Na12Al, which, in turn, translates to the largest amount of desorbed CO2 from these sites following peak integration (Table 2). An example of the peak fitting/peak deconvolution performed for the CO2-TPD profile of the best-performing Na12Al sorbent, where the peak integration for the weak and moderately strong basic sites was based, is displayed in Figure S4. Therefore, after excluding the NaNO3 decomposition contribution, the Na12Al material (12 wt % Na2O load or 0.22 Na/Al molar ratio) possesses the highest number of sites that are active for CO2 chemisorption. For Na24Al, the weak and moderately strong basic sites are lower in population than in Na12Al as a result of the much lower porosity due to pore blockage, resulting in turn to lower CO2 adsorption capacity and breakpoint time (Figure 3).
TEM characterization was also carried out for the γ-Al2O3 support, the Na6Al (NaNAl) material with 6 wt % Na2O load (0.11 Na/Al molar ratio) and the best-performing Na12Al adsorbent material with 12 wt % Na2O load (0.22 Na/Al molar ratio) (Figure 5). In all cases, we can observe the presence of aggregated rod-like and needle-like structures, which form a network of small mesopores. The Na2O sorption active phase could lie dispersed inside these small mesopores, mostly existing in the form of Al–O––Na+ sites. For Na12Al, a few very large NaNO3 crystalline particles can be observed with a size that can exceed 100 nm in diameter (Figure 5d), which can be responsible for the emergence of the sharp NaNO3 reflections observed during XRD characterization (Figure 4b). The rest of the material structure in Na12Al is, however, similar to that of the other materials (Al2O3 support and Na6Al), albeit with an apparently reduced porosity (as also shown in Table 2).
Additionally, infrared spectroscopy characterization (ATR–FTIR) was carried out on the best-performing Na12Al adsorbent (12 wt % Na2O load, 0.22 Na/Al molar ratio) following pretreatment (Ar, 500 °C, 30 min) and CO2 adsorption (10% CO2/Ar, 300 °C, 30 min) in order to study the type of carbonates present on the adsorbent surface following CO2 adsorption (Figure S5). From the overall spectrum (Figure S5a), the region at high wavenumbers (>3000 cm–1) can be assigned to O–H groups due to adsorbed moisture and the presence of bicarbonates, the peaks between roughly 1300 and 1700 cm–1 to surface adsorbed carbonate species and the large peak below 1000 cm–1 to vibration modes of the metal oxide.15,38,61Figure S5b focuses on the region of the carbonate peaks, where two main absorption peaks and a smaller broader one can be observed. According to Proano et al.,38 the smaller and broader peak at approximately 1650 cm–1 can be ascribed to the limited presence of bicarbonates. On the other hand, the two main peaks centered at 1390 and 1570 cm–1, respectively, can be ascribed to a mixture of bidentate and polydentate carbonates (asymmetric and symmetric stretching vibrations) that are present at the surface of the Na12Al adsorbent material following CO2 adsorption, as has also been observed for similar materials in the works of Proano et al.38 and Keturakis et al.15
3.3. Effect of Adsorption Temperature and Kinetic Evaluation of the Adsorption Process
Afterward, we focused on the effect of temperature on CO2 adsorption over the best-performing Na12Al adsorbent material, which will hereafter be referred to as just NaAl for simplicity. The temperature was varied around the mid-temperature range, i.e., between 200 and 400 °C, while keeping the CO2 feed concentration at 1 vol % (Figure 6). It was found that increasing the adsorption temperature from 200 to 400 °C caused a drop in the CO2 adsorption capacity, which would agree with an exothermic character for the mid-temperature CO2 adsorption process over Na2O/Al2O3, coupled with fast adsorption kinetics due to the relatively high Na2O dispersion.12 The CO2 adsorption capacity at these five different temperatures for NaAl followed the order: 200 °C (29.6 mg/g) > 250 °C (25.5 mg/g) > 300 °C (22.0 mg/g) > 350 °C (17.2 mg/g) > 400 °C (14.9 mg/g).
Figure 6.
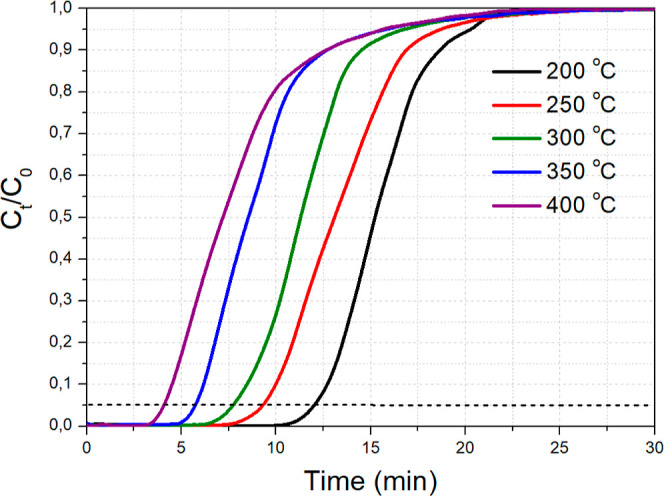
CO2 breakthrough curves for NaAl at different temperatures. Adsorption conditions: 0.5 g adsorbent, 50 mL/min of 1 vol % CO2/Ar flow.
In general, it is recognized that the adsorption temperature has a significant effect on the adsorption kinetics, which, in turn, have always been considered as a critical property of an efficient adsorbent, since the residence time required for the process to be completed (in our case GHSV = 3200 h–1), the size of the adsorption bed and resultantly, the unit capital expenses, are intrinsically related to the rate of adsorption.62−64 The most common method applied in the literature is directed toward the prediction of the rate-determining step, with the purpose of understanding the adsorption mechanism.65 Two of the most relevant empirical models used to predict the CO2 adsorption kinetics on NaAl are the Lagergren’s Pseudo Second Order (PSO) (eq 2) and the Avrami (eq 3) equations, which are able to lump together different types of mass transfer resistances (i.e., surface adhesion, pore diffusion and external diffusion).66,67 In essence, the PSO equation assumes that the chemisorption is the rate-limiting step of the process, while the Avrami model assumes that the adsorption process follows a nucleation and growth type mechanism. A more thorough view with respect to the assumptions of the models can also be found elsewhere.52,66 The integrated forms of the PSO and Avrami equations can be written as follows52,64
| 2 |
| 3 |
where kS is the PSO kinetic constant, kA is the Avrami kinetic constant, nA is the Avrami’s exponent indicating possible mechanism changes during the process, qe,i represents the equilibrium CO2 adsorption capacity (CO2 uptake) that the model predicts, and qt is the experimental CO2 adsorption capacity up to a specific time.
In order to quantitatively test the goodness of the fit for the aforementioned kinetic models, we used the error function of the nonlinear coefficient of determination (R2) statistic (eq 4), which was calculated as follows68
| 4 |
where the subscripts “obs.” and “pred.” correspond to the experimentally recorded and theoretically calculated values for the amount of adsorbed CO2, respectively. The accented with hyphen qt denotes the mean value from the experimental data, while n and p represent the number of experimental data points and the number of estimated parameters of the model, respectively. Nonlinear fitting was carried out to fit the models (i.e., python’s SciPy curve_fit function).
Figure 7 presents the CO2 uptake with increasing time for the NaAl sorbent during the dynamic breakthrough experiments at the five tested adsorption temperatures, along with the corresponding fitting curves for the Avrami and PSO models. The PSO model appears to have certain limitations regarding the prediction of the CO2 uptake process on NaAl, as it overestimates the CO2 uptake both at the beginning and at the end of the process (i.e., approaching equilibrium). On the contrary, the Avrami’s fractional order model accurately follows the trends of the observed CO2 uptake values for the different temperatures under consideration, exhibiting error function values (R2) closest to unity, as shown in Table 3. The very good agreement that is reflected between the Avrami model and the experimental results is most likely attributable to the model’s ability to take into account complex adsorption pathways. It is worth mentioning, that the Avrami model has successfully been used to describe kinetic adsorption processes for a multitude of adsorbate–adsorbent combinations.64,69−72
Figure 7.

Comparison of the observed CO2 uptake values and the fitted ones via the PSO and Avrami equations for NaAl at 1 atm, 1 vol % CO2 concentration and at different adsorption temperatures.
Table 3. Kinetic Model Parameters for CO2 Adsorption on NaAl at 1 atm, 1 vol % CO2 Concentration and at Different Adsorption Temperaturesa.
| temp. [°C] | PSO |
Avrami |
||||||
|---|---|---|---|---|---|---|---|---|
| qe,obs | kS | qe,S | R2 | kA | qe,A | nA | R2 | |
| 200 | 29.6 | 0.0012 | 51.4 | 0.959 | 0.1055 | 31.1 | 1.583 | 0.994 |
| 250 | 25.5 | 0.0022 | 39.8 | 0.956 | 0.1216 | 26.7 | 1.541 | 0.997 |
| 300 | 22.0 | 0.0037 | 31.8 | 0.948 | 0.1410 | 22.9 | 1.539 | 0.997 |
| 350 | 17.2 | 0.0076 | 23.0 | 0.950 | 0.1751 | 18.0 | 1.431 | 0.998 |
| 400 | 14.9 | 0.0107 | 19.4 | 0.959 | 0.1921 | 15.7 | 1.306 | 0.999 |
qe,i [mg/g], kS [g/mg/min], kA [min–1].
Finally, based on the values of the kinetic constants obtained from the best fitted Avrami model over the specified range of temperatures (200–400 °C), we applied the modified Arrhenius equation (eq 5)52 (Figure 8), which can be expressed as follows
| 5 |
where A and Ea correspond to the pre-exponential factor and the activation energy, respectively, R corresponds to the gas constant at J/mol/K, and Tmean is the mean value of the temperature range considered during the adsorption tests (i.e., 300 °C or 573 K). It is noted, that the modified Arrhenius equation can help ensure numerical stability by reducing correlation between the pre-exponential factor and the activation energy and can thus result in more accurate predictions compared to the linear form of the equation.52 The value for the activation energy was calculated at Ea = 8.5 kJ/mol, which is a reasonable one and in agreement with similar adsorption systems in the literature.71,73
Figure 8.
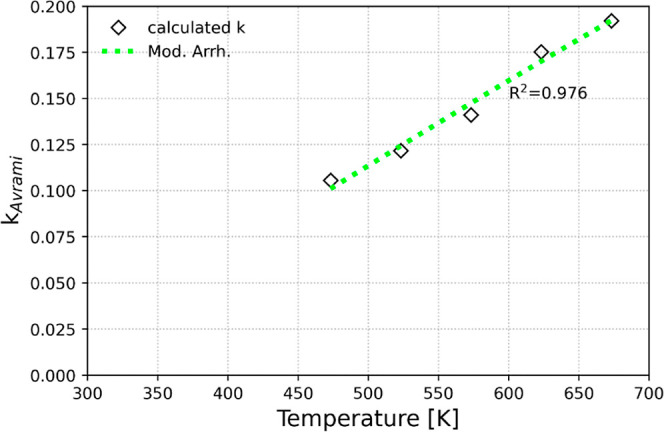
Effect of adsorption temperature on the Avrami’s kinetic constant for NaAl using the modified Arrhenius equation as a regression function.
3.4. Effect of CO2 Feed Partial Pressure and Isotherm Fitting
In addition, we investigated the effect of the initial CO2 feed concentration (CO2 feed partial pressure) on the adsorption capacity for the best-performing NaAl sorbent, with the temperature being kept constant at 300 °C (Figure 9). The CO2 adsorption capacity as a function of the CO2 volume concentration in the gas feed followed the order: 10 vol % (31.5 mg/g) ≈ 5 vol % (31.7 mg/g) > 2 vol % (25.2 mg/g) > 1 vol % (22.0 mg/g) > 0.5 vol % (15.9 mg/g). The CO2 adsorption capacity increased with increasing CO2 feed concentration (and thus partial pressure) from 0.5 vol % up to 5 vol % and then reached a plateau at this point (at approximately 32 mg/g). The breakthrough curves became steeper as the CO2 feed concentration increased, thereby accelerating the adsorption process and negating the negative effect of the relatively high Na2O load (12 wt %, 0.22 Na/Al molar ratio) on the adsorption kinetics.52 Since most flue gases roughly contain 5–10 vol % CO2,74 it is anticipated that 12 wt % Na2O/Al2O3 (NaAl) has the ability to act as a suitable mid-temperature CO2 adsorbent or as a support structure for the further development of dual-function materials that can be used during integrated CO2 capture and conversion processes.19,24,74
Figure 9.
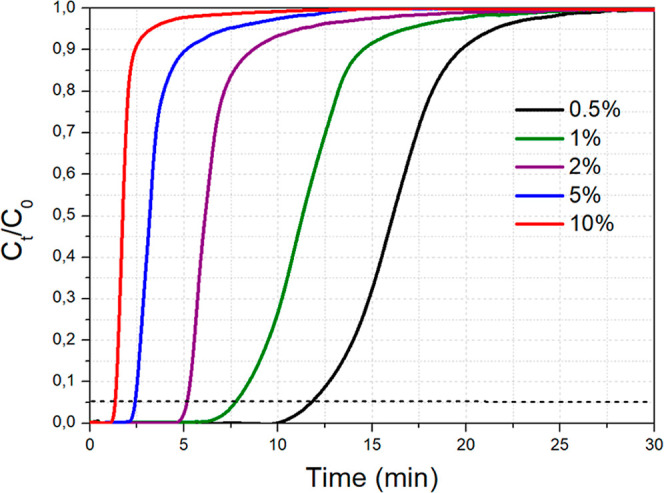
CO2 breakthrough curves for NaAl at different CO2 feed concentrations. Adsorption conditions: 0.5 g adsorbent, T = 300 °C, 50 mL/min of CO2/Ar flow at different concentrations.
Subsequently, we carried out an evaluation of isothermal models with the intent to optimize the design of the adsorption system by establishing the most suitable correlations for the equilibrium curves. Herein, three relevant adsorption isotherms, namely, the Langmuir (eq 6), Freundlich (eq 7) (two parameters isotherms), as well as the Sips (eq 8) equation (three parameters isotherm) were applied to the equilibrium experimental data of CO2 adsorption on NaAl75−78
| 6 |
| 7 |
| 8 |
where KL (L/mg) is the Langmuir constant, KF and nF are the Freundlich constants, which are indicators of the capacity and intensity of the adsorption process and KS represents the Sips constant, with nS standing for the Sips parameter of system heterogeneity. Ce is the CO2 feed concentration (mg/L) and qe is the CO2 adsorption capacity predicted by the model for said concentration. Finally, qe,L and qe,S are the maximum CO2 adsorption capacity predicted by the Langmuir and Sips models, respectively. Again, nonlinear fitting methods were adopted, while error analysis was performed using eq 4.68 In brief, the Langmuir model suggests that adsorption takes place on a homogeneous surface and that each adsorption site has an independent and equal affinity for the adsorbate molecules. On the other hand, the Freundlich model assumes that the process takes place on a heterogeneous surface with varying adsorption energies and a positive correlation between the adsorption capacity and the increase in adsorbate concentration. Finally, the Sips model suggests that the adsorption process occurs on a surface with both heterogeneous and homogeneous sites and that the adsorption capacity increases upon increasing the concentration of the adsorbate up to a threshold, after which it becomes saturated. A more detailed discussion regarding the assumptions of the said models can also be found elsewhere.52
Figure 10 illustrates the equilibrium CO2 uptake values obtained for the five different CO2 feed concentrations at the specified temperature of 300 °C. From Table 4, we can conclude that the Langmuir model is the one that best fits the experimental data by providing an error function value closest to unity (R2 = 0.978) and a theoretically calculated equilibrium CO2 adsorption capacity that is the closest to the maximum one obtained experimentally. This suggests that the CO2 adsorption process essentially takes place via monolayer formation on the surface of NaAl (rather on the active CO2 adsorption sites). The Sips model can also decently describe the CO2 adsorption process on NaAl (R2 = 0.967), even though it has been primarily applied to describe different types of adsorption systems.78−80 The opposite is true for the Freundlich model, which is associated with the lowest error function value (R2 = 0.874) and thereby presents certain limitations to predict the adsorption of CO2 on NaAl.
Figure 10.

CO2 adsorption isotherm for NaAl obtained from the experimental CO2 adsorption values under different CO2 initial feed concentrations at 300 °C, along with the theoretically obtained values from the fitted Langmuir, Freundlich and Sips equations.
Table 4. Isotherm Model Parameters regarding the CO2 Adsorption Process on NaAl at 300 °Ca.
| model | parameters | values at 300°C |
|---|---|---|
| experimental | qe,obs | 31.7 |
| Langmuir | qe,L | 33.9 |
| KL | 0.0966 | |
| R2 | 0.978 | |
| Freundlich | KF | 11.66 |
| nF | 4.892 | |
| R2 | 0.874 | |
| Sips | qe,S | 34.5 |
| KS | 0.1102 | |
| nS | 1.067 | |
| R2 | 0.967 |
qe,i [mg/g], KL [L/mg], KF [[mg/g][L/mg]]1/nF, KS [L/mg]nS, nF & nS [dimensionless].
3.5. Sorbent Stability after Multiple Adsorption–Desorption Cycles
3.5.1. Breakthrough Evaluation under Multiple Cycles
In this last section, we studied the ability of the NaAl adsorbent to retain its CO2 adsorption performance following desorption at a mild temperature of 500 °C and multiple adsorption–desorption cycles in a reversible operation. From Figure 11a (the first 5 min of the adsorption process are depicted), we can see that the CO2 breakthrough curves during adsorption for the subsequent cycles (following the desorption treatment) largely overlap with one another, which leads to a similar CO2 adsorption capacity that only drops by approximately 2 mg/g between the first and the last adsorption cycle (Figure 11b). Therefore, NaAl can largely maintain its CO2 adsorption capacity after multiple cycles of operation and can thus act as a reversible CO2 chemisorbent at intermediate temperatures.12,15
Figure 11.

(a) CO2 breakthrough curves and (b) CO2 adsorption capacity values in mg/g for NaAl after multiple adsorption–desorption cycles (0.5 g adsorbent). Adsorption conditions: 50 mL/min of 10 vol % CO2/Ar flow at 300 °C for 15 min. Desorption conditions: 50 mL/min of Ar flow at 500 °C for 15 min.
3.5.2. Characterization of the Spent Adsorbent
The N2 physisorption isotherms for the fresh adsorbent, as well as after the first and tenth cycle can be found in Figure 12a, with further details being given in Table 5. It can be concluded that the textural properties, including the SSA and pore volume, are very well retained following the multiple adsorption–desorption treatments. This preservation of the textural properties is a further testament to the stability and regenerability of the NaAl adsorbent.
Figure 12.

(a) N2 adsorption–desorption isotherms with pore size distribution (inset) for the fresh NaAl adsorbent, as well as after the first and tenth cycle. (b) XRD patterns for the NaAl adsorbent undergoing various treatments. (c,d) CO2-TPD profiles with (d) focus on the temperature region below 500 °C. (e,f) TEM images of the NaAl adsorbent following (e) the 1st and (f) the 10th adsorption–desorption cycles.
Table 5. Quantity of Adsorbed/Captured CO2 (QCO2) Calculated during the Adsorption Tests (CO2 Breakthrough Curves)a.
| sorbent | QCO2(mg/g)b | SBET (m2/g)c | VP (cm3/g)c | Dave (nm)c | DCO2(mg/g)c |
|---|---|---|---|---|---|
| fresh | n.a. | 133 | 0.43 | 12.9 | 31.4 |
| 1st cycle | 32.2 | 131 | 0.41 | 12.6 | 30.1 |
| 10th cycle | 30.2 | 136 | 0.47 | 13.7 | 31.2 |
Specific surface area (SBET), pore volume (VP) and average pore diameter (Dave) determined via N2 physisorption. Amount of desorbed CO2 during the CO2-TPD (chemisorption) tests from the weak and moderately strong basic sites (DCO2).
QCO2 for the 1st and 10th cycles derived from the CO2 breakthrough curves.
SBET, VP, Dave, and DCO2 for the fresh sorbent as well as after the 1st and 10th cycles derived from N2 physisorption and CO2-TPD (chemisorption) tests.
From XRD characterization (Figure 12b), we can observe the crystalline structure of NaAl following successive treatments under various gas atmospheres. It is shown that the NaNO3 sharp reflections disappear after the CO2 adsorption treatment, which can be ascribed to the decomposition of the large crystalline NaNO3 particles under the CO2-rich atmosphere. Therefore, the phase that is relevant for CO2 adsorption is actually rather the Na2O one (or the Al–O––Na+ sites). This crystalline structure following CO2 adsorption is then maintained during the cyclic adsorption–desorption operation.
The CO2-TPD profiles (Figure 12c) for the material after the first and tenth cycle are also similar to that of the fresh adsorbent. The main difference is a less intense high-temperature peak due to the partial NaNO3 decomposition (the rather noncrystalline part of it) following multiple adsorption–desorption treatments. On the other hand, the CO2 sorption-active weak and moderately strong basic sites are largely retained following the cyclic adsorption–desorption operation (Figure 12d and Table 5).
Finally, from the TEM images of NaAl after the first and last cycle (Figure 12e,f), we can observe a similar structure to fresh NaAl, with aggregated rod-like structures (which appear denser than the fresh catalyst) generating small mesopores, where the Na2O sorption active sites can be located. The large NaNO3 crystalline particles observed for the fresh NaAl material (Figure 5d) are absent in these images as a result of the decomposition of these particles following CO2 adsorption and subsequent treatments. Since the textural properties do not significantly change between these materials (as shown in Figure 12a), it can be assumed that these few in number large NaNO3 particles in fresh NaAl do not significantly affect the adsorption properties (since adsorption largely takes place on Al–O––Na+ sites) and are gradually decomposed during the adsorption treatment. The sorption active Al–O––Na+ sites along with the material’s structural and textural characteristics are well preserved following the cyclic adsorption–desorption process.
4. Conclusions
In this work, different alkaline CO2 adsorption active phases (MgO, CaO, Na2CO3, Na2O, K2CO3 and K2O) were dispersed over γ-Al2O3 and the materials were tested for CO2 adsorption under dynamic conditions. It was found that the impregnation of NaNO3 over γ-Al2O3 could generate a Na2O/Al2O3-type material with the highest CO2 adsorption capacity under a diluted CO2 gas stream (1 vol %), which could be attributed to the formation of CO2-philic interfacial Al–O––Na+ sites and/or Al–O– ionic sites. The material presented a high porosity, as well as increased population for the weak and moderately strong surface basic sites.
Next, the adsorption active phase (Na2O) load was varied, and the optimal amount was found to be 12 wt % Na2O (0.22 Na/Al molar ratio), since this material presented the highest CO2 adsorption capacity, as well as increased weak and moderate surface basicity. The materials with high adsorbent loads presented sharp NaNO3 reflections due to the presence of some large NaNO3 crystallites, which could, however, be removed after CO2 adsorption and subsequent treatments.
The best-performing material with 12 wt % Na2O load dispersed over γ-Al2O3 (NaAl) was tested under various adsorption temperatures and CO2 feed partial pressures. At first, the CO2 adsorption process was shown to be exothermic and to best fit the Avrami kinetic model. Then, after conducting experiments by varying the CO2 feed partial pressure, the CO2 adsorption isotherm was extracted. It could be best fitted by the Langmuir isotherm and presented a CO2 adsorption capacity plateau of approximately 32 mg/g for CO2 concentrations in the feed gas greater than 5 vol %.
Lastly, the NaAl material was tested under multiple CO2 adsorption–desorption cycles at 300 °C under 10% CO2/Ar and at 500 °C under Ar, respectively. The material was robust and it could keep its CO2 adsorption capacity after multiple cycles while also maintaining its nanostructure, high porosity and increased amount of weak and moderately strong basic sites. Therefore, the 12 wt % Na2O/Al2O3 material could be considered as a viable candidate for reversible mid-temperature CO2 chemisorption, as well as a potential support for dual-function materials that integrate CO2 capture and conversion to value-added chemicals at this intermediate temperature range.
Acknowledgments
N.D.C. and M.A.G. acknowledge support of this work by the project “Development of new innovative low carbon energy technologies to improve excellence in the Region of Western Macedonia” (MIS 5047197), which is implemented under the Action “Reinforcement of the Research and Innovation Infrastructure” funded by the Operational Program “Competitiveness, Entrepreneurship and Innovation” (NSRF 2014–2020) and co-financed by Greece and the European Union (European Regional Development Fund). A.I.T. thanks the Hellenic Foundation for Research and Innovation (HFRI) for supporting this research work under the 3rd Call for HFRI PhD Fellowships (Fellowship Number: 6033). K.P. acknowledges financial support from Khalifa University through the grant RC2-2018-024.
Supporting Information Available
The Supporting Information is available free of charge at https://pubs.acs.org/doi/10.1021/acsomega.3c07204.
Properties of the commercial Al2O3, ZrO2, TiO2, and SiO2 supports, as well as of the synthesized CeO2 support; adsorption active phase loads expressed in wt % and in molar ratios; N2 adsorption–desorption isotherms and pore size distribution of the MgAl, CaAl, NaCAl, KCAl and KNAl sorbents; peak fitting of the CO2-TPD profiles of the NaNAl and Na12Al sorbents; CO2 breakthrough curves for Na2O dispersed over different metal oxide supports; FTIR spectrum of the Na12Al sorbent following CO2 adsorption (PDF)
The authors declare no competing financial interest.
Supplementary Material
References
- Olabi A. G.; Abdelkareem M. A. Renewable Energy and Climate Change. Renewable Sustainable Energy Rev. 2022, 158, 112111. 10.1016/j.rser.2022.112111. [DOI] [Google Scholar]
- Choi S.; Drese J. H.; Jones C. W. Adsorbent Materials for Carbon Dioxide Capture from Large Anthropogenic Point Sources. ChemSusChem 2009, 2, 796–854. 10.1002/cssc.200900036. [DOI] [PubMed] [Google Scholar]
- Kumar S.; Srivastava R.; Koh J. Utilization of Zeolites as CO2 capturing Agents: Advances and Future Perspectives. J. CO2 Util. 2020, 41, 101251. 10.1016/j.jcou.2020.101251. [DOI] [Google Scholar]
- Ghanbari T.; Abnisa F.; Wan Daud W. M. A. A Review on Production of Metal Organic Frameworks (MOF) for CO2 Adsorption. Sci. Total Environ. 2020, 707, 135090. 10.1016/j.scitotenv.2019.135090. [DOI] [PubMed] [Google Scholar]
- Dunstan M. T.; Donat F.; Bork A. H.; Grey C. P.; Müller C. R. CO2 Capture at Medium to High Temperature Using Solid Oxide-Based Sorbents: Fundamental Aspects, Mechanistic Insights, and Recent Advances. Chem. Rev. 2021, 121, 12681–12745. 10.1021/acs.chemrev.1c00100. [DOI] [PubMed] [Google Scholar]
- Wang S.; Yan S.; Ma X.; Gong J. Recent Advances in Capture of Carbon Dioxide Using Alkali-Metal-Based Oxides. Energy Environ. Sci. 2011, 4, 3805–3819. 10.1039/c1ee01116b. [DOI] [Google Scholar]
- Ruhaimi A. H.; Aziz M. A. A.; Jalil A. A. Magnesium Oxide-Based Adsorbents for Carbon Dioxide Capture: Current Progress and Future Opportunities. J. CO2 Util. 2021, 43, 101357. 10.1016/j.jcou.2020.101357. [DOI] [Google Scholar]
- Gao W.; Vasiliades M. A.; Damaskinos C. M.; Zhao M.; Fan W.; Wang Q.; Reina T. R.; Efstathiou A. M. Molten Salt-Promoted MgO Adsorbents for CO2 Capture: Transient Kinetic Studies. Environ. Sci. Technol. 2021, 55, 4513–4521. 10.1021/acs.est.0c08731. [DOI] [PubMed] [Google Scholar]
- Papalas T.; Polychronidis I.; Antzaras A. N.; Lemonidou A. A. Enhancing the Intermediate-Temperature CO2 Capture Efficiency of Mineral MgO via Molten Alkali Nitrates and CaCO3: Characterization and Sorption Mechanism. J. CO2 Util. 2021, 50, 101605. 10.1016/j.jcou.2021.101605. [DOI] [Google Scholar]
- Horiuchi T.; Hidaka H.; Fukui T.; Kubo Y.; Horio M.; Suzuki K.; Mori T. Effect of Added Basic Metal Oxides on CO2 Adsorption on Alumina at Elevated Temperatures. Appl. Catal., A 1998, 167, 195–202. 10.1016/S0926-860X(97)00318-9. [DOI] [Google Scholar]
- Li L.; Wen X.; Fu X.; Wang F.; Zhao N.; Xiao F.; Wei W.; Sun Y. MgO/Al2O3 Sorbent for CO2 Capture. Energy Fuels 2010, 24, 5773–5780. 10.1021/ef100817f. [DOI] [Google Scholar]
- Gruene P.; Belova A. G.; Yegulalp T. M.; Farrauto R. J.; Castaldi M. J. Dispersed Calcium Oxide as a Reversible and Efficient CO2 sorbent at Intermediate Temperatures. Ind. Eng. Chem. Res. 2011, 50, 4042–4049. 10.1021/ie102475d. [DOI] [Google Scholar]
- Dong W.; Chen X.; Wu Y.; Zhao C.; Liang C. Carbonation Characteristics of Dry Sodium-Based Sorbents for CO2 Capture. Energy Fuels 2012, 26, 6040–6046. 10.1021/ef3006146. [DOI] [Google Scholar]
- Kazemi H.; Shahhosseini S.; Bazyari A.; Amiri M. A Study on the Effects of Textural Properties of γ-Al2O3 Support on CO2 Capture Capacity of Na2CO3. Process Saf. Environ. Prot. 2020, 138, 176–185. 10.1016/j.psep.2020.03.001. [DOI] [Google Scholar]
- Keturakis C. J.; Ni F.; Spicer M.; Beaver M. G.; Caram H. S.; Wachs I. E. Monitoring Solid Oxide CO2 Capture Sorbents in Action. ChemSusChem 2014, 7, 3459–3466. 10.1002/cssc.201402474. [DOI] [PubMed] [Google Scholar]
- Sengupta S.; Amte V.; Dongara R.; Das A. K.; Bhunia H.; Bajpai P. K. Effects of the Adsorbent Preparation Method for CO2 Capture from Flue Gas Using K2CO3/Al2O3 Adsorbents. Energy Fuels 2015, 29, 287–297. 10.1021/ef501792c. [DOI] [Google Scholar]
- Han S. J.; Bang Y.; Kwon H. J.; Lee H. C.; Hiremath V.; Song I. K.; Seo J. G. Elevated Temperature CO2 Capture on Nano-Structured MgO-Al2O3 Aerogel: Effect of Mg/Al Molar Ratio. Chem. Eng. J. 2014, 242, 357–363. 10.1016/j.cej.2013.12.092. [DOI] [Google Scholar]
- Voldsund M.; Jordal K.; Anantharaman R. Hydrogen Production with CO2 Capture. Int. J. Hydrogen Energy 2016, 41, 4969–4992. 10.1016/j.ijhydene.2016.01.009. [DOI] [Google Scholar]
- Chen J.; Xu Y.; Liao P.; Wang H.; Zhou H. Recent Progress in Integrated CO2 Capture and Conversion Process Using Dual Function Materials: A State-of-the-Art Review. Carbon Capture Sci. Technol. 2022, 4, 100052. 10.1016/j.ccst.2022.100052. [DOI] [Google Scholar]
- Charisiou N. D.; Papageridis K. N.; Tzounis L.; Sebastian V.; Hinder S. J.; Baker M. A.; AlKetbi M.; Polychronopoulou K.; Goula M. A. Ni Supported on CaO-MgO-Al2O3 as a Highly Selective and Stable Catalyst for H2 Production via the Glycerol Steam Reforming Reaction. Int. J. Hydrogen Energy 2019, 44, 256–273. 10.1016/j.ijhydene.2018.02.165. [DOI] [Google Scholar]
- Tsiotsias A. I.; Charisiou N. D.; Sebastian V.; Gaber S.; Hinder S. J.; Baker M. A.; Polychronopoulou K.; Goula M. A. A Comparative Study of Ni Catalysts Supported on Al2O3, MgO-CaO-Al2O3 and La2O3-Al2O3 for the Dry Reforming of Ethane. Int. J. Hydrogen Energy 2022, 47, 5337–5353. 10.1016/j.ijhydene.2021.11.194. [DOI] [Google Scholar]
- Duyar M. S.; Farrauto R. J.; Castaldi M. J.; Yegulalp T. M. In Situ CO2 Capture Using CaO/γ-Al2O3 Washcoated Monoliths for Sorption Enhanced Water Gas Shift Reaction. Ind. Eng. Chem. Res. 2014, 53, 1064–1072. 10.1021/ie402999k. [DOI] [Google Scholar]
- Wu G.; Zhang C.; Li S.; Huang Z.; Yan S.; Wang S.; Ma X.; Gong J. Sorption Enhanced Steam Reforming of Ethanol on Ni-CaO-Al2O3 Multifunctional Catalysts Derived from Hydrotalcite-like Compounds. Energy Environ. Sci. 2012, 5, 8942–8949. 10.1039/c2ee21995f. [DOI] [Google Scholar]
- Arellano-Treviño M. A.; He Z.; Libby M. C.; Farrauto R. J. Catalysts and Adsorbents for CO2 Capture and Conversion with Dual Function Materials: Limitations of Ni-Containing DFMs for Fl Ue Gas Applications. J. CO2 Util. 2019, 31, 143–151. 10.1016/j.jcou.2019.03.009. [DOI] [Google Scholar]
- Bermejo-López A.; Pereda-Ayo B.; González-Marcos J.; González-Velasco J. Mechanism of the CO2 Storage and in Situ Hydrogenation to CH4. Temperature and Adsorbent Loading Effects over Ru-CaO/Al2O3 and Ru-Na2CO3/Al2O3 Catalysts. Appl. Catal., B 2019, 256, 117845. 10.1016/j.apcatb.2019.117845. [DOI] [Google Scholar]
- Merkouri L. P.; Reina T. R.; Duyar M. S. Closing the Carbon Cycle with Dual Function Materials. Energy Fuels 2021, 35, 19859–19880. 10.1021/acs.energyfuels.1c02729. [DOI] [Google Scholar]
- Shao B.; Zhang Y.; Sun Z.; Li J.; Gao Z.; Xie Z.; Hu J.; Liu H. CO2 Capture and In-Situ Conversion: Recent Progresses and Perspectives. Green Chem. Eng. 2022, 3, 189–198. 10.1016/j.gce.2021.11.009. [DOI] [Google Scholar]
- Tsiotsias A. I.; Charisiou N. D.; Yentekakis I. V.; Goula M. A. The Role of Alkali and Alkaline Earth Metals in the CO2 Methanation Reaction and the Combined Capture and Methanation of CO2. Catalysts 2020, 10, 812. 10.3390/catal10070812. [DOI] [Google Scholar]
- Sasayama T.; Kosaka F.; Liu Y.; Yamaguchi T.; Chen S. Y.; Mochizuki T.; Urakawa A.; Kuramoto K. Integrated CO2 capture and Selective Conversion to Syngas Using Transition-Metal-Free Na/Al2O3 dual-Function Material. J. CO2 Util. 2022, 60, 102049. 10.1016/j.jcou.2022.102049. [DOI] [Google Scholar]
- Porta A.; Matarrese R.; Visconti C. G.; Castoldi L.; Lietti L. Storage Material Effects on the Performance of Ru-Based CO2 Capture and Methanation Dual Functioning Materials. Ind. Eng. Chem. Res. 2021, 60, 6706–6718. 10.1021/acs.iecr.0c05898. [DOI] [Google Scholar]
- Chai K. H.; Leong L. K.; Wong D. S. H.; Tsai D. H.; Sethupathi S. Effect of CO2 Adsorbents on the Ni-Based Dual-Function Materials for CO2 Capturing and in Situ Methanation. J. Chin. Chem. Soc. 2020, 67, 998–1008. 10.1002/jccs.202000086. [DOI] [Google Scholar]
- Charisiou N. D.; Siakavelas G.; Papageridis K. N.; Baklavaridis A.; Tzounis L.; Avraam D. G.; Goula M. A. Syngas Production via the Biogas Dry Reforming Reaction over Nickel Supported on Modified with CeO2 and/or La2O3 Alumina Catalysts. J. Nat. Gas Sci. Eng. 2016, 31, 164–183. 10.1016/j.jngse.2016.02.021. [DOI] [Google Scholar]
- Thommes M.; Kaneko K.; Neimark A. V.; Olivier J. P.; Rodriguez-Reinoso F.; Rouquerol J.; Sing K. S. W. Physisorption of Gases, with Special Reference to the Evaluation of Surface Area and Pore Size Distribution (IUPAC Technical Report). Pure Appl. Chem. 2015, 87, 1051–1069. 10.1515/pac-2014-1117. [DOI] [Google Scholar]
- Özdemi̇r H.; Faruk Öksüzömer M. Synthesis of Al2O3, MgO and MgAl2O4 by Solution Combustion Method and Investigation of Performances in Partial Oxidation of Methane. Powder Technol. 2020, 359, 107–117. 10.1016/j.powtec.2019.10.001. [DOI] [Google Scholar]
- Kosaka F.; Sasayama T.; Liu Y.; Chen S. Y.; Mochizuki T.; Matsuoka K.; Urakawa A.; Kuramoto K. Direct and Continuous Conversion of Flue Gas CO2 into Green Fuels Using Dual Function Materials in a Circulating Fluidized Bed System. Chem. Eng. J. 2022, 450, 138055. 10.1016/j.cej.2022.138055. [DOI] [Google Scholar]
- Sun H.; Wu C.; Shen B.; Zhang X.; Zhang Y.; Huang J. Progress in the Development and Application of CaO-Based Adsorbents for CO2 Capture—a Review. Mater. Today Sustain. 2018, 1–2, 1–27. 10.1016/j.mtsust.2018.08.001. [DOI] [Google Scholar]
- Cimino S.; Boccia F.; Lisi L. Effect of Alkali Promoters (Li, Na, K) on the Performance of Ru/Al2O3 Catalysts for CO2 Capture and Hydrogenation to Methane. J. CO2 Util. 2020, 37, 195–203. 10.1016/j.jcou.2019.12.010. [DOI] [Google Scholar]
- Proaño L.; Tello E.; Arellano-Trevino M. A.; Wang S.; Farrauto R. J.; Cobo M. In-Situ DRIFTS Study of Two-Step CO2 Capture and Catalytic Methanation over Ru,“Na2O”/Al2O3 Dual Functional Material. Appl. Surf. Sci. 2019, 479, 25–30. 10.1016/j.apsusc.2019.01.281. [DOI] [Google Scholar]
- Papageridis K. N.; Siakavelas G.; Charisiou N. D.; Avraam D. G.; Tzounis L.; Kousi K.; Goula M. A. Comparative Study of Ni, Co, Cu Supported on γ-Alumina Catalysts for Hydrogen Production via the Glycerol Steam Reforming Reaction. Fuel Process. Technol. 2016, 152, 156–175. 10.1016/j.fuproc.2016.06.024. [DOI] [Google Scholar]
- Zhu L.; Cao M.; Zhou H.; Zhang N.; Zheng J.; Li Y.; Chen B. H. A Highly Stable and Active CaO/Al2O3 Base Catalyst in the Form of Calcium Aluminate Phase for Oxidation of Cyclohexanone to ε-Caprolactone. Catal. Lett. 2014, 144, 1188–1196. 10.1007/s10562-014-1277-6. [DOI] [Google Scholar]
- Dejene F. B.; Bem D. B.; Swart H. C. Synthesis and Characterization of CaAlxOy:Eu2+ Phosphors Prepared Using Solution-Combustion Method. J. Rare Earths 2010, 28, 272–276. 10.1016/S1002-0721(10)60380-8. [DOI] [Google Scholar]
- Dong W.; Chen X.; Yu F.; Wu Y. Na2CO3/MgO/Al2O3 Solid Sorbents for Low-Temperature CO2 Capture. Energy Fuels 2015, 29, 968–973. 10.1021/ef502400s. [DOI] [Google Scholar]
- Wang S.; Farrauto R. J.; Karp S.; Jeon J. H.; Schrunk E. T. Parametric, Cyclic Aging and Characterization Studies for CO2 Capture from Flue Gas and Catalytic Conversion to Synthetic Natural Gas Using a Dual Functional Material (DFM). J. CO2 Util. 2018, 27, 390–397. 10.1016/j.jcou.2018.08.012. [DOI] [Google Scholar]
- Mao J.; Gu Q.; Gregory D. H. Revisiting the Hydrogen Storage Behavior of the Na-O-H System. Materials 2015, 8, 2191–2203. 10.3390/ma8052191. [DOI] [Google Scholar]
- Veselovskaya J. V.; Lysikov A. I.; Netskina O. V.; Kuleshov D. V.; Okunev A. G. K2CO3-Containing Composite Sorbents Based on Thermally Modified Alumina: Synthesis, Properties, and Potential Application in a Direct Air Capture/Methanation Process. Ind. Eng. Chem. Res. 2020, 59, 7130–7139. 10.1021/acs.iecr.9b05457. [DOI] [Google Scholar]
- Tsiotsias A. I.; Charisiou N. D.; AlKhoori A.; Gaber S.; Stolojan V.; Sebastian V.; van der Linden B.; Bansode A.; Hinder S. J.; Baker M. A.; et al. Optimizing the Oxide Support Composition in Pr-Doped CeO2 towards Highly Active and Selective Ni-Based CO2 Methanation Catalysts. J. Energy Chem. 2022, 71, 547–561. 10.1016/j.jechem.2022.04.003. [DOI] [Google Scholar]
- Polychronopoulou K.; Alkhoori S.; Albedwawi S.; Alareeqi S.; Hussien A. G. S.; Vasiliades M. A.; Efstathiou A. M.; Petallidou K. C.; Singh N.; Anjum D. H.; et al. Decoupling the Chemical and Mechanical Strain Effect on Steering the CO2Activation over CeO2-Based Oxides: An Experimental and DFT Approach. ACS Appl. Mater. Interfaces 2022, 14, 33094–33119. 10.1021/acsami.2c05714. [DOI] [PMC free article] [PubMed] [Google Scholar]
- Phung Q. T.; Maes N.; Seetharam S. Pitfalls in the Use and Interpretation of TGA and MIP Techniques for Ca-Leached Cementitious Materials. Mater. Des. 2019, 182, 108041. 10.1016/j.matdes.2019.108041. [DOI] [Google Scholar]
- Samylingam I.; Aslfattahi N.; Kadirgama K.; Samykano M.; Samylingam L. Improved Thermophysical Properties of Developed Ternary Nitrate-Based Phase Change Material Incorporated with MXene as Novel Nanocomposites. Energy Eng. 2021, 118, 1253–1265. 10.32604/EE.2021.016087. [DOI] [Google Scholar]
- Olivares R. I.; Edwards W. LiNO3-NaNO3- KNO3 Salt for Thermal Energy Storage: Thermal Stability Evaluation in Different Atmospheres. Thermochim. Acta 2013, 560, 34–42. 10.1016/j.tca.2013.02.029. [DOI] [Google Scholar]
- Raganati F.; Chirone R.; Ammendola P. CO2 Capture by Temperature Swing Adsorption: Working Capacity As Affected by Temperature and CO2 Partial Pressure. Ind. Eng. Chem. Res. 2020, 59, 3593–3605. 10.1021/acs.iecr.9b04901. [DOI] [Google Scholar]
- Georgiadis A. G.; Charisiou N. D.; Gaber S.; Polychronopoulou K.; Yentekakis I. V.; Goula M. A. Adsorption of Hydrogen Sulfide at Low Temperatures Using an Industrial Molecular Sieve: An Experimental and Theoretical Study. ACS Omega 2021, 6, 14774–14787. 10.1021/acsomega.0c06157. [DOI] [PMC free article] [PubMed] [Google Scholar]
- Zhao X.; Ji G.; Liu W.; He X.; Anthony E. J.; Zhao M. Mesoporous MgO Promoted with NaNO3/NaNO2 for Rapid and High-Capacity CO2 Capture at Moderate Temperatures. Chem. Eng. J. 2018, 332, 216–226. 10.1016/j.cej.2017.09.068. [DOI] [Google Scholar]
- Goldman M.; Kota S.; Gao X.; Katzman L.; Farrauto R. Parametric and laboratory aging studies of direct CO2 air capture simulating ambient capture conditions and desorption of CO2 on supported alkaline adsorbents. Carbon Capture Sci. Technol. 2023, 6, 100094. 10.1016/j.ccst.2022.100094. [DOI] [Google Scholar]
- Tsiotsias A. I.; Charisiou N. D.; Harkou E.; Hafeez S.; Manos G.; Constantinou A.; Hussien A. G. S.; Dabbawala A. A.; Sebastian V.; Hinder S. J.; et al. Enhancing CO2 Methanation over Ni Catalysts Supported on Sol-Gel Derived Pr2O3-CeO2: An Experimental and Theoretical Investigation. Appl. Catal., B 2022, 318, 121836. 10.1016/j.apcatb.2022.121836. [DOI] [Google Scholar]
- Wang C.; Li Y.; You G.; Zhu Q. The Promotional Effect of Sodium Chloride on Thermophysical Properties of Nitrate. IOP Conf. Ser.: Mater. Sci. Eng. 2020, 772, 012033. 10.1088/1757-899X/772/1/012033. [DOI] [Google Scholar]
- Guo Q.; Wang T. Study on Preparation and Thermal Properties of Sodium Nitrate/Silica Composite as Shape-Stabilized Phase Change Material. Thermochim. Acta 2015, 613, 66–70. 10.1016/j.tca.2015.05.023. [DOI] [Google Scholar]
- Bardwell C. J.; Bickley R. I.; Poulston S.; Twigg M. V. Thermal decomposition of bulk and supported barium nitrate. Thermochim. Acta 2015, 613, 94–99. 10.1016/j.tca.2015.05.013. [DOI] [Google Scholar]
- Lin S.; Hao Z.; Shen J.; Chang X.; Huang S.; Li M.; Ma X. Enhancing the CO2 methanation activity of Ni/CeO2 via activation treatment-determined metal-support interaction. J. Energy Chem. 2021, 59, 334–342. 10.1016/j.jechem.2020.11.011. [DOI] [Google Scholar]
- Nakagawa Y.; Nakazawa H.; Watanabe H.; Tomishige K. Total Hydrogenation of Furfural over a Silica-Supported Nickel Catalyst Prepared by the Reduction of a Nickel Nitrate Precursor. ChemCatChem 2012, 4, 1791–1797. 10.1002/cctc.201200218. [DOI] [Google Scholar]
- Farahmandjou M.; Khodadadi A.; Yaghoubi M. Low Concentration Iron-Doped Alumina (Fe/Al2O3) Nanoparticles Using Co-Precipitation Method. J. Supercond. Novel Magn. 2020, 33, 3425–3432. 10.1007/s10948-020-05569-0. [DOI] [Google Scholar]
- Monazam E. R.; Spenik J.; Shadle L. J. Fluid Bed Adsorption of Carbon Dioxide on Immobilized Polyethylenimine (PEI): Kinetic Analysis and Breakthrough Behavior. Chem. Eng. J. 2013, 223, 795–805. 10.1016/j.cej.2013.02.041. [DOI] [Google Scholar]
- Loganathan S.; Tikmani M.; Edubilli S.; Mishra A.; Ghoshal A. K. CO2 Adsorption Kinetics on Mesoporous Silica under Wide Range of Pressure and Temperature. Chem. Eng. J. 2014, 256, 1–8. 10.1016/j.cej.2014.06.091. [DOI] [Google Scholar]
- Álvarez-Gutiérrez N.; Gil M. V.; Rubiera F.; Pevida C. Kinetics of CO2 Adsorption on Cherry Stone-Based Carbons in CO2/CH4 Separations. Chem. Eng. J. 2017, 307, 249–257. 10.1016/j.cej.2016.08.077. [DOI] [Google Scholar]
- Sohn S.; Kim D. Modification of Langmuir Isotherm in Solution Systems - Definition and Utilization of Concentration Dependent Factor. Chemosphere 2005, 58, 115–123. 10.1016/j.chemosphere.2004.08.091. [DOI] [PubMed] [Google Scholar]
- Lopes E. C. N.; Dos Anjos F. S. C.; Vieira E. F. S.; Cestari A. R. An Alternative Avrami Equation to Evaluate Kinetic Parameters of the Interaction of Hg(II) with Thin Chitosan Membranes. J. Colloid Interface Sci. 2003, 263, 542–547. 10.1016/S0021-9797(03)00326-6. [DOI] [PubMed] [Google Scholar]
- Do D. D.; Do H. D. Non-Isothermal Effects on Adsorption Kinetics of Hydrocarbon Mixtures in Activated Carbon. Sep. Purif. Technol. 2000, 20, 49–65. 10.1016/S1383-5866(00)00062-9. [DOI] [Google Scholar]
- Stevens L.; Williams K.; Han W. Y.; Drage T.; Snape C.; Wood J.; Wang J. Preparation and CO2 Adsorption of Diamine Modified Montmorillonite via Exfoliation Grafting Route. Chem. Eng. J. 2013, 215–216, 699–708. 10.1016/j.cej.2012.11.058. [DOI] [Google Scholar]
- Cestari A. R.; Vieira E. F. S.; Matos J. D. S.; Dos Anjos D. S. C. Determination of Kinetic Parameters of Cu(II) Interaction with Chemically Modified Thin Chitosan Membranes. J. Colloid Interface Sci. 2005, 285, 288–295. 10.1016/j.jcis.2004.11.035. [DOI] [PubMed] [Google Scholar]
- Dal Pozzo A.; Armutlulu A.; Rekhtina M.; Abdala P. M.; Müller C. R. CO2 Uptake and Cyclic Stability of MgO-Based CO2 Sorbents Promoted with Alkali Metal Nitrates and Their Eutectic Mixtures. ACS Appl. Energy Mater. 2019, 2, 1295–1307. 10.1021/acsaem.8b01852. [DOI] [Google Scholar]
- Shen X.; Yan F.; Li C.; Qu F.; Wang P.; Zhao S.; Zhang Z. Amine-Functionalized Nano-Al2O3 Adsorbent for CO2 Separation from Biogas: Efficient CO2 Uptake and High Anti-Urea Stability. J. Cleaner Prod. 2022, 332, 130078. 10.1016/j.jclepro.2021.130078. [DOI] [Google Scholar]
- Li X.; Wang Z.; Mei Y.; Feng R.; Liu Z.; Huang J.; Dong L.; Fang Y. Alumina-Extracted Residue-Derived Silica Foams with Ultra-Large Pore Volume for Highly Superior Post-Combustion CO2 Capture. Fuel 2022, 316, 123231. 10.1016/j.fuel.2022.123231. [DOI] [Google Scholar]
- Singh V. K.; Kumar E. A. Comparative Studies on CO2 Adsorption Kinetics by Solid Adsorbents. Energy Procedia 2016, 90, 316–325. 10.1016/j.egypro.2016.11.199. [DOI] [Google Scholar]
- Duyar M. S.; Treviño M. A. A.; Farrauto R. J. Dual Function Materials for CO2 Capture and Conversion Using Renewable H2. Appl. Catal., B 2015, 168–169, 370–376. 10.1016/j.apcatb.2014.12.025. [DOI] [Google Scholar]
- Ayawei N.; Ebelegi A. N.; Wankasi D. Modelling and Interpretation of Adsorption Isotherms. J. Chem. 2017, 2017, 1–11. 10.1155/2017/3039817. [DOI] [Google Scholar]
- Abdi J.; Hadavimoghaddam F.; Hadipoor M.; Hemmati-Sarapardeh A. Modeling of CO2 Adsorption Capacity by Porous Metal Organic Frameworks Using Advanced Decision Tree-Based Models. Sci. Rep. 2021, 11, 24468. 10.1038/s41598-021-04168-w. [DOI] [PMC free article] [PubMed] [Google Scholar]
- Varghese A. M.; Reddy K. S. K.; Singh S.; Karanikolos G. N. Performance Enhancement of CO2 Capture Adsorbents by UV Treatment: The Case of Self-Supported Graphene Oxide Foam. Chem. Eng. J. 2020, 386, 124022. 10.1016/j.cej.2020.124022. [DOI] [Google Scholar]
- Dabbawala A. A.; Ismail I.; Vaithilingam B. V.; Polychronopoulou K.; Singaravel G.; Morin S.; Berthod M.; Al Wahedi Y. Synthesis of Hierarchical Porous Zeolite-Y for Enhanced CO2 Capture. Microporous Mesoporous Mater. 2020, 303, 110261. 10.1016/j.micromeso.2020.110261. [DOI] [Google Scholar]
- Rakić V.; Rac V.; Krmar M.; Otman O.; Auroux A. The Adsorption of Pharmaceutically Active Compounds from Aqueous Solutions onto Activated Carbons. J. Hazard. Mater. 2015, 282, 141–149. 10.1016/j.jhazmat.2014.04.062. [DOI] [PubMed] [Google Scholar]
- Rosset M.; Sfreddo L. W.; Perez-Lopez O. W.; Féris L. A. Effect of Concentration in the Equilibrium and Kinetics of Adsorption of Acetylsalicylic Acid on ZnAl Layered Double Hydroxide. J. Environ. Chem. Eng. 2020, 8, 103991. 10.1016/j.jece.2020.103991. [DOI] [Google Scholar]
Associated Data
This section collects any data citations, data availability statements, or supplementary materials included in this article.