Abstract
White blood cells, also called leukocytes, are hematopoietic cells of the immune system that are involved in protecting the body against both infectious diseases and foreign materials. The abnormal development and uncontrolled proliferation of these cells can lead to devastating cancers. Their timely recognition in the peripheral blood is critical to diagnosis and treatment. In this study, we developed a microscopic imaging system for improving the visualization of white blood cells on Wright’s stained blood smear slides, with two different setups: polarized light imaging and polarized hyperspectral imaging. Based on the polarized light imaging setup, we collected the RGB images of Stokes vector parameters (S0, S1, S2, and S3) of five types of white blood cells (neutrophil, eosinophil, basophil, lymphocyte, and monocyte), and calculated the Stokes vector derived parameters: the degree of polarization (DOP), the degree of linear polarization (DOLP), and the degree of circular polarization (DOCP)). We also calculated Stokes vector data based on the polarized hyperspectral imaging setup. The preliminary results demonstrate that Stokes vector derived parameters (DOP, DOLP, and DOCP) could improve the visualization of granules in granulocytes (neutrophils, eosinophils, and basophils). Furthermore, Stokes vector derived parameters (DOP, DOLP, and DOCP) could improve the visualization of surface structures (protein patterns) of lymphocytes enabling subclassification of lymphocyte subpopulations. Finally, S2, S3, and DOCP could enhance the morphologic visualization of monocyte nucleus. We also demonstrated that the polarized hyperspectral imaging setup could provide complementary spectral information to the spatial information on different Stokes vector parameters of white blood cells. This work demonstrates that polarized light imaging & polarized hyperspectral imaging has the potential to become a strong imaging tool in the diagnosis of disorders arising from white blood cells.
Keywords: Polarized hyperspectral imaging, Hyperspectral imaging, Polarized light imaging, Stokes vector, White blood cell
1. INTRODUCTION
White blood cells (leukocytes) function as the body’s defenders against pathogens. They can be broadly classified into five different types: basophils, eosinophils, neutrophils, lymphocytes, and monocytes. Blood smear analysis is a common procedure to accompany a standard complete blood count (CBC) of all the elements inside a sample of blood, including white blood cells. Differences in the number, proportion, and morphology (e.g., size, shape, granulation, nuclear size and condensation) of white blood cells are associated with a variety of diseases and conditions. For example, the presence of immature lymphocytes known as lymphoblasts or immature neutrophils known as myeloblasts in large numbers result in leukemia [1]. This makes an accurate identification and count of different types of white blood cells crucial in disease diagnosis.
Current methods for counting white blood cells include manual and automatic methods. Manual methods microscopic examination of stained peripheral blood slides to count and classify white blood cells; however, this process is time-consuming and highly dependent on the skills of the technician, pathologist or clinician performing the task, which creates significant room for error [2]. Automated methods have made large progress in easing the burdens of manual classification but are notably suboptimal in the presence of cell abnormalities, requiring manual analysis [3, 4].
Hyperspectral imaging (HSI) is a novel imaging technique first used in remote sensing that has since found applications in many different fields, including biomedical applications [5]. Each image represents a three-dimensional data cube with two spatial dimensions and one spectral dimension with many discrete channels, allowing for more complex spectral analysis. Our group has investigated several machine learning and deep learning algorithms for head and neck cancer detection based on hyperspectral imaging, including principal component analysis (PCA) [6], tensor-based computation and modeling [7], the incorporation of support vector machine (SVM) into a minimum spanning forest [8, 9], non-negative matrix factorization (NMF) [10], the combination of superpixels, PCA, and SVM [11], as well as convolutional neural networks (CNN) [12, 13, 14, 15, 16, 17]. Recent works have shown the usefulness of hyperspectral imaging for white blood cell classification. Li et al used an acousto-optic tunable filter (AOTF) based molecular hyperspectral system to distinguish the nucleus from the cytoplasm in white blood cells [18]. Robison et al used a snapshot hyperspectral camera to differentiate red blood cells and white blood cells on unstained slides [19]. Duan et al proposed a leukocyte segmentation algorithm for automatic classification of white blood cells using an AOTF-based hyperspectral system [20]. Further research has combined HSI with deep learning methods to further improve classification accuracy [21, 22, 23, 24].
Polarized light imaging is a technique used to reveal morphological features that cannot be identified by unpolarized light techniques. This modality acquires the polarization characteristics of light which can reveal a wide range of structural features in biological tissues. There is significant research on the interaction of polarized light with biological tissues [25, 26]; however, few have investigated this interaction in white blood cells. Current research largely integrates polarized light scattering with flow cytometry rather than optical imaging to detect morphological differences in white blood cells [27, 28]. Optical polarization imaging has mainly found use in detecting cell abnormalities and features inside phagocytic white blood cells. Polarized hyperspectral imaging (PHSI) combines polarized light imaging with HSI to acquire the polarization state, spectrum, and spatial information of a sample. We have previously used PHSI combined with machine learning to detect head and neck cancer on tissue slides [29, 30, 31].
In this paper, we developed a microscopic imaging system for improving the visualization of microstructures of white blood cells on Wright’s stained blood smear slides. Firstly, we demonstrated that our customized microscope has good performances in visualizing the granules in granulocytes (i.e., neutrophils, eosinophils, and basophils), cells of the innate immune system that are distinguished morphologically by the presence of distinct granules in their cytoplasm [33], which impart different functions in immune responses (e.g., neutrophils and basophils defend against bacteria and parasites, respectively). Degranulation of granulocytes is a critical cellular process that releases antimicrobial cytotoxic and other important molecules from granules. The normal function of granulocytes is essential to health, and when impaired, the clinical manifestations are diverse and significant. For instance, granulocytopenia, an abnormally low concentration of granulocytes in the blood, reduces the body’s resistance to infections. On the other hand, decreased granulation by granulocytes (e.g., hypogranulation) may be indicative of a pre-leukemic state (e.g., myelodysplastic syndrome) that can lead to the development of leukemia. Secondly, we demonstrated that our customized microscope performed well in visualizing the surface structures of lymphocytes, which may reflect surface protein expression patterns (e.g., antigen receptors) that depend on the type of lymphocyte (B or T-cell) and/or degree of maturation (i.e., lymphoblast vs more mature) and/or activation stages (exposed to antigen or not). and their maturation (i.e., lymphoblast vs mature) and/or activation stages. Lymphocytes are central components of adaptive immune responses that bear antigen receptors that specifically recognize different components of a pathogen (i.e, antigens). When a lymphocyte encounters a pathogen and binds the specific antigen that its antigen receptors recognize, it becomes activated, divides, and goes on to play important effector roles such as producing antibodies (i.e., B-cells) or defending against cancers (i.e., T-cells) [34, 35]. Thirdly, we demonstrated that our customized microscope has good performances in visualizing the morphologic features of the nucleus of monocytes. Monocytes are the largest type of white blood cell. Monocytes play critical roles in innate immunity, adaptive immune responses, and tissue repair. Finally, we demonstrated that our customized microscope could provide complementary spectral information to the spatial information on different Stokes vector parameters of white blood cells. Generally, this study demonstrates that polarized light imaging & polarized hyperspectral imaging has the potential to become a strong imaging tool for the diagnosis of diseases/disorders of white blood cells.
2. METHODS
2.1. Polarized light imaging & polarized hyperspectral imaging
Under both the polarized light imaging setup and the polarized hyperspectral imaging setup, our customized microscopic system is able to acquire Stokes vector parameters (S0, S1, S2, and S3). Stokes vector imaging is realized by two polarizers and two LCVRs. Figure 1 demonstrates the polarized light imaging setup and the polarized hyperspectral imaging setup of the microscopic system.
Figure 1.
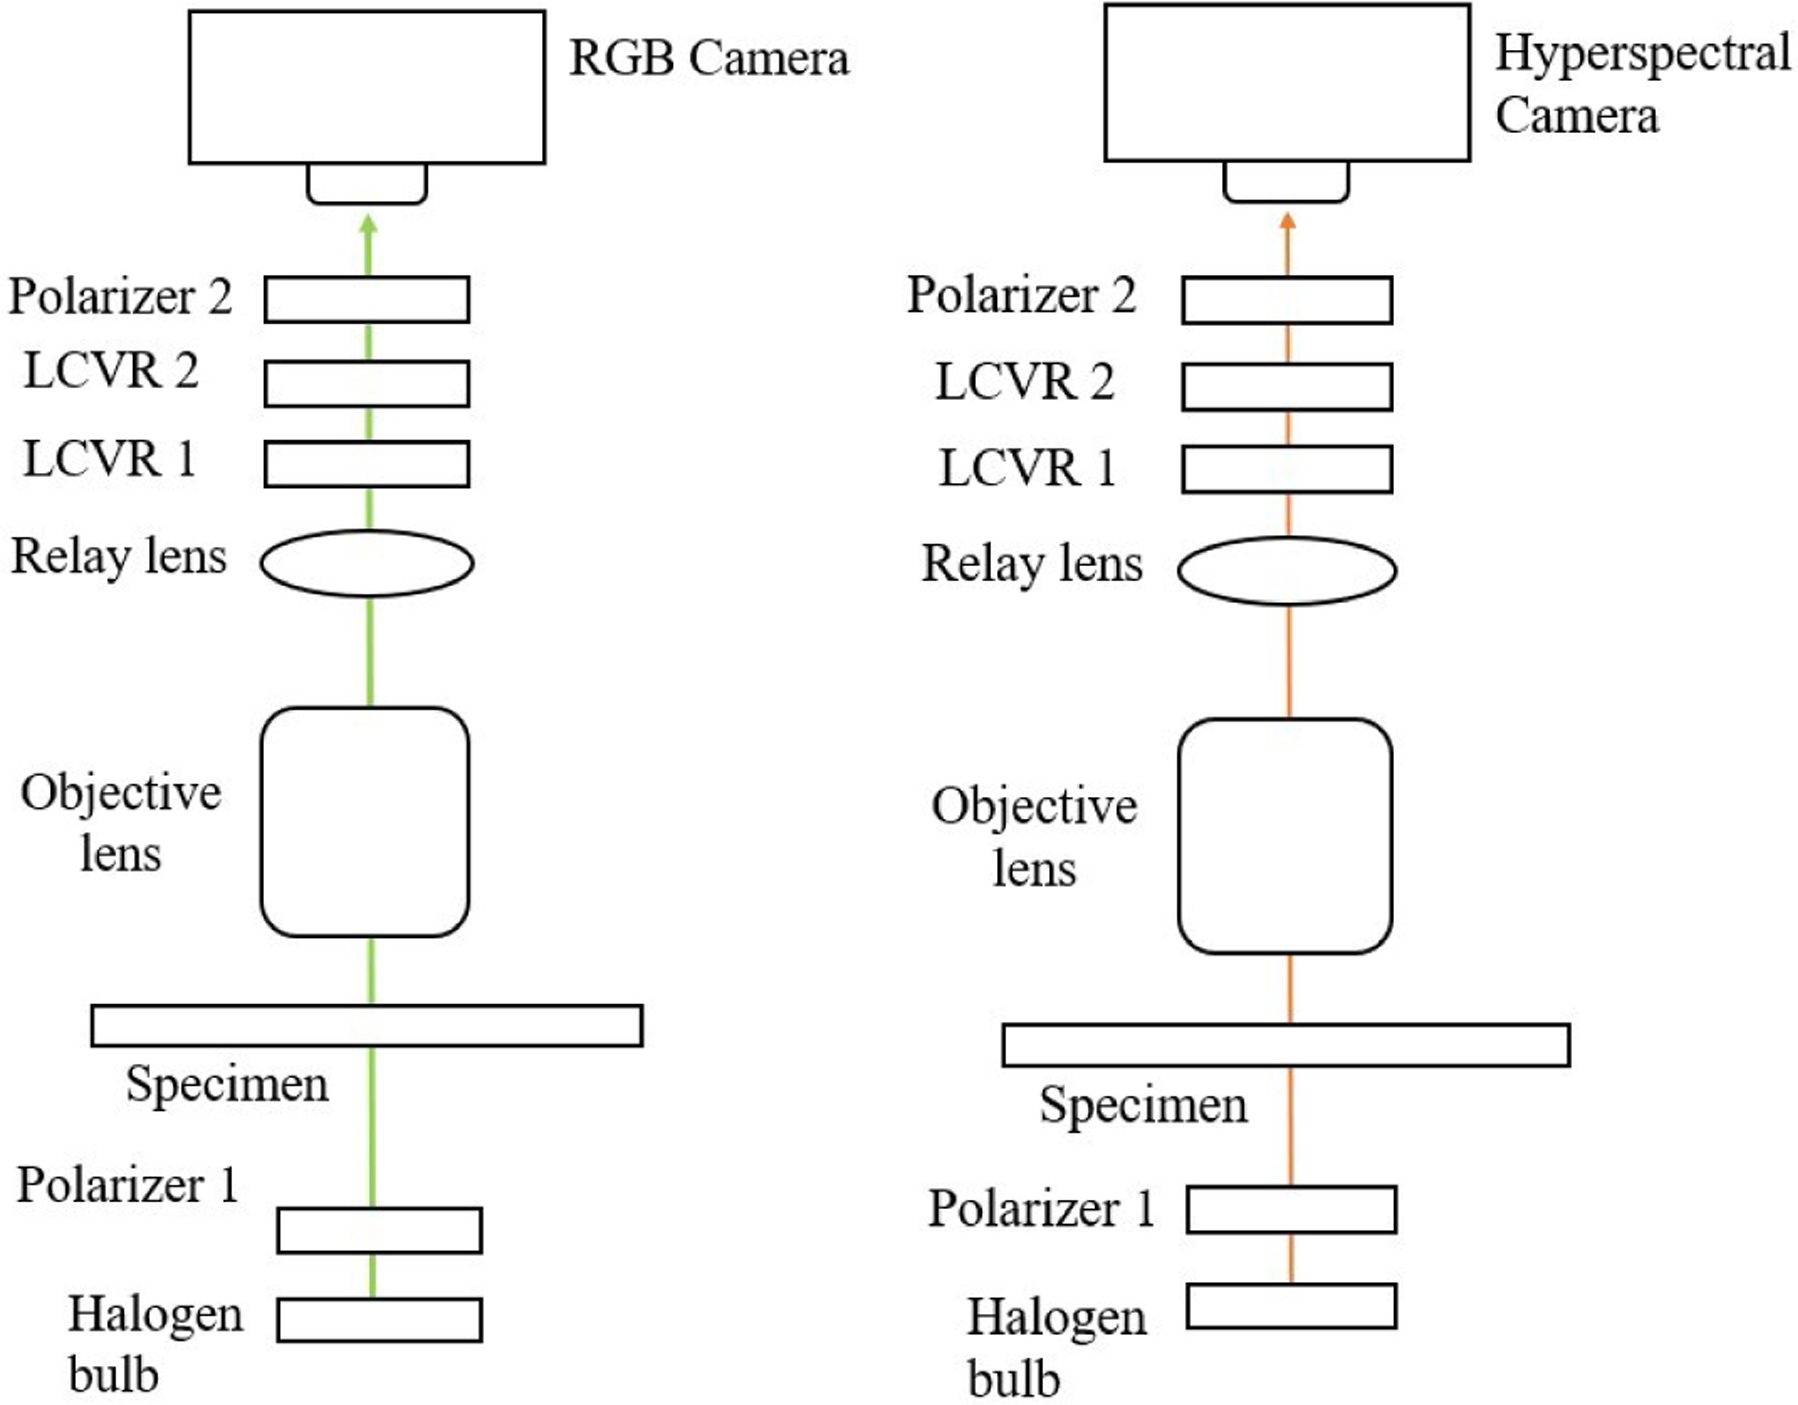
The setups of polarized light imaging (left) and polarized hyperspectral imaging (right) of our customized microscopic system.
Polarizer 1 was set at 45 degrees, and polarizer 2 was set at 0 degrees. LCVR 1 was set at 0 degrees, and LCVR 2 was set at 45 degrees. The system is capable of full Stokes polarimetric imaging, which produces all four components of the Stokes vector. Thus, the system can completely define the polarization properties of transmitted light. The way to calculate the four elements of Stokes vector (S0, S1, S2, and S3) is expressed in Equation (1):
| (1) |
where Ih represents the light intensity measured with a horizontal linear analyzer, in which the retardations of LCVR 1 and LCVR 2 are both set at 0 rad; Iv represents the light intensity measured with a vertical linear analyzer, in which LCVR 1 is set at 0 rad retardation and LCVR 2 is set at π rad retardation; I45 represents the light intensity measured with a 45 degrees oriented linear analyzer, in which LCVR 1 and LCVR 2 are both set at π/2 rad retardation; Ilc represents the light intensity measured with a right circular analyzer, in which LCVR 1 is set at 0 rad retardation and LCVR 2 is set at π/2 rad retardation. The phase retardation of LCVR is determined by different values of voltage applied on it. In addition, the value of S0 is equal to the value of light intensity.
After acquiring the four Stokes vector parameters, we calculated the Stokes vector derived parameters DOP, DOLP, DOCP using Equation (2):
| (2) |
Comparing to the polarized light imaging setup, the polarized hyperspectral imaging setup can help us to get more insights into the interaction between white blood cells and light at different wavelengths by extracting the spectra of Stokes vector parameters. The polarized hyperspectral imaging setup of microscopic system uses a SnapScan hyperspectral camera instead of the RGB camera. In the polarized hyperspectral imaging dataset obtained by the system, each Stokes vector parameter corresponds to a 3D data cube with two spatial dimensions and one spectral dimension, as is shown in Figure 2.
Figure 2.

Diagram of full-polarization hyperspectral imaging data cubes. The data cube of each Stokes parameter (S0, S1, S2, and S3) has three dimensions including two spatial dimensions (x, y) and one spectral dimension (λ).
2.2. Synthetic RGB images
To generate synthetic RGB images from Stokes vector data cubes, we adopted an HSI-to-RGB transformation function similar to the spectral response of human eye and modified it for our data to generate the synthetic RGB images [32]. The transformation function is shown in Figure 3. In the transformation process, three different spectral response curves (R,G,B) are multiplied with the data cubes to generated the three images at the three channels (red, green, blue) of synthetic RGB images. We applied this HSI-to-RGB transformation function to all the four Stokes vector parameters (S0, S1, S2, and S3) to generate four sets of PHSI-synthesized RGB images.
Figure 3.
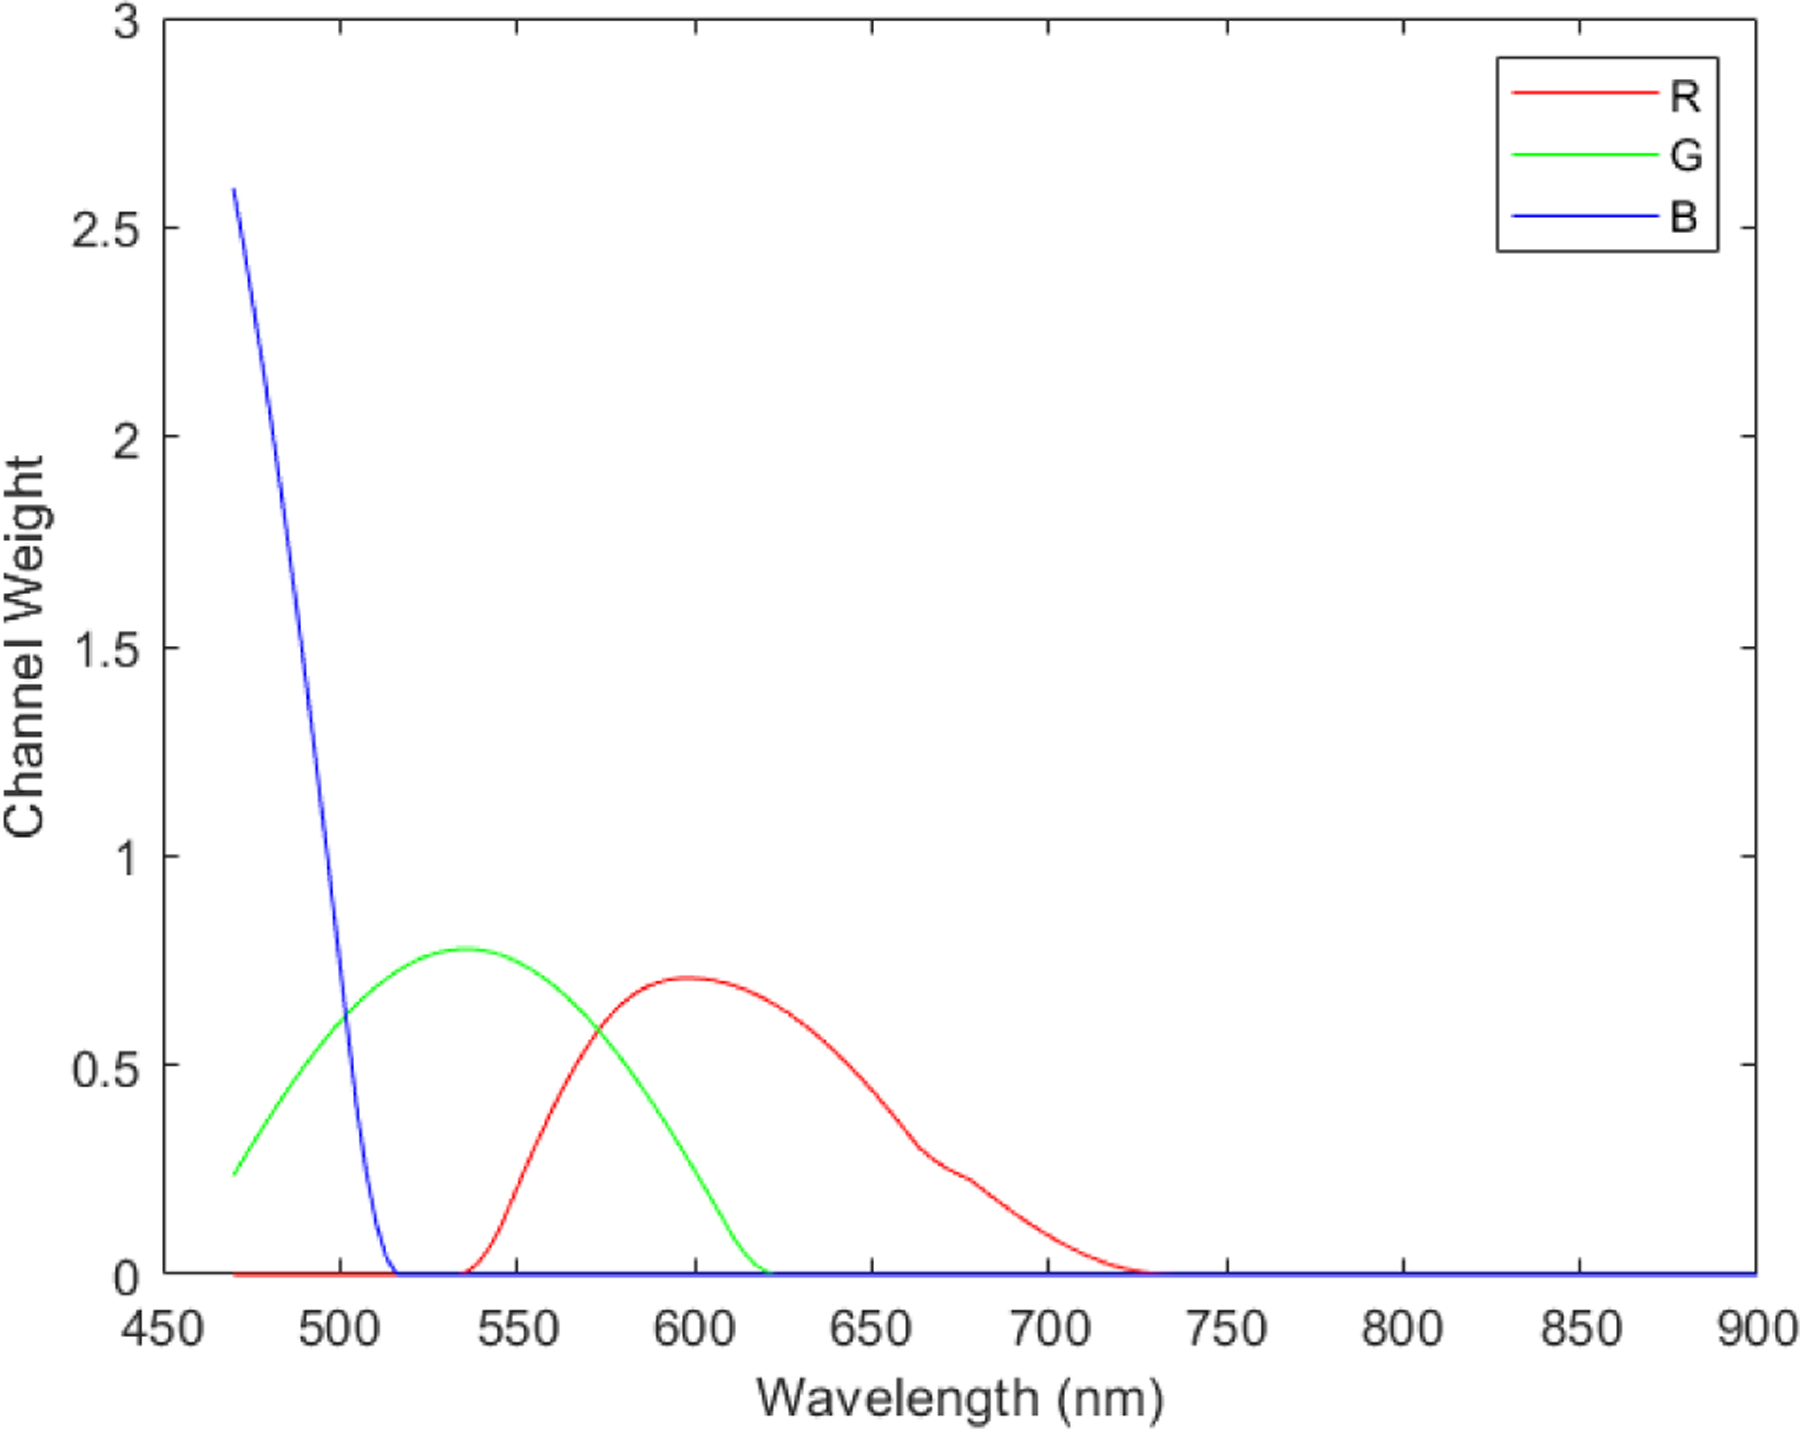
Transformation function to synthesize pseudo-RGB images from the polarized hyperspectral data cubes. In the transformation process, three different spectral response curves (R,G,B) are multiplied with the data cubes to generated the three images at the three channels (red, green, blue) of synthetic RGB images.
2.3. Spectra extraction
In order to accurately extract the spectra of Stokes vector parameters (S0, S1, S2, and S3) from different types of white blood cells, we manually outlined the cell regions in the synthetic RGB images of S0 to generate the binary masks of cells. The cell masks generated from S0 were also applied to S1, S2, and S3 to extract the same regions of interest (ROI) from the synthetic RGB images. In the next step, we apply the cell binary mask to the data cubes of Stokes vector parameters (S0, S1, S2, and S3) to extract the four spectra (S0, S1, S2, and S3) of the cell ROI with mean and standard deviation from all the pixels in the ROI. This process can help to get rid of the influence of background pixels on the spectra of Stokes vector parameters (S0, S1, S2, and S3).
3. RESULTS
3.1. Polarized light images of granulocytes (neutrophils, eosinophils, and basophils)
Figure 4, Figure 5, and Figure 6 demonstrate the RGB images of Stokes vector parameters (S0, S1, S2, and S3) and Stokes vector derived parameters (DOP, DOLP, and DOCP) of an eosinophil, a basophil, and a neutrophil from a Wright’s stained blood smear slide. The preliminary results demonstrate that Stokes vector derived parameters (DOP, DOLP, and DOCP) could improve the visualization of granules in granulocytes (eosinophils, basophils, and neutrophils), and DOCP performs the best among the three parameters. The RGB images were collected by polarized light imaging setup.
Figure 4.
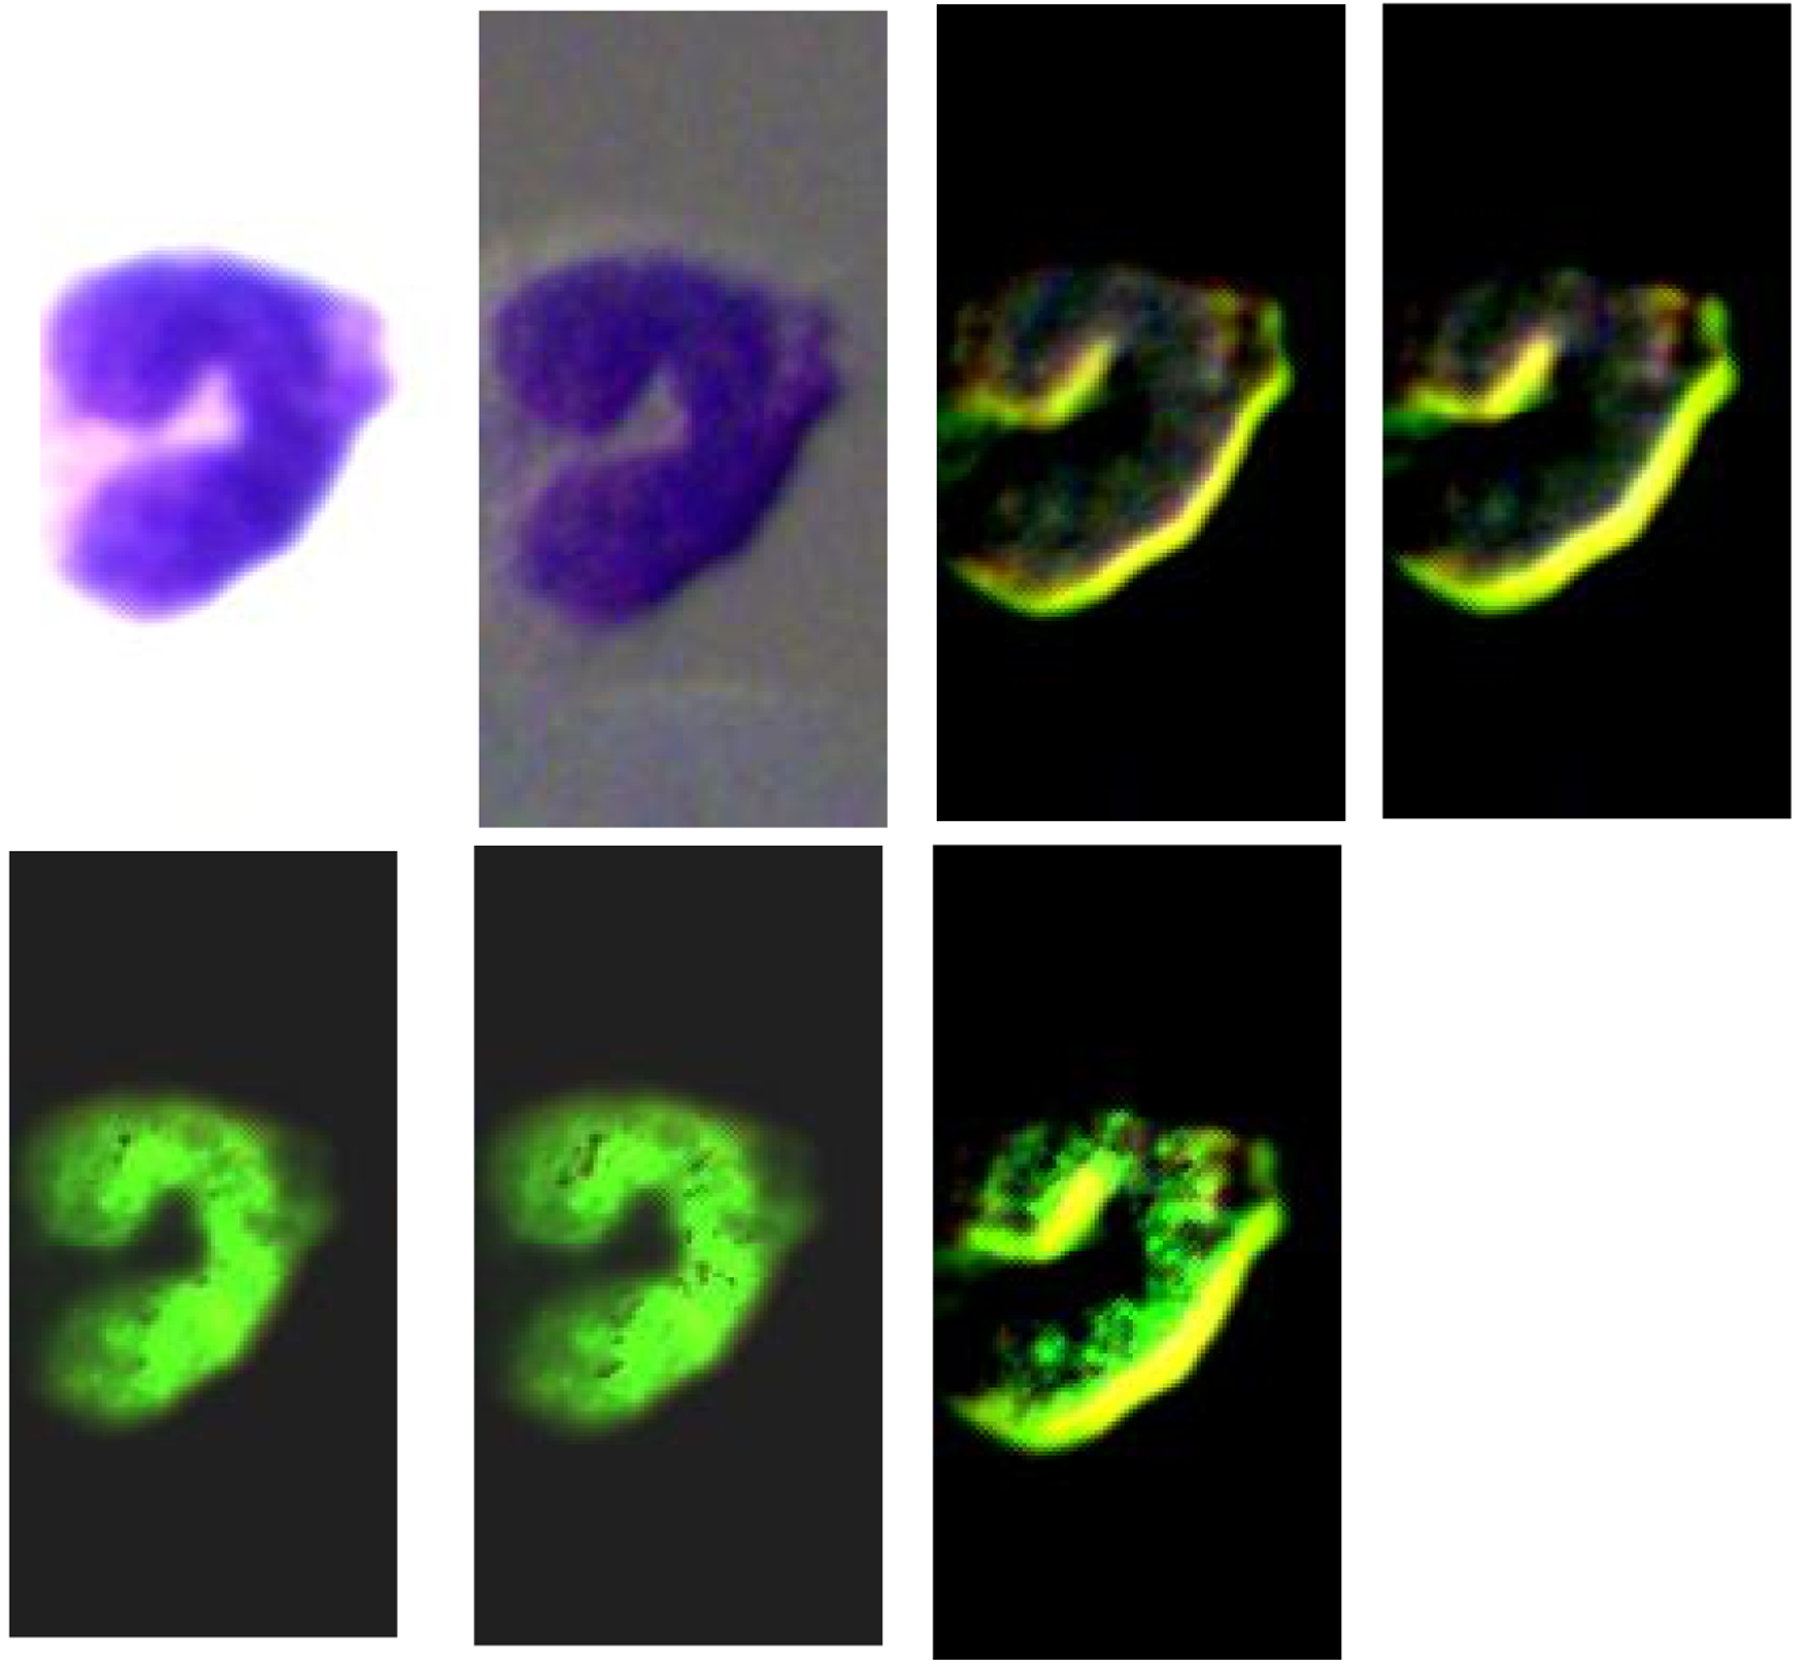
The four images on the top row (left to right) demonstrate the RGB images of Stokes vector parameters (S0, S1, S2, and S3) of an eosinophil on a Wright’s stained blood smear slide. The three images on the bottom row (left to right) demonstrate the RGB images of Stokes vector derived parameters (DOP, DOLP, and DOCP) of the eosinophil.
Figure 5.
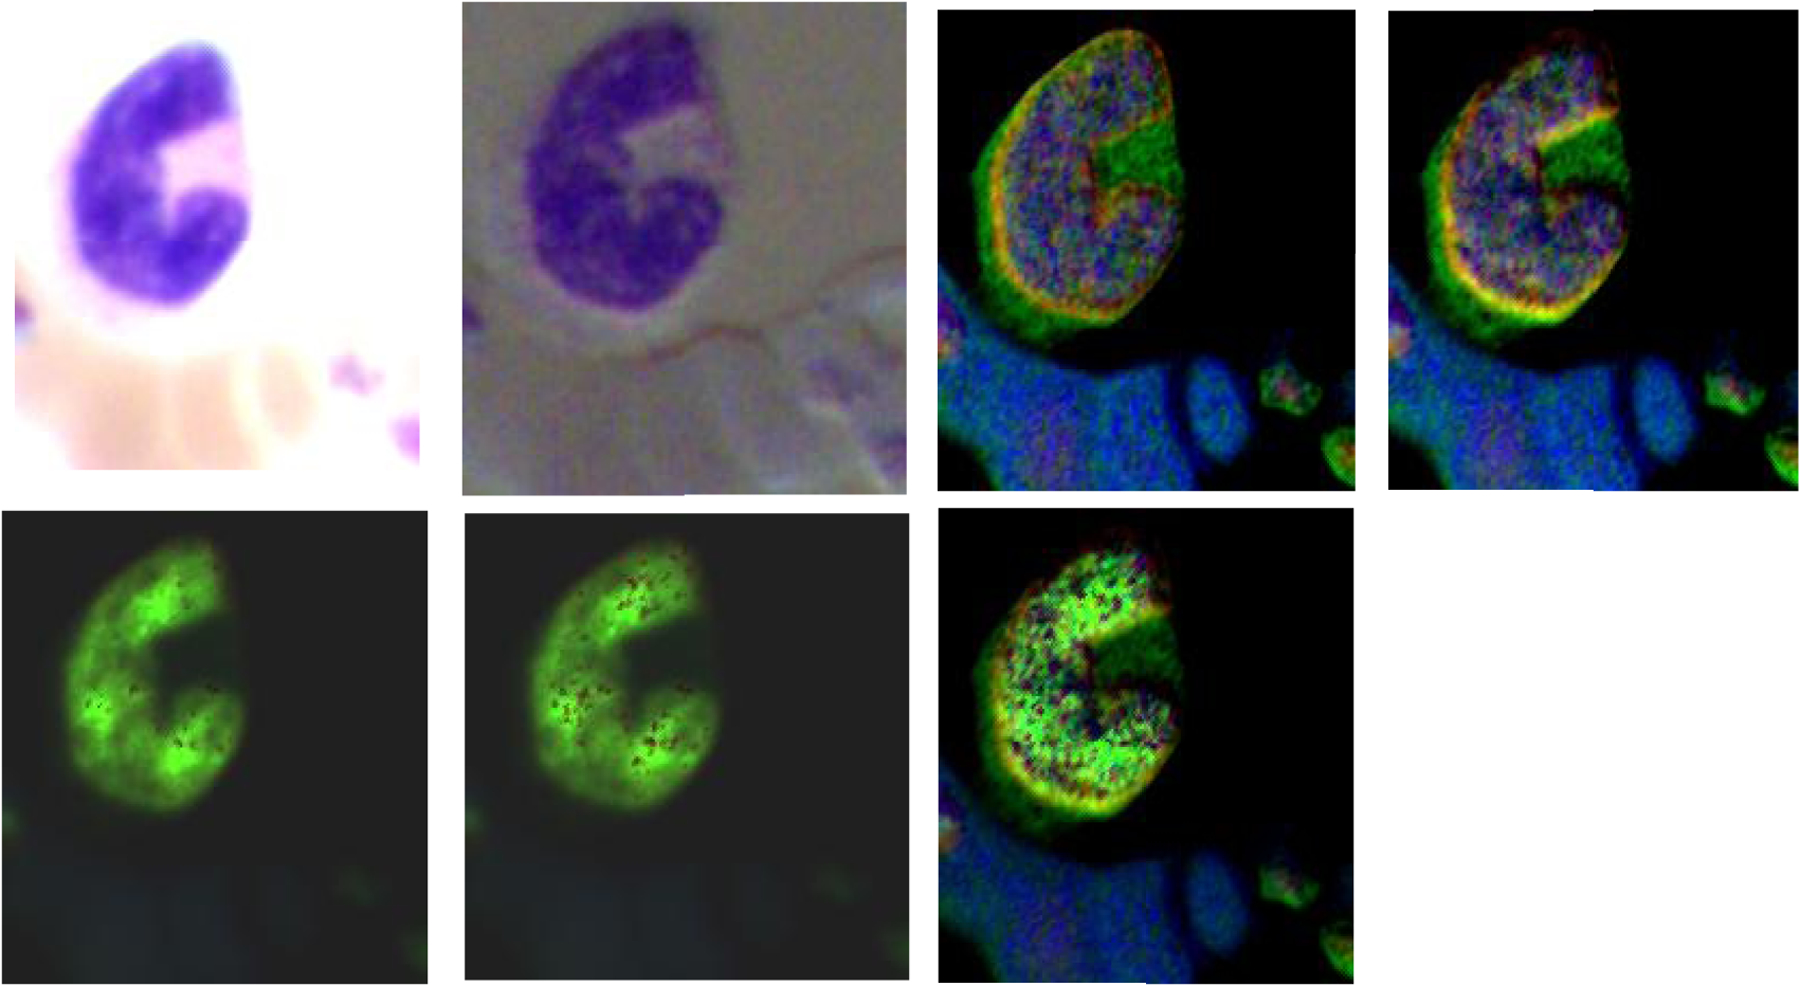
The four images on the top row (left to right) demonstrate the RGB images of Stokes vector parameters (S0, S1, S2, and S3) of a basophil on a Wright’s stained blood smear slide. The three images on the bottom row (left to right) demonstrate the RGB images of Stokes vector derived parameters (DOP, DOLP, and DOCP) of the basophil.
Figure 6.
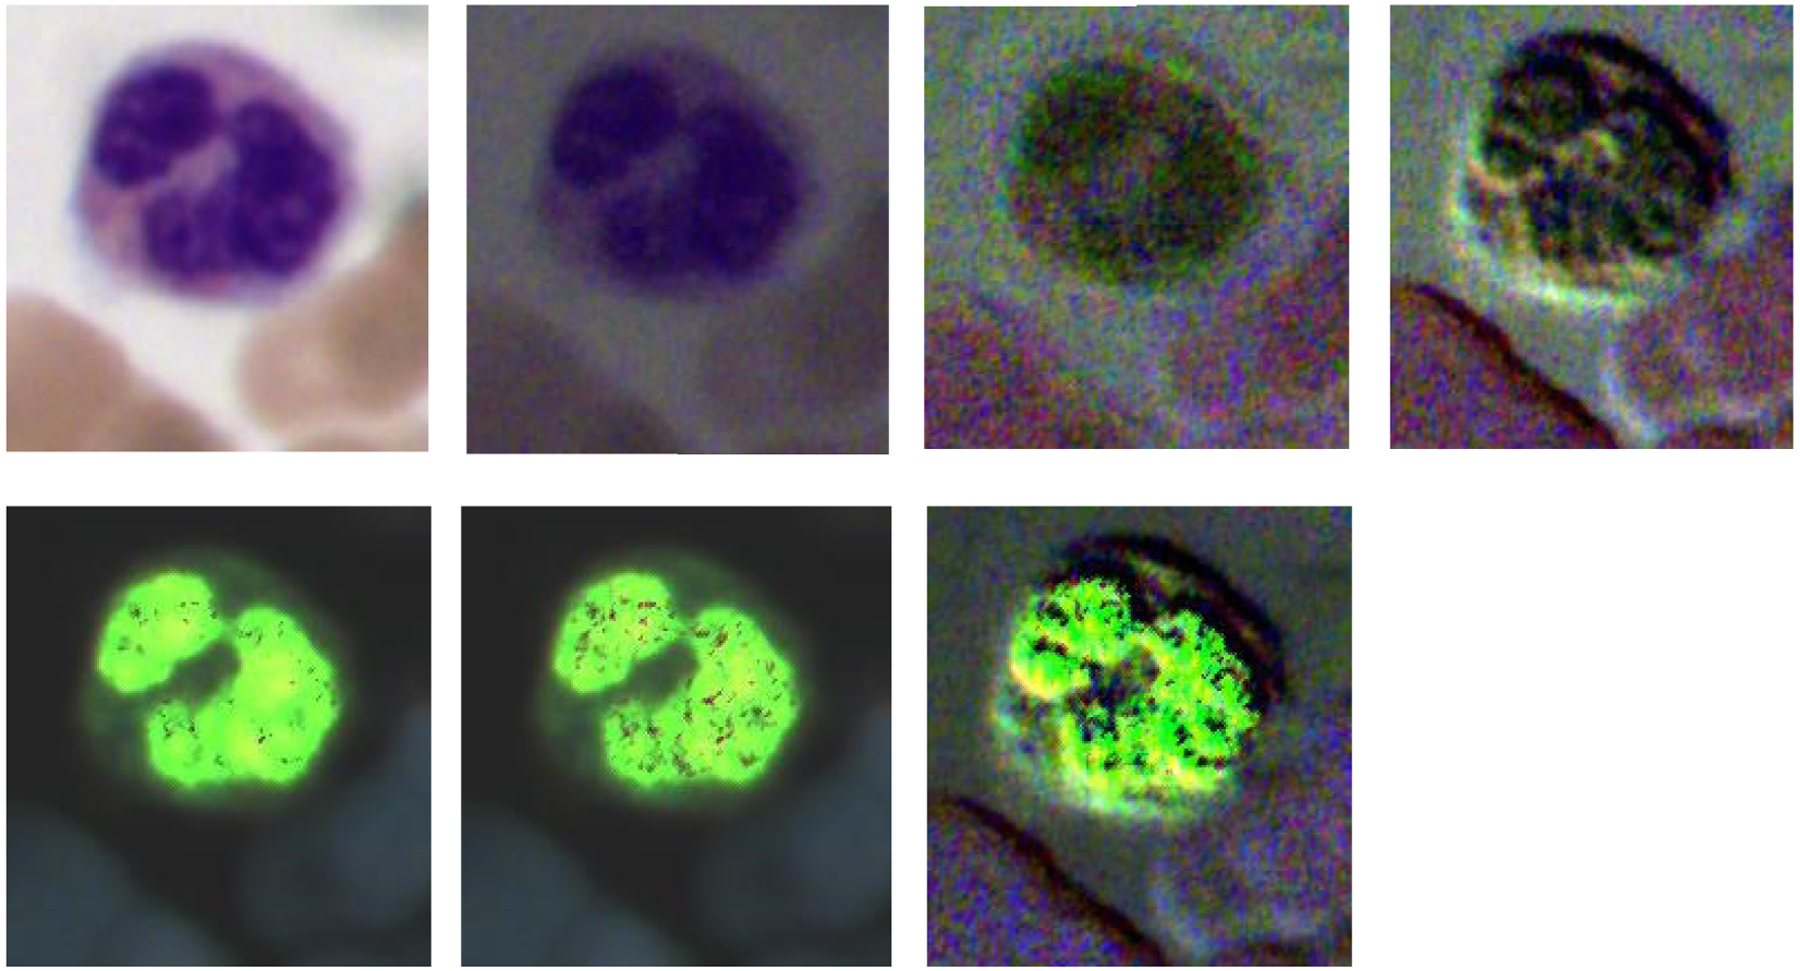
The four images on the top row (left to right) demonstrate the RGB images of Stokes vector parameters (S0, S1, S2, and S3) of a neutrophil on a Wright’s stained blood smear slide. The three images on the bottom row (left to right) demonstrate the RGB images of Stokes vector derived parameters (DOP, DOLP, and DOCP) of the neutrophil.
3.2. Polarized light images of lymphocytes
Figure 7 demonstrates the RGB images of Stokes vector parameters (S0, S1, S2, and S3) and Stokes vector derived parameters (DOP, DOLP, and DOCP) of a lymphocyte from a Wright’s stained blood smear slide. The preliminary results demonstrate that Stokes vector derived parameters (DOP, DOLP, and DOCP) could improve the visualization of surface structures of lymphocytes, and DOCP performs the best. The surface patterns shown in the images may reflect surface protein expression patterns (e.g., antigen receptors) that depend on the type of lymphocyte (B or T-cell) and/or degree of maturation (i.e., lymphoblast vs more mature) and/or activation stages (exposed to antigen or not). Figure 8 demonstrates the RGB images of S0 and DOCP of other four lymphocytes, which show more apparent surface patterns. The RGB images were collected by the polarized light imaging setup.
Figure 7.
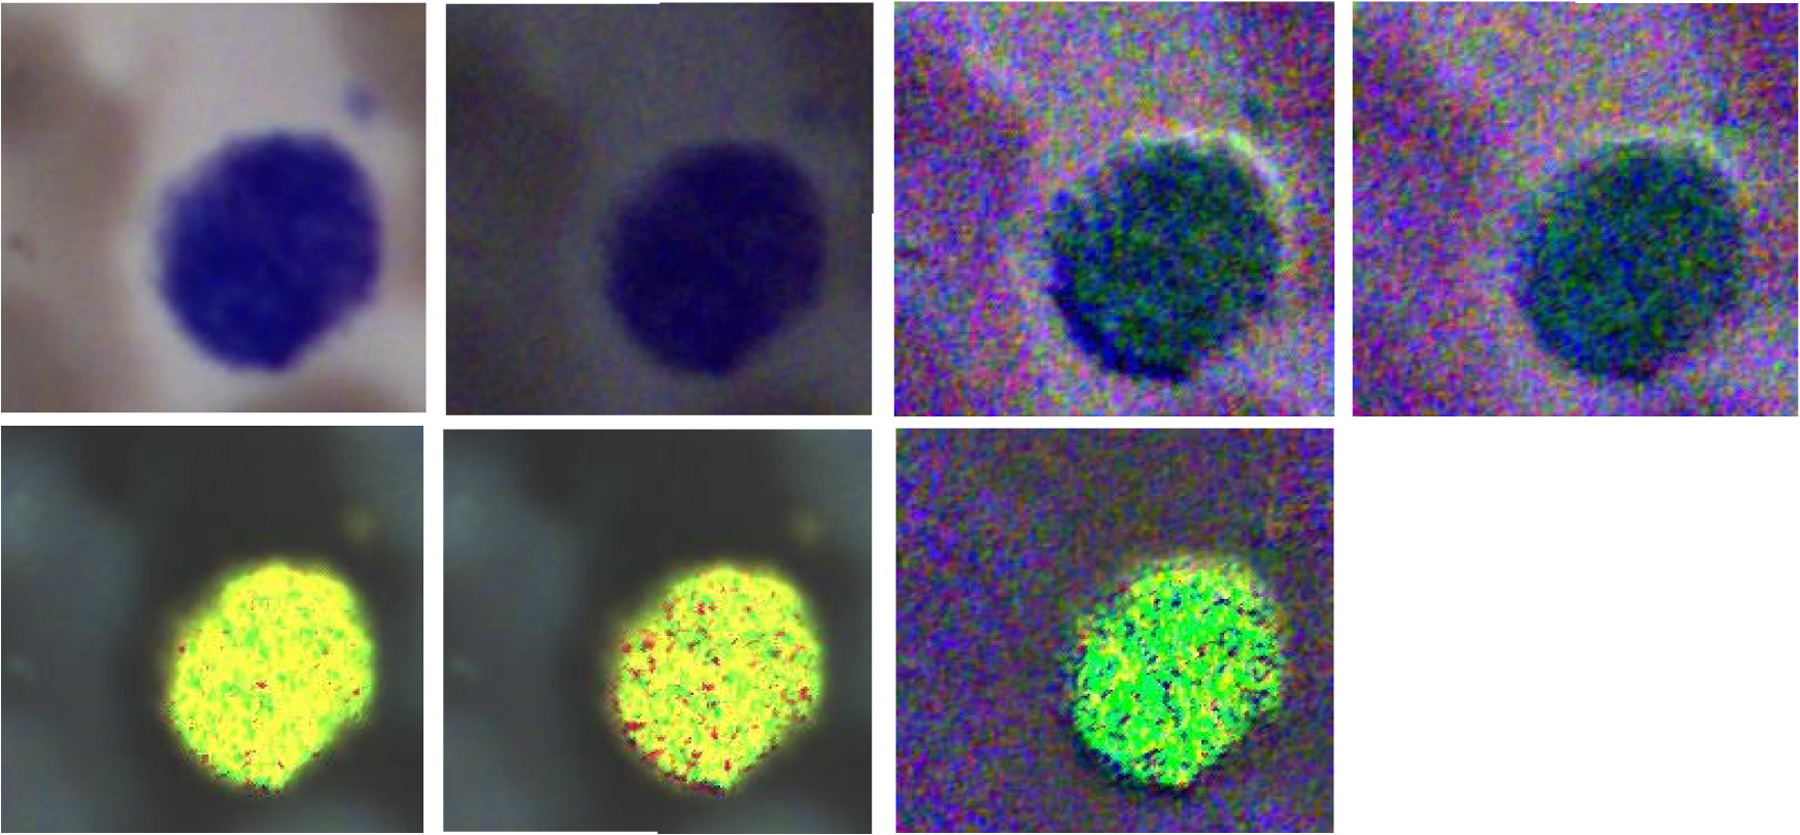
The four images on the top row (left to right) demonstrate the RGB images of Stokes vector parameters (S0, S1, S2, and S3) of a lymphocyte on a Wright’s stained blood smear slide. The three images on the bottom row (left to right) demonstrate the RGB images of Stokes vector derived parameters (DOP, DOLP, and DOCP) of the lymphocyte.
Figure 8.
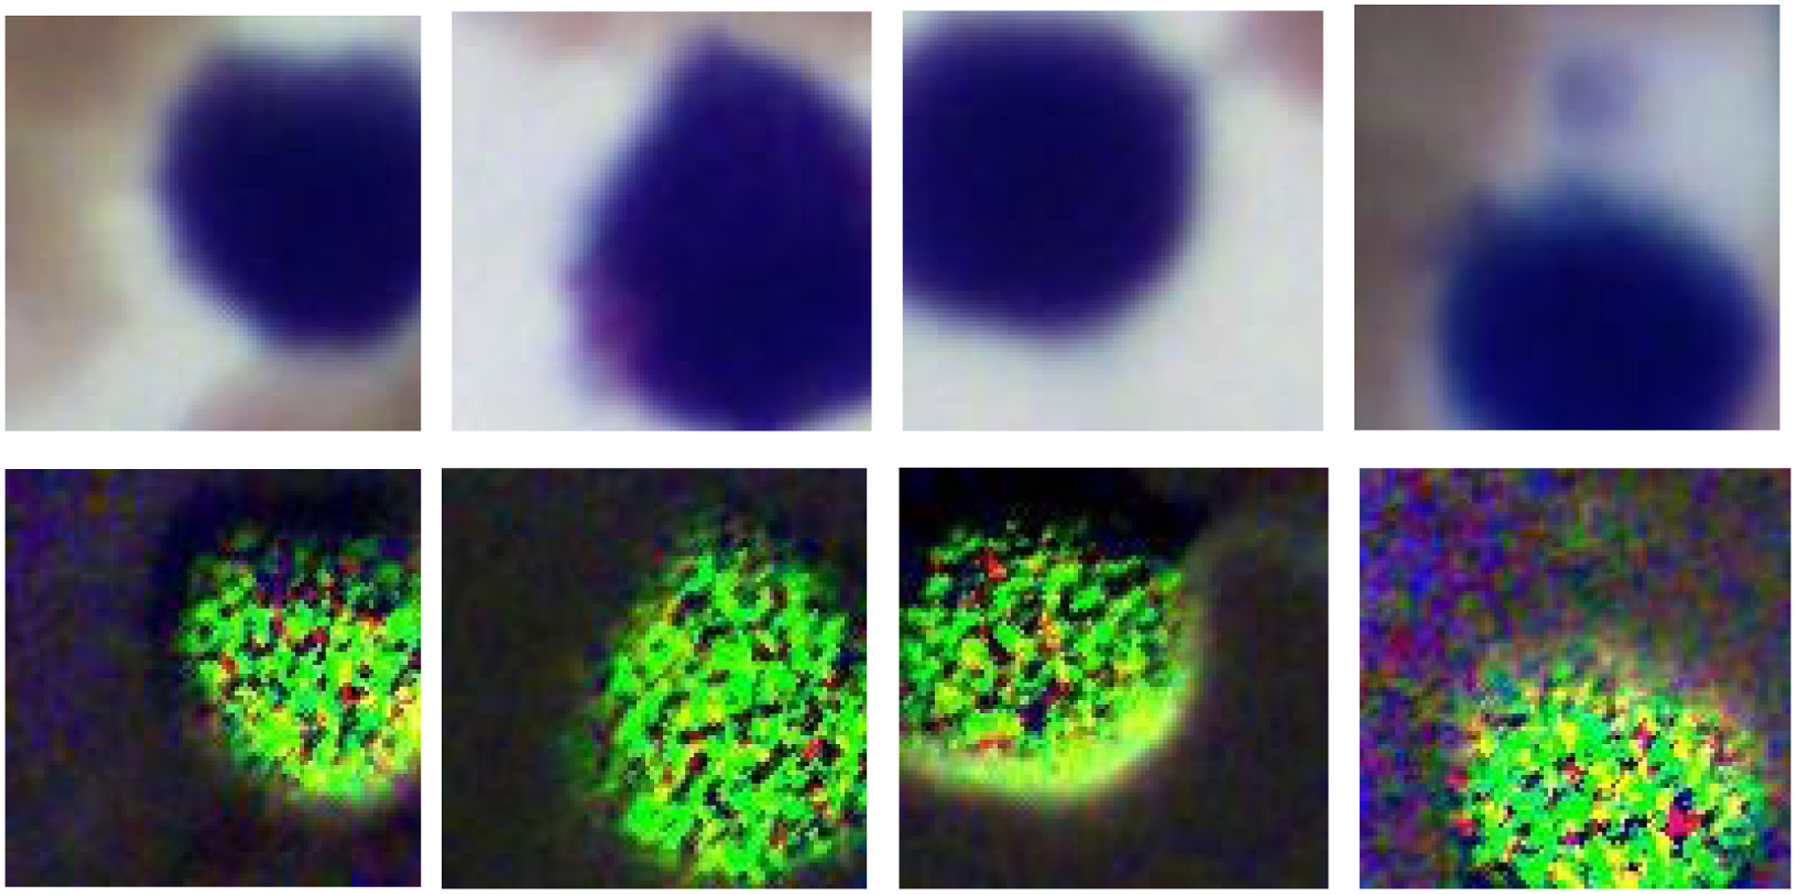
The four images on the top row (left to right) demonstrate the RGB images of S0 from four different lymphocytes on a Wright’s stained blood smear slide. The four images on the bottom row are the corresponding RGB images of DOCP.
3.3. Polarized light images of monocytes
Figure 9 demonstrates the RGB images of Stokes vector parameters (S0, S1, S2, and S3) and Stokes vector derived parameters (DOP, DOLP, and DOCP) of a monocyte from a Wright’s stained blood smear slide. The RGB images were collected by the polarized light imaging setup.
Figure 9.
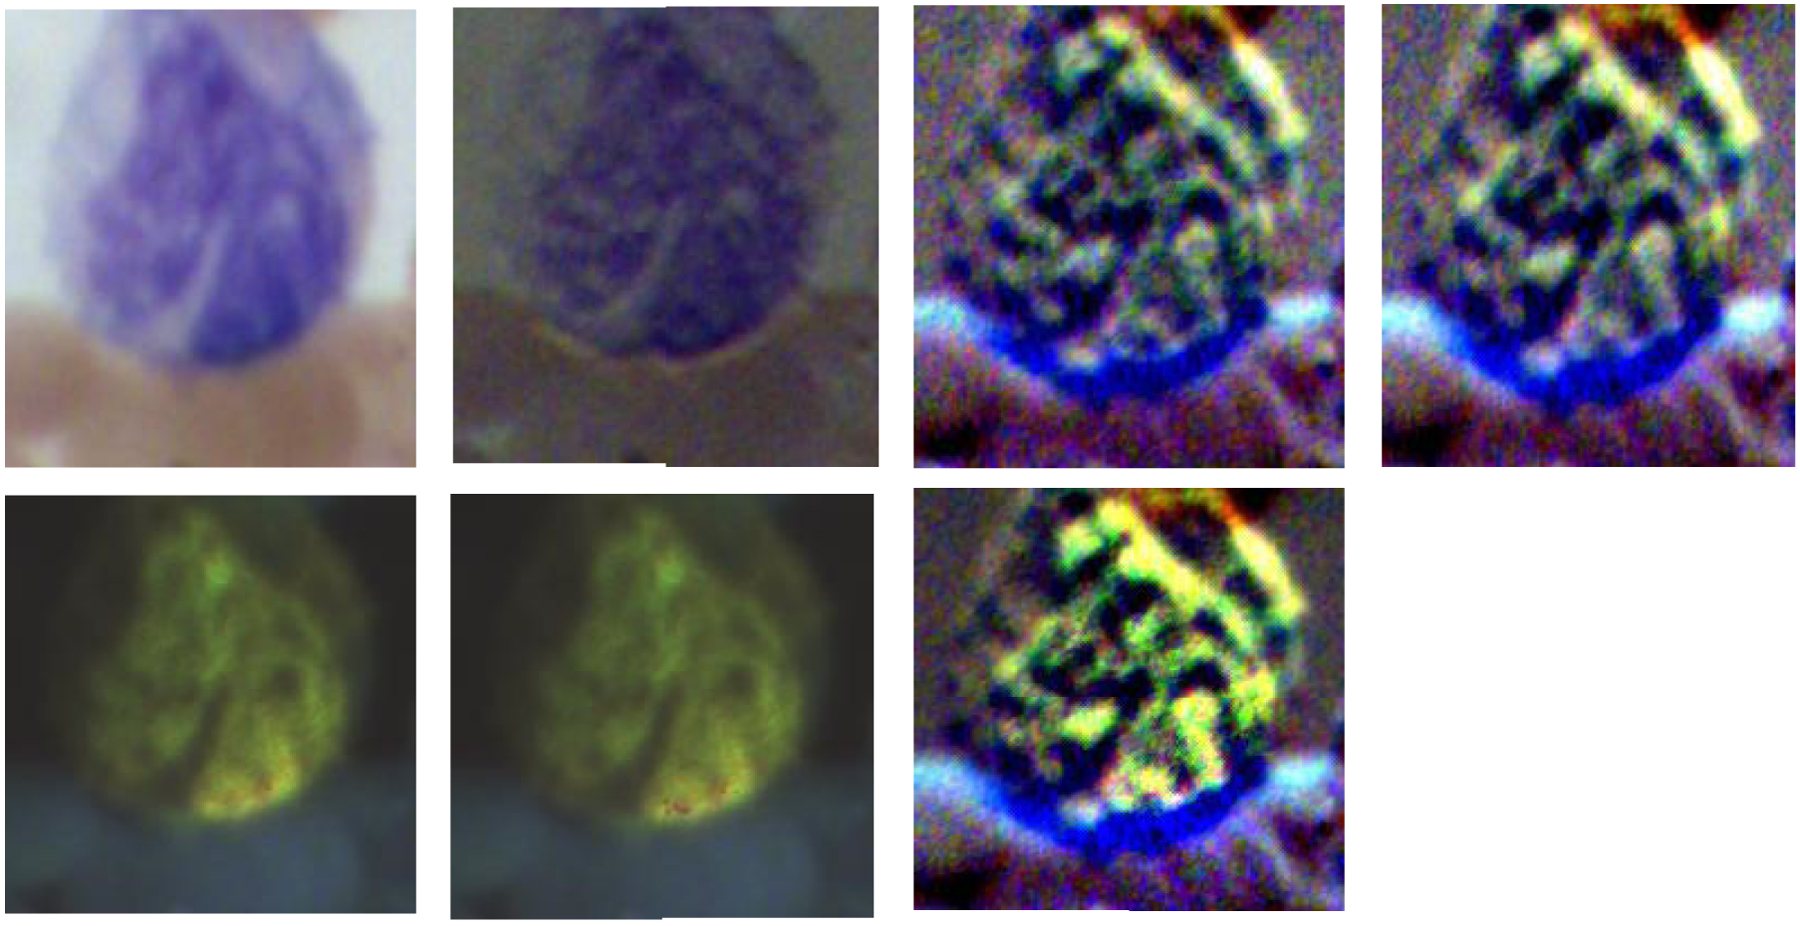
The four images on the top row (left to right) demonstrate the RGB images of Stokes vector parameters (S0, S1, S2, and S3) of a monocyte on a Wright’s stained blood smear slide. The three images on the bottom row (left to right) demonstrate the RGB images of Stokes vector derived parameters (DOP, DOLP, and DOCP) of the monocyte.
The polarized light imaging setup could help to visualize specific microstructures (granules, nuclear size, contour and degree of condensation, cell surface structures) on granulocytes or lymphocytes. The visualization of monocytes by polarized light imaging did not show advantages in catching specific microstructures. However, we used contrast to quantitatively measure the image quality of different Stokes vector related parameters of monocytes, and found that polarized light imaging could improve the image contrast of the large nucleus of monocytes.
3.4. Polarized hyperspectral imaging
In this study, rather than just use the polarized light imaging setup to collect the spatial information of white blood cells, we also employ polarized hyperspectral imaging setup to collect the spatial and spectral information simultaneously. Figure 10 demonstrates the synthetic RGB images of Stokes vector data cubes (S0, S1, S2, and S3) of one monocyte from a Wright’s stained blood smear slide with the corresponding RGB images collected under the polarized light imaging setup. Figure 11 demonstrates the corresponding spectra of S0, S1, S2, and S3 based on the mean and standard deviation of pixels belonging to the monocyte. The four spectra have different shapes comparing to each other, and the spectrum of S1, S2, and S3 have more fluctuations than the spectrum of S0.
Figure 10.
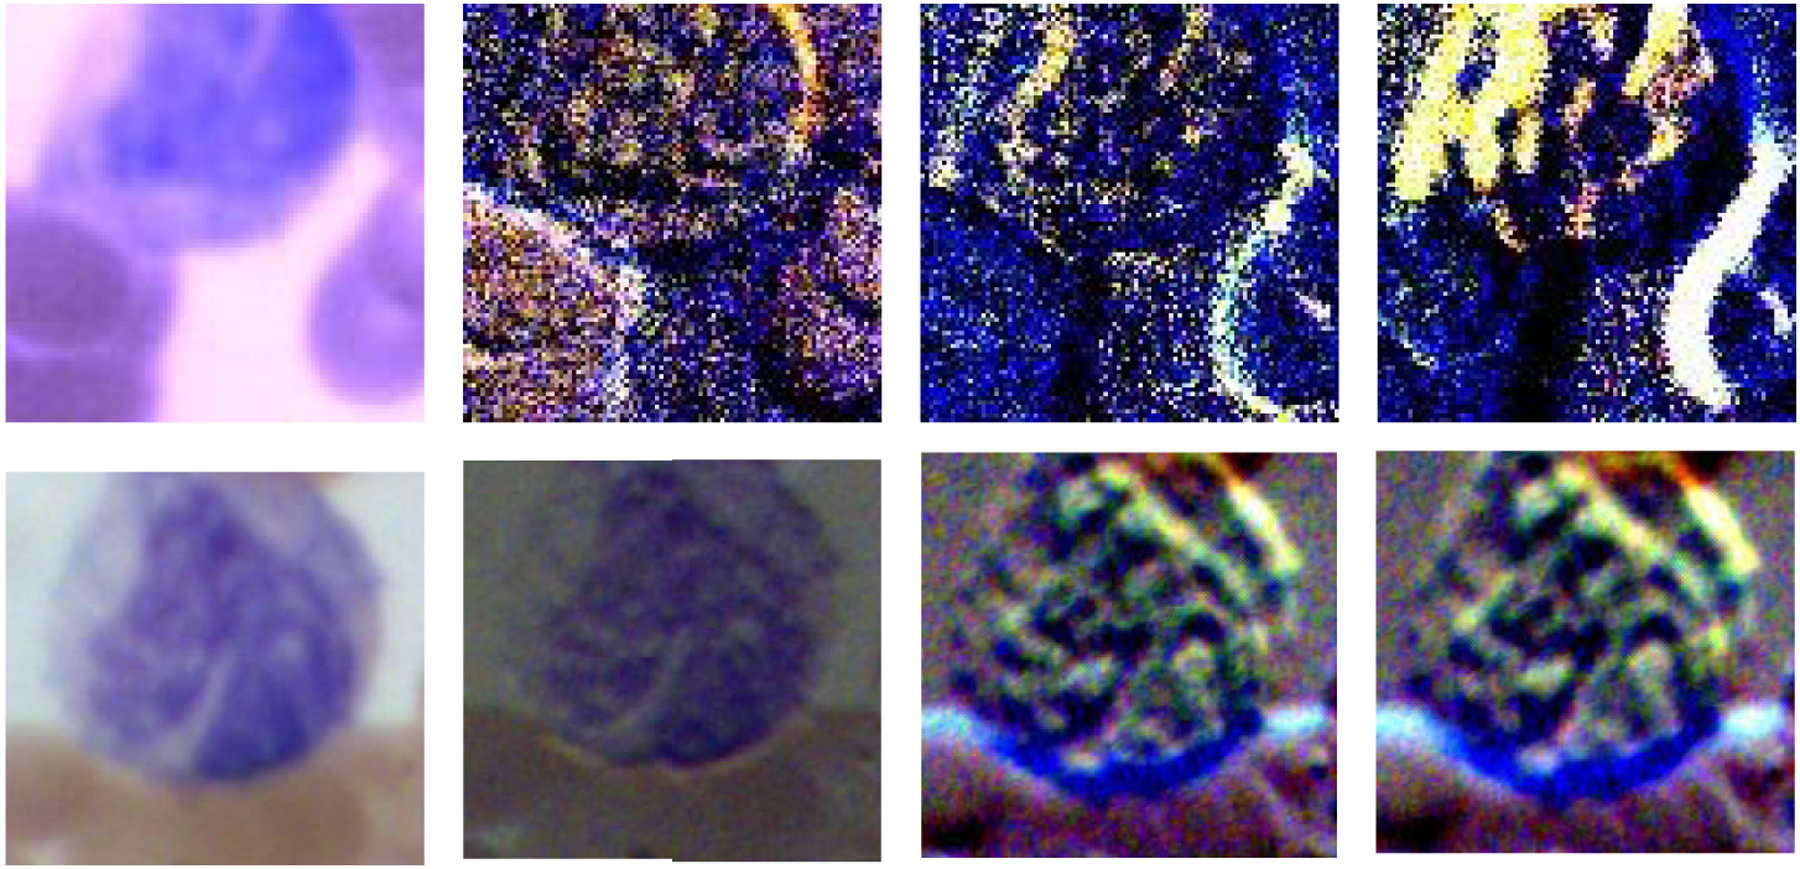
The synthetic RGB images of Stokes vector data cubes (S0, S1, S2, and S3) of one monocyte from a Wright’s stained blood smear slide acquired under the polarized hyperspectral imaging setup, and the corresponding RGB images acquired under the polarized light imaging setup.
Figure 11.
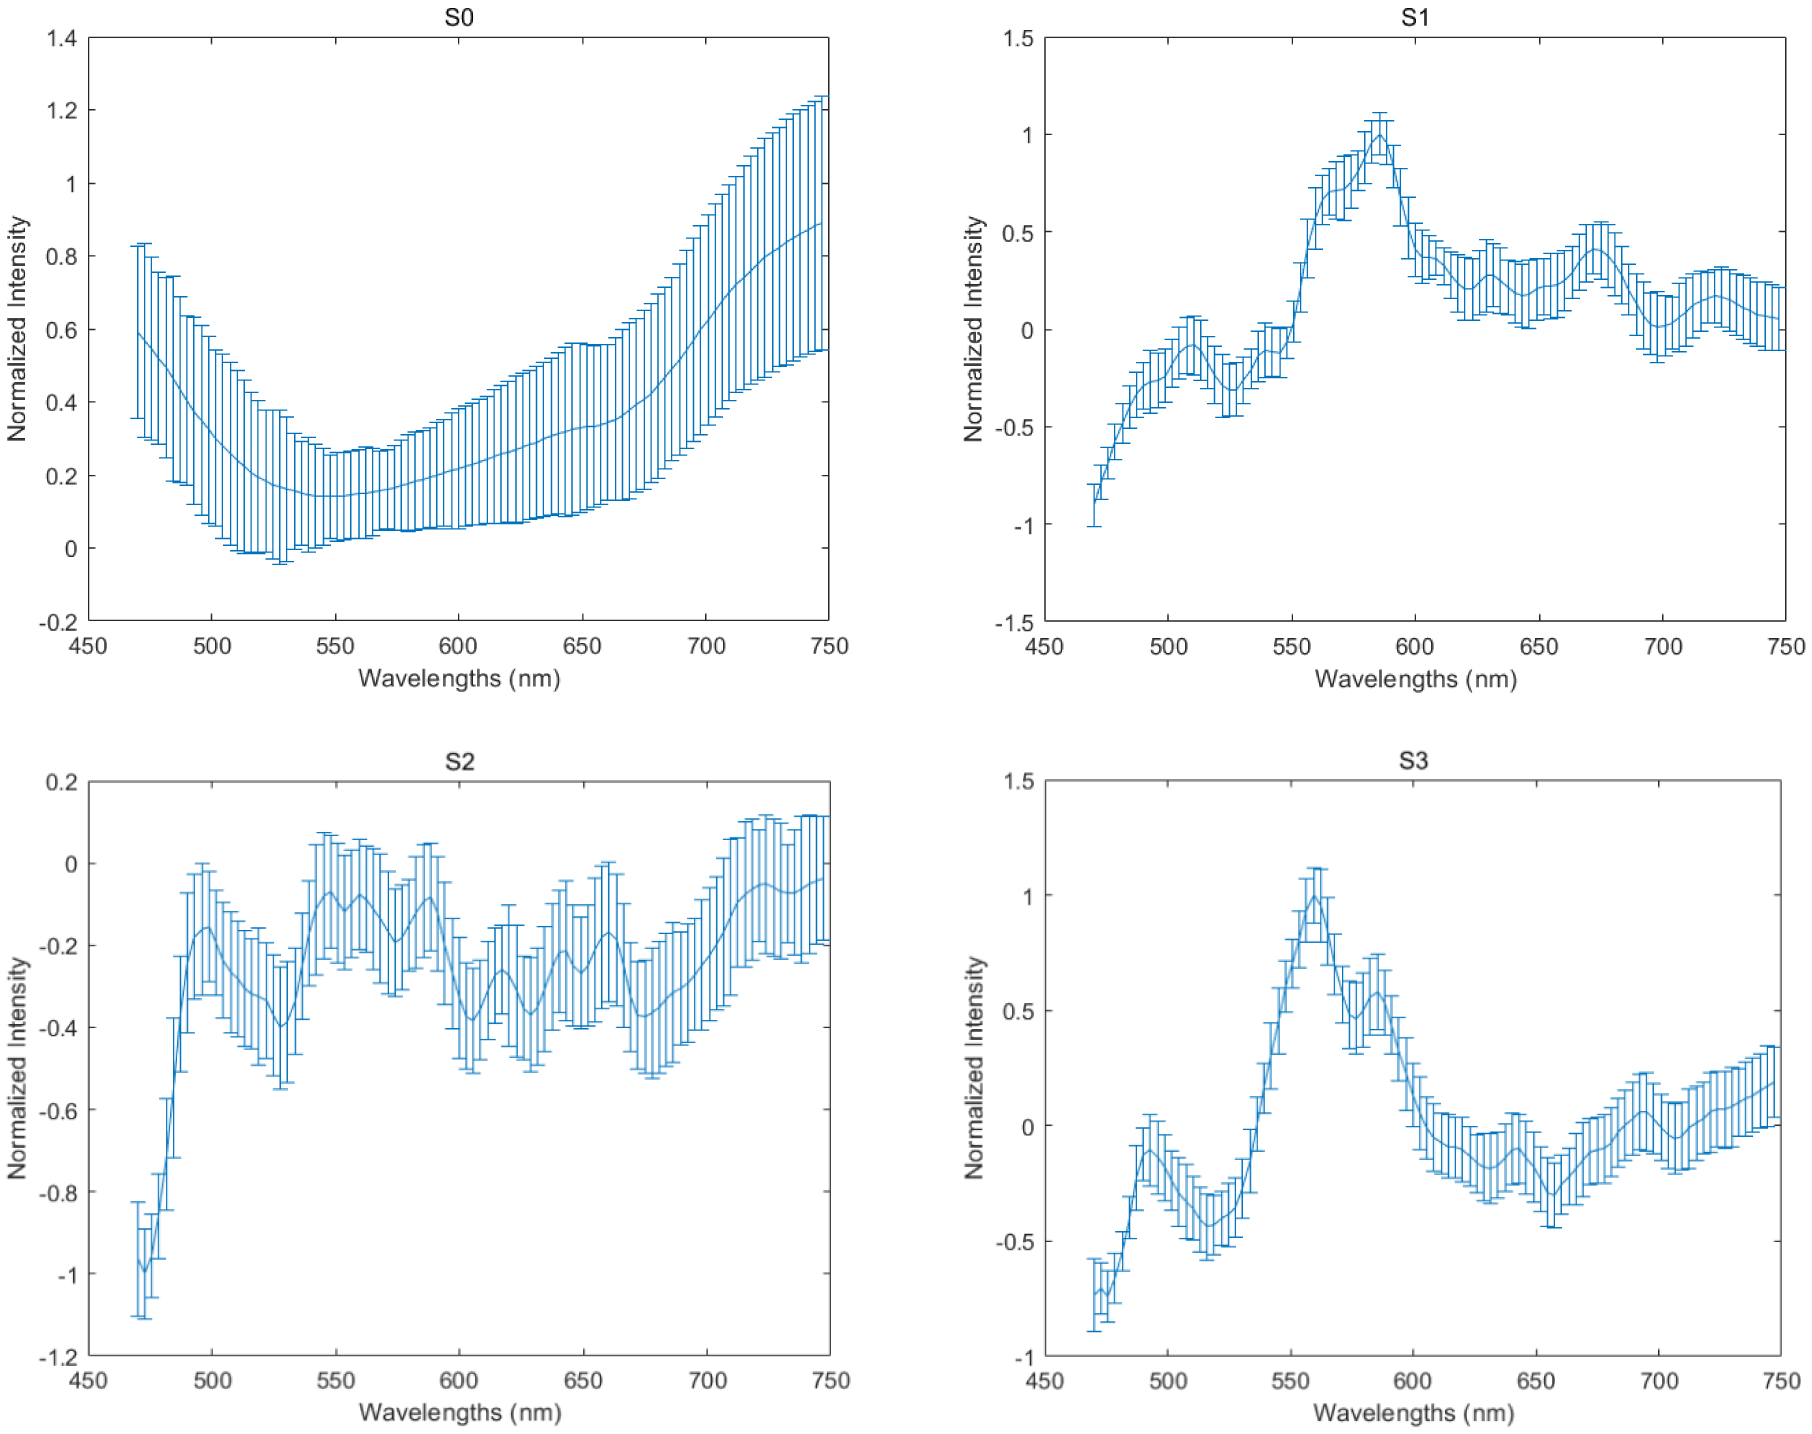
The corresponding spectra of S0, S1, S2, and S3 are based on the mean and standard deviation of pixels belonging to the monocyte. The four spectra have different shapes compared to each other, and the spectrum of S1, S2, and S3 have more fluctuations than the spectrum of S0.
From the representative images in Figure 10, we found that the synthetic RGB images acquired under polarized hyperspectral imaging setup and the RGB images acquired under polarized light imaging setup share some similarities. For example, in the two sets of images, S3 both improve the visualization of the monocyte. However, there are some differences. For instance, the difference between synthetic RGB images of S2 and S3 from polarized hyperspectral imaging is larger than the RGB images of S2 and S3 from polarized light imaging. We need to further improve the HSI-to-RGB transformation function to make the synthetic RGB images of Stokes vector parameters look closer to the real RGB images of Stokes vector parameters.
4. DISCUSSION AND CONCLUSION
In this study, we developed a microscopic imaging system for improving visualization of white blood cells on Wright’s stained peripheral blood smear slides, with two different setups (polarized light imaging and polarized hyperspectral imaging). We demonstrate that our customized microscope could improve the visualization of granules in granulocytes (neutrophils, eosinophils, and basophils). It could also enhance the visualization of surface structures of lymphocytes, which may reflect surface protein expression patterns (e.g., antigen receptors) that depend on the type of lymphocyte (B or T-cell) and/or degree of maturation (i.e., lymphoblast vs more mature) and/or activation stages (exposed to antigen or not). Furthermore, it could improve the visualization of morphology on nucleus of monocytes. We also demonstrated that the polarized hyperspectral imaging setup could provide complementary spectral information to the spatial information on different Stokes vector parameters of white blood cells.
As is discussed in the introduction section, few have investigated this interaction in white blood cells. To the best of our knowledge, this is the first work to apply polarized light imaging & polarized hyperspectral imaging to improve the visualization of white blood cells. This work shows that polarized light imaging & polarized hyperspectral imaging has the potential to become a strong imaging tool for the diagnosis of diseases/disorders of white blood cells. In our future study, we will acquire more images from white blood cells under more clinical situations, and incorporate our customized microscope with more quantitative analysis methods.
ACKNOWLEDGMENTS
This research was supported in part by the U.S. National Institutes of Health (NIH) grants (R01CA156775, R01CA204254, R01HL140325, and R21CA231911) and by the Cancer Prevention and Research Institute of Texas (CPRIT) grant RP190588.
REFERENCES
- 1.Blumenreich M, “The White Blood Cell and Differential Count,” Clinical Methods: The History, Physical, and Laboratory Examinations, 3rd Edition, 724–727 (1990). [Google Scholar]
- 2.Pierre R, “Peripheral blood film review: the demise of the eyecount leukocyte differential,” Clinics in Laboratory Medicine 22(1), 279–297 (2002). [DOI] [PubMed] [Google Scholar]
- 3.Adewoyin AS and Nwogoh B, “Peripheral blood film - a review,” Annals of Ibadan Postgraduate Medicine 12(2), 71–79 (2014). [PMC free article] [PubMed] [Google Scholar]
- 4.Smock KJ, “Examination of the Blood and Bone Marrow.” In: Greer JP et al, “Wintrobe’s Clinical Hematology,” 14th Edition (2018). [Google Scholar]
- 5.Lu G and Fei B, “Medical hyperspectral imaging: a review,” Journal of biomedical optics 19(1), 010901 (2014). [DOI] [PMC free article] [PubMed] [Google Scholar]
- 6.Salmivuori M et al. , “Hyperspectral Imaging System in the Delineation of Ill-defined Basal Cell Carcinomas: A Pilot Study,” Journal of the European Academy of Dermatology and Venereology (2018). [DOI] [PubMed] [Google Scholar]
- 7.Lu G et al. , “Hyperspectral imaging for cancer surgical margin delineation: registration of hyperspectral and histological images.” Medical Imaging 2014: Image-Guided Procedures, Robotic Interventions, and Modeling, International Society for Optics and Photonics, 9036 (2014). [DOI] [PMC free article] [PubMed] [Google Scholar]
- 8.Lu G et al. , “Spectral-spatial classification using tensor modeling for cancer detection with hyperspectral imaging,” Medical Imaging 2014: Image Processing, 903413 (2014). [DOI] [PMC free article] [PubMed] [Google Scholar]
- 9.Pike R et al. , “A minimum spanning forest based hyperspectral image classification method for cancerous tissue detection,” Medical Imaging 2014: Image Processing, 90341W (2014). [DOI] [PMC free article] [PubMed] [Google Scholar]
- 10.Pike R et al. , “A Minimum Spanning Forest-Based Method for Noninvasive Cancer Detection With Hyperspectral Imaging,” IEEE Trans. Biomed. Engineering 63(3), 653–663 (2016). [DOI] [PMC free article] [PubMed] [Google Scholar]
- 11.Lu G et al. , “Estimation of tissue optical parameters with hyperspectral imaging and spectral unmixing,” Medical Imaging 2015: Biomedical Applications in Molecular, Structural, and Functional Imaging 94170Q (2015). [DOI] [PMC free article] [PubMed] [Google Scholar]
- 12.Chung H et al. , “Superpixel-based spectral classification for the detection of head and neck cancer with hyperspectral imaging,” Medical Imaging 2016: Biomedical Applications in Molecular, Structural, and Functional Imaging, 978813 (2016). [DOI] [PMC free article] [PubMed] [Google Scholar]
- 13.Halicek M et al. , “Tumor margin classification of head and neck cancer using hyperspectral imaging and convolutional neural networks,” Medical Imaging 2018: Image-Guided Procedures, Robotic Interventions, and Modeling, International Society for Optics and Photonics, 10576 (2018). [DOI] [PMC free article] [PubMed] [Google Scholar]
- 14.Halicek M et al. , “Deep convolutional neural networks for classifying head and neck cancer using hyperspectral imaging,” Journal of biomedical optics, 22(6), 060503 (2017). [DOI] [PMC free article] [PubMed] [Google Scholar]
- 15.Halicek M et al. , “ Optical biopsy of head and neck cancer using hyperspectral imaging and convolutional neural networks,” Journal of biomedical optics, 24(3), 060503 (2019). [DOI] [PMC free article] [PubMed] [Google Scholar]
- 16.Halicek M et al. , “ Hyperspectral imaging of head and neck squamous cell carcinoma for cancer margin detection in surgical specimens from 102 patients using deep learning,” Cancers, 11(9), (2019). [DOI] [PMC free article] [PubMed] [Google Scholar]
- 17.Ling M et al. , “Automatic detection of head and neck squamous cell carcinoma on histologic slides using hyperspectral microscopic imaging,” Journal of biomedical optics, 27(4), (2022). [DOI] [PMC free article] [PubMed] [Google Scholar]
- 18.Li Q et al. , “Leukocyte cells identification and quantitative morphometry based on molecular hyperspectral imaging technology,” Computerized Medical Imaging and Graphics 38(3), 171–178 (2014). [DOI] [PubMed] [Google Scholar]
- 19.Robison C et al. , “Imaging of Blood Cells Based on Snapshot Hyper-Spectral Imaging Systems,” Proc. SPIE 9472, Algorithms and Technologies for Multispectral, Hyperspectral, and Ultraspectral Imagery XXI, 94721L (2015). [Google Scholar]
- 20.Duan Y et al. , “Leukocyte classification based on spatial and spectral features of microscopic hyperspectral images,” Optics and Laser Technology 112, 530–538 (2019). [Google Scholar]
- 21.Wei X et al. , “Medical Hyperspectral Image Classification Based on End-to-End Fusion Deep Neural Network,” IEEE Transactions on Instrumentation and Measurement 68(11), 4481–4492 (2019). [Google Scholar]
- 22.Huang Q et al. , “Blood Cell Classification Based on Hyperspectral Imaging With Modulated Gabor and CNN,” IEEE Journal of Biomedical and Health Informatics 24(1), 160–170 (2019). [DOI] [PubMed] [Google Scholar]
- 23.Hu X et al. , “Spatial-spectral identification of abnormal leukocytes based on microscopic hyperspectral imaging technology,” Journal of Innovative Optical Health Sciences 13(2) (2020). [Google Scholar]
- 24.Wang Q et al. , “A 3D attention networks for classification of white blood cells from microscopy hyperspectral images,” Optics and Laser Technology 139 (2021). [Google Scholar]
- 25.Jacques SL, “Polarized Light Imaging of Biological Tissues.” In: Boas DA et al, “Handbook of Biomedical Optics,” 1st Edition (2011). [Google Scholar]
- 26.Tuchin VV, “Polarized light interaction with tissues,” Journal of Biomedical Optics 21(7), 071114 (2016). [DOI] [PubMed] [Google Scholar]
- 27.Hu X et al. , “Rapid analysis of white blood cells with diffraction imaging flow cytometry,” Proc. SPIE 7907, Biomedical Applications of Light Scattering V, 79070W (2011). [Google Scholar]
- 28.Ding H et al. , “Angle-resolved Mueller matrix study of light scattering by B-cells at three wavelengths of 442, 633, and 850 nm,” Journal of Biomedical Optics 12(3), 034032 (2007). [DOI] [PubMed] [Google Scholar]
- 29.Zhou X et al. , “Development of a new polarized hyperspectral imaging microscope,” Imaging, Therapeutics, and Advanced Technology in Head and Neck Surgery and Otolaryngology 2020. Vol. 11213. International Society for Optics and Photonics; (2020). [DOI] [PMC free article] [PubMed] [Google Scholar]
- 30.Zhou X et al. , “Automatic detection of head and neck squamous cell carcinoma on pathologic slides using polarized hyperspectral imaging and machine learning,” Proc. SPIE 11603, Medical Imaging 2021: Digital Pathology, 116030Q (2021). [DOI] [PMC free article] [PubMed] [Google Scholar]
- 31.Zhou X et al. , “Automatic detection of head and neck squamous cell carcinoma on pathologic slides using polarized hyperspectral imaging and deep learning,” Proc. SPIE 12039, Medical Imaging 2022: Digital and Computational Pathology, 120390G (2022). [DOI] [PMC free article] [PubMed] [Google Scholar]
- 32.Ling Ma, et al. , “Hyperspectral microscopic imaging for automatic detection of head and neck squamous cell carcinoma using histologic image and machine learning,” Medical Imaging 2020: Digital Pathology. Vol. 11320, International Society for Optics and Photonics, (2020). [DOI] [PMC free article] [PubMed] [Google Scholar]
- 33.William S,Webster’s new world medical dictionary, Wiley Publishing, (2008). [Google Scholar]
- 34.Balagopalan Lakshmi, et al. , “Imaging techniques for assaying lymphocyte activation in action,” Nature Reviews Immunology 11.1 (2011). [DOI] [PMC free article] [PubMed] [Google Scholar]
- 35.Lindsay B, “The immune system,” Essays Biochem 60.3 (2016). [DOI] [PMC free article] [PubMed] [Google Scholar]


