

Abstract
Objective. To create a prediction model for preterm neonatal mortality. Methods. A secondary analysis was conducted using data from a prospective cohort study, the Project to Understand and Research Preterm Pregnancy Outcome South Asia. The Cox proportional hazard model was used and adjusted hazard ratios (AHR) with 95% confidence intervals (95% CI) were reported. Results. Overall, 3446 preterm neonates were included. The mean age of preterm neonates was 0.65 (1.25) hours and 52% were female. The preterm neonatal mortality rate was 23.3%. The maternal factors predicting preterm neonatal death was any antepartum hemorrhage, AHR 1.99 (1.60-2.47), while neonatal predictors were preterm who received positive pressure ventilation AHR 1.30 (1.08-1.57), temperature <35.5°C AHR 1.18 (1.00-1.39), and congenital malformations AHR 3.31 (2.64-4.16). Conclusion. This study identified key maternal and neonatal predictors of preterm neonatal mortality, emphasizing the need for targeted interventions and collaborative public health efforts to address disparities and regional variations.
Keywords: preterm neonates, preterm neonatal mortality, India, Pakistan, predictors
Introduction
The neonatal mortality rate remains high in many low- and middle-income countries (LMIC). 1 Preterm birth, birth asphyxia, and neonatal infections are the commonly reported causes of neonatal mortality.2,3 Preterm neonates are at a 2.7 times higher risk for neonatal mortality compared with full-term births in LMIC.4-6 Globally, in 2020, an estimated 13.4 million neonates were born before 37 weeks of gestation making up to 10% of all births. More than 80% of preterm occur in Asia and sub-Saharan Africa. 7 Among Asian countries, Pakistan and India bear the highest burden of preterm neonatal mortality. In 2019, the preterm-related neonatal mortality rate per 1000 live births in Pakistan was 18.69 (95% confidence interval (CI): 13.52-24.51), and in India, 14.71 (95% CI: 11.78-18.19). 4
Although progress has been made in decreasing child mortality, the number of deaths attributable to preterm birth remains disproportionately high in the south Asian region. 8 These deaths are caused by various maternal, neonatal, and placental factors. 9 Timely interventions like antenatal corticosteroids, kangaroo mother care, assisted ventilation, and antibiotics can improve neonatal survival. Understanding predictors of neonatal mortality in regional contexts is essential for developing effective interventions to reduce neonatal deaths.
Prediction models for neonatal mortality are used to estimate risk by combining various risk factors for clinical decision-making and improving the management of high-risk neonates. Studies have identified several predictors for time to neonatal death such as male neonate, respiratory distress syndrome, neonatal sepsis, gestational age (GA) <28.0 weeks, low Apgar score, home delivery, jaundice, maternal hypertension, and diabetes.10-12 However these prediction models for neonatal mortality are mostly limited to neonates admitted to a neonatal intensive care unit (NICU) in high-income countries where neonatal mortality is low.12,13 While, predictive models for neonatal mortality in LMICs are scarce, where preterm neonatal mortality is high. Furthermore, prediction models of neonatal mortality from LMICs are often limited to neonates who died in the NICU. 14 Therefore, these prediction models have limited generalizability to other LMICs. 15 From the available models few only considered vital sign data and lack integration of maternal and other clinical factors, limiting the accuracy of these models. 16 A study conducted in south Asia on predicting neonatal mortality identified recall bias and missing data on certain predictors as significant limitations. 17 Addressing biases demands enhancing data collection, improving clinical data quality and availability, and standardizing measurement methods. 17 We aim to develop a prediction model for preterm neonatal mortality using data from a prospective cohort study from large public sector referral hospitals in south Asia (Pakistan and India).
Methods
Study Design and Population
This secondary analysis was conducted using a dataset from a large prospective cohort study, the Project to Understand & Research Preterm Pregnancy Outcome and Stillbirth South Asia (PURPOSE study). The study was conducted in 5 public sector referral hospitals (3 from India and 2 from Pakistan) from July 1, 2018, and March 26, 2020. The detailed methodology of the primary study was published elsewhere. 18 At the study hospitals, research staff screened all pregnant women older than 14 years in India and older than 18 years in Pakistan at the time of labor. Pregnant women with an expected or known preterm live birth were included whereas pregnant women with stillbirths, induced abortion, unknown GA, and those who declined informed consent were excluded from this analysis.
Data Collection
After obtaining written informed consent at the time of delivery, study staff collected information including the woman’s medical and obstetric history, physical examination, and the clinical status and procedures performed during the hospital stay and verified with medical records. GA was calculated through an Android-based GA calculator with a predefined algorithm using the hierarchy of methods established by the American College of Obstetrics and Gynecology, 19 using the reliable LMP if available, and ultrasound examination. If neither was available, a Ballard examination was done on the neonates by trained midwives. 19 All data were then entered into the GA calculator. Based on this information, the GA calculator provided the best GA estimate.
Sick preterm infants were referred to the study hospitals. All preterm infants enrolled in the study were followed at 28 days of life to assess outcomes regardless of their admission to the NICU. Among those infants admitted to participating study hospitals, their clinical care, clinical investigations, and any conditions diagnosed during the hospital admission were documented. Neonates who were admitted at NICU and discharged, were followed on 28 days to document status of the neonates at home. In case parents are not available or migrated out, the outcome data were collected by telephone. If an infant died before 28 days of life at home or in health facilities other than study hospitals, a verbal autopsy was carried out by trained study staff at home 2 weeks after the death of the baby.
To ensure the quality of the data these were collected by the trained midwives working in the hospitals which was verified by a monitor on a day-to-day basis using medical records. Study coordinators monitor data collection once every week and arrange refresher training quarterly. Furthermore, data were entered and transmitted to the Research Triangle Institute (RTI) USA for quality assessment. RTI generated monthly progress and the edit reports.
Variables
The outcome variable is the death of a preterm neonate at or before 28 days after birth, labeled as 1-Yes, 0-No.
The maternal predictors were: (1) maternal age, categorized into (<20, 20-25, 26-30, >30 years), (2) maternal education (No formal schooling, <5, 5-12, >12 years), (3) number of antenatal care visits (0, 1-3, 4+), (4) gravida (0, 1-3, 4+), (5) gestational age, categorized into (<28.0, 28.0-31.6, 32.0-36.6 weeks), (6) hemoglobin levels, categorized into (<7, 7-8.9, 9-10.9, 11-9) 12.9, ≥13 g/dl), (7) any hypertensive disorder (Yes, No), (8) any antepartum hemorrhage (Yes, No), (9) mode of delivery (Vaginal delivery, Cesarean section).
The neonatal factors investigated included: (1) Postnatal age in hours at the exam, mean (SD), (2) Sex, (Male, female), (3) birth weight (g) (<1000, 1000-1499, 1500-2499, ≥2500), (4) multiple birth (Yes, No), (5) Apgar score (1 minute) (0-3, 4-6, 7-10), (6) Apgar score (5 minutes) (0-3, 4-6, 7-10), (7) resuscitated with positive pressure ventilation (PPV) (Yes, No), (8) congenital malformations such as neural tube defects, omphalocele (Yes, No), (8) Temperature (°C) (<35.5, ≥35.5), (9) respiratory rate (breaths per minute) (<60, ≥60), (10) level of consciousness (Alert, Sleepy/Comatose), (11) admitted to the NICU (Yes, No),
Preterm was considered a live birth before 37 weeks of gestation. According to the World Health Organization: (1) extremely preterm (<28 weeks), (2) very preterm (28.0-31.6 weeks), and (3) moderate to late preterm (32.0-36.6 weeks). 20
Statistical Analysis
We analyzed data using SAS (version 9.4). Frequency and percentages were reported for maternal and neonatal factors and Chi-square tests were conducted to compare the distribution of maternal and neonatal factors among infants who died versus those who survived. Kaplan-Meier curves were used to graphically display the length of survival for neonates in each of the 2 sites (India and Pakistan). Cox proportional hazard models were used to compute unadjusted and adjusted hazard ratios (AHR) and 95% confidence intervals (CI) for mortality by maternal and neonatal factors. Furthermore, Firstly, Maternal and neonatal factors were analyzed separately, followed by a combined model building. A P-value of <.05 for multivariable model, while <.25 at univariate level was considered significant. For factors with multiple categories (eg, education), the factor is retained if the overall Wald chi-square test for the variable is significant. Regression models were run separately by the site (India, Pakistan) and for both sites combined. We calculated post-hoc power for each predictor which ranged from 90% to 100% (Supplemental Table 1).
Ethical Consideration
The study was approved by the ethical review committees of Aga Khan University (5212-CHS-ERC-18), the National Institute of Child Health (IERB: 11/2018) and the National Bioethics Committee, Pakistan (Ref No: 4-87/NBC-312/18/RDC/3816), KLE Academy of Higher Education and Research, Belagavi, India (KAHER/EC/2017-18/D-2867), and J. J. M. Medical College, Davangere, India (JJMMC/IEC/02-2018). All women provided written informed consent before participating in the study. The PURPOSe Study was registered on ClinicalTrials.gov (NCT03438110). Written informed consent was obtained from each research participant, wherein we secured their permission for the publication of data from the study participants.
Results
A total of 3446 cases of preterm neonates were included in this analysis (Figure 1). Of 3446 preterm neonates, 2025 were from India and 1421 from Pakistan. Overall, 804/3446 (23.3%) preterm neonates died on or before 28 days of life. The preterm neonatal deaths were 329/2025 (16.2%) in India, while 475/1421 (33.4%) in Pakistan. The Kaplan-Meier curves clearly chart the progression of days since birth against the probability of survival (Figure 2).
Figure 1.
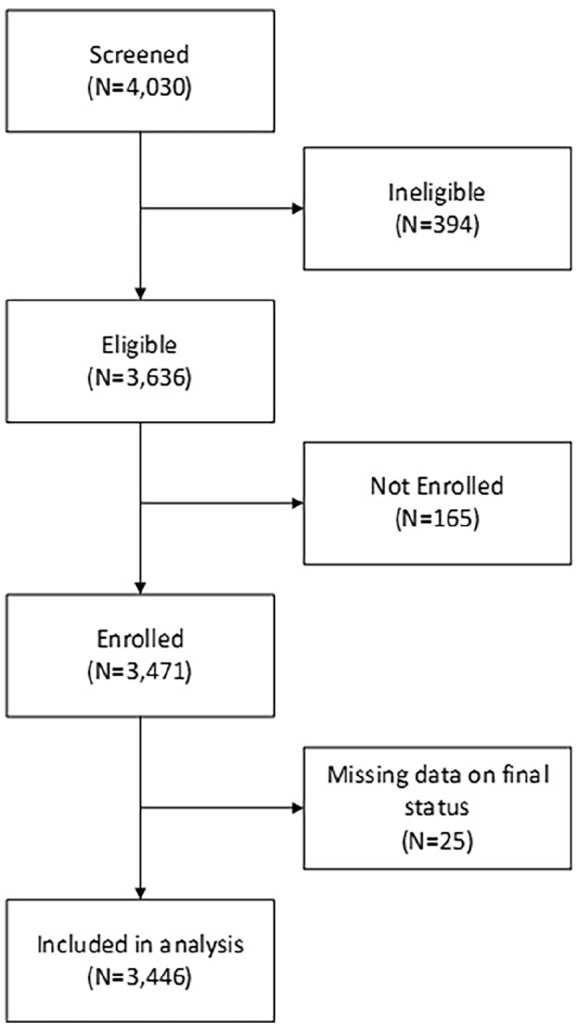
Study flow diagram.
Figure 2.
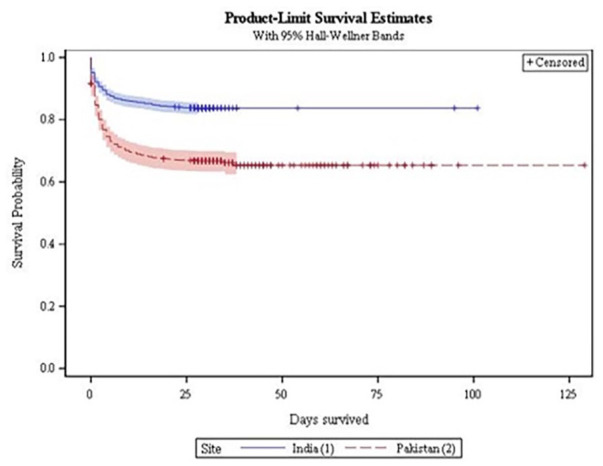
Kaplan-Meier survival curves by site.
Descriptives of maternal and neonatal factors by preterm neonatal outcome (died vs survived) are shown in Table 1. The proportion of preterm neonatal mortality is significantly associated with maternal age, maternal education, number of antenatal visits, gravida, GA, hemoglobin levels, any antepartum hemorrhage, and vaginal delivery. The neonatal factors include the sex of the baby, birth weight, APGAR score, multiple births, resuscitation with PPV, congenital malformation, temperature <35.5°C, level of consciousness, and NICU admission.
Table 1.
Characteristics of Enrolled Preterm Babies, by Mortality.
| Characteristics | All | India | Pakistan | ||||||
|---|---|---|---|---|---|---|---|---|---|
| Died (N = 804) | Survived (N = 2642) | P-value | Died (N = 329) | Survived (N = 1696) | P-value | Died (N = 475) | Survived (N = 946) | P-value | |
| All infants | |||||||||
| Maternal factors | |||||||||
| Maternal age (years), n (%) | |||||||||
| <20 | 62 (8) | 186 (7) | <.001 | 28 (9) | 143 (8) | .505 | 34 (7) | 43 (5) | .053 |
| 20-25 | 353 (44) | 1398 (53) | 179 (54) | 995 (59) | 174 (37) | 403 (43) | |||
| 26-30 | 265 (33) | 761 (29) | 91 (28) | 421 (25) | 174 (37) | 340 (36) | |||
| >30 | 122 (15) | 297 (11) | 31 (9) | 137 (8) | 91 (19) | 160 (17) | |||
| Maternal education, n (%) | |||||||||
| No formal schooling | 265 (33) | 531 (20) | <.001 | 35 (11) | 163 (10) | .354 | 230 (48) | 368 (39) | .005 |
| <5 years | 31 (4) | 85 (3) | 16 (5) | 52 (3) | 15 (3) | 33 (3) | |||
| 5-12 years | 460 (57) | 1803 (69) | 246 (75) | 1311 (78) | 214 (45) | 492 (52) | |||
| >12 years | 45 (6) | 210 (8) | 29 (9) | 158 (9) | 16 (3) | 52 (6) | |||
| Number of antenatal care visits, n (%) | |||||||||
| 0 | 37 (5) | 46 (2) | <.001 | 2 (1) | 7 (0) | .851 | 35 (7) | 39 (4) | .004 |
| 1-3 | 224 (28) | 467 (18) | 21 (6) | 101 (6) | 203 (43) | 366 (39) | |||
| 4+ | 539 (67) | 2119 (81) | 306 (93) | 1584 (94) | 233 (49) | 535 (57) | |||
| Gravida, n (%) | |||||||||
| 0 | 286 (36) | 1055 (40) | <.001 | 140 (43) | 766 (45) | .285 | 146 (31) | 289 (31) | .920 |
| 1-3 | 403 (50) | 1329 (50) | 175 (53) | 882 (52) | 228 (48) | 447 (47) | |||
| 4+ | 115 (14) | 257 (10) | 14 (4) | 47 (3) | 101 (21) | 210 (22) | |||
| Gestational age (weeks), n(%) | |||||||||
| <28.0 | 201 (25) | 9 (0) | <.001 | 78 (24) | 2 (0) | <.001 | 123 (26) | 7 (1) | <.001 |
| 28.0-31.6 | 297 (37) | 236 (9) | 113 (34) | 149 (9) | 184 (39) | 87 (9) | |||
| 32.0-36.6 | 306 (38) | 2397 (91) | 138 (42) | 1545 (91) | 168 (35) | 852 (90) | |||
| Hemoglobin levels (g/dl), n (%) | |||||||||
| <7 | 29 (4) | 68 (3) | <.001 | 9 (3) | 49 (3) | .492 | 20 (5) | 19 (2) | .002 |
| 7-8.9 | 107 (14) | 250 (10) | 32 (10) | 148 (9) | 75 (18) | 102 (12) | |||
| 9-10.9 | 294 (39) | 923 (36) | 117 (36) | 530 (31) | 177 (42) | 393 (44) | |||
| 11-12.9 | 259 (34) | 1042 (40) | 125 (38) | 724 (43) | 134 (31) | 318 (36) | |||
| ≥13 | 65 (9) | 293 (11) | 45 (14) | 238 (14) | 20 (5) | 55 (6) | |||
| Any hypertensive disorder, n (%) | 247 (31) | 779 (30) | .514 | 122 (37) | 599 (35) | .551 | 125 (26) | 180 (19) | .002 |
| Any antepartum hemorrhage, n (%) | 93 (12) | 144 (5) | <.001 | 27 (8) | 101 (6) | .125 | 66 (14) | 43 (5) | <.001 |
| Mode of delivery, n (%) | |||||||||
| Vaginal delivery | 652 (81) | 1698 (64) | <.001 | 245 (74) | 997 (59) | <.001 | 407 (86) | 701 (74) | <.001 |
| Cesarean section | 151 (19) | 940 (36) | 84 (26) | 696 (41) | 67 (14) | 244 (26) | |||
| Neonatal factors | |||||||||
| Postnatal age at the exam (hours), mean (SD a ) | 0.65 (0.72) | 0.64 (1.48) | .981 | 0.17 (0.90) | 0.38 (1.53) | .014 | 0.97 (0.21) | 1.11 (1.25) | .019 |
| Sex, n (%) | |||||||||
| Female | 353 (44) | 1300 (49) | .011 | 139 (42) | 822 (48) | .039 | 214 (45) | 478 (51) | .065 |
| Male | 447 (56) | 1340 (51) | 190 (58) | 874 (52) | 257 (55) | 466 (49) | |||
| Birth weight (g), n (%) | |||||||||
| <1000 | 188 (23) | 15 (1) | <.001 | 95 (29) | 13 (1) | <.001 | 93 (20) | 2 (0) | <.001 |
| 1000-1499 | 288 (36) | 243 (9) | 135 (41) | 216 (13) | 153 (32) | 27 (3) | |||
| 1500-2499 | 289 (36) | 1689 (64) | 88 (27) | 1190 (70) | 201 (42) | 499 (53) | |||
| ≥2500 | 38 (5) | 695 (26) | 11 (3) | 277 (16) | 27 (6) | 418 (44) | |||
| Multiple birth | 160 (20) | 375 (14) | <.001 | 59 (18) | 228 (13) | .033 | 101 (21) | 147 (16) | .007 |
| Apgar score (1 minute), n (%) | |||||||||
| 0-3 | 295 (38) | 84 (3) | <.001 | 157 (49) | 67 (4) | <.001 | 138 (31) | 17 (2) | <.001 |
| 4-6 | 364 (47) | 1464 (57) | 147 (46) | 1212 (74) | 217 (49) | 252 (27) | |||
| 7-10 | 109 (14) | 1021 (40) | 19 (6) | 357 (22) | 90 (20) | 664 (71) | |||
| Apgar score (5 minutes), n (%) | |||||||||
| 0-3 | 192 (25) | 21 (1) | <.001 | 83 (26) | 14 (1) | <.001 | 109 (24) | 7 (1) | <.001 |
| 4-6 | 281 (36) | 302 (12) | 124 (38) | 229 (14) | 157 (35) | 73 (8) | |||
| 7-10 | 304 (39) | 2249 (87) | 116 (36) | 1395 (85) | 188 (41) | 854 (91) | |||
| Resuscitated with PPV b , n (%) | 283 (36) | 149 (6) | <.001 | 168 (51) | 113 (7) | <.001 | 115 (25) | 36 (4) | <.001 |
| Congenital malformations, n (%) | 604 (75) | 481 (18) | <.001 | 275 (84) | 371 (22) | <.001 | 329 (69) | 110 (12) | <.001 |
| Temperature (°C), n (%) | |||||||||
| <35.5 | 257 (32) | 703 (27) | .002 | 142 (43) | 565 (34) | <.001 | 115 (25) | 138 (15) | <.001 |
| ≥35.5 | 534 (68) | 1907 (73) | 187 (57) | 1121 (66) | 347 (75) | 786 (85) | |||
| Respiratory rate (breaths per minute), n (%) | |||||||||
| <60 | 126 (16) | 293 (11) | <.001 | 120 (36) | 269 (16) | <.001 | 6 (1) | 24 (3) | .125 |
| ≥60 | 669 (84) | 2347 (89) | 209 (64) | 1426 (84) | 460 (99) | 921 (97) | |||
| Level of consciousness, n (%) | |||||||||
| Alert | 766 (95) | 2629 (100) | <.001 | 309 (94) | 1691 (100) | <.001 | 457 (96) | 938 (99) | <.001 |
| Sleepy/Comatose | 38 (5) | 13 (0) | 20 (6) | 5 (0) | 18 (4) | 8 (1) | |||
| NICU c admission | |||||||||
| Yes | 602 (75) | 1065 (40) | <.001 | 262 (80) | 819 (48) | <.001 | 340 (72) | 246 (26) | <.001 |
| No | 202 (25) | 1577 (60) | 67 (20) | 877 (52) | 135 (28) | 700 (74) | |||
Unless otherwise noted, values are N (column %).
SD, standard deviation.
PPV, positive pressure ventilation.
NICU, neonatal intensive care unit.
Overall Multivariable Model
Overall, among maternal factors (Table 2), any antepartum hemorrhage AHR 1.99 (95% CI: 1.60-2.47) was the predictor of preterm neonatal mortality. Among neonatal factors (Table 3), congenital malformation AHR 3.84 (95% CI: 3.10-4.77), and NICU admission AHR 3.54 (3.02-4.16) were the predictors of preterm neonatal mortality. After combining maternal and neonatal factors (Table 4), resuscitated with PPV, AHR 1.30 (95% CI: 1.08-1.57), congenital malformation, AHR 3.31 (95% CI: 2.64-4.16), and temperature ≤ 35.5°C, AHR 1.18 (95% CI: 1.00-1.39) were predictors of the preterm neonatal mortality.
Table 2.
Hazard Ratios of Factors Associated With Mortality of Preterm Neonates: Maternal Factors Only.
| Characteristic | All | India | Pakistan | |||
|---|---|---|---|---|---|---|
| Unadjusted hazard ratio (95% CI) | Adjusted hazard ratio (95% CI) | Unadjusted hazard ratio (95% CI) | Adjusted hazard ratio (95% CI) | Unadjusted hazard ratio (95% CI) | Adjusted hazard ratio (95% CI) | |
| Maternal factors | ||||||
| Maternal age (years) | ||||||
| <20 | REF | REF | REF | - | REF | - |
| 20-25 | 0.78 (0.59, 1.02) | 0.87 (0.66, 1.16) | 0.94 (0.63, 1.39) | - | 0.60 (0.41, 0.86) | - |
| 26-30 | 1.02 (0.78, 1.35) | 0.95 (0.70, 1.29) | 1.10 (0.72, 1.68) | - | 0.68 (0.47, 0.98) | - |
| >30 | 1.18 (0.87, 1.61) | 1.03 (0.73, 1.48) | 1.15 (0.69, 1.91) | - | 0.75 (0.51, 1.11) | - |
| Maternal education | ||||||
| No formal schooling | REF | REF | REF | - | REF | REF |
| <5 years | 0.78 (0.54, 1.13) | 1.15 (0.78, 1.69) | 1.36 (0.75, 2.46) | - | 0.79 (0.47, 1.32) | 1.03 (0.59, 1.78) |
| 5-12 years | 0.57 (0.49, 0.66) | 0.82 (0.69, 0.98) | 0.89 (0.62, 1.26) | - | 0.75 (0.62, 0.91) | 1.01 (0.81, 1.24) |
| >12 years | 0.50 (0.36, 0.69) | 0.75 (0.53, 1.06) | 0.88 (0.54, 1.44) | - | 0.59 (0.35, 0.97) | 0.79 (0.44, 1.41) |
| Number of antenatal care visits | ||||||
| 0 | REF | REF | REF | - | REF | REF |
| 1-3 | 0.63 (0.45, 0.89) | 1.00 (0.64, 1.59) | 0.84 (0.20, 3.60) | - | 0.63 (0.44, 0.90) | 0.92 (0.57, 1.48) |
| 4+ | 0.37 (0.27, 0.52) | 1.07 (0.68, 1.68) | 0.77 (0.19, 3.09) | - | 0.53 (0.37, 0.76) | 1.17 (0.72, 1.89) |
| Gravida | ||||||
| 0 | REF | REF | REF | - | REF | - |
| 1-3 | 1.10 (0.94, 1.28) | 1.04 (0.88, 1.23) | 1.08 (0.86, 1.35) | - | 1.00 (0.81, 1.24) | - |
| 4+ | 1.52 (1.22, 1.89) | 0.92 (0.70, 1.21) | 1.57 (0.91, 2.72) | - | 0.95 (0.74, 1.23) | - |
| Gestational age (weeks) | ||||||
| <28.0 | REF | REF | REF | REF | REF | REF |
| 28.0-31.6 | 0.28 (0.23, 0.34) | 0.30 (0.24, 0.36) | 0.20 (0.15, 0.28) | 0.21 (0.16, 0.29) | 0.36 (0.28, 0.45) | 0.38 (0.29, 0.49) |
| 32.0-36.6 | 0.04 (0.03, 0.05) | 0.05 (0.04, 0.06) | 0.03 (0.02, 0.04) | 0.03 (0.02, 0.04) | 0.06 (0.05, 0.08) | 0.06 (0.05, 0.08) |
| Hemoglobin levels (g/dl) | ||||||
| <7 | REF | REF | REF | - | REF | REF |
| 7-8.9 | 0.97 (0.64, 1.46) | 1.32 (0.87, 2.00) | 1.14 (0.55, 2.39) | - | 0.73 (0.45, 1.20) | 0.98 (0.59, 1.63) |
| 9-10.9 | 0.77 (0.53, 1.13) | 1.01 (0.69, 1.49) | 1.18 (0.60, 2.32) | - | 0.51 (0.32, 0.82) | 0.73 (0.46, 1.18) |
| 11-12.9 | 0.62 (0.42, 0.91) | 0.97 (0.66, 1.44) | 0.94 (0.48, 1.85) | - | 0.49 (0.31, 0.79) | 0.73 (0.45, 1.20) |
| ≥13 | 0.56 (0.36, 0.86) | 0.98 (0.62, 1.54) | 1.03 (0.50, 2.10) | - | 0.42 (0.22, 0.79) | 0.72 (0.38, 1.38) |
| Any hypertensive disorder | 1.04 (0.89, 1.20) | - | 1.06 (0.84, 1.32) | - | 1.36 (1.10, 1.66) | 1.56 (1.25, 1.95) |
| Any antepartum hemorrhage | 1.99 (1.60, 2.47) | 1.60 (1.27, 2.02) | 1.40 (0.94, 2.07) | - | 2.35 (1.81, 3.05) | 1.77 (1.33, 2.36) |
| Mode of delivery | ||||||
| Vaginal delivery | REF | REF | REF | REF | REF | REF |
| Cesarean section | 0.46 (0.39, 0.55) | 0.62 (0.51, 0.75) | 0.52 (0.41, 0.67) | 0.67 (0.52, 0.86) | 0.53 (0.41, 0.69) | 0.68 (0.51, 0.90) |
Table 3.
Hazard Ratios of Factors Associated With Mortality of Preterm Neonates: Neonatal Factors Only.
| Characteristic | All | India | Pakistan | |||
|---|---|---|---|---|---|---|
| Unadjusted hazard ratio (95% CI) | Adjusted hazard ratio (95% CI) | Unadjusted hazard ratio (95% CI) | Adjusted hazard ratio (95% CI) | Unadjusted hazard ratio (95% CI) | Adjusted hazard ratio (95% CI) | |
| Neonatal factors | ||||||
| Postnatal age at exam (hours) | 1.00 (0.95, 1.05) | - | 0.83 (0.71, 0.97) | 0.91 (0.81, 1.03) | 0.72 (0.54, 0.97) | 0.73 (0.54, 0.97) |
| Sex | ||||||
| Female | 0.84 (0.73, 0.96) | 0.85 (0.74, 0.98) | 0.80 (0.64, 0.99) | 0.84 (0.67, 1.05) | 0.85 (0.70, 1.01) | - |
| Male | REF | REF | REF | REF | REF | - |
| Birth weight (g) | ||||||
| <1000 | REF | REF | REF | REF | REF | REF |
| 1000-1499 | 0.30 (0.25, 0.37) | 0.59 (0.48, 0.73) | 0.24 (0.18, 0.31) | 0.55 (0.41, 0.74) | 0.46 (0.35, 0.60) | 0.70 (0.52, 0.94) |
| 1500-2499 | 0.06 (0.05, 0.08) | 0.21 (0.17, 0.27) | 0.04 (0.03, 0.05) | 0.16 (0.11, 0.22) | 0.09 (0.07, 0.12) | 0.27 (0.19, 0.36) |
| ≥2500 | 0.02 (0.02, 0.03) | 0.09 (0.06, 0.13) | 0.02 (0.01, 0.04) | 0.11 (0.06, 0.21) | 0.02 (0.01, 0.03) | 0.06 (0.04, 0.11) |
| Multiple birth | 1.42 (1.20, 1.69) | 1.18 (0.99, 1.42) | 1.36 (1.02, 1.80) | 1.14 (0.85, 1.54) | 1.37 (1.10, 1.71) | 1.10 (0.87, 1.40) |
| Apgar score (5 minutes) | ||||||
| 0-3 | REF | REF | REF | REF | REF | REF |
| 4-6 | 0.24 (0.20, 0.29) | 0.46 (0.37, 0.58) | 0.19 (0.14, 0.25) | 0.45 (0.32, 0.63) | 0.34 (0.27, 0.44) | 0.51 (0.39, 0.68) |
| 7-10 | 0.05 (0.04, 0.05) | 0.23 (0.18, 0.29) | 0.03 (0.03, 0.05) | 0.24 (0.16, 0.37) | 0.06 (0.05, 0.08) | 0.26 (0.19, 0.36) |
| Resuscitated with PPV a | 5.82 (5.03, 6.75) | 1.13 (0.95, 1.36) | 9.47 (7.61, 11.78) | 1.78 (1.34, 2.38) | 4.52 (3.65, 5.60) | 1.03 (0.80, 1.34) |
| Congenital malformations | 9.33 (7.94, 10.96) | 3.84 (3.10, 4.77) | 13.86 (10.35, 18.57) | 4.27 (2.91, 6.24) | 8.78 (7.19, 10.72) | 2.70 (2.06, 3.54) |
| Temperature (°C) | ||||||
| <35.5 | 1.29 (1.11, 1.49) | 1.04 (0.89, 1.22) | 1.48 (1.19, 1.84) | 1.09 (0.87, 1.37) | 1.65 (1.34, 2.04) | 1.28 (1.02, 1.61) |
| ≥35.5 | REF | REF | REF | REF | REF | REF |
| Respiratory rate (breaths per minute) | ||||||
| <60 | 0.72 (0.59, 0.87) | 0.81 (0.47, 1.13) | 0.38 (0.31, 0.48) | 0.91 (0.70, 1.19) | 1.79 (0.80, 4.01) | - |
| ≥60 | REF | REF | REF | REF | REF | - |
| Level of consciousness | ||||||
| Alert | 0.18 (0.13, 0.25) | 0.53 (0.35, 0.81) | 0.10 (0.07, 0.16) | 0.40 (0.24, 0.68) | 0.32 (0.20, 0.52) | 0.27 (0.13, 0.57) |
| Sleepy/comatose | REF | REF | REF | REF | REF | REF |
| NICU b admission | ||||||
| Yes | 3.54 (3.02, 4.16) | 1.10 (0.90, 1.34) | 3.60 (2.75, 4.71) | 0.88 (0.63, 1.23) | 4.57 (3.74, 5.59) | 1.55 (1.21, 1.98) |
| No | REF | REF | REF | REF | REF | REF |
PPV, positive pressure ventilation.
NICU, neonatal intensive care unit.
Table 4.
Hazard Ratios of Factors Associated With Mortality of Preterm Neonates: Maternal and Neonatal Factors.
| Characteristic | All | India | Pakistan | |||
|---|---|---|---|---|---|---|
| Unadjusted hazard ratio (95% CI) | Adjusted hazard ratio (95% CI) | Unadjusted hazard ratio (95% CI) | Adjusted hazard ratio (95% CI) | Unadjusted hazard ratio (95% CI) | Adjusted hazard ratio (95% CI) | |
| Maternal factors | ||||||
| Maternal age (years) | ||||||
| <20 | REF | REF | REF | - | REF | - |
| 20-25 | 0.78 (0.59, 1.02) | 0.89 (0.66, 1.19) | 0.94 (0.63, 1.39) | - | 0.60 (0.41, 0.86) | - |
| 26-30 | 1.02 (0.78, 1.35) | 0.95 (0.70, 1.31) | 1.10 (0.72, 1.68) | - | 0.68 (0.47, 0.98) | - |
| >30 | 1.18 (0.87, 1.61) | 1.12 (0.78, 1.61) | 1.15 (0.69, 1.91) | - | 0.75 (0.51, 1.11) | - |
| Maternal education | ||||||
| No formal schooling | REF | REF | REF | - | REF | |
| <5 years | 0.78 (0.54, 1.13) | 1.07 (0.71, 1.62) | 1.36 (0.75, 2.46) | - | 0.79 (0.47, 1.32) | 1.07 (0.59, 1.96) |
| 5-12 years | 0.57 (0.49, 0.66) | 0.89 (0.73, 1.07) | 0.89 (0.62, 1.26) | - | 0.75 (0.62, 0.91) | 1.17 (0.93, 1.46) |
| >12 years | 0.50 (0.36, 0.69) | 0.67 (0.47, 0.97) | 0.88 (0.54, 1.44) | - | 0.59 (0.35, 0.97) | 0.84 (0.45, 1.60) |
| Number of antenatal care visits | ||||||
| 0 | REF | REF | REF | - | REF | |
| 1-3 | 0.63 (0.45, 0.89) | 0.81 (0.51, 1.29) | 0.84 (0.20, 3.60) | - | 0.63 (0.44, 0.90) | 0.78 (0.48, 1.27) |
| 4+ | 0.37 (0.27, 0.52) | 0.69 (0.44, 1.10) | 0.77 (0.19, 3.09) | 0.53 (0.37, 0.76) | 0.79 (0.49, 1.29) | |
| Gravida | ||||||
| 0 | REF | REF | REF | - | REF | - |
| 1-3 | 1.10 (0.94, 1.28) | 1.04 (0.88, 1.25) | 1.08 (0.86, 1.35) | - | 1.00 (0.81, 1.24) | - |
| 4+ | 1.52 (1.22, 1.89) | 0.99 (0.74, 1.33) | 1.57 (0.91, 2.72) | - | 0.95 (0.74, 1.23) | - |
| Gestational age (weeks) | ||||||
| <28.0 | REF | REF | REF | REF | REF | REF |
| 28.0-31.6 | 0.28 (0.23, 0.34) | 0.74 (0.58, 0.93) | 0.20 (0.15, 0.28) | 0.62 (0.44, 0.88) | 0.36 (0.28, 0.45) | 0.83 (0.61, 1.15) |
| 32.0-36.6 | 0.04 (0.03, 0.05) | 0.36 (0.27, 0.49) | 0.03 (0.02, 0.04) | 0.40 (0.26, 0.60) | 0.06 (0.05, 0.08) | 0.46 (0.31, 0.70) |
| Hemoglobin levels (g/dl) | ||||||
| <7 | REF | REF | REF | - | REF | REF |
| 7-8.9 | 0.97 (0.64, 1.46) | 1.13 (0.72, 1.78) | 1.14 (0.55, 2.39) | - | 0.73 (0.45, 1.20) | 0.77 (0.43, 1.37) |
| 9-10.9 | 0.77 (0.53, 1.13) | 1.06 (0.69, 1.61) | 1.18 (0.60, 2.32) | - | 0.51 (0.32, 0.82) | 0.71 (0.41, 1.23) |
| 11-12.9 | 0.62 (0.42, 0.91) | 0.83 (0.54, 1.28) | 0.94 (0.48, 1.85) | - | 0.49 (0.31, 0.79) | 0.68 (0.39, 1.18) |
| ≥13 | 0.56 (0.36, 0.86) | 0.76 (0.46, 1.23) | 1.03 (0.50, 2.10) | - | 0.42 (0.22, 0.79) | 0.58 (0.28, 1.17) |
| Any hypertensive disorder | 1.04 (0.89, 1.20) | - | 1.06 (0.84, 1.32) | - | 1.36 (1.10, 1.66) | 1.08 (0.85, 1.36) |
| Any antepartum hemorrhage | 1.99 (1.60, 2.47) | 1.20 (0.94, 1.53) | 1.40 (0.94, 2.07) | - | 2.35 (1.81, 3.05) | 1.30 (0.95, 1.77) |
| Mode of delivery | ||||||
| Vaginal delivery | REF | REF | REF | REF | REF | REF |
| Cesarean section | 0.46 (0.39, 0.55) | 0.64 (0.52, 0.78) | 0.52 (0.41, 0.67) | 0.63 (0.48, 0.82) | 0.53 (0.41, 0.69) | 0.91 (0.67, 1.25) |
| Neonatal factors | ||||||
| Postnatal age at the exam (hours) | 1.00 (0.95, 1.05) | - | 0.83 (0.71, 0.97) | 0.91 (0.82, 1.02) | 0.72 (0.54, 0.97) | 0.70 (0.50, 0.98) |
| Sex | ||||||
| Female | 0.84 (0.73, 0.96) | 0.86 (0.74, 1.00) | 0.80 (0.64, 0.99) | 0.85 (0.68, 1.07) | 0.85 (0.70, 1.01) | - |
| Male | REF | REF | REF | REF | REF | - |
| Birth weight (g) | ||||||
| <1000 | REF | REF | REF | REF | REF | REF |
| 1000-1499 | 0.30 (0.25, 0.37) | 0.76 (0.60, 0.96) | 0.24 (0.18, 0.31) | 0.79 (0.57, 1.09) | 0.46 (0.35, 0.60) | 0.77 (0.55, 1.10) |
| 1500-2499 | 0.06 (0.05, 0.08) | 0.42 (0.31, 0.56) | 0.04 (0.03, 0.05) | 0.29 (0.19, 0.45) | 0.09 (0.07, 0.12) | 0.44 (0.29, 0.66) |
| ≥2500 | 0.02 (0.02, 0.03) | 0.19 (0.12, 0.31) | 0.02 (0.01, 0.04) | 0.23 (0.11, 0.48) | 0.02 (0.01, 0.03) | 0.12 (0.06, 0.22) |
| Multiple birth | 1.42 (1.20, 1.69) | 1.09 (0.90, 1.34) | 1.36 (1.02, 1.80) | 1.00 (0.75, 1.35) | 1.37 (1.10, 1.71) | 1.15 (0.88, 1.51) |
| Apgar score (5 minutes) | ||||||
| 0-3 | REF | REF | REF | REF | REF | REF |
| 4-6 | 0.24 (0.20, 0.29) | 0.50 (0.40, 0.63) | 0.19 (0.14, 0.25) | 0.44 (0.31, 0.63) | 0.34 (0.27, 0.44) | 0.55 (0.40, 0.74) |
| 7-10 | 0.05 (0.04, 0.05) | 0.27 (0.21, 0.36) | 0.03 (0.03, 0.05) | 0.25 (0.16, 0.38) | 0.06 (0.05, 0.08) | 0.29 (0.20, 0.42) |
| Resuscitated with PPV a | 5.82 (5.03, 6.75) | 1.30 (1.08, 1.57) | 9.47 (7.61, 11.78) | 1.76 (1.32, 2.35) | 4.52 (3.65, 5.60) | 1.05 (0.78, 1.39) |
| Congenital malformations | 9.33 (7.94, 10.96) | 3.31 (2.64, 4.16) | 13.86 (10.35, 18.57) | 3.92 (2.67, 5.76) | 8.78 (7.19, 10.72) | 2.58 (1.93, 3.45) |
| Temperature (°C) | ||||||
| <35.5 | 1.29 (1.11, 1.49) | 1.18 (1.00, 1.39) | 1.48 (1.19, 1.84) | 1.15 (0.91, 1.45) | 1.65 (1.34, 2.04) | 1.32 (1.04, 1.69) |
| ≥35.5 | REF | REF | REF | REF | REF | REF |
| Respiratory rate (breaths per minute) | ||||||
| <60 | 0.72 (0.59, 0.87) | 0.40 (0.12, 0.74) | 0.38 (0.31, 0.48) | 0.90 (0.69, 1.18) | 1.79 (0.80, 4.01) | - |
| ≥60 | REF | REF | REF | REF | REF | - |
| Level of consciousness | ||||||
| Alert | 0.18 (0.13, 0.25) | 0.42 (0.27, 0.66) | 0.10 (0.07, 0.16) | 0.41 (0.24, 0.71) | 0.32 (0.20, 0.52) | 0.25 (0.12, 0.53) |
| Sleepy/comatose | REF | REF | REF | REF | REF | REF |
| NICU b admission | ||||||
| Yes | 3.54 (3.02, 4.16) | 1.06 (0.86, 1.31) | 3.60 (2.75, 4.71) | 1.03 (0.73, 1.45) | 4.57 (3.74, 5.59) | 1.39 (1.06, 1.82) |
| No | REF | REF | REF | REF | REF | REF |
PPV, positive pressure ventilation.
NICU, neonatal intensive care unit.
Multivariable Model for India
After combining maternal and neonatal factors (Table 4), resuscitated with PPV, AHR 1.76 (95% CI: 1.32-2.35), and congenital malformation, AHR 3.92 (95% CI: 2.67-5.76) were predictors of the preterm neonatal mortality.
Multivariable Model for Pakistan
After combining maternal and neonatal factors (Table 4), congenital malformation, AHR 2.58 (95% CI: 1.93-3.45), temperature ≤35.5°C, AHR 1.32 (95% CI: 1.04-1.69), and NICU admission AHR, 1.39 (95% CI: 1.06-1.82) were predictors of the preterm neonatal mortality.
Discussion
In this study, we found that the frequency of preterm neonatal death is twice as high in Pakistan compared to India. Overall, preterm neonates born to mothers with any antepartum hemorrhage were more likely to die whereas among neonatal factors, congenital malformation, temperature <35.5°C and NICU admission were the predictors of preterm neonatal mortality. In Pakistan, preterm neonates born to mothers with any hypertensive disorder and any antepartum hemorrhage were more likely to die. Furthermore, when both maternal and neonatal factors were combined in a model, none of the maternal factors predicted preterm neonatal death in India and Pakistan separately and combined.
The findings of this study are consistent with previous studies that showed that pregnancy outcomes are poor in Pakistan as compared to other LMICs. However, it is difficult to identify which maternal and neonatal factors are responsible for the high mortality in Pakistan. 21 There appears to be a complex interplay of several maternal, neonatal, and healthcare-related factors that contribute to these poor outcomes. Although some of the factors that have been identified in previous studies are attributed to the low level of literacy, short inter-delivery intervals, and high parity among Pakistani women which are consistent with our study as well. 21
Furthermore, in this study, the maternal factors predicting preterm neonatal deaths was found to be less important, which is similar to studies done in other developing countries. A study conducted in Ghana reported that neonatal and household factors have more predictive accuracy for preterm neonatal deaths within 28 days as compared to maternal factors. 22 Other studies suggest that neonatal factors are more predictive of neonatal death as compared to maternal factors alone. We also found that overall, preterm neonates with congenital malformations were more likely to die. In India, preterm neonates who were resuscitated with PPV and congenital malformations were more likely to die, whereas in Pakistan preterm neonates with congenital structural malformation, temperature <35.5°C, and preterm neonates admitted to NICU were more likely to die. Congenital malformations are one of the major contributing factors to prematurity and neonatal deaths globally. According to the WHO mortality database, 17% to 42% of infant mortality is attributed to congenital malformation, and 9 out of 10 neonates with severe congenital malformations come from LMICs. Although in this paper we haven’t stratified the type of congenital malformations, the presence of a congenital malformation is an important predictor of neonatal death both in Pakistan and India.
Additionally, temperature <35.5°C was a predictor of neonatal mortality. This result is similar to another study that reported that neonates who had temperature <35.5°C at admission were 2.6 times more at risk of death as compared to normothermic neonates. Also, temperature <35.5°C could be a symptom of underlying sepsis or infection which is also a predictor of neonatal mortality.23,24 A similar study conducted in Ethiopia found that neonates admitted to the NICU or temperature <35.5°C were more likely to die. 25
Moreover, in low-resource settings like Pakistan and India, not only neonatal factors but also the quality and availability of healthcare services in hospitals have a complex direct or indirect relationship with these predictors. Scarcity of resources and a lack of trained staff are among the contributory factors for these deaths.26-28 Our study also revealed that survival rates decline more rapidly in Pakistan than in India. These findings in Pakistan can be attributed to issues of healthcare access and quality, as well as a lack of a national policy on neonatal health. 29
Preterm neonates resuscitated with positive pressure ventilation, congenital malformations, or temperature <35.5°C, were more likely to die, irrespective of country (India vs Pakistan). The above findings would be helpful to provide insight into the important predictors for preterm neonatal mortality, especially in India and Pakistan. Because of the above findings, we recommend that facilities in low-resource settings should be equipped to identify these predictors and should be able to provide appropriate resuscitation care. 30 These predictors can also be utilized for devising context-specific interventions and flagging infants for continuous monitoring. We further suggest that access to high-quality intrapartum and postnatal care is of utmost importance to improve neonatal outcomes. Also, community workers can be trained further to identify these predictors and to closely follow up on these preterm infants.3,30,31
Strengths
First, the data were used from a prospective observational study from India and Pakistan on predictors of preterm neonatal deaths. Second, the GA was calculated using a gestational age calculator with an algorithm adjusted for the last menstrual period and/or antenatal ultrasound and/or Ballard scoring. Third, an advanced statistical analysis modeling with separate models as well as the combined model for maternal factor and neonatal factors.
Limitations
This study has some limitations. Firstly, the study’s generalizability is limited because this study was conducted in tertiary care referral hospitals only. Secondly, this study did not have data on maternal nutritional status, and community and environmental factors as well as variables such as skin-to-skin contact, antenatal corticosteroid use, antenatal fetal monitoring, and temperature at the time of admission that might help to predict neonatal mortality. Third, since we utilized data from a large observational study, we did not calculated the sample size. Lastly, since we calculated post hoc power, it’s important to note that it relies on observed data, potentially leading to biased results as it may not accurately reflect the underlying assumptions made during the study design.
This study has clinical and public health implications. The model aids early identification of high-risk infants, informing targeted interventions based on maternal factors like antepartum hemorrhage and neonatal factors such as positive pressure ventilation. The findings guide resource allocation in healthcare and inform policy development, emphasizing the importance of tailored antenatal care and health education programs.
Conclusion
In conclusion, this study highlights key determinants of preterm neonatal mortality in both maternal and neonatal contexts, emphasizing the need for targeted interventions. Beyond clinical applications, collaborative public health efforts are crucial to addressing disparities and navigating regional variations. Informed decision-making, resource allocation, and ongoing research are pivotal in mitigating the challenges of preterm neonatal mortality.
Supplemental Material
Supplemental material, sj-docx-1-gph-10.1177_2333794X241236617 for Predictors of Preterm Neonatal Mortality in India and Pakistan: A Secondary Analysis of Data from PURPOSe Study by Shiyam Sunder Tikmani, Sarah Saleem, Afreen Sadia, Carla M. Bann, Muhammad Hayat Bozdar, Jamal Raza, Sangappa M. Dhaded, Shivaprasad S. Goudar, Guruparasad Gowdar, Haleema Yasmin, Elizabeth M. McClure and Robert L. Goldenberg in Global Pediatric Health
Acknowledgments
The authors recognize the contributions of the midwives who collected data, Kanwal Ilyas, Momina Munir and Neelofar Sami for monitoring the data collection, and Zaheer Habib and the team for data management. We also acknowledge the parents of the enrolled infants who voluntarily participated in the study.
Footnotes
Author Contributions: SST, RLG, EM, SS, SPG, SMD, and GG – Conceptualized, designed, and interpreted findings, and SST prepared the first draft of the manuscript. CMB – conducted data analysis and interpretation. JR, MHB, and HY supervised and monitored the study implementation. All authors read and approved the final version of the manuscript.
The author(s) declared no potential conflicts of interest with respect to the research, authorship, and/or publication of this article.
Funding: The author(s) disclosed receipt of the following financial support for the research, authorship, and/or publication of this article: The primary study was funded by grants from the Bill and Malinda Gates Foundation. This was no role of the funding body in designing the study data collection, analysis, and interpretation, or writing the manuscript.
Dedication: To my Father Late Prof. Pirbhulal Tikmani and mother Late Asha Devi (Revti).
ORCID iDs: Shiyam Sunder Tikmani  https://orcid.org/0000-0001-8828-8325
Shivaprasad S. Goudar
https://orcid.org/0000-0002-8680-7053
Supplemental Material: Supplemental material for this article is available online.
References
- 1. World, Health Organization. Newborn mortality. 2023. Accessed January 14, 2023. https://www.who.int/news-room/fact-sheets/detail/levels-and-trends-in-child-mortality-report-2021
- 2. Singh S, Agrawal R, Agarwal G, et al. Predictors of neonatal mortality: A retrospective cross-sectional study from the special newborn care unit of a Tertiary Care Hospital. Cureus. 2023;15(4):e37143. [DOI] [PMC free article] [PubMed] [Google Scholar]
- 3. Desalew A, Sintayehu Y, Teferi N, et al. Cause and predictors of neonatal mortality among neonates admitted to neonatal intensive care units of public hospitals in eastern Ethiopia: a facility-based prospective follow-up study. BMC Pediatr. 2020;20:160-211. [DOI] [PMC free article] [PubMed] [Google Scholar]
- 4. Cao G, Liu J, Liu M. Global, regional, and national incidence and mortality of neonatal preterm birth, 1990-2019. JAMA Pediatr. 2022;176(8):787-796. doi: 10.1001/jamapediatrics.2022.1622 [DOI] [PMC free article] [PubMed] [Google Scholar]
- 5. Kannaujiya AK, Kumar K, Upadhyay AK, et al. Effect of preterm birth on early neonatal, late neonatal, and postneonatal mortality in India. PLoS Glob Public Heal. 2022;2(6). doi: 10.1371/journal.pgph.0000205 [DOI] [PMC free article] [PubMed] [Google Scholar]
- 6. Abebaw E, Reta A, Kibret G, Wagnew F. Incidence and predictors of mortality among preterm neonates admitted to the neonatal intensive care unit at Debre Markos referral hospital, Northwest Ethiopia. Ethiop J Health Sci. 2021;31(5):937-946. doi: 10.4314/ejhs.v31i5.4 [DOI] [PMC free article] [PubMed] [Google Scholar]
- 7. Chawanpaiboon S, Vogel JP, Moller A-B, et al. Global, regional, and national estimates of levels of preterm birth in 2014: a systematic review and modelling analysis. Lancet Glob Health. 2019;7(1):e37-e46. [DOI] [PMC free article] [PubMed] [Google Scholar]
- 8. Liu L, Chu Y, Oza S, et al. National, regional, and state-level all-cause and cause-specific under-5 mortality in India in 2000-15: a systematic analysis with implications for the sustainable development goals. Lancet Glob Health. 2019;7(6):e721-e734. [DOI] [PMC free article] [PubMed] [Google Scholar]
- 9. Dhaded SM, Saleem S, Goudar SS, et al. The causes of preterm neonatal deaths in India and Pakistan (PURPOSe): a prospective cohort study. Lancet Glob Health. 2022;10(11):e1575-e1581. [DOI] [PMC free article] [PubMed] [Google Scholar]
- 10. Sinshaw A, Minuye B, Mengistie B, Yeshambel A, Assefa N. Mortality of preterm neonates and its predictors in the Northwest part of Ethiopia: a retrospective cohort study. 2019. [Google Scholar]
- 11. Asmare Y, Mekonen H. Survival status and predictor of mortality among premature neonate admitted to neonatal intensive care unit from 2013–2017 in Tikur Anbesa specialized hospital, Addis Ababa, Ethiopia, 2018. Nursing Addis Ababa: Addis Ababa University. 2018:70. [Google Scholar]
- 12. Yismaw AE, Gelagay AA, Sisay MM. Survival and predictors among preterm neonates admitted at University of Gondar comprehensive specialized hospital neonatal intensive care unit, Northwest Ethiopia. Ital J Pediatr. 2019;45(1):4-11. [DOI] [PMC free article] [PubMed] [Google Scholar]
- 13. Abdel Razeq NM, Khader YS, Batieha AM. The incidence, risk factors, and mortality of preterm neonates: a prospective study from Jordan (2012-2013). Turk J Obstet Gynecol. 2017;14(1):28-36. [DOI] [PMC free article] [PubMed] [Google Scholar]
- 14. Li L, Yu J, Wang J, et al. A prediction score model for risk factors of mortality in neonate with pulmonary hemorrhage: the experience of single neonatal intensive care unit in Southwest China. Pediatr Pulmonol. 2008;43(10):997-1003. [DOI] [PubMed] [Google Scholar]
- 15. Houweling TA, Ronsmans C, Campbell OM, Kunst AE. Huge poor-rich inequalities in maternity care: an international comparative study of maternity and child care in developing countries. Bull World Health Organ. 2007;85(10):745-754. [DOI] [PMC free article] [PubMed] [Google Scholar]
- 16. Feng J, Lee J, Vesoulis ZA, Li F. Predicting mortality risk for preterm infants using deep learning models with time-series vital sign data. Digit Med. 2021;4(1):108. doi: 10.1038/s41746-021-00479-4 [DOI] [PMC free article] [PubMed] [Google Scholar]
- 17. Houweling TAJ, van Klaveren D, Das S, et al. A prediction model for neonatal mortality in low- and middle-income countries: an analysis of data from population surveillance sites in India, Nepal and Bangladesh. Int J Epidemiol. 2019;48(1):186-198. doi: 10.1093/ije/dyy194 [DOI] [PMC free article] [PubMed] [Google Scholar]
- 18. McClure EM, Saleem S, Goudar SS, et al. The project to understand and research preterm pregnancy outcomes and stillbirths in South Asia (PURPOSe): a protocol of a prospective, cohort study of causes of mortality among preterm births and stillbirths. Reprod Health. 2018;15(S1):45-53. [DOI] [PMC free article] [PubMed] [Google Scholar]
- 19. Bond S. American College of Obstetricians and Gynecologists releases committee opinion on estimation of due date. J Midwifery Womens Health. 2015;60(2):221-222. [DOI] [PubMed] [Google Scholar]
- 20. World Health Organization WH. WHO recommendations on interventions to improve preterm birth outcomes. 2015. [PubMed] [Google Scholar]
- 21. Aziz A, Saleem S, Nolen TL, et al. Why are the Pakistani maternal, fetal and newborn outcomes so poor compared to other low and middle-income countries? Reprod Health. 2020;17(Suppl 3):190. doi: 10.1186/s12978-020-01023-5 [DOI] [PMC free article] [PubMed] [Google Scholar]
- 22. Takramah WK, Aheto JMK. Predictive model and determinants of odds of neonates dying within 28 days of life in Ghana. Heal Sci Rep. 2021;4(1):e248. doi: 10.1002/hsr2.248 [DOI] [PMC free article] [PubMed] [Google Scholar]
- 23. Muhayimana A. Factors contributing to morbidity and mortality among preterm neonates admitted at two major hospitals in Rwanda. Res J Health Sci. 2017;5(3):137-147. [Google Scholar]
- 24. Wesenu M, Kulkarni S, Tilahun T. Modeling determinants of time-to-death in premature infants admitted to neonatal intensive care unit in Jimma university specialized hospital. Ann Data Sci. 2017;4:361-381. [Google Scholar]
- 25. Mengesha HG, Lerebo WT, Kidanemariam A, Gebrezgiabher G, Berhane Y. Pre-term and post-term births: predictors and implications on neonatal mortality in northern Ethiopia. BMC Nurs. 2016;15:48-11. [DOI] [PMC free article] [PubMed] [Google Scholar]
- 26. Gebreheat G, Teame H. Survival and mortality of preterm neonates in a neonatal intensive care unit in northern Ethiopia: a retrospective cohort study. Sci Rep. 2022;12(1):600. doi: 10.1038/s41598-021-04521-z [DOI] [PMC free article] [PubMed] [Google Scholar]
- 27. Rambliere L, de Lauzanne A, Diouf JB, et al. Stillbirths and neonatal mortality in LMICs: a community-based mother-infant cohort study. J Glob Health. 2023;13. doi: 10.7189/jogh.13.04031 [DOI] [PMC free article] [PubMed] [Google Scholar]
- 28. Gondwe MJ, Desmond N, Aminu M, Allen S. Resource availability and barriers to delivering quality care for newborns in hospitals in the southern region of Malawi: a multisite observational study. PLoS Glob Public Health. 2022;2(12). doi: 10.1371/journal.pgph.0001333 [DOI] [PMC free article] [PubMed] [Google Scholar]
- 29. Muzzamil M, Nisa M, Raza S. The survival rate of neonates in Pakistan: problems in health care access, quality and recommendations. Health Promot Perspect. 2022;12(4):355-357. doi: 10.34172/hpp.2022.46 [DOI] [PMC free article] [PubMed] [Google Scholar]
- 30. Khan FA, Mullany LC, Wu LF, et al. Predictors of neonatal mortality: development and validation of prognostic models using prospective data from rural Bangladesh. BMJ Glob Health. 2020;5(1). doi: 10.1136/bmjgh-2019-001983 [DOI] [PMC free article] [PubMed] [Google Scholar]
- 31. Bhutta ZA, Darmstadt GL, Hasan BS, Haws RA. Community-based interventions for improving perinatal and neonatal health outcomes in developing countries: a review of the evidence. Pediatrics. 2005;115(2 Suppl):519-617. doi: 10.1542/peds.2004-1441 [DOI] [PubMed] [Google Scholar]
Associated Data
This section collects any data citations, data availability statements, or supplementary materials included in this article.
Supplementary Materials
Supplemental material, sj-docx-1-gph-10.1177_2333794X241236617 for Predictors of Preterm Neonatal Mortality in India and Pakistan: A Secondary Analysis of Data from PURPOSe Study by Shiyam Sunder Tikmani, Sarah Saleem, Afreen Sadia, Carla M. Bann, Muhammad Hayat Bozdar, Jamal Raza, Sangappa M. Dhaded, Shivaprasad S. Goudar, Guruparasad Gowdar, Haleema Yasmin, Elizabeth M. McClure and Robert L. Goldenberg in Global Pediatric Health