Abstract
Candidate cis-regulatory elements (cCREs) in microglia demonstrate the most significant enrichment for Alzheimer’s disease (AD) heritability compared to other brain cell types. However, whether and how these GWAS variants contribute to AD remain elusive. Here, we prioritize 308 previously unreported AD risk variants at 181 cCREs by integrating genetic information with microglia-specific 3D epigenome annotation. We further establish the link between functional variants and target genes by single-cell CRISPRi screening in microglia. In addition, we show that AD variants exhibit allelic imbalance on target gene expression. In particular, rs7922621 is the effective variant in controlling TSPAN14 expression among other nominated variants in the same cCRE and exerts multiple physiological effects including reduced cell surface ADAM10 and altered soluble TREM2 shedding. Our work represents a systematic approach to prioritize and characterize AD-associated prioritized variants and provides a roadmap for advancing genetic association to experimentally validated cell type-specific phenotypes and mechanisms.
Introduction
Genetics of late-onset Alzheimer’s disease (LOAD) are complex with many variants potentially influencing LOAD with small effect sizes. The observation of substantial enrichment of AD-associated variants at candidate cis-regulatory elements (cCREs) suggests that risk variants likely contribute to pathogenesis through disrupting gene regulation mechanisms1–4. However, it has not been straightforward to identify the cell types in which variant-harboring cCREs function and the target genes they exert an effect on, or to quantify their impact on gene expression. It has been even more challenging to interrogate and measure subsequent physiopathological consequences that ultimately result in disease onset or progression. The challenges derive primarily from the following sources. First, genetic loci are themselves hard to decipher as the majority are located in poorly-annotated non-coding regions. Second, regulatory sequences often interact with their target genes over long genomic distances, precluding a straightforward identification of disease risk genes and limiting the interpretation of noncoding variants from genome-wide association studies (GWAS). Typically, noncoding variants are presumed to affect neighboring genes. However, this nearest gene model is challenged by both experimental and computational evidence5,6. Finally, the complexity of brain tissues makes functional interpretation and mechanistic dissection error prone, as genetic loci can affect only a subset of cell types during specific cellular and pathophysiological states. Microglia, as the resident immune cells in the brain, play essential roles in initiating immune responses, surveillance, and maintenance of brain homeostasis7. In particular, microglia cCREs consistently exhibit the highest enrichment for AD-associated variants compared to the cCREs identified in other brain cell types1,8.
Two most recent AD GWAS reported a total of 37 and 75 risk loci9,10 with a staggering number of candidate non-coding variants. Whether and how these variants affect AD risk gene expression and how these genes contribute to AD pathogenesis remain, for the most part, to be characterized. Although these publications represent by far the most comprehensive AD genetic analysis, variants and genes are prioritized without considering cell-type-specific chromatin interaction between putative risk non-coding variants and gene promoters. More importantly, prioritized genes in these works were not subject to functional genetics experimental interrogations.
In this study, we generated comprehensive annotations of 3D epigenome in well-characterized and physiological relevant microglia-like cells by hPSC-differentiation and IFNß stimulation, which were integrated into fine-mapping analysis for the prioritization of AD risk variants. We tested the roles of prioritized variants by single-cell CRISPRi screens and allelic analysis. Furthermore, by prime editing, we provide a functional annotation of rs7922621 contributing to the down regulation of TSPAN14 and AD related cellular pathological phenotypes.
Results
Differentiated microglia exhibits features of primary cells
We used two independent hPSC lines, WTC11 (a male induced pluripotent stem cell line) and H1 (a male human embryonic stem cell line), neither carrying ɛ4 allele nor in the top decile for AD risk when compared to unphenotyped individuals of matched continental ancestry, to derived microglia-like cells11 (Extended data Fig. 1a). These cells stably expressing microglia-specific proteins IBA-1 and TMEM119 (Fig. 1a and b, Extended Data Fig. 1b and c) and present strong phagocytosis function (Fig. 1c and Extended Data Fig. 1d). The transcriptome of hPSC-derived microglia-like cells closely mimics brain isolated microglia in vitro and ex vivo12 compared to other cell types3,11,13–15, confirming that the molecular properties of these microglia are similar to their counterparts from the human brain (Extended data Fig. 2a and b, Supplementary Table 1a).
Figure 1. Characterize differentiated microglia.
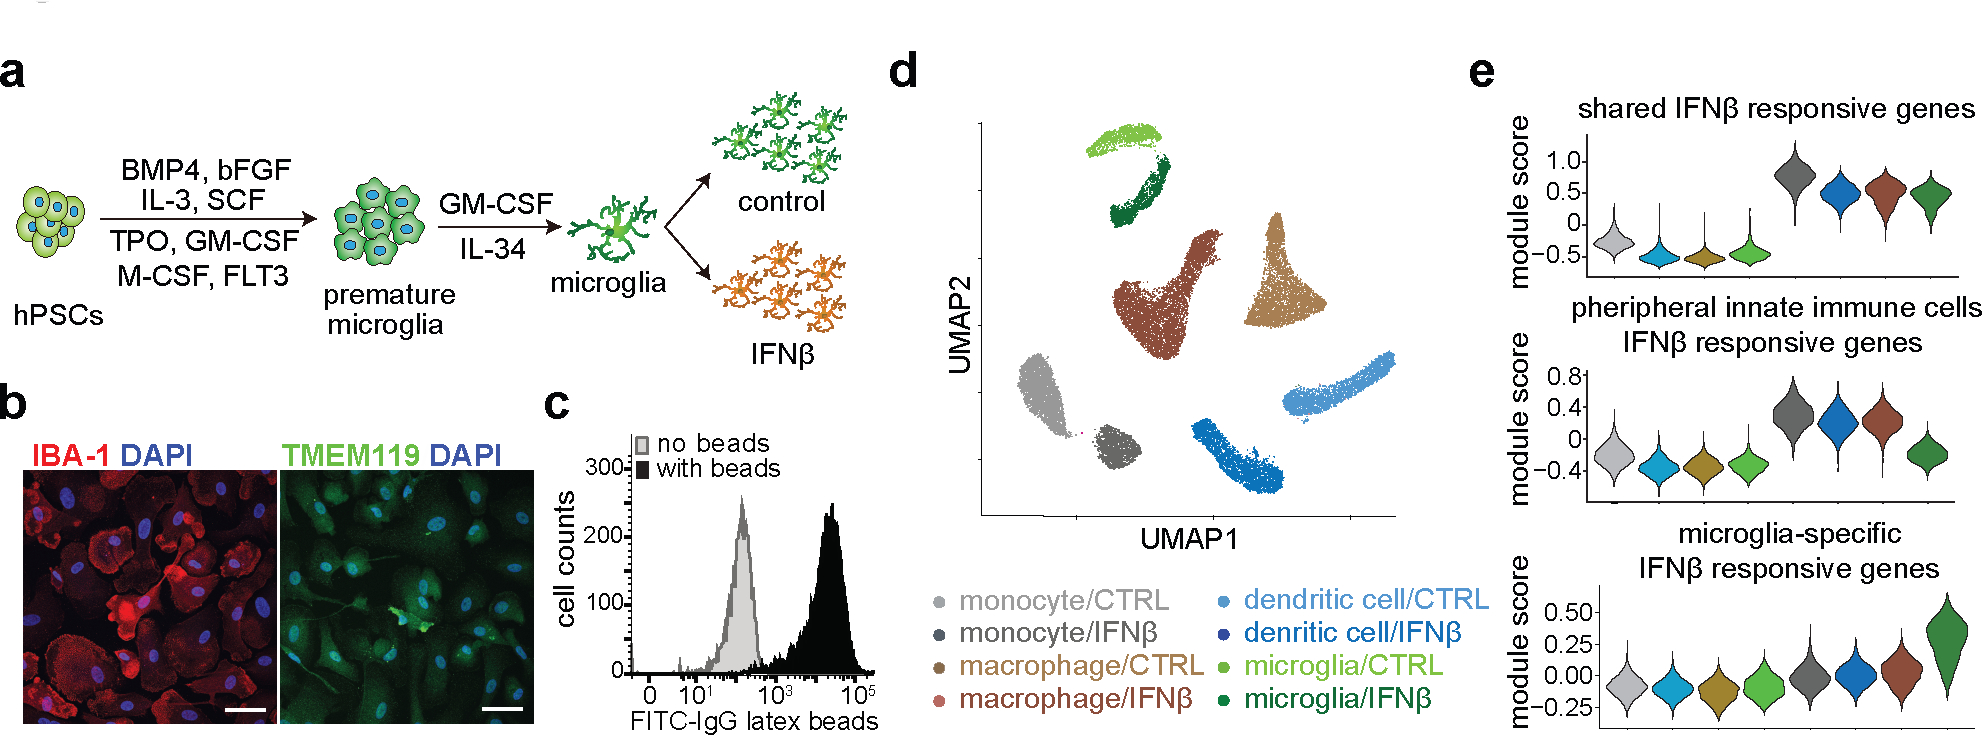
a, Schematic workflow of microglia differentiation and maturation using growth factors. b, Representative immunofluorescence staining of microglia-specific markers IBA-1 and TMEM119 from 3 independent differentiations. The white bars at the lower right corner represent 20 μm. c, FACS analysis of phagocytosis capacity of differentiated microglia with fluorescein-labeled rabbit IgG-coated latex beads. d, scRNA-seq UMAP visualization of cells from four distinct immune cell types including iPSC-derived microglia-like cells, in response to IFNß stimulation. Multiplexed single cell gene expression analysis using the 10X platform identifies eight major cell clusters corresponding to cell types and IFNß treatment conditions. e, Gene expression analysis reveals gene groups responding differentially to IFNß stimulation between peripheral myeloid cells and microglia.
Viral encephalitis exposure is associated with an elevated AD risk16 and interferon signaling is one of the key biological processes involved in AD conditions and responses to AD-relevant challenges17–20,. We treated differentiated microglia, and three innate immune cell types from a healthy donor, with IFNß (100U/ml), to mimic viral-like infection. The transcriptomes of different cell types are well separated and exhibit mirrored patterns of control vs. IFNß stimulated cells by single-cell RNA-seq (scRNA-seq), demonstrating the homogeneity of each cell type and interferon responses (Fig. 1d and Extended Data Fig. 2c). In hPSC-derived microglia, FCGR1A, TGIF1, LRP1 are highly expressed and PTPRC, CD163, MRC1 are lowly expressed, compared to the other three cell types (Extended Data Fig. 2d), further confirming their identity as microglia21. In addition, we observed shared and unique gene groups responsive to IFNß stimulation in both peripheral myeloid cells and microglia (Fig. 1e, Extended data Fig. 2e, Supplementary Table 2). For example, TCF4, IER2, ITM2B and MS4A6A are uniquely up-regulated in IFNß stimulated microglia (Extended Data Fig. 2e). Finally, microglia-specific responsive genes are enriched in biological pathways involved in regulating neuron death and cytokine-mediated signaling (Extended data Fig. 2f and Supplementary Table 3a).
IFNβ responsive genes in hPSC-derived microglia-like cells are highly enriched in multiple disease-associated microglia (DAM) clusters by Olah et al.18 and microglia samples associated with AD from 5 additional studies17,22–25 (Extended Data Fig. 3a). Furthermore, hPSC-derived microglia-like cells were embedded with primary microglia24 on UMAP (Extended Data Fig. 3b–c), and primary microglia and hPSC-derived microglia-like cells showed consistent fold change in cell proportion in AD/control or IFNβ/control for the top 3 major microglia subclusters, which contributed to a total of ~70% of the cells (Extended Data Fig. 3d–e). These results demonstrated that hPSC-derived microglia shared similar transcriptomic profiles as primary microglia, and IFNβ activated gene expression changes partially mimic DAM-specific expression.
Dynamic transcription and 3D epigenome in microglia upon stimulation
To investigate the mechanism underlying gene expression dynamics in immune response, we generated ATAC-seq datasets for control and IFNß stimulated WTC11- and H1-derived microglia-like cells (Supplementary Table 1b) and annotated cCREs based on chromatin accessibility. hPSC-derived microglia ATAC-seq datasets cluster together with those generated from microglia isolated from the human brain (Extended data Fig. 4a–c). Regions with gained (n=93 at TSS and 1,152 at distal regions) and lost (n=17 at TSS and n=783 at distal regions) chromatin accessibility upon IFNß stimulation are consistent between WTC11- and H1-derived microglia (Fig. 2a). Regions with gained accessibility are enriched for binding sites of key transcription factors in immune response, including STAT1, IRF1, JUNB, SPI1, and RUNX1 for both distal (Fig. 2b) and TSS accessible regions (Extended Data Fig. 4d).
Figure 2. Chromatin accessibility and interaction dynamics influence IFNß stimulated transcriptional changes in microglia.
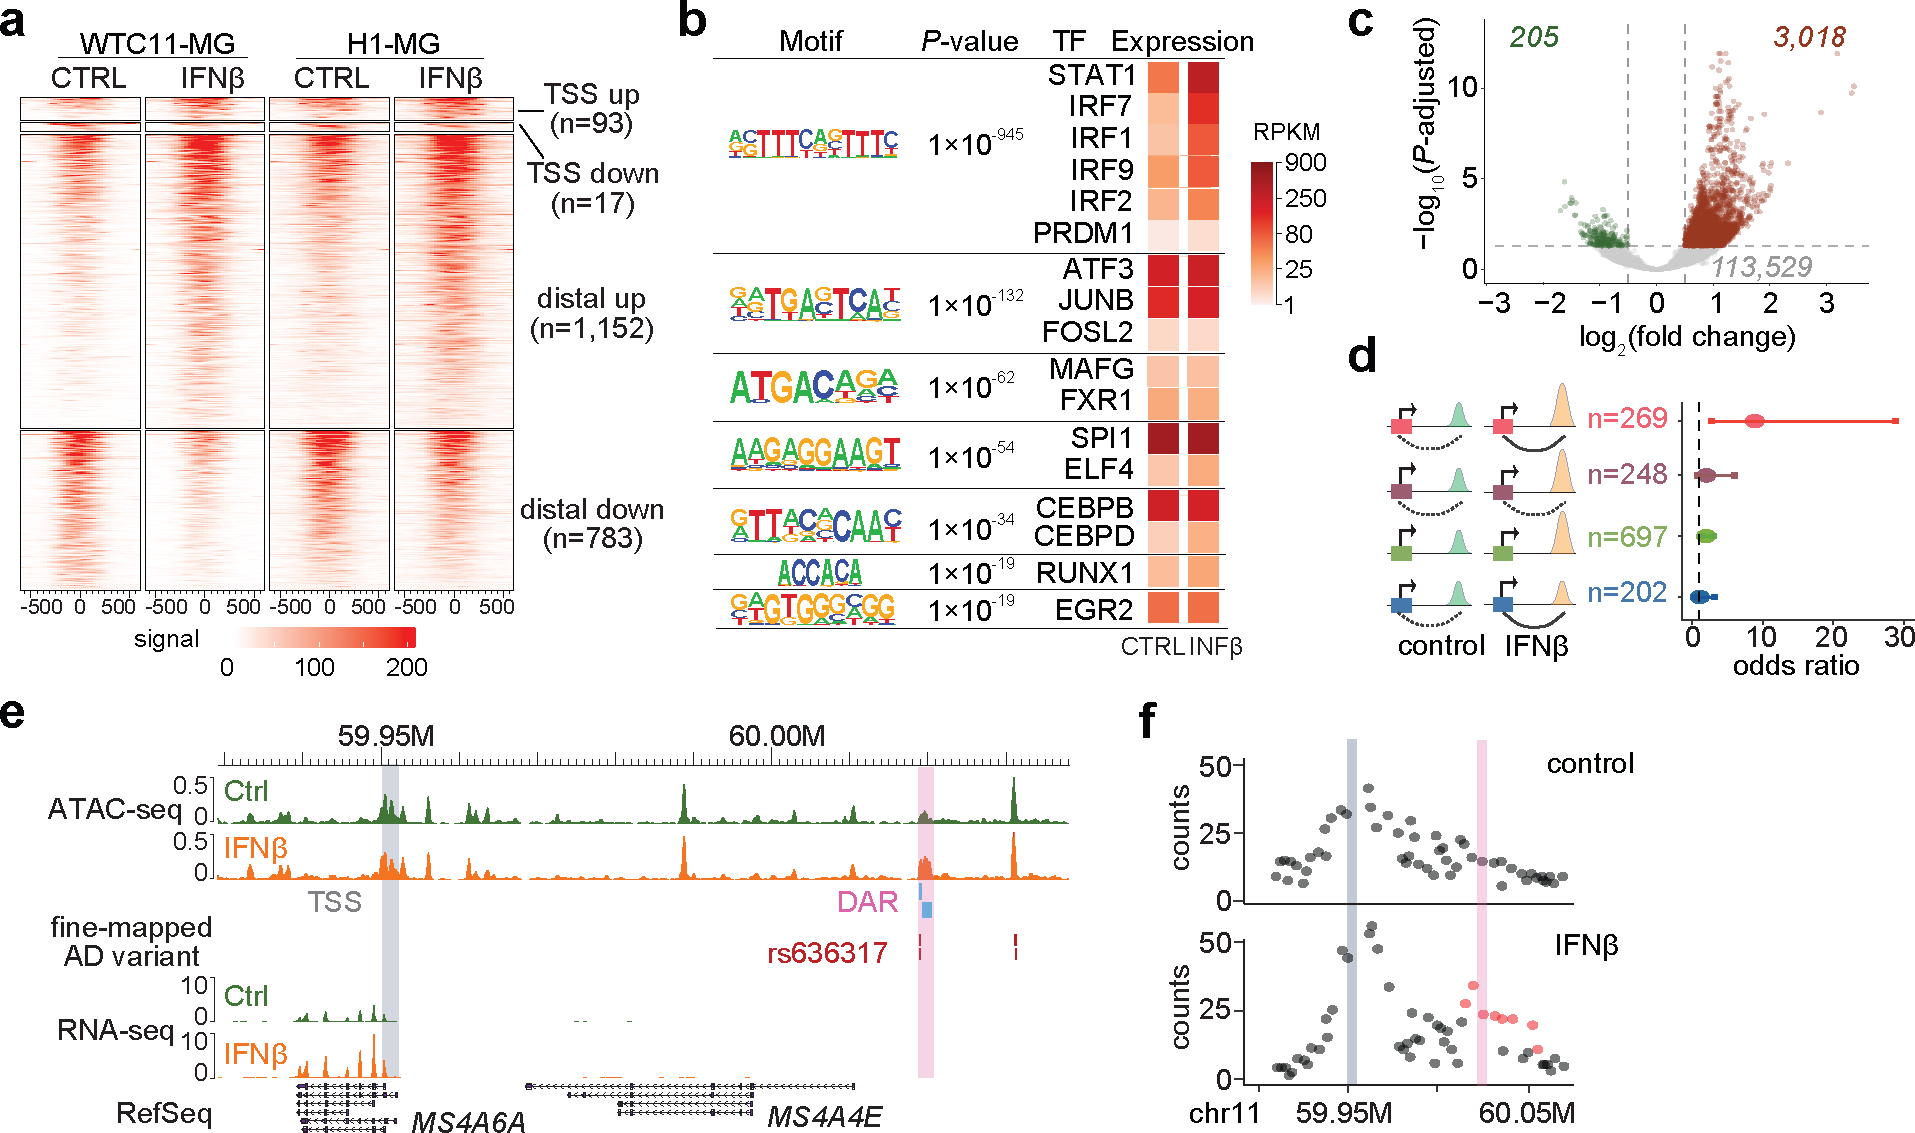
a, Heatmaps showing DARs after IFNß stimulation in WTC11- and H1-derived microglia-like cells. Heatmaps were plotted +/−500bp to the center of DARs. b, Motif enrichment analysis for distal DARs in response to IFNß treatment. We analyzed 1,152 distal regions with increased accessibility. P values from HOMER and corresponding TF expression levels are shown. c, Volcano plot showing differential chromatin contacting regions (DCRs) between control and IFNß stimulated microglia by Chicdiff. Dash lines indicate adjusted P value cutoff 0.05 and log2(fold change) cutoff 0.5. d, Forest plot showing odds ratio (center dot) of estimated transcriptional changes for each gene group with 95% confidence interval. Red (n = 269): genes with their promoters associated with distal DAR and DCR changes. Purple (n = 248): genes with their promoters associated with distal DAR but no chromatin interaction changes. Green (n = 697): genes with DARs but DARs don’t interact with gene promoters. Blue (n = 202): genes with promoters associated with DCRs only. e, Genome browser snapshot of the MS4A6A locus. MS4A6A expression is upregulated after IFNß stimulation. A distal cCRE (pink), harboring fine-mapped AD variant rs636317 and interacting with the MS4A6A promoter region (gray), exhibits increased chromatin accessibility after IFNß stimulation. f, Quantification of increased chromatin interactivity between the MS4A6A promoter (gray) and the cCRE (pink) after IFNß stimulation.
To explore the roles of chromatin interactions in regulating transcriptional changes in response to IFNß stimulation, we performed genome-wide promoter capture Hi-C (pcHi-C) in control and IFNß stimulated WTC11 iPSC-derived microglia-like cells (Supplementary Table 1c and 4). hPSC-derived microglia are more similar to primary microglia at the chromatin interaction level compared to neurons and oligodendrocytes1 (Extended data Fig. 4e). In general, the majority of differentially expressed genes (n=2,993) are not associated with chromatin accessibility changes or significant chromatin interaction changes (Extended data Fig. 4f, Supplementary Table 5). In fact, many of these genes exhibit stable chromatin looping status before and after IFNß stimulation, with only 3,018 and 205 regions showing either gained or lost interactions with gene promoters (Fig. 2c). Such observation is consistent with the notion that chromatin states and chromatin loops remain stable and cells are primed for rapid transcriptional regulation in response to signal transduction, including heat shock26, TNF-α signaling27, TGF-β signaling28, diverse stimulations in human immune cells29 and development30. Of all 3,811 differentially expressed genes (DEGs) upon IFNβ stimulation, 3,556 already exhibited positive chromatin accessibility at promoters in unstimulated conditions, suggesting that these genes are in a poised state for gene activation. For genes with either differential distal chromatin accessibility region (DAR) or differential chromatin contacting region (DCR) after IFNß stimulation, we divided them into 4 distinct groups: genes with both DAR and DCR, genes with only DAR, genes with DAR but their promoters are not participating in any interactions, and genes with only DCR (Fig. 2d). Notably, genes with concurrent changes in distal chromatin accessibility and interaction have significantly higher probability of transcriptional changes (Fig. 2d and Extended Data Fig. 4g). These results suggest that for genes that are not primed for activation, changes in chromatin states can still play an essential role in gene regulation. In particular, MS4A6A promoter gained chromatin interaction with a distal open chromatin region, which exhibited increased chromatin accessibility upon stimulation (Fig. 2e–f). Concordant with changes in 1D and 3D chromatin landscape, MS4A6A expression is upregulated by 3.1-fold after IFNß stimulation (Fig. 2e, Extended Data Fig. 4h). Interestingly, the distal open chromatin region contains two prioritized AD risk variants, rs636317 and rs636341 (fine-mapping and variant prioritization results described below). Since MS4A6A plays an essential role in immune activation and cell survival and MS4A6A expression is lower in AD patients31, our results suggest AD risk variants can contribute to AD etiology through modulating immune responsive genes.
AD fine-mapping with microglia epigenomic annotations
We first performed partitioned linkage disequilibrium score regression (LDSC) analysis32, observing enrichments of AD SNP heritability in control and stimulated microglia cCREs. Furthermore, promoter-interacting open chromatin regions exhibit significantly higher enrichment than ATAC-seq annotation alone (Fig. 3a), reinforcing the importance of chromatin interaction data for fine-mapping.
Figure 3. Fine-mapping of AD risk loci with microglia 3D epigenome annotation.
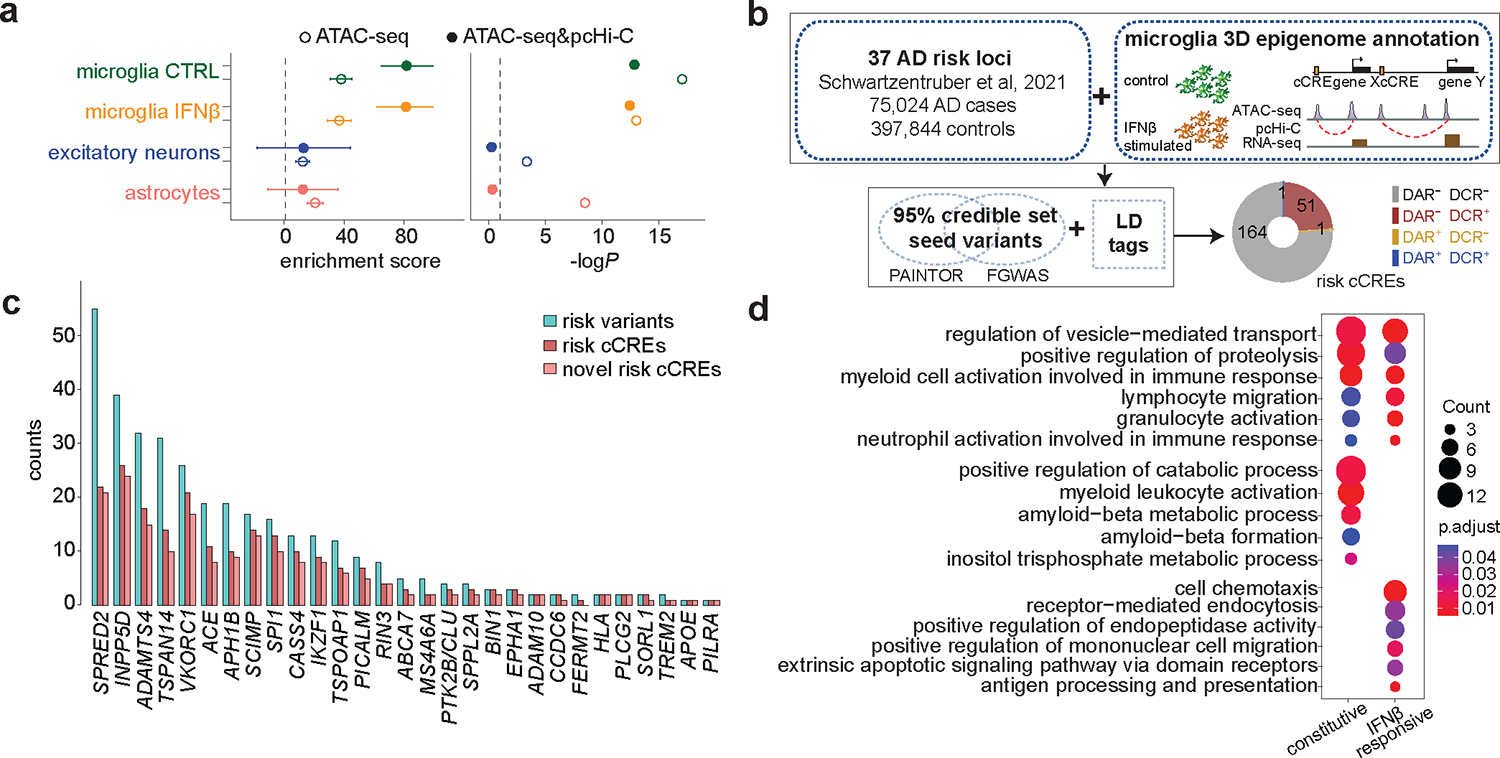
a, LDSC analysis using annotations of ATAC-seq peaks (open circle) or ATAC-seq peaks interacting with promoters (solid circle) in hPSC-derived microglia-like cells, with and without IFNß stimulation, excitatory neurons, and astrocytes. Error bars represent the s.d. b, Workflow of fine-mapping and prioritization of AD causal variants. c, Bar plot showing the number of prioritized risk variants, total and novel risk cCREs at each locus. d, Pathway enrichment analysis for pcHi-C-annotated putative target genes of prioritized AD variants within constitutive (n = 146) and IFNβ-responsive cCREs (n = 68). The counts of enriched genes and adjusted P values are reported.
A recent meta-analysis9 identified a total of 37 AD risk loci, including a staggering number of variants computationally prioritized based on colocalization with eQTLs and annotation-based fine-mapping. Although the authors integrated published epigenome annotations, they did not specify the cell types where prioritized variants could function. To address the cell type-specificity issue in fine-mapping, we performed analysis at these 37 AD loci with two widely-used methods PAINTOR33 and FGWAS34, using open chromatin regions and chromatin loops from differentiated microglia as input annotation features (Fig. 3b).
Seeding from PAINTOR or FGWAS 95% credible set variants (Supplementary Table 6a), we first included their linkage disequilibrium (LD) tags (defined as LD R2 > 0.8 in TOP-LD (European), then retained only those overlapping microglia ATAC-seq peaks that interact with promoters, leading to a total of 349 unique variants (Supplementary Table 6b–c). 87 within IFNβ-responsive CREs (either in DARs or DCRs), and 262 in cCREs shared between the two cell states. Among these variants, 308 were not prioritized in Schwartzentruber et al9, revealing 181 not previously reported cCREs (Fig. 3c) and implying 158 expressed (RPKM > 5) genes through microglia chromatin loops, with 68 in IFNβ-responsive cCREs and 146 in constitutive cCREs. Biological processes including regulation of vesicle-mediated transport, positive regulation of proteolysis and myeloid cell activation involved in immune response are shared in both gene lists, while positive regulation of catabolic process and amyloid-beta metabolic process are significantly enriched for genes connected within constitutive cCREs, and cell chemotaxis, receptor mediated endocytosis, and antigen processing and presentation are specifically enriched for genes interacting with IFNβ-responsive cCREs. (Fig. 3d, and Supplementary Table 3b–c). Similar fine-mapping using ex vivo microglia annotations (PLAC-seq loops2 and open chromatin regions12) showed prioritized 23 GWAS loci, among which 20 (~87%) loci are shared with loci prioritized with our in vitro annotation (Supplementary Table 6d). We additionally extracted genes with non-zero read counts in > 10% of microglia single cells (23 genes are left) and then tested whether these genes are differentially expressed in microglia between 16 AD cases and 13 controls, leveraging single nucleus RNA-seq (snRNA-seq) from the ROS/MAP study35, identifying 2 differentially expressed genes, including INPP5D and RAB1A with FDR < 5%, with both genes down-regulated among AD cases (Supplementary Table 6e). Due to a small sample size (N = 29 total) and low number of microglia cells per sample (~49 per sample), the statistical power is low. Therefore, significance implies large effect size while insignificance largely reflects insufficient data. Among all cCREs harboring prioritized AD variants, we also identified 53 that overlap with ATAC-seq peaks with differential accessibility or chromatin interaction strength after IFNß stimulation, with the MS4A6A locus exhibiting both as shown in Supplementary Table 6f and Fig. 2e.
AD variants affect multiple target genes in microglia
We validated prioritized AD risk loci in microglia using a combination of CRISPRi screening and targeted scRNA-seq, HyPR-seq36 (Fig. 4a). Since HyPR-seq focuses on genes of interest, it increases the sensitivity for RNA transcripts detection, providing enhanced statistical power to detect subtle changes after perturbing cCREs compared to other whole-transcriptome scRNA-seq methods. We functionally characterize putative cCREs at 5 AD risk loci, including 4 fine-mapped loci (PICALM, BIN1, INPP5D, and SLC24A4/RIN3), related to AD pathogenesis either through lipid metabolism, endocytic pathway, or immune response, and have been considered as risk genes due to their proximity to AD GWAS variants. We also included the TREM2 locus as its strong implication in AD. We designed 16 guide RNAs (gRNAs) to target 8 cCREs covering a total of 13 prioritized AD variants, 6 gRNAs for 4 genes’ TSS, including BIN1, INPP5D, RIN3 and TREM2, and 6 non-human targeting control gRNAs, with each gRNA having a unique expressing barcode (Supplementary Table 7a). Specifically, we knock-in a CAG-dCas9-KRAB cassette at the CLYBL safe harbor locus in WTC11 iPSCs. Microglia differentiated from the dCas9-KRAB expressing iPSC line were used for gRNA lentiviral library infection at a low multiplicity of infection (MOI) of 0.5. To detect gene expression changes, we designed DNA probes against the exons of the 18 genes (+/−1 Mbp of tested cCREs with an RPKM value > 5) (Supplementary Table 7b). We also designed unique DNA probes for each gRNA expression barcode. The probes were hybridized to the cells, and the hybridized probes were amplified and sequenced in single cells and used to quantify gene and gRNA expression levels. We compared the transcription level of AD risk genes between experimental and control gRNA-treated cells to examine regulatory function of tested cCRE regions (Fig. 4a–b). In total, 5 of 8 tested cCREs have significant effects on nearby gene expression with CRISPRi perturbation (Supplementary Table 7c–d), including 2 cCREs at the TREM2 locus, 1 cCRE at the BIN1 locus, 1 cCRE at the RIN3 locus, and 1 cCRE at the INPP5D locus (Fig. 4c and Extended Data Fig. 5). Furthermore, similar levels of gene expression inhibition were also observed when perturbing these 5 CREs after IFNβ stimulation (Extended Data Fig. 6a–b).
Figure 4. Characterize fine-mapped AD risk loci with pooled CRISPRi and targeted scRNA-seq in hPSC-derived microglia-like cells.
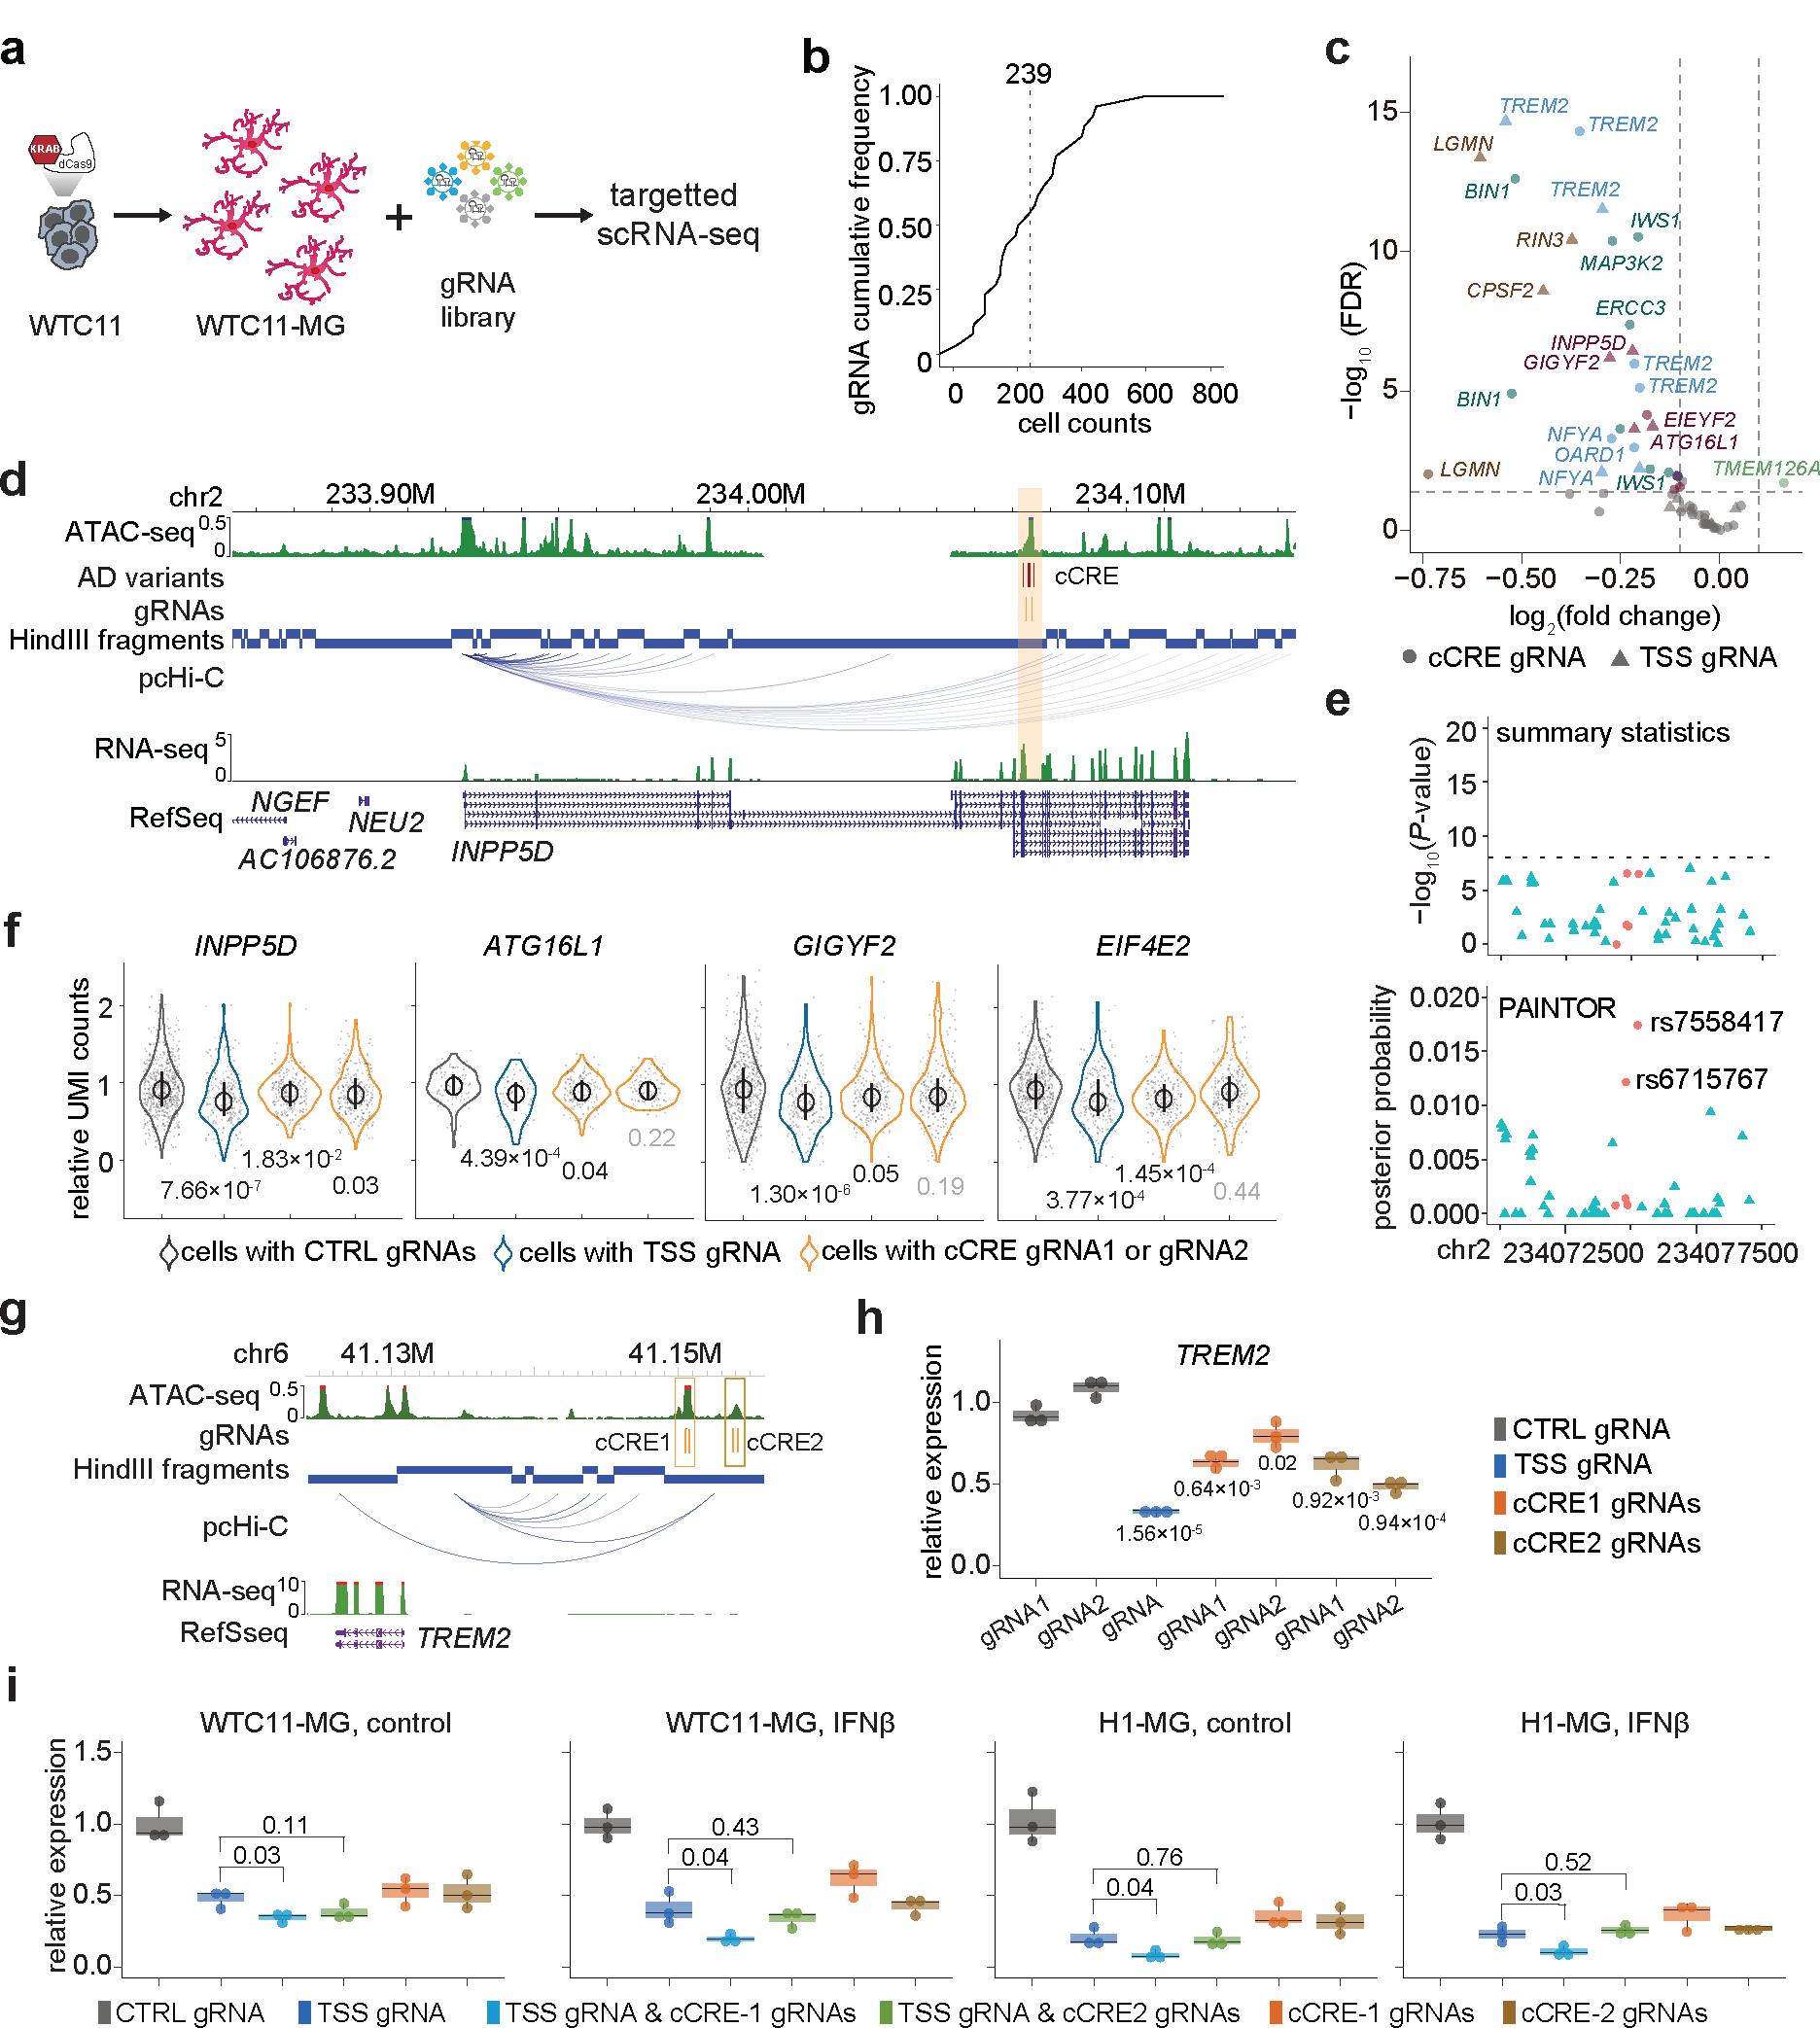
a, Overview of CRISPRi perturbation and single cell gene expression analysis of fine-mapped AD risk loci in iPSC-derived microglia. dCas9-KRAB-WTC11 were differentiated into microglia and transfected with lentivirus library to perturb fine-mapped AD risk loci. CRISPRi effect were evaluated by HyPR-seq after 1 week. b, Cumulative frequency distribution (CFD) of the number of cells with each gRNA used in analysis. c, Volcano plot of the gRNA-to-gene pairs tested in cis. 14 genes were significantly affected by AD risk loci perturbation (FDR < 0.05, log2(fold change) < −0.1) for 10 AD risk variants in 5 cCREs. Genes from the same AD risk locus are labeled with the same color. Triangles mark transcriptional changes of genes in cells with TSS gRNA-gene pairs, and circles mark changes with distal cCRE gRNA-gene pairs. d, A risk cCRE (orange) interacting with the INPP5D promoter. e, The risk cCRE overlaps five prioritized AD variants (red dots) which were not significant (−log10(P value) < 8) in AD summary statistics. f, Quantitative effects of AD risk cCRE on the expression of INPP5D in cis and three other neighboring genes, including ATG16L1, GIGYF2, and EIF4E2. P values calculated using two-sided two-sample t-test and adjusted by Benjamini-Hochberg FDR multiple testing correction. The median, upper and lower quantiles are indicated by circle and bar. Each dot represents one single cell. N are indicated in Supplementary Table 7d. g, Genome browser snapshot of the TREM2 locus. h, CRIPSRi perturbation targeting TREM2 cCREs followed by RT-qPCR analysis in WTC11-derived microglia-like cells. i, Quantification of TREM2 expression in WTC11- and H1-derived microglia-like cells infected with gRNAs for non-human targeting controls (black), TREM2 TSS (dark blue), TSS and cCRE1 (light blue), TSS and cCRE2 (green), cCRE1 (orange), cCRE2 (brown) under control and IFNß stimulated conditions. P values calculated using two-sided two-sample t-test for (h) and (i). Three independent replicates per condition and two sgRNAs per replicate were used for each experiment. Boxplots indicate the median and interquartile range. Whiskers mark the 5th and 95th percentiles.
Our results reveal that AD risk cCREs can impact multiple genes simultaneously, including cCREs at TREM2, BIN1, RIN3, and INPP5D loci (Fig. 4d and Extended Data Fig. 5). For example, CRISPRi perturbations of a cCRE region at the INPP5D locus with 5 prioritized AD variants by PAINTOR (Fig. 4e and Supplementary Table 6b) led to significant down regulation of INPP5D together with neighboring genes including ATG16L1, GIGYF2, and EIF4E2 (Fig. 4f, Extended Data Fig. 6c–d). INPP5D, also known as SHIP1, is implicated in autoimmune disease and cancer37,38 and ATG16L1 is required for the autophagy process in inflammatory response39. Taken together, our results suggest that a single AD risk locus could contribute to AD pathogenesis in multiple biological processes by simultaneously regulating multiple genes.
Synergistic effects of TREM2 enhsancer and promoter
Functional validation of two promoter interacting cCREs (region 1 and region 2) upstream of TREM2 (Fig. 4g) revealed that both cCREs have a direct effect on TREM2 expression (Fig 4h). Interestingly, cells infected with both TSS and region 1 gRNAs (n = 93) exhibit a significant down-regulation of TREM2. In addition, such transcriptional down-regulation is more pronounced compared to cells only with TSS perturbation (Extended Data Fig. 5a). The synergistic effect of TSS and regions 1 on TREM2 expression are confirmed in both H1- and WTC11-derived microglia-like cells either with or without IFNß stimulation (Fig 4i), Simultaneous perturbation of TREM2 TSS and region-1, while down-regulating TREM2 expression, affected neither microglia phagocytosis nor proliferation in both resting and stimulated conditions (Extended Data Fig. 7). Although cells receiving two distinct gRNAs are rare in our experiment, such analysis stresses the importance of test cCREs in combination to fully reveal their functionalities.
AD risk SNPs show allelic imbalance in gene expression
To assess the functional impact of additional prioritized AD risk variants, we leveraged the haplotype-resolved WTC113 and H140 genomes to identify AD prioritized variants that are heterozygous in either genome, where we can assess the allelic effect on nearby gene transcription. Luckily, we identified 25 loci with 118 prioritized variants heterozygous in either the H1 or WTC11 genome. 114 out of the 118 WTC11 or H1 heterozygotes have a reasonable number of allelic reads and have some neighborhood genes expressed (RPKM > 5) in microglia-like cells for allelic expression imbalance (AEI) testing. Among the 114 variants, we found 90 (78.9%) variants showing nominal (raw P value < 0.05) AEI with at least one gene in the +/−1Mb neighborhood (Supplementary Table 6g). Using an FDR 5%, 51 remained significant. Following the same procedure as for the 114 variants we performed genome-wide allelic expression analysis, where we in total tested AEI for 1,204,907 and 1,721,957 variants in H1 and WTC11 respectively. 598,167 (~49.6%) and 941,551 (54.7%) variants show AEI evidence (raw P value < 0.05), significantly lower (Fisher test, P = 1.29×10⁻⁷) than the 78.9% for the 114 prioritized variants. Many heterozygote-gene pairs cannot be tested because of no or limited allelic reads, due to a combination of few exonic heterozygotes and short exon lengths. In addition, AEI results in WTC11- and H1-derived microglia-like cells are not comparable due to different haplotype backgrounds.
For example, variants rs7922621 and rs7910643 are located at the same ATAC-seq peak. In H1-derived microglia, the P1 risk haplotype exhibits reduced chromatin accessibility than the P2 non-risk haplotype (Fig. 5a–c), suggesting that AD variants can potentially affect target gene expression via altered open chromatin status. Indeed, TSPAN14 expression is consistently lower with alleles across prioritized AD variants from the P1 haplotype, suggesting cis-regulation of these variants on TSPAN14 (Fig. 5d). We further performed prime editing41 to convert rs7922621 and rs7910643 risk alleles individually to the non-risk alleles (A/C to C/C for rs7922621and A/G to G/G for rs7910643) in H1 (Fig. 5e). Allelic expression imbalance can be partially restored in microglia differentiated from clones with knock-in (KI) homozygous non-risk allele for rs7922621 but not for rs7910643 (Fig. 5f). In addition, the total TSPAN14 expression level is increased in rs7922621 edited microglia but not in rs7910643 edited microglia (Extended data Fig. 8a). Similarly, after prime editing of rs7922621 in WTC11 (A/A to A/C), the edited non-risk allele also exhibited elevated expression of TSPAN14 from the non-risk allele (C) compared to risk allele in microglia (A) (Extended data Fig. 8b–c). Combined, rs7922621 but not rs7910643 is the causal variant that leads to TSPAN14 down-regulation. Our analysis highlights the importance of characterizing variants at the base-pair resolution.
Figure 5. Linking prioritized AD variants to phenotypes by allelic analyses and cellular functional assays.
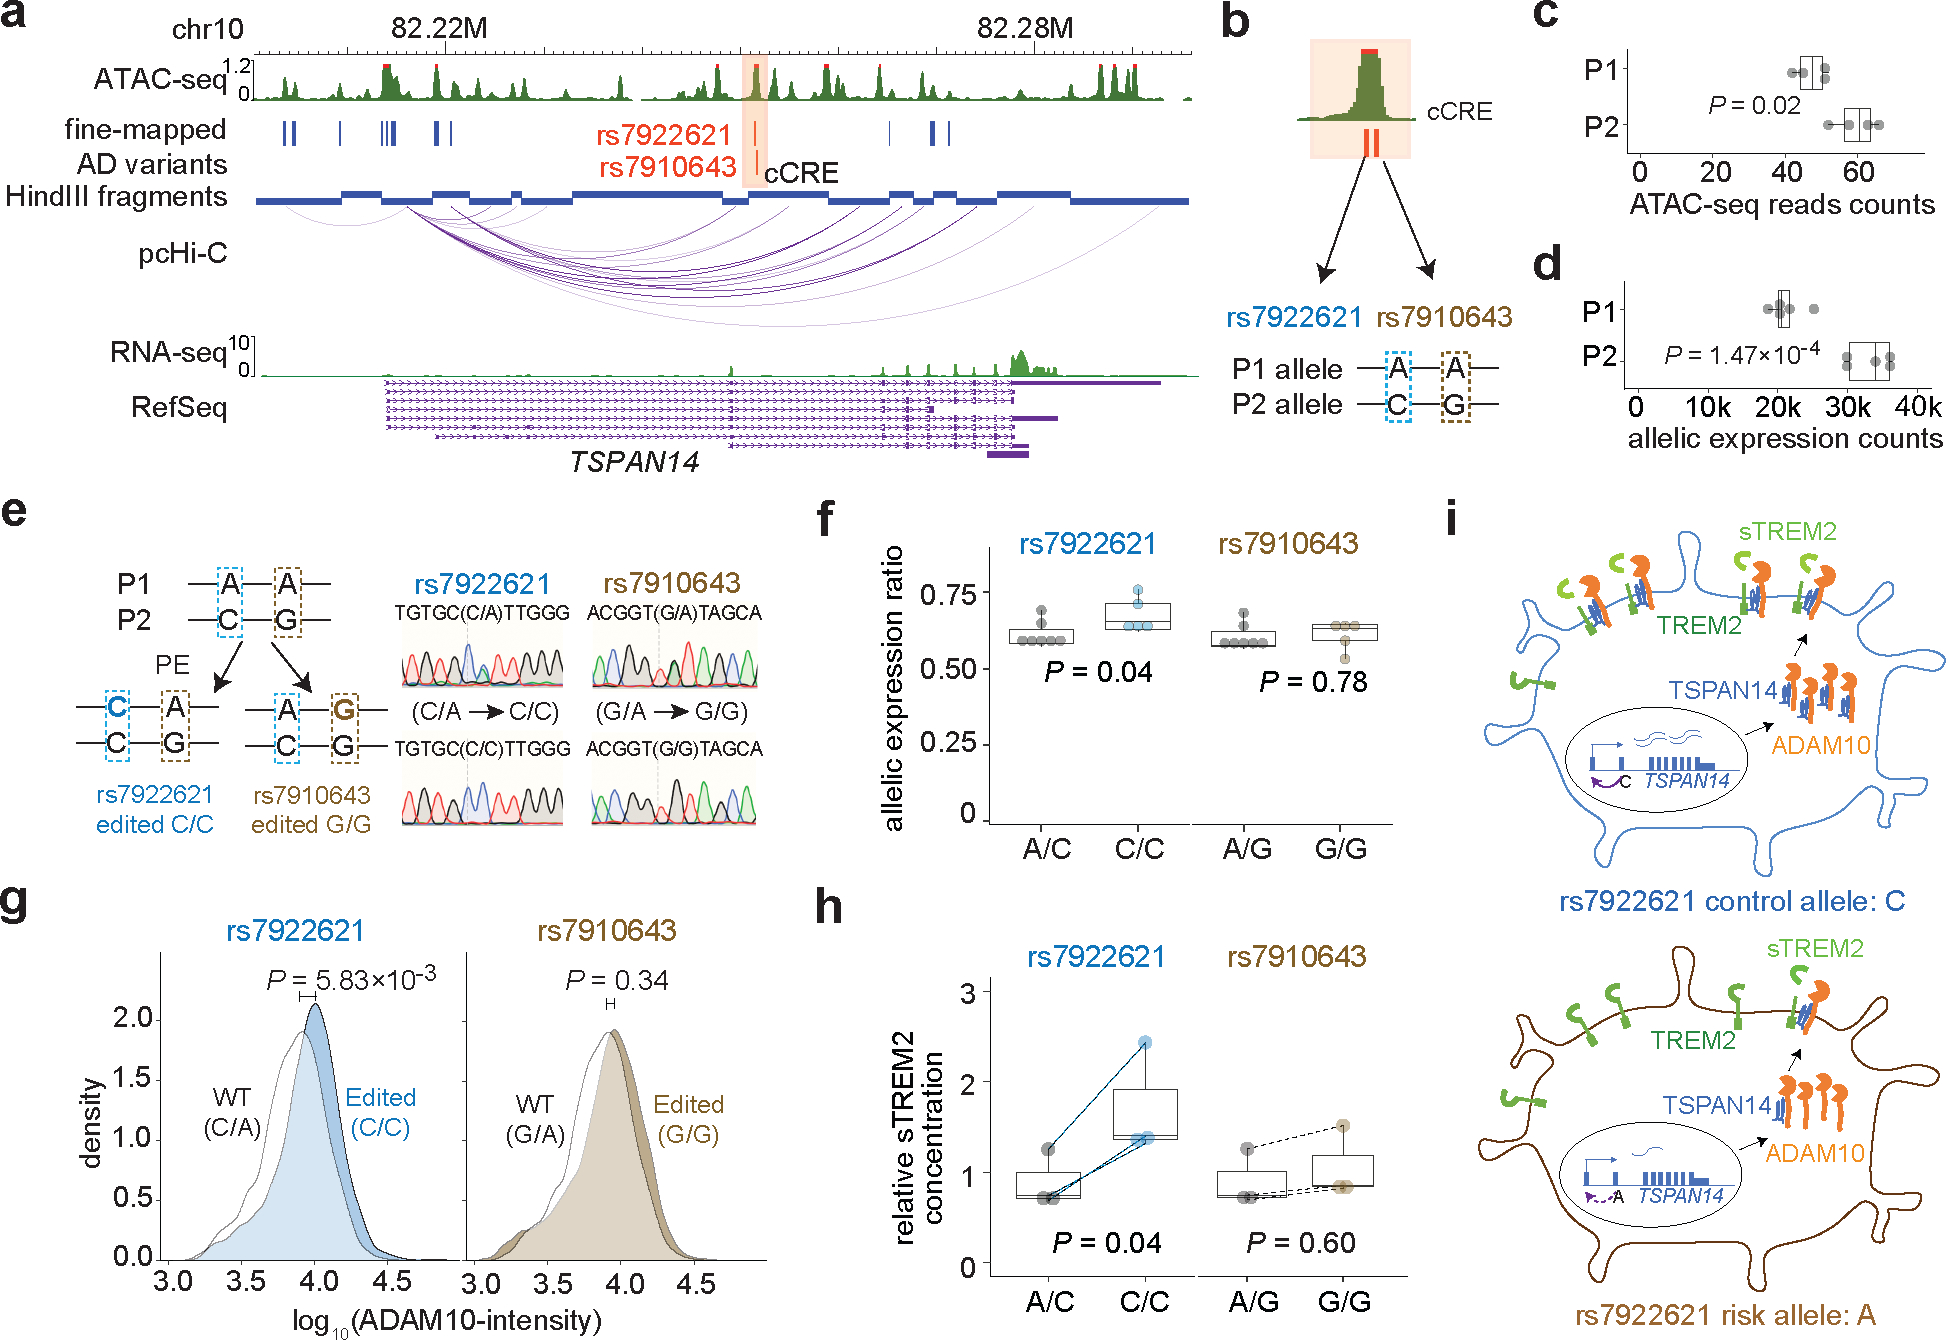
a, Two prioritized AD variants located in a cCRE (highlighted in orange) physically interacting with TSPAN14 promoter. b, hESC H1 genome is heterozygous for the two AD variants. The P1 allele has the risk alleles: rs7922621 (A) and rs7910643 (A), while the P2 allele has the non-risk alleles: rs7922621 (C) and rs7910643 (G). c, Allelic analysis of ATAC-seq data in H1 derived microglia reveals decreased chromatin accessibility of the P1 allele compared to the P2 allele (two-sided binomial test, n = 4). d, Allelic analysis using haplotype-resolved SNPs in the TSPAN14 gene body shows reduced TSPAN14 expression from the P1 allele compared to the P2 allele in microglia (two-sided binomial test, n = 5). e, Illustration of the prime editing strategy to convert rs7922621 (A) and rs7910643 (A) on the P1 allele to rs7922621 (C) and rs7910643 (G), respectively. Representative results from sanger sequencing display wildtype clones and KI clones. f, Allelic imbalance of TSPAN14 gene expression in the wild type clones (A/C) is partially reduced by prime-editing of rs7922621 (A/C to C/C) but not rs7910643. P values calculated using two-sided two-sample t-test (n = 5). g, Microglia with rs7922621 (C/C) genotype have elevated cell surface ADAM10 than wildtype microglia by immunostaining and FACS analysis. P values calculated using one-sided (edited > WT) two-sample Wilcoxon test (n = 5). h, rs7922621 (C/C) prime-edited microglia, but not rs7910643 (G/G) edited microglia, shed significantly more sTREM2 than wildtype microglia. P values calculated using two-sided paired (dash line) t-test between wildtype and prime-edited microglia from the same differentiation batch (n = 3). Boxplot indicates the median and interquartile range and whiskers mark the 5th and 95th percentiles for (c), (d), (f), (h). I, Proposed model of linking AD risk variant rs7922621 to function. rs7922621 risk allele A disrupts cis-regulatory function and down-regulate TSPAN14 expression, which leads to impaired ADAM10 trafficking and maturation to cell surface. The reduced ADAM10 level at the cell surface reduces TREM2 cleavage and sTREM2 shedding.
rs7922621 affects physiological functions in microglia
TSPAN14 interacts with ADAM10 and promotes ADAM10 maturation and trafficking to the cell surface42. ADAM10 plays multifaceted roles relevant to AD, including shedding the ectodomain of TREM2 to convert it to soluble TREM2 (sTREM2)43. Since higher sTREM2 levels are associated with protection against AD pathogenesis44–47. Microglia-like cells differentiated from H1 with rs7922621 risk allele (A/C) indeed have significantly lower levels of cell surface ADAM10 compared to the isogenic microglia that are homozygous of the non-risk allele (C/C) (Fig. 5g and Extended Data Fig. 8d–e). Meanwhile, microglia-like cells from prime edited clones at rs7910643 didn’t show differences of membrane ADAM10 levels compared to the H1 wildtype derived microglia (Fig. 5g and Extended Data Fig. 8e). Furthermore, sTREM concentration is also reduced in conditioned medium of microglia-like cells carrying the rs7922621 risk allele (A/C) compared to the microglia with the non-risk alleles (C/C), while microglia had no difference on shedding sTREM concentration between clones with rs7910643 A/G and G/G (Fig. 5h). Several genes in the TSPANC8 subgroup are known to regulate ADAM10 maturation48 with TSPAN15, TSPAN17, and TSPAN33 are expressed in microglia (RPKM > 5). However, we didn’t observe expression changes for other TSPAN genes between control and edited microglia (Extended Data Fig. 8f), excluding the possibility that changes of cell surface ADAM10 could be affected by other TSPAN genes in prime edited microglia and establishing a direct link between TSPAN14 expression and cell surface ADAM10 levels. Meanwhile, rs7922621 prime-edited clones from H1 and WTC11-derived microglia-like cells exhibit no differences in phagocytosis and proliferation between isogenic microglia pairs, with or without IFNβ (Extended Data Fig. 9). Thus, our results support the model that rs7922621 affects the regulatory function of its cCRE as an TSPAN14 enhancer, which in turn affects ADAM10 maturation. The reduced cell surface ADAM10 level further contributes to the lower shedding sTREM level in microglia that ultimately contributes to increased risk for AD (Fig. 5i).
Discussion
Our study started from fine-mapping analysis leveraging 3D epigenomic annotation information in microglia. Although fine-mapping (either annotation-free or annotation-based), as well as variant and gene prioritization have been carefully conducted in multiple published studies9,10,49,50, our fine-mapping is unique in at least the following three aspects, leading to enhanced power to identify microglia-specific variants and regulatory elements. First, we focused squarely on epigenomic annotations from microglia. In contrast, published studies largely relied on general annotations that are mostly not specific to microglia and not considering cell-type-specific chromatin interactions9,10. Our LDSC results, showing substantially more pronounced enrichment in open chromatins also involved in chromatin loops (enrichment score > 80 vs ~ 40 in open chromatins alone), strongly suggest the value of using cell-type-specific chromatin loop information in fine-mapping. Second, our epigenomic profiles before and after IFNß stimulation allows for the identification of AD risk loci that are subject to immune response. For example, the MS4A6A locus harboring two AD fine-mapped variants exhibited increased chromatin accessibility of a distal open chromatin region, which gained chromatin interaction with MS4A6A promoter, and elevated MS4A6A expression upon IFNß stimulation. Lastly, we included all LD tags for fine-mapped variants based on LD information derived from large-sample deep-coverage whole genome sequencing data in the NHLBI Trans-Omics for Precision Medicine (TOPMed) project, which was not available for previous studies. Our analysis revealed hundreds of previously unreported variants and cCREs in microglia that are relevant to AD, suggesting that fine-mapping with microglia specific annotations has the potential to reveal additional candidate causal variants, regulatory elements and their effector genes. Future studies with larger-scale GWAS are warranted to gain additional insights. For example, we conducted fine-mapping on results from the latest GWAS study10 and summarized results in Supplementary Table 6h, prioritizing >1,000 cCREs for future functional characterizations.
We used hPSC-derived microglia-like cells in this work and acknowledge that these cells mimic but are not primary microglia cells. We further performed LDSC analysis to assess AD heritability enrichment using hPSC in vitro differentiation vs ex vivo microglia annotations. Results summarized in Supplementary Table 9 show that despite some subtle differences, the levels of enrichment are comparable, justifying genetic manipulation of hPSC-derived microglia like cells in AD functional studies.
Usually only one gene is assigned as a risk gene for each locus, leaving their pathological relevance to AD largely uncharacterized9,10. We demonstrate that cCREs harboring AD fine-mapped variants can simultaneously regulate multiple genes and suggest that a single risk locus can contribute to AD through multiple molecular and cellular processes. Studies of combinatorial effect of cCREs are limited to a few well studied enhancers, including the enhancers at the β-globin locus in K562. In our study, we revealed interesting combinatorial effects of cCREs on TREM2 gene expression, highlighting that future studies of combinatorial effects of cCREs should be carried out to offer a more nuanced view of gene regulation of AD risk genes.
Our results at the TSPAN14 locus showcase the value of prime editing experiments where only one of the two SNPs residing in the same cCRE manifested significant impact on TSPAN14 expression and downstream cellular phenotypes. Such precision is impossible to achieve with epigenome editing experiments and for this specific example, microglia eQTL results also failed to distinguish the function between the two SNPs that are in perfect LD.
Finally, our study advances the functional characterization of AD variants and cCREs beyond transcriptional consequences. Specifically, we examined the impact of rs7922621, the SNP regulating TSPAN14 expression, on multiple AD relevant physiological phenotypes including the abundance of cell surface protein ADAM10 and sTREM shedding from microglia, advancing GWAS findings to functional mechanisms and pathophysiological insights.
Methods
Ethics statement
Human peripheral blood mononuclear cells (PBMC) from a healthy donor are used. The study is exempt from continuing UCSF IRB review and approval and from federal regulations (Exemption number E4) based 45CFR 46.101.(b)(4). The use of WTC11 iPSCs and H1 hESCs was approved by the Human Gamete, Embryo and Stem Cell Research (GESCR) Committee at UCSF.
Microglia differentiation and stimulation
Microglia were generated using an established method11. hPSCs reaching 80% confluence were cultured in mTeSR medium (StemCell Technologies) containing 80 ng/mL BMP-4 (PeproTech, 120-05ET) for 4 days. The cells were next induced with StemPro-34 SFM (ThermoFisher, 10639011) medium supplemented with 25 ng/mL bFGF (PeproTech, 100-18b), 100 ng/mL SCF (PeproTech, 300-07), 80 ng/mL VEGF (PeproTech, 100-20) for 2 days. On day 7 and day 10, the StemPro-34 SFM Medium supplemented with 50 ng/mL IL3 (PeproTech, 200-03), 50 ng/mL SCF, 50 ng/mL M-CSF (PeproTech, 300-25), 5 ng/mL TPO (PeproTech, 300-18), 50 ng/mL FLT3 (PeproTech, 300-19) were used. From day 10, floating cells were spun down and seeded back to original wells. From day 15 cells were cultured in StemPro-34 medium with 50 ng/mL M-SCF, 50 ng/mL FLT3, and 25 ng/mL GM-CSF (PeproTech, 300-03). On day 25 to 35, we seeded the floating cells in advanced RPMI-1640 medium (ThermoFisher, 12633012) with 2 mM Glutamax, 100 ng/mL IL-34 (PeproTech, 200-34) and 10 ng/mL GM-CSF. We collected floating microglia progenitors every 3 days for 4–6 weeks. 2 weeks after reseeding, mature microglia were used for experiments and treated with 100 U/mL IFNβ (R&D systems, 114151). All cells were tested to be free of mycoplasma.
APOE allele status and polygenic risk score (PRS) construction.
We checked APOE allele status for WTC11 and H1, using genotypes at rs429358 and rs7412. Both donors are non-risk e3 allele homozygotes. We used PRSice-251 (v2.3.5) and Bellenguez et al.10 GWAS results to compute PRS for the two donors, and for individuals of European (EUR) and East Asian (EAS) ancestry from the 1000 Genomes Project (1000G). WTC11 has a higher (89.3%) risk PRS within 1000G EAS. H1 has a 79.9% PRS within 1000G EUR, thus not noteworthy elevated or decreased risk. Only variants with P < 5×10⁻⁸ in Bellenguez et al. contributed to PRS calculation, not including rs1990621 (P value = 7.03×10⁻⁷) in the TMEM106B locus. WTC11 is homozygous for the minor allele at rs1990621, which renders protective effects against AD and related dementia (personal communication with Dr. Michael Ward at NINDS).
Immunofluorescence
Cells staining was conducted as previous described3. Primary antibodies against IBA-1 (Abcam ab5076, polyclonal, 1:500 dilution), TMEM119 (Abcam ab185333, polyclonal, 1:1000 dilution) and secondary antibodies including Alexa Fluor 594 donkey anti-goat IgG (Thermo Fisher Scientific A11058, 1:800 dilution), Alexa Fluor 488 donkey anti-rabbit IgG (Thermo Fisher Scientific A21206, 1:800 dilution) were used for immunostaining.
PBMC and microglia scRNA-seq analysis.
PBMC was isolated from TRIMA residuals obtained from Vitalant. To prepare monocyte derived dendritic cells (MoDCs) and macrophages (MDMs), we isolated monocytes using EasySep Human Monocyte Isolation Kit (STEMCELL, 19359). 2×10⁶ cells were seeded into 6 well plate in 4 mL complete RPMI 1640 medium (RPMI 1640, 10% FBS, 1% P/S, 1% Glutamax) containing appropriate cytokines for dendritic cells (GM-CSF: 100 ng/mL; IL-4: 100 ng/mL) and macrophage (GM-CSF: 100 ng/mL) and incubated for 5 days. On the day of IFNβ stimulation, fresh monocytes were prepared using the same procedure and resuspended in fresh complete RPMI1640 medium. We treated iPSC derived microglia, MoDCs, MDMs, and fresh monocytes with IFNβ (100U/mL) for 6 hours.
Multiplexed single-cell sequencing with cell hashing was performed as follows. Cells were first blocked with Human TruStain FcX (BioLegend, 422302) in cell staining buffer (BioLegend, 420201) for 10 minutes on ice, followed by staining with an individual TotalSeq-A anti-human Hashtag for 45 minutes on ice. 1.25 × 10⁵ cells were pooled from each group with an average viability of 85%. Single cell suspension (6.4×10⁵ cells) were loaded into 10X Chromium Controller following manufacturer’s user guide (Document CG000185 Rev B) using Chromium Single Cell 3’ Reagent Kits v3. scRNA-seq and hashtag barcode libraries were constructed following the manufacturer's user guide (Document CG000185 Rev B) and sequenced on NovaSeq 6000 to get a total of 2×10⁹ reads.
Sequencing data from each lane was processed separately and then aggregated using the Cell Ranger software (v3.0.2), to generate matrices of UMI counts for RNA and hashtags across all cells. We leveraged hashtag counts to remove doublets using Seurat52 (v4.1.1). We further removed cells with >8% mitochondrial transcripts, <200 or >4500 features, leading to 27,300 cells for analysis. Top 10 PCs were selected for clustering based on PCElbowPlot and clusters were computed at a resolution of 0.5. We assigned cell types based on feature genes in each population. FindMarkers function was used for comparing DEGs. We pooled 4,126 microglia from Morabito et al.24 with 3,038 WTC11-microglia and used Seurat FindIntegrationAnchors and Harmony53 (v0.1) for integration analysis. To compare the cell counts fold change in different conditions within each cluster, we performed the monte-carlo/permutation test (https://github.com/rpolicastro/scProportionTest).
Motif analysis
Differentially accessible regions (DARs) were categorized into TSS or distal peaks based on Gencode v19 TSS annotation using BEDTools52 (v2.29.2). Motif enrichment was done using HOMER54 (v4.11.1). The hypergeometric distribution was used for motif scoring using the entire genome as a background.
RNA-seq
1 μg of RNA was used to prepare libraries using the TruSeq Stranded mRNA Library Prep Kit (Illumina, 20020594). Paired-end 150bp (NovaSeq 6000) reads were aligned to hg19 using STAR (v2.7.2b2) with ENCODE settings, and strand-specific transcript quantification was performed using RSEM (v1.3.13) with GENCODE v19 annotation. Reads were trimmed to 100bp using fastp (v0.20.1). TMM-normalized RPKM values were calculated by edgeR55 (v3.32.1). The mean gene expression across all replicates was used for each cell type.
ATAC-seq
ATAC-seq was carried out using the Nextera DNA Library Prep Kit (Illumina FC-121-1030) as described56. 150bp paired-end (Novaseq 6000) reads were trimmed to 100bp, mapped to hg19 and processed using the ENCODE pipeline (v1.10.0). The raw peaks called by MACS with P-value < 0.01 were used for analysis.
Promoter capture Hi-C
Promoter capture Hi-C was carried out as described3. 150bp paired-end reads (NovaSeq 6000) were trimmed to 100bp using fastp (v.0.20.1). To assess the reproducibility between replicates, we used HPRep57 (v1.0). Significant chromatin interactions were called using CHiCAGO (v1.20.0) (score ≥5)3. To check chromatin interaction similarity across cell types, we used Bedtools "pairtopair" function, and quantified similarity using Jaccard index.
Differentially expressed genes (DEGs), differentiate accessible regions (DARs), and differential chromatin interacting regions (DCRs).
DEG analysis was performed using DESeq258 (v1.30.1) on raw count expression outputs from RSEM (v1.3.13). We kept only rows with ≥10 reads. Significant DEGs were defined by adjusted P value < 0.05 and log2(fold change) > 0.5. DCRs were identified using DiffBind59 (v3.0.15). We built consensus ATAC-seq peaks from control and IFNβ treated microglia using BEDTools merge (v2.29.2). Reads in consensus peakset were normalized and compared using EDGER. DCRs were identified using Chicdiff60 (v0.6) with contact matrices and CHiCAGO outputs. Significant DCRs were defined by adjusted P value < 0.05 and log2(fold change) > 0.5.
GO analysis and GSEA
GO analysis was performed with clusterProfiler61 (v3.18.1). Microglia specific IFNß responsive genes (n = 72) were used as input compared to a genome-wide background gene list (n = 31,438). Expressed genes that physically interact with fine-mapped AD variants (n = 158) were compared to all genes forming long-distance interactions in microglia (n = 19,329). GO terms for each category with q-value <0.05 are reported. Reference genes were collected from various studies17,18,22–25 of DAM signatures.
Canonical correlation analysis (CCA)
CCA was done using SMCCA-GS62 adapted from SMCCA implemented in the PMA R package.
Stratified LD score regression
We leveraged stratified LDSC32 (v1.0.1) to examine heritability enrichment in regions with epigenomic annotations specific to microglia with and without IFNß stimulation, iPSC-derived excitatory neurons and primary astrocytes. We jointly quantified heritability enrichment for the four cell states, for variants in each of the following two annotation strata: 1) ATAC-seq peaks; 2) non-promoter ATAC-seq peaks overlapping pcHi-C loop(s).
GWAS fine-mapping
We performed fine-mapping at 37 AD loci9 using PAINTOR33 and FGWAS34, using pcHi-C chromatin loops and ATAC-seq peaks iPSC-induced microglia.
FGWAS
We ran FGWAS (v0.3.6) after excluding variants with minor allele frequency (MAF) <= 0.5% and multi-allelic variants, using ATAC-seq and pcHi-C annotations from control microglia. We first retained regions with regional-PIP > 0.95, and within each retained region, we included top variants until the sum of variant PIPs ≥ 0.95. We refer to these variants as FINEMAP 95% credible set variants.
PAINTOR
PAINTOR (v3.0) was separately run for each of the 37 loci9 with ATAC-seq and pcHi-C annotations. Two loci (HLA and PILRA) had convergence issues and therefore had no PAINTOR results. We used LD reference from European samples in the 1000 Genome Project. We normalized PAINTOR variant-PIPs by dividing raw variant-PIPs by the sum over a locus, separately for each locus. Within each locus, we included top variants until the sum of normalized variant-PIPs ≥0.95. We refer to these variants as PAINTOR 95% credible set variants.
LD tags for credible set variants
We merged FINEMAP and PAINTOR 95% credible set variants, resulting in a total of 6,200 seeding variants. Since causal variants can be LD tags of these variants, we augmented the seeding variants with their LD tags(LD R2 > 0.8 in the European population in TOP-LD63).
Variant prioritization and further annotations.
After merging FINEMAP and PAINTOR’s 95% credible sets and adding LD tags, we further short-listed by selecting variants with the highest PIP from either FINEMAP and PAINTOR, variants with the highest PIP among those residing in cCREs not prioritized in Schwartzentruber et al, and finally variants whose eQTL and chromatin interactions suggest the same gene(s). We have recently reported64 that concordant eQTL and chromatin interaction evidence corresponds to higher probability to be functional. We further required all these genes to be expressed in microglia (RPKM > 5). These criteria reduced the number of prioritized variants down to 349. For each prioritized variant, we provided their ATAC-seq, pcHi-C, and primary microglia eQTL information from Young et al65 and Kosoy et al25.
Differential expression in microglia between AD cases and controls
We tested whether genes implicated by prioritized variants are differentially expressed between AD cases and controls in microglia using ROS/MAP snRNA-seq data containing 16 AD cases and 13 controls and a total of 1,341 microglia cells35. TWO-SIGMA66 (v1.0.2) was used to detect DEGs, adjusting for age, sex, race, and cellular detection rate. For each prioritized variant, we considered genes whose promoter contains the variant or forms chromatin loop(s) with the cCRE harboring the variant. We further restricted to genes expressed (RPKM > 5) in iPSC-derived microglia and have non-zero read counts in > 10% single cells, leading to 23 testable genes.
Using published prefrontal cortex expression profiles from 129 AD patients and 101 controls using the Rosetta/Merck Human 44k 1.1 microarray67, we normalized expression (log10 ratio (Cy5/Cy3) representing test/reference) and used limma for DEG analysis. Among the 23 genes with non-zero read counts in > 10% microglia cells, 93% (28 out of 30) probesets tested showed significant DE. For the 158 linked genes, 81% (126 out of 156) probesets tested showed significant DE. These results suggest a large overlap between linked genes and DEGs. The two DEGs identified in the snRNA-seq data, INPP5D and RAB1A, remained significant in the microarray data with consistent directions.
Knockin dCas9-KRAB in WTC11 and H1 hESC lines
A dCas9-KRAB cassette driven by CAG promoter (Modified from Addgene 89567) was integrated into the CLYBL safe harbor locus to enable robust transgene expression in WTC11 and H1 using TALENs (pZT-C13-R1 and pZT-C13-L1, Addgene 62196, 62197). Heterozygous WTC11 and H1 clones with dCas9-KRAB knock-in with normal karyotyping were used.
HyPR-seq
The HyPR-seq was performed according to the published protocol36. 4 pairs of ssDNA probes for each target gene were designed using HyPR-seq pipeline (https://github.com/EngreitzLab/hypr-seq). We sequenced ~5000 reads/cell covering 18 target genes and 28 gRNA barcode sequences. HyPR-seq pipeline was used to generate a singleton UMI count matrix and in each run ~10 k singletons were analyzed. Raw UMI counts were firstly normalized by the total counts in each cell and scaled by 1000. To assign the correct gRNA to each cell, we first obtained a credible set of positive cells for each gRNA, in which the positive gRNA count must be over 6-fold compared to the 2nd enriched gRNA. Next, we re-assigned positive gRNA identity to all cells if gRNA count was over the first quantile of the gRNA count distribution in the credible set. About 60% of the cells were successfully assigned with an individual gRNA. To pool count matrices from different batches, UMI counts for each target gene were normalized by the average UMI counts among all negative control gRNA infected cells within that batch. Finally, CRISPRi effects were detected between enhancer perturbed versus negative control cells. P values are calculated using two-sided two-sample t-test and adjusted by Benjamini-Hochberg FDR multiple testing correction. Adjusted P value (FDR) < 0.05 is used as a cutoff.
CRISPRi and expression analysis
gRNAs are designed using GuideSCAN68. In bulk validation, gRNA was inserted into CROP-seq-opti vector (Addgene 106280) and packaged into lenti-virus. In the single-cell CRSIRPi screening, gRNAs were inserted into 28 barcoded HyPR-seq vectors36 separately, evenly pooled and packaged into lenti-virus by co-transfection with pMD2.G and psPAX (Addgene, 12260 and 12259) into lentiX 293T cells (Takara Bio 632180) using PolyJet (Signagen SL100688). Virus containing medium was collected every 24 hours for 3 days, spun to remove debris and filtered with 0.45 μm filter and concentrated by Amicon Ultra-15 Centrifugal Filter Units (Millipore UFC901024). The virus titration was performed by antibiotics selection and calculated by microglia survival rate and seeding density. Microglia were treated with 500 ng/mL puromycin for 4 days after infection. In the bulk validation, we used a MOI of 3.0 and microglia from at least 3 independent differentiations. In the CRISPRi screen, we used a MOI of 0.5 using 3 batches of independently differentiated microglia.
Prime editing
Prime editing was conducted as previously described41. pegRNA and ngRNA were designed by PrimeDesign69. We used the following template to link the two spacer sequences as the forward guide oligo: CACC [ngRNA spacer] GTTTAGAGACGTTCGAAAGCGTCTCACACC [pegRNA spacer] GTTTTAGAGC (Supplementary Table 8). The annealing guide oligo, coupled with annealing oligos for pegRNA extension and evopreQ1, were ligated into a BsmBI-digested custom acceptor vector with a mCherry marker. The resulting plasmid was linearized by BsmBI-v2 (NEB R0739L) and ligated with a DNA fragment containing tracRNA(E/F) and the human U6 promoter fragment to construct the pegRNA/ngRNA co-expressing plasmid. 2 million cells were transfected with 5 μg pegRNA/ngRNA plasmid and 5 μg PE2-expressing plasmid with GFP marker using P3 Primary Cell 4D-Nucleofector X Kit (Lonza V4LP-3002). Two days after transfection, cells with GFP+/mCherry+ signals were sorted into Matrigel-coated 96-well plates by FACSAria II (BD Biosciences). Two weeks after transfection, the genotypes of clones were verified by PCR and Sanger sequencing.
Allelic expression and chromatin accessibility imbalance analysis
We performed AEI analysis for the 118 SNPs heterozygous in either H1 or WTC11. To mitigate reference allele bias, we adopted the WASP70 (v0.3.4) method. Leveraging H1 and WTC11 haplotypes, we tested allelic imbalance for each of the 76 and 46 heterozygous SNP with every expressed (RPKM > 5) gene in the neighborhood (+/−1Mb), when allelic reads in exonic regions exceeds 5. Similarly, we used WASP for ATAC-seq data in H1 derived microglia and tested allelic imbalance using the binomial test.
Allelic analysis of gene expression in prime edited microglia.
Allelic expression was evaluated in H1 and WTC11-derived microglia with desired edits. Total RNA was extracted using the RNeasy plus mini kit (Qiagen 74034) and reverse transcribed into cDNA using the iScript cDNA Synthesis kit (Bio-Rad 1708891). The region with heterozygous SNPs in exons of the target genes was amplified, purified, added with Illumina adaptors and deep sequenced. Paired reads were aligned to the target sequences using BWA (v0.7.17), and the aligned reads with either allele were counted by exact match. We used published haplotypes for H140 and WTC113. Haplotypes between rs7922621 and rs12411484 was manually determined by sanger sequencing. All primers are listed in the Supplementary Table 8.
Microglia phagocytosis assay
We incubated microglia-like cells with diluted latex beads (rabbit IgG-FITC complex) (Cayman 500290) at 37 °C for 2 hours. Trypan blue quenching solution was added for 2 min, followed by a wash with assay buffer quench surface FITC fluorescence. We then removed microglia from the dish by gentle scraping and analyzed them on a LSR II Flow Cytometer (BD bioscience).
Ki-67 flow cytometric analysis
Cells were washed with PBS and disassociated with ReLeSR™ (STEMCELL Technologies 05872) before fixed with 2% PFA for 15 min and permeabilized with 0.5% triton X-100 (SIGMA T8787) for 10 min. Cells were then incubated with 0.25 μg Ki-67-FITC Monoclonal Antibody (SolA15, Invitrogen 11-5698-80, 0.25ug/test) for 1 hour at room temperature in dark before FACS.
Surface ADAM10 flow cytometric analysis
Microglia were washed three times with PBS and scratched from the plates. Cells were first stained with anti-ADAM10 (EPR23491-74, Abcam ab252234, 1:400) using 100 μL staining buffer (PBS with 5% FBS) for 1 hour at room temperature and incubated with donkey anti-rabbit Alexa Fluor 488 (Invitrogen A-21206,1:800) in a 100 μL staining buffer for 30 minutes on ice. Cells were incubated with SYTOX Blue dead cell stain solution (Invitrogen) for 5 min at 37 °C and analyzed by LSR II Flow Cytometer (BD bioscience). ADAM10 levels were quantified initially using FlowJo software (v10.8.1). rs7922621 and rs7910623 edited cells were compared to the WT cells. We log transformed the raw ADAM10 levels, followed by quantile normalization to ensure WT levels follow the same distribution across replicates. Finally, we performed a one-sided (edited > WT) two-sample Wilcoxon test on median ADAM10 levels from the five replicates.
Assay for soluble TREM2 (sTREM2)
We used the Human TREM2 assay (biotechne/ProteinSimple SPCKB-PS-001847) on the Ella system according to manufacturer’s protocol. Conditioned medium was collected after overnight incubation with microglia and removing cell debris via low-speed spin. The samples were diluted 2 folds with a diluent buffer provided by the manufacturer. 50 μL of the diluted samples were loaded on the Simple plex human TREM2 cartridge. The raw data were collected from the Ella automatic immunoassay instrument. The levels of human soluble TREM2 in the samples were determined by Simple Plex explorer software and further normalized by the cell numbers. The experiment was repeated with microglia from 3 batches of independent differentiations.
Statistics and reproducibility
Statistical methods for all analyses performed are detailed in the corresponding Methods sections. No statistical method was used to predetermine sample size, and no data were excluded from analysis except for single cell data, which were excluded from downstream analyses if they did not pass technical quality control as described in Methods. The experiments were not randomized. The Investigators were not blinded to allocation during experiments and outcome assessment.
Extended Data
Extended Data Fig. 1. Characterization of the hPSC-derived microglia-like cells.
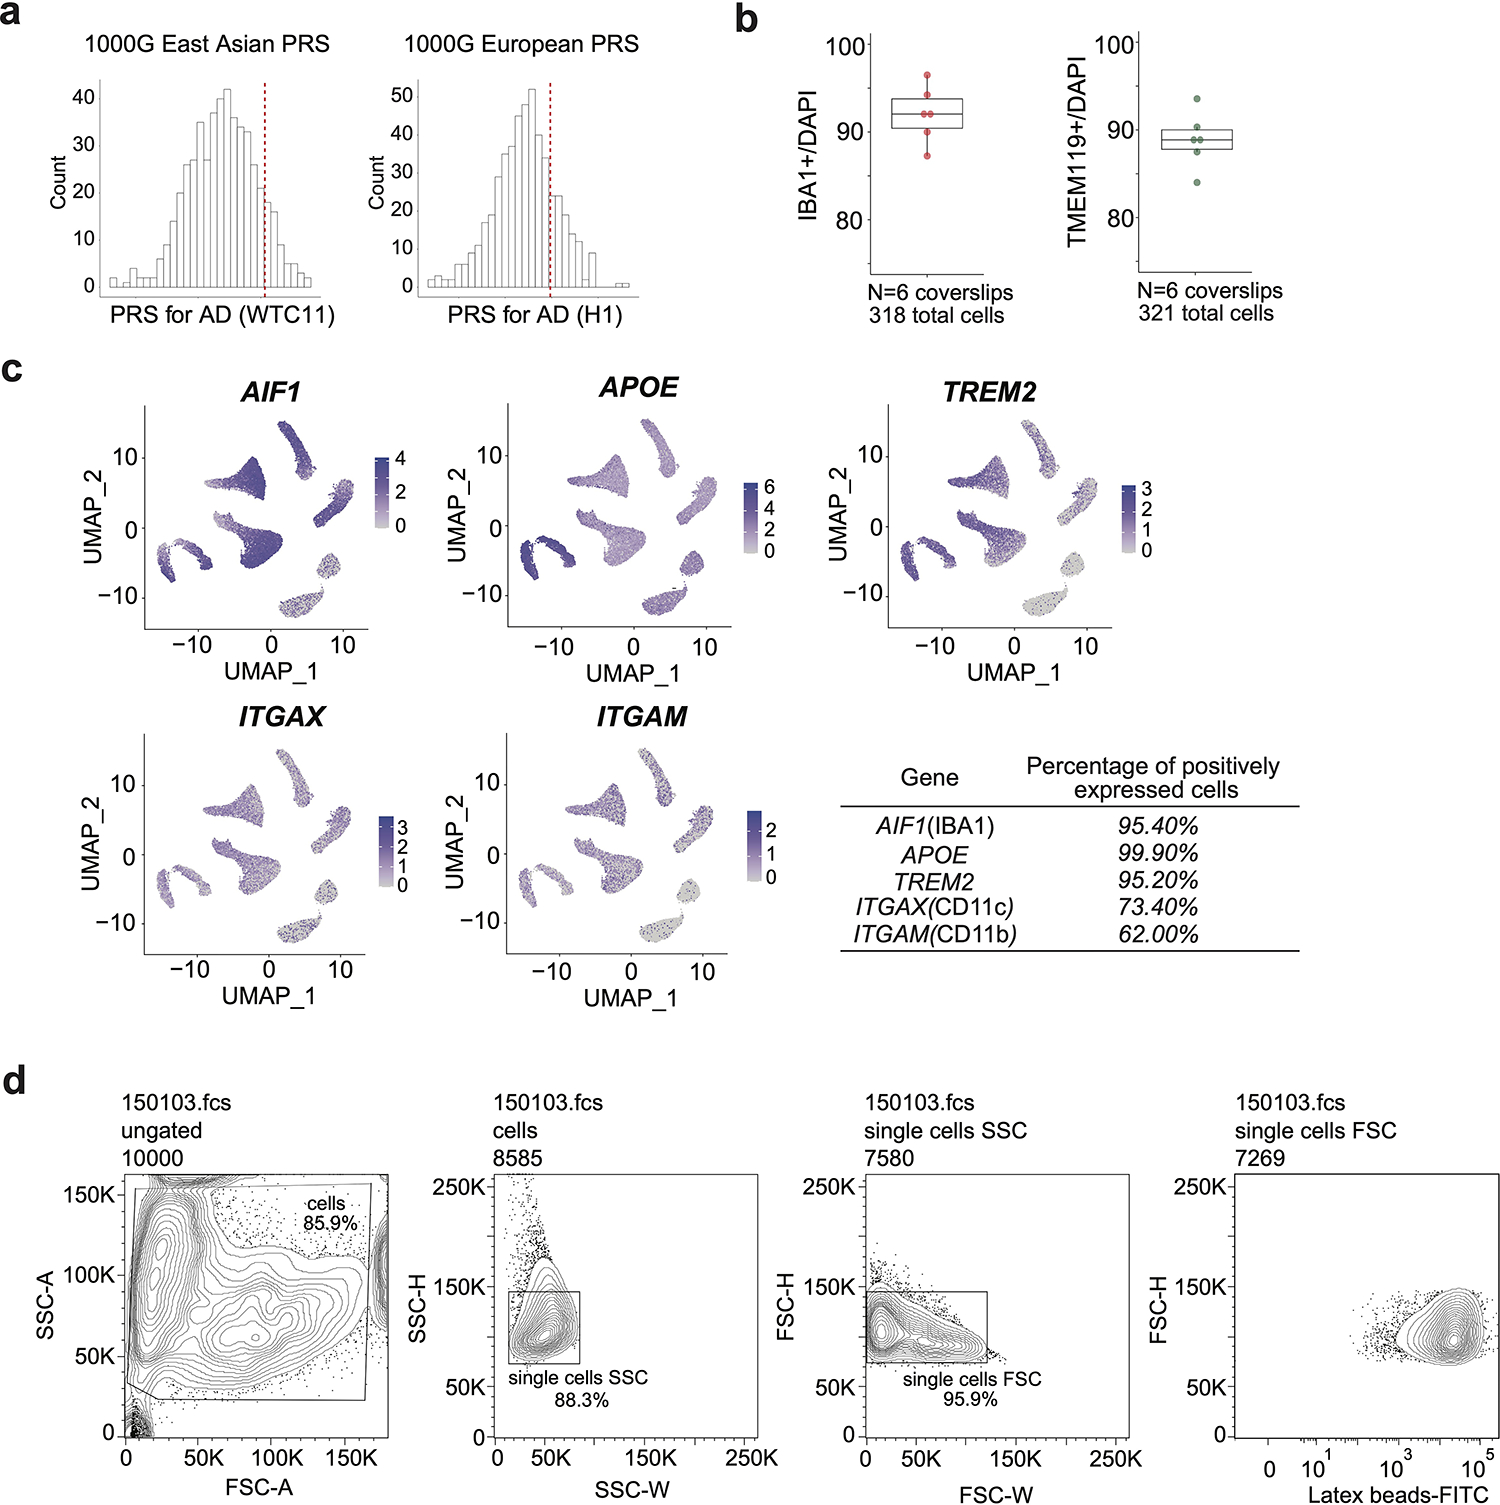
a, PRS of each donor are shown with respect to PRS for individuals of matched continental ancestry from the 1000 Genomes Project (1000G). For WTC11, we used 1000G East Asian (EAS), and H1 European (EUR). The red dashed lines represent PRS for WTC11 and H1. b, The yield of IBA1 or TMEM119 positive microglia is represented by the number of immunostaining positive cells divided by the total number of cells. Six coverslips from 3 independent differentiations were used for statistics. Boxplots indicate the median and interquartile range. Whiskers mark the 5th and 95th percentiles. c, Marker gene expressions are displayed in the UMAP of scRNA-seq. Percentage of positively expressed cells are calculated by pct.exp in the Seurat package. d, Representative contour plots depicting FACS gating strategy. Cells were separated from debris of various sizes based on the forward scatter area (FSC-A) and side scatter area (SSC-A). Two singlet gates were applied using the width and height metrics of the side scatter (SSC-H versus SSC-W) and forward scatter (FSC-H versus FSC-W). Latex beads-FITC signals are shown for all singlets.
Extended Data Fig. 2. Transcriptome analysis of hPSC-derived microglia-like cells with other cell types.
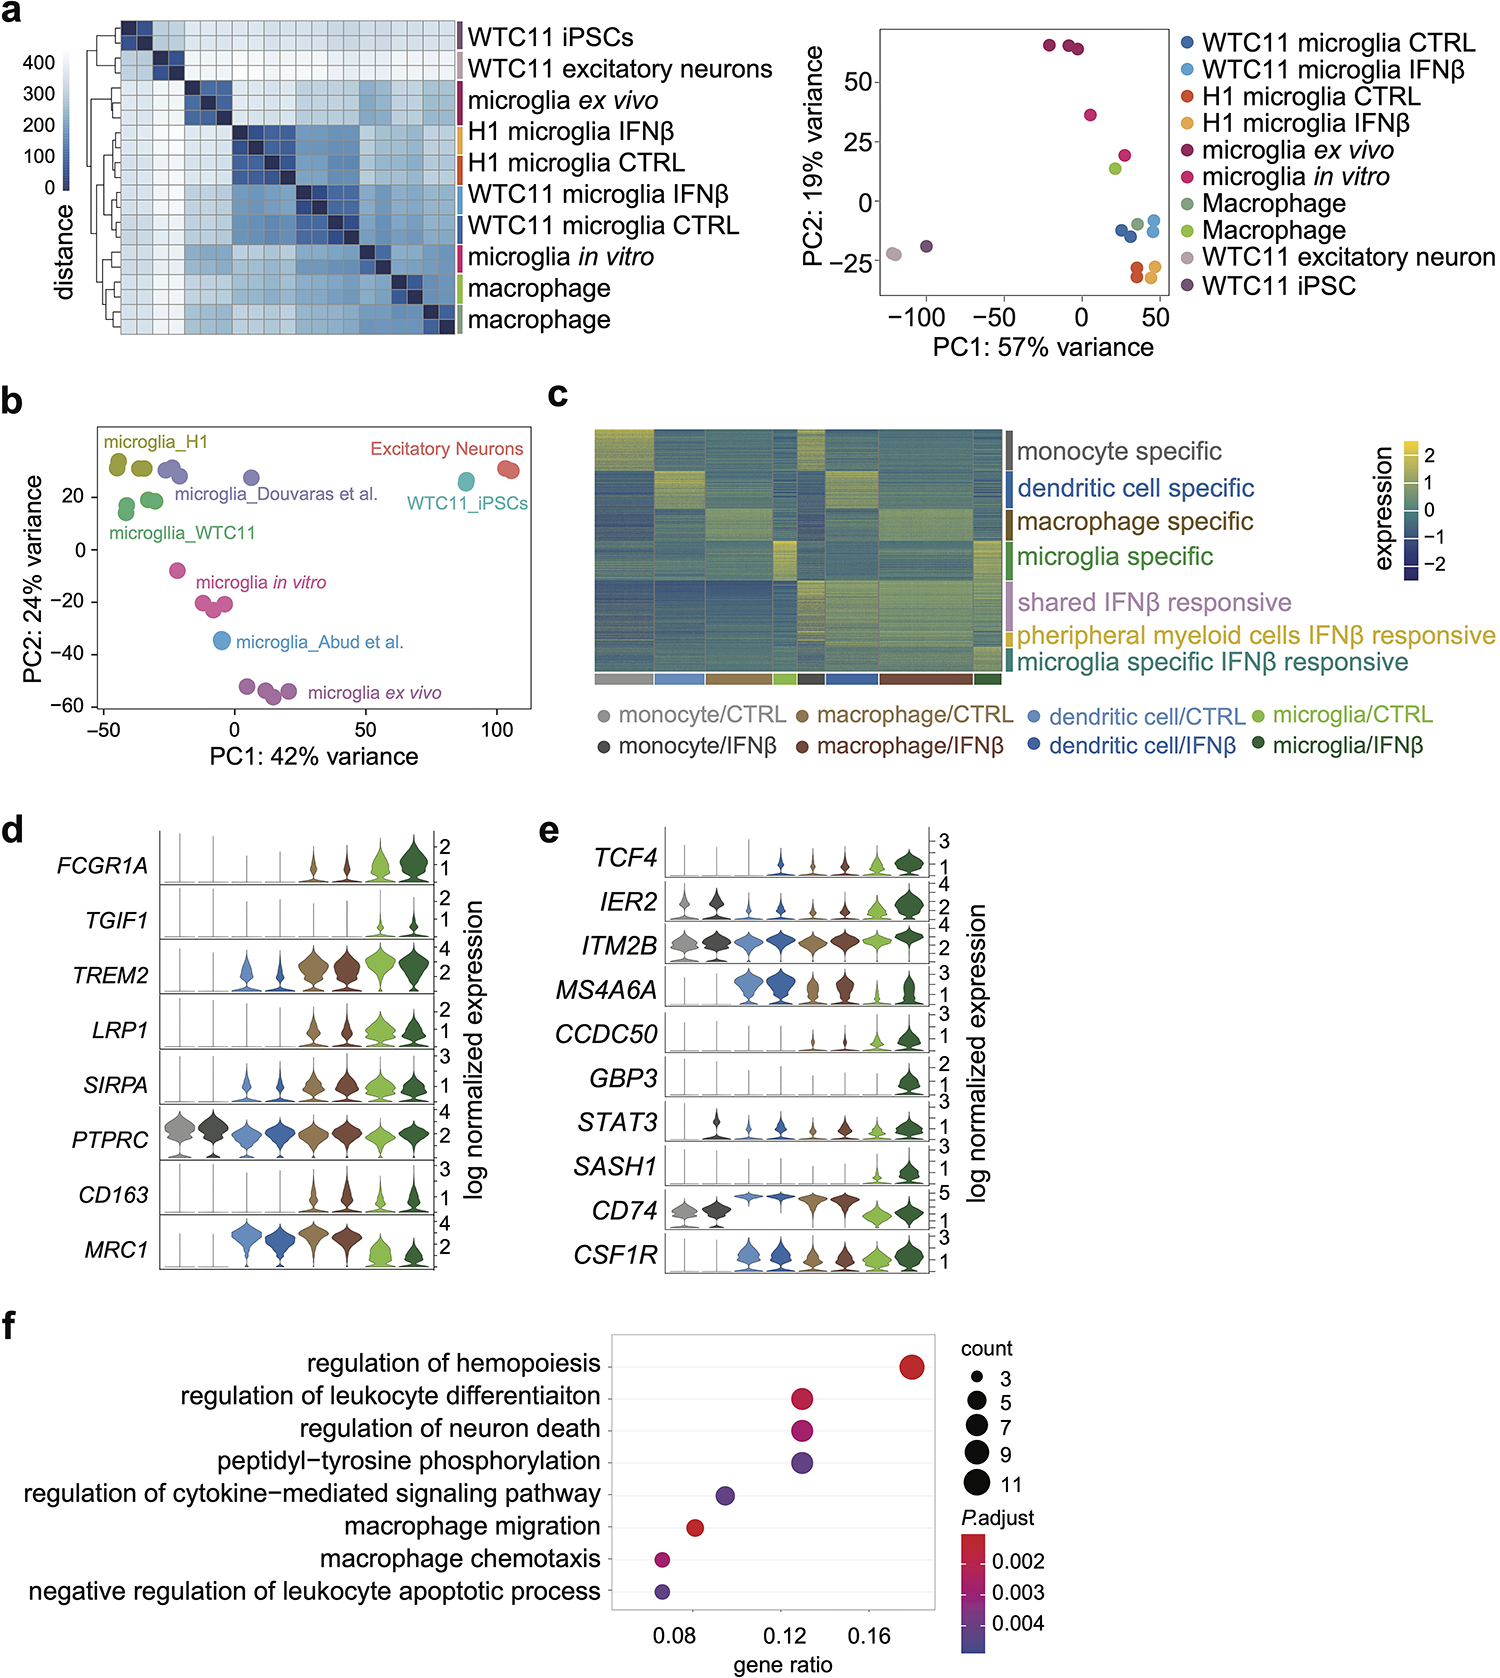
a, RNA-seq replicates were hierarchically clustered according to gene expression distances using DESeq2 (left). PCA plot displaying all samples (right). b, PCA plots of RNA-seq comparisons between hPSC-microglia differentiated with multiple protocols11,13 and primary microglia in vitro and in vivo12 and other cell types3. c, Heatmap showing scRNA-seq analysis of cell type-specific and shared IFNß stimulation responsive genes in microglia and peripheral myeloid cells. d, Examples of genes highly expressed (top 5) or lowly expressed (bottom 3) in microglia compared to peripheral myeloid cells. e, Examples of microglia-specific IFNß responsive genes. f, Top enriched GO terms of microglia specific IFNß responsive genes. Enriched GO terms are ranked by the percentage of total microglia-specific genes in the given GO term. The counts of enriched genes and adjusted P value for multiple comparisons were reported. Expanded lists of enriched GO terms are available in Supplementary Table 3.
Extended Data Fig. 3. Enrichment analysis of IFNβ responsive genes compared to disease-associated microglia (DAM) feature genes.
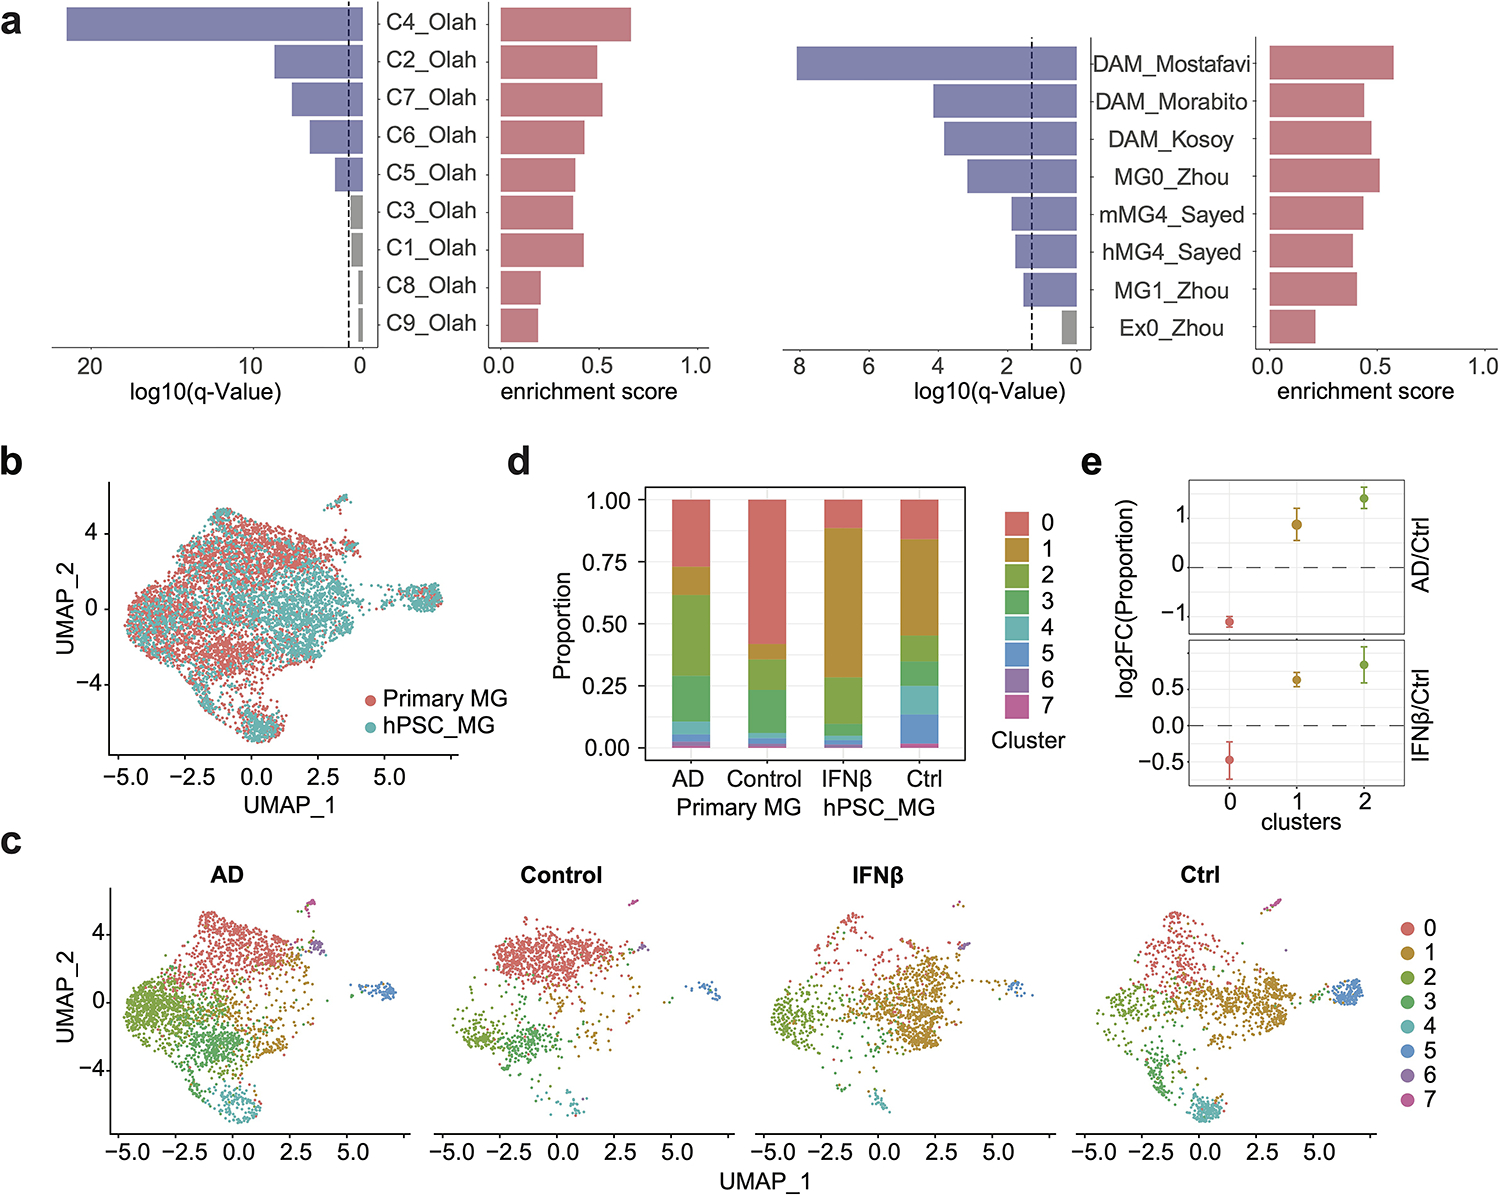
a, Barplots show the q values and enrichment scores of GSEA results for IFNβ responsive genes, in comparison with published datasets17,18,23–26 (dash line, q = 0.05). IFNβ responsive genes are highly enriched in multiple clusters of DAM by Olah et al.18, including the C4 cluster, representing cells with activated IFN signaling, the C7 cluster, representing cells expressing DAM genes, as well as C5 and C6, representing cells expressing genes related to anti-inflammatory responses. The C2 cluster, representing homeostatic microglia which are more likely derived from the temporal neocortex of younger temporal lobe epilepsy patients compared to the other homeostatic population, is also enriched for IFNβ responsive genes. 4 clusters are not enriched for IFN responsive genes, including C1, a homeostatic population shared by all brain regions in all donors, C3, cells with enriched expression of cellular stress genes, C8, cells enriched for respiratory electron transport, and C9 enriched with genes of cell cycle. In addition, IFNβ responsive genes are enriched in microglia samples associated with AD from 5 additional studies, including microglia samples in the human-MG4 cluster and the mouse-MG4 cluster, which are most enriched with DAM genes among all clusters from Sayed et al.17, the MG0 cluster (highly represented in AD microglia) compared to the MG1 cluster (control microglia) from Zhou et al.23, and AD DAM DEGs from Mostafavi, et al.24, Kosoy et al.26, and Morabito et al.25. b, UMAP plot visualizing integration of 3,038 WTC11-microglia scRNA-seq with 4,126 primary microglia snRNA-seq from Morabito et al. Cells are colored by sample origins. c, UMAP plot visualizing joint clustering splitted by donor condition (AD/control) or treatment (IFNβ stimulation/control). d, Cell proportions of each cluster splitted by donor condition or treatment. e, Cell proportion fold change in AD vs control or IFNβ stimulation vs control for 3 major clusters using monte-carlo/permutation test. Data are shown as mean ± s.d. (n_permutations = 1000).
Extended Data Fig. 4. Integrative analysis of chromatin accessibility, chromatin interactions, and gene expression.
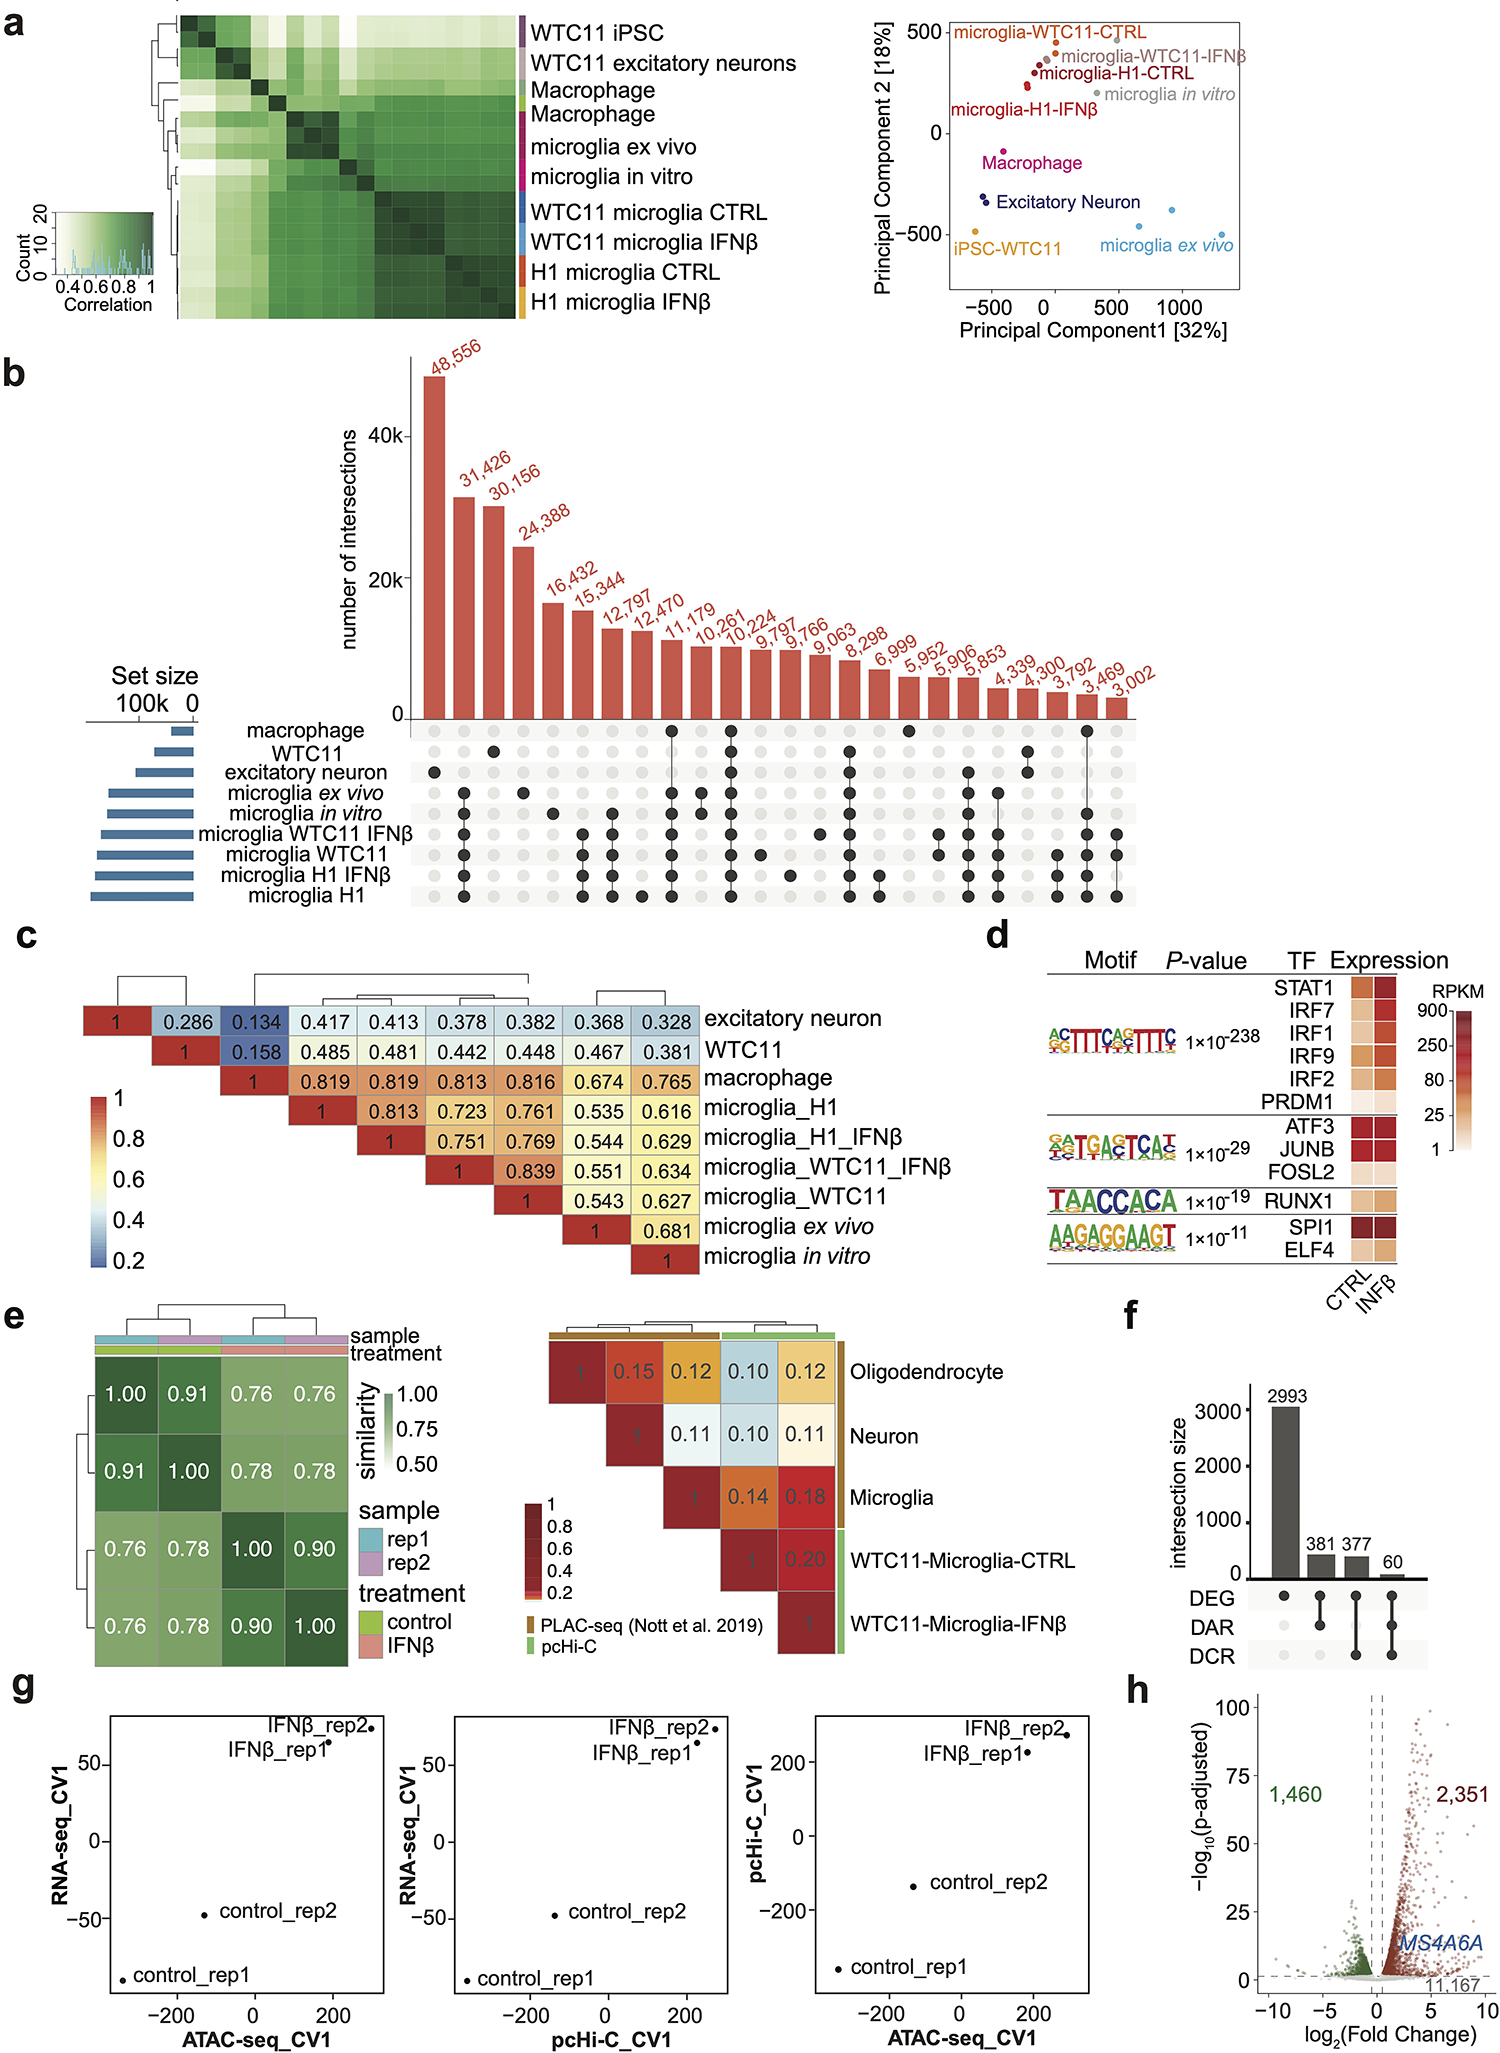
a, Heatmap with pairwise correlations and hierarchical clustering of read densities at the set of unified open chromatin peaks for ATAC-seq datasets (left panel). PCA plot of ATAC-seq comparisons between hPSC-derived microglia-like cells, primary microglia12 and other cell types3 (right panel). b, Upset plot showing overlapping peaks of ATAC-seq datasets in WTC11 (hPSC), excitatory neuron, macrophage, microglia ex vivo, microglia in vitro, microglia derived from WTC11 (control and IFNβ stimulated) and microglia derived from H1 (control and IFNβ stimulated). c, Heatmap of Jaccard Index for pairwise overlap among the 9 ATAC-seq datasets in (b). Two-sided chi-squared tests on pairwise overlapping all led to P values less than 2.2e-16. d, Motif enrichment analysis for 93 TSS overlapping DARs in response to IFNß treatment. P values from HOMER and corresponding TF expression levels are shown. e, Heat map with pairwise similarity based on reproducibility analysis for pcHi-C replicates using HPRep (left). Heatmap of the Jaccard index for comparison of chromatin interaction profile in primary microglia, neuron, oligodendrocyte1 and hPSC derived microglia (right). f, Upset plot showing most of the IFNß stimulation responsive genes (total 3,811 including 1,460 down-regulated and 2,351 up-regulated genes) are not associated with differential chromatin accessible regions (DARs) or differential chromatin interacting regions (DCRs). g, Pairwise canonical variable (CV) plots for all samples: (left) RNA-seq CV1 vs. ATAC-seq CV1; (middle) RNA-seq CV1 vs pcHi-C CV1; (right) pcHi-C CV1 vs ATAC-seq CV1. h, Volcano plot showing differentially expressed genes upon IFNß stimulation in microglia with a cutoff of adjusted P < 0.05 and absolute log2(fold change) > 0.5. MS4A6A gene is labeled.
Extended Data Fig. 5. Summarized results of CRISPRi and scRNA-seq analysis of cCREs with prioritized AD variants.
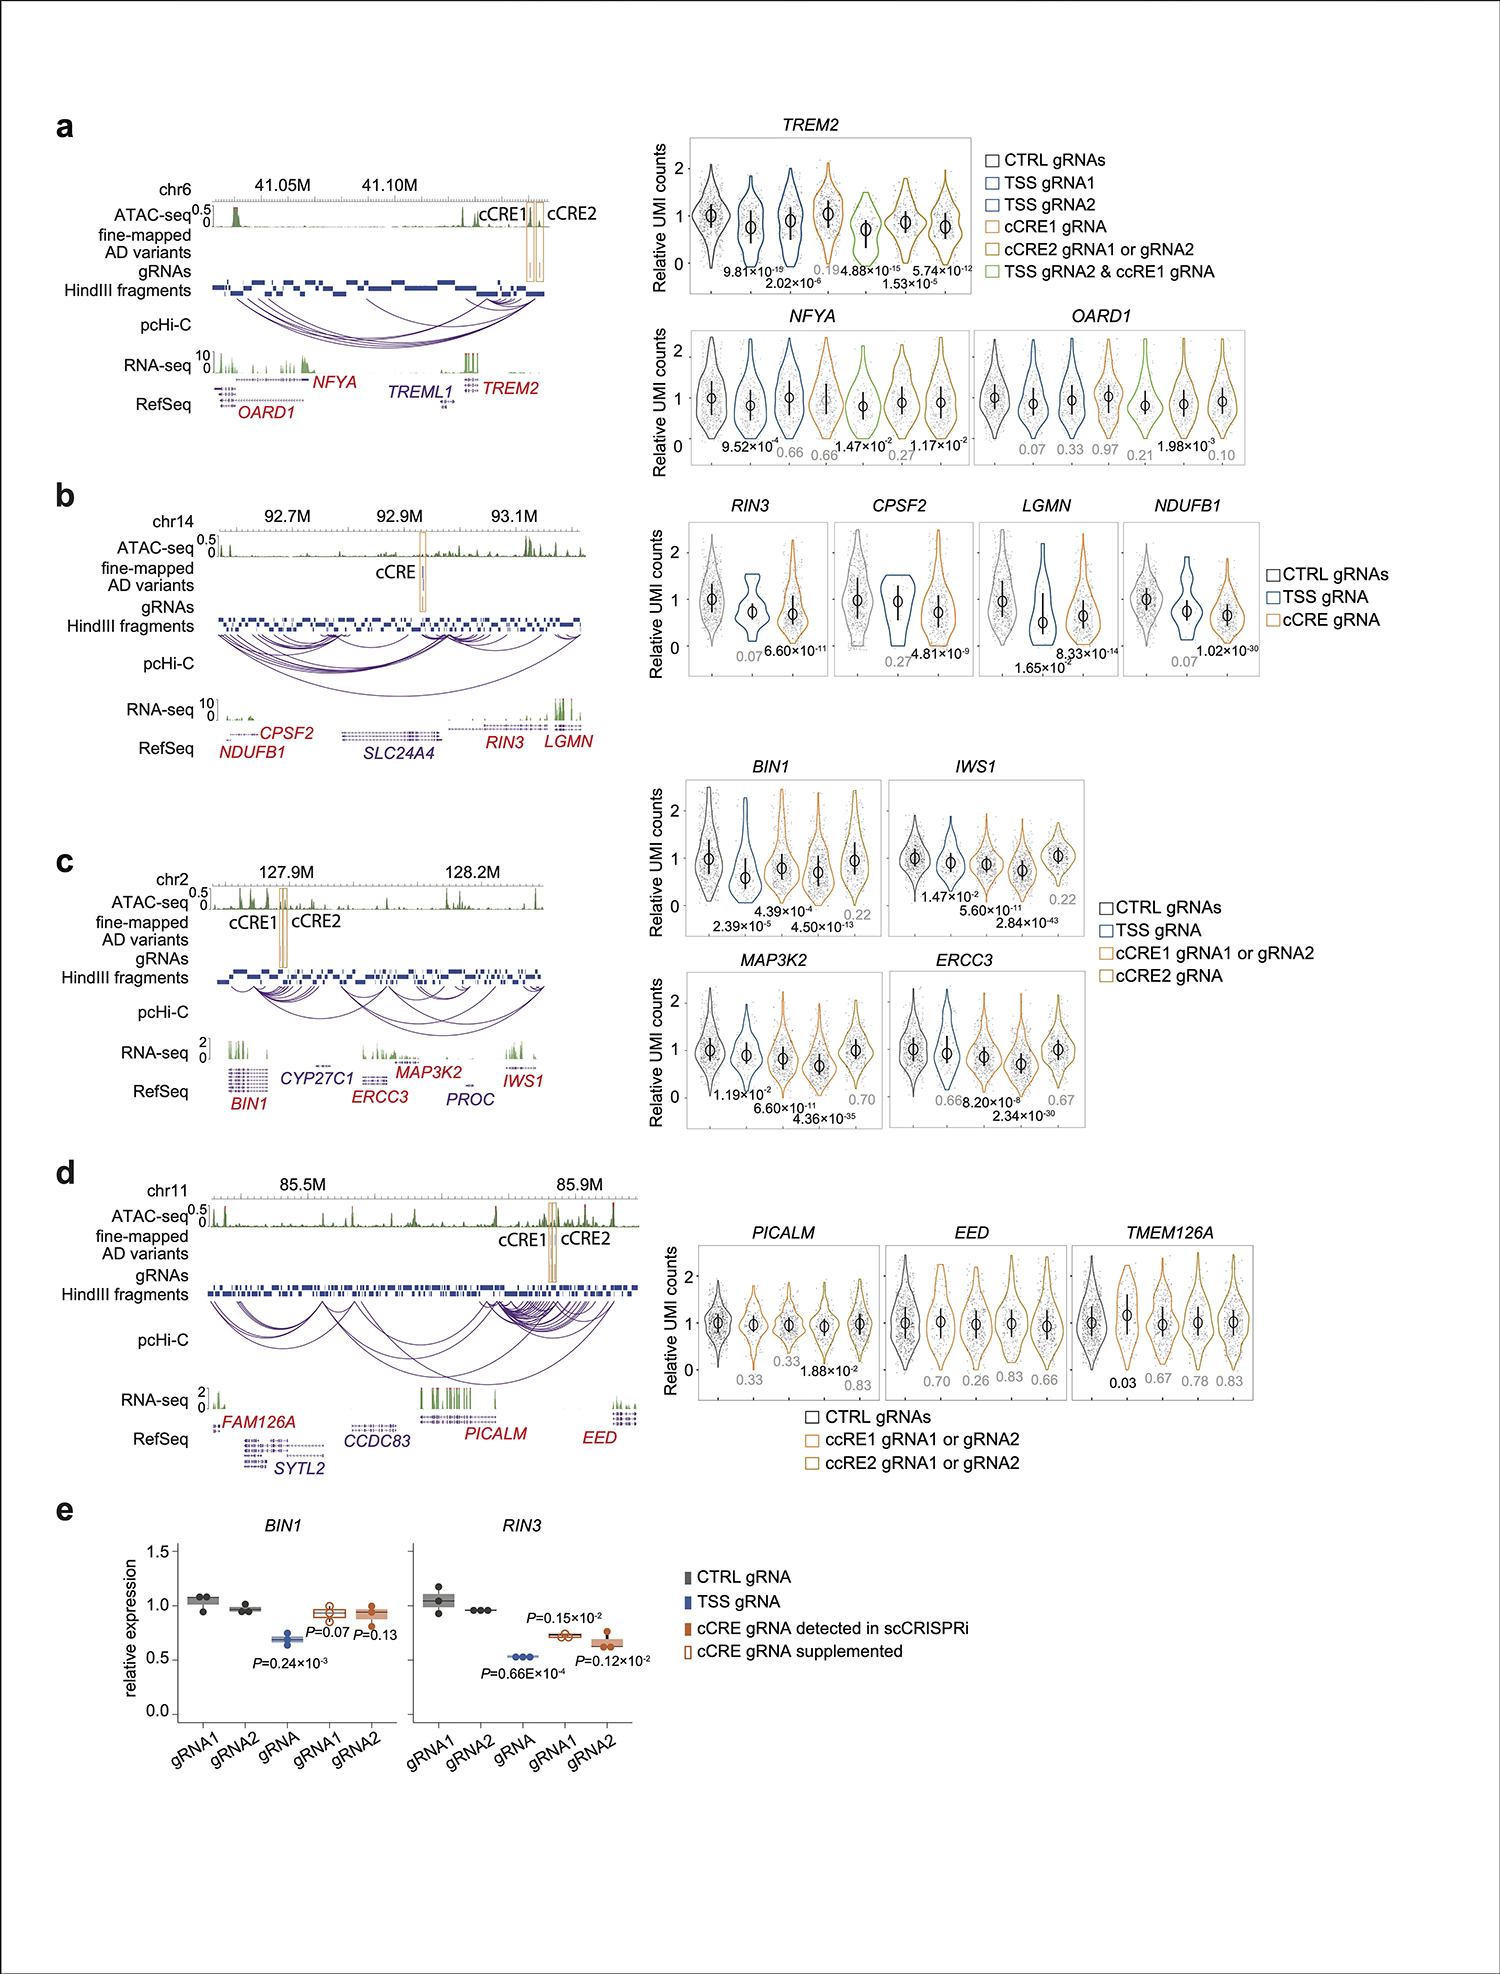
a-d, In all examples, tested cCREs are highlighted with orange or brown boxes. gRNAs targeting cCREs with AD variants are shown as red vertical lines. Genes expressed in microglia and exhibiting expression changes upon perturbation are shown with red labels. Distributions of relative gene expression levels are shown in violin plots where circles mark the median, and the black bars mark the upper and lower quantiles. Each dot represents one single cell. Number of cells are indicated in Supplementary Table 7d. P values are calculated by comparing gene expression between cells infected with control gRNAs and cells infected with gRNAc targeting cCREs using two-sided two-sample t-test and adjusted by Benjamini-Hochberg FDR multiple testing correction. Adjusted P values (FDR) are labeled. (a) TREM2 locus, (b) RIN3 locus, (c) BIN1 locus, and (d) PICALM locus. Notably at the TREM2 locus, microglia receiving both TSS gRNA2 and cCRE1 showed enhanced downregulation of TREM2 compared to cells with TSS gRNA2 alone. e, Gene expression levels after CRIPSRi targeting cCREs at BIN1 and RIN3 loci with 2 gRNAs in WTC11-derived microglia-like cells. P values calculated using two-sided two-sample t-test (n = 3). Boxplots indicate the median and interquartile range. Whiskers mark the 5th and 95th percentiles.
Extended Data Fig. 6. Functional validation of AD risk cCREs under control and IFNβ stimulated conditions.
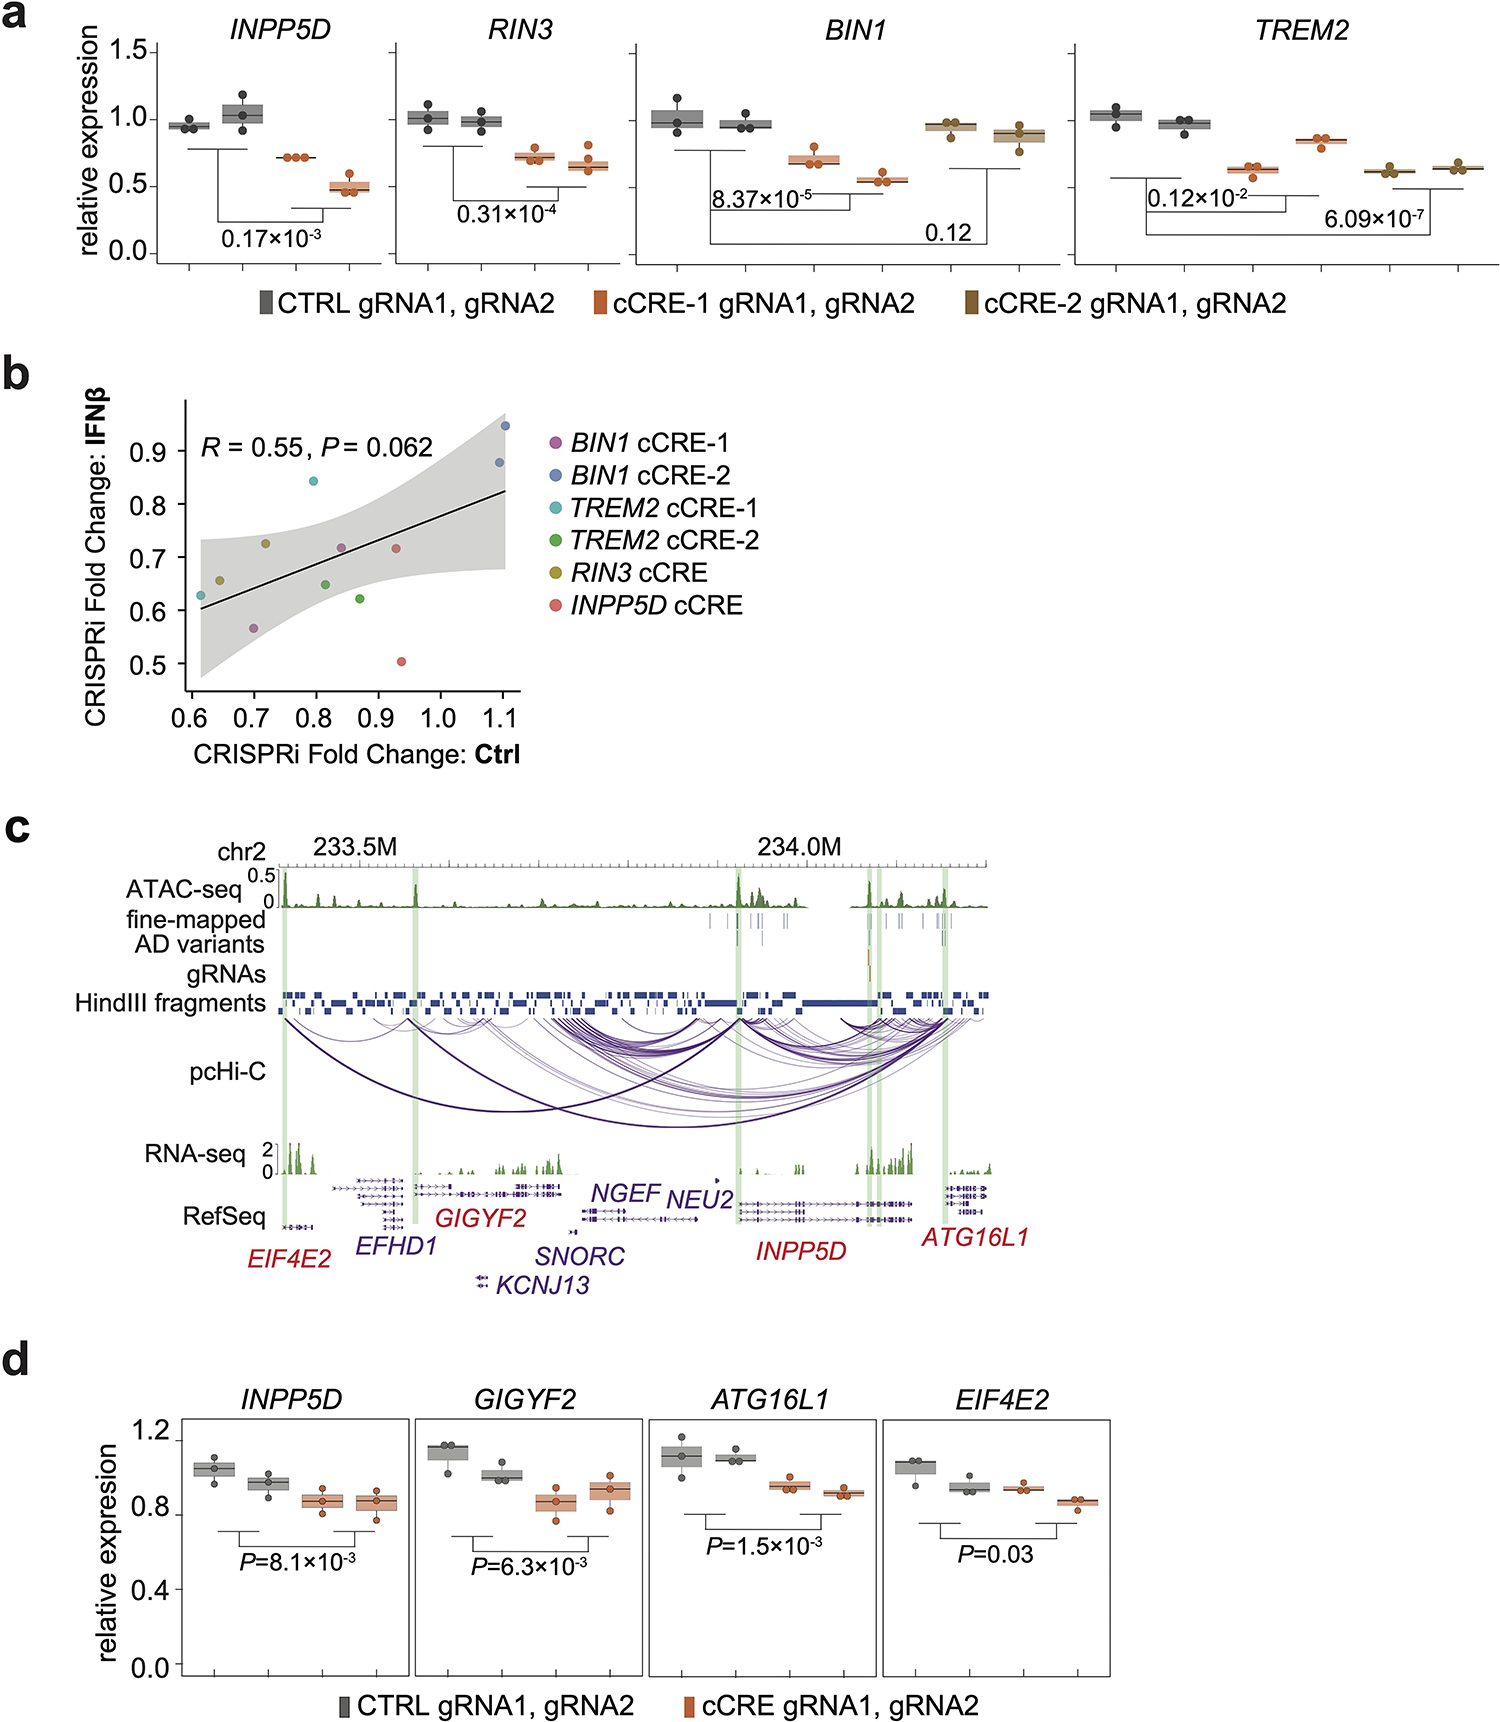
a, CRIPSRi validation on cCREs at INPP5D, BIN1, RIN3 and TREM2 loci in WTC11 microglia-like cells treated with IFNβ. P values calculated using two-sided two-sample t-test. Three independent replicates per condition and two sgRNAs per replicate were used for each experiment. Boxplots indicate the median and interquartile range. Whiskers mark the 5th and 95th percentiles. b, Scatter plot showing the fold change of cCRE perturbation in control or IFNβ treated condition. The Pearson correlation coefficient and its P value are reported. Linear regression line (black) with 95% confident interval (gray shade) are plotted. c, Genome browser snapshot showing the INPP5D locus containing a cCRE with prioritized AD variants and gRNAs for perturbation in single cell analysis. Genes expressed in microglia at this locus (red labels) are analyzed. Green boxes highlight the cCRE and promoters of neighboring genes. d, Down-regulation of INPP5D, GIGYF2, ATG16L1, and EIF4E2 by perturbing the cCRE region are confirmed by bulk CRISPRi followed by RT-qPCRs. P values are calculated with two-sided two sample t-test. Three independent replicates per condition and two sgRNAs per replicate were used for each experiment. Boxplots indicate the median and interquartile range. Whiskers mark the 5th and 95th percentiles.
Extended Data Fig. 7. Phenotypic analysis of hPSC-derived microglia-like cells under synergistic inhibition of TREM2 enhancer and promoter.
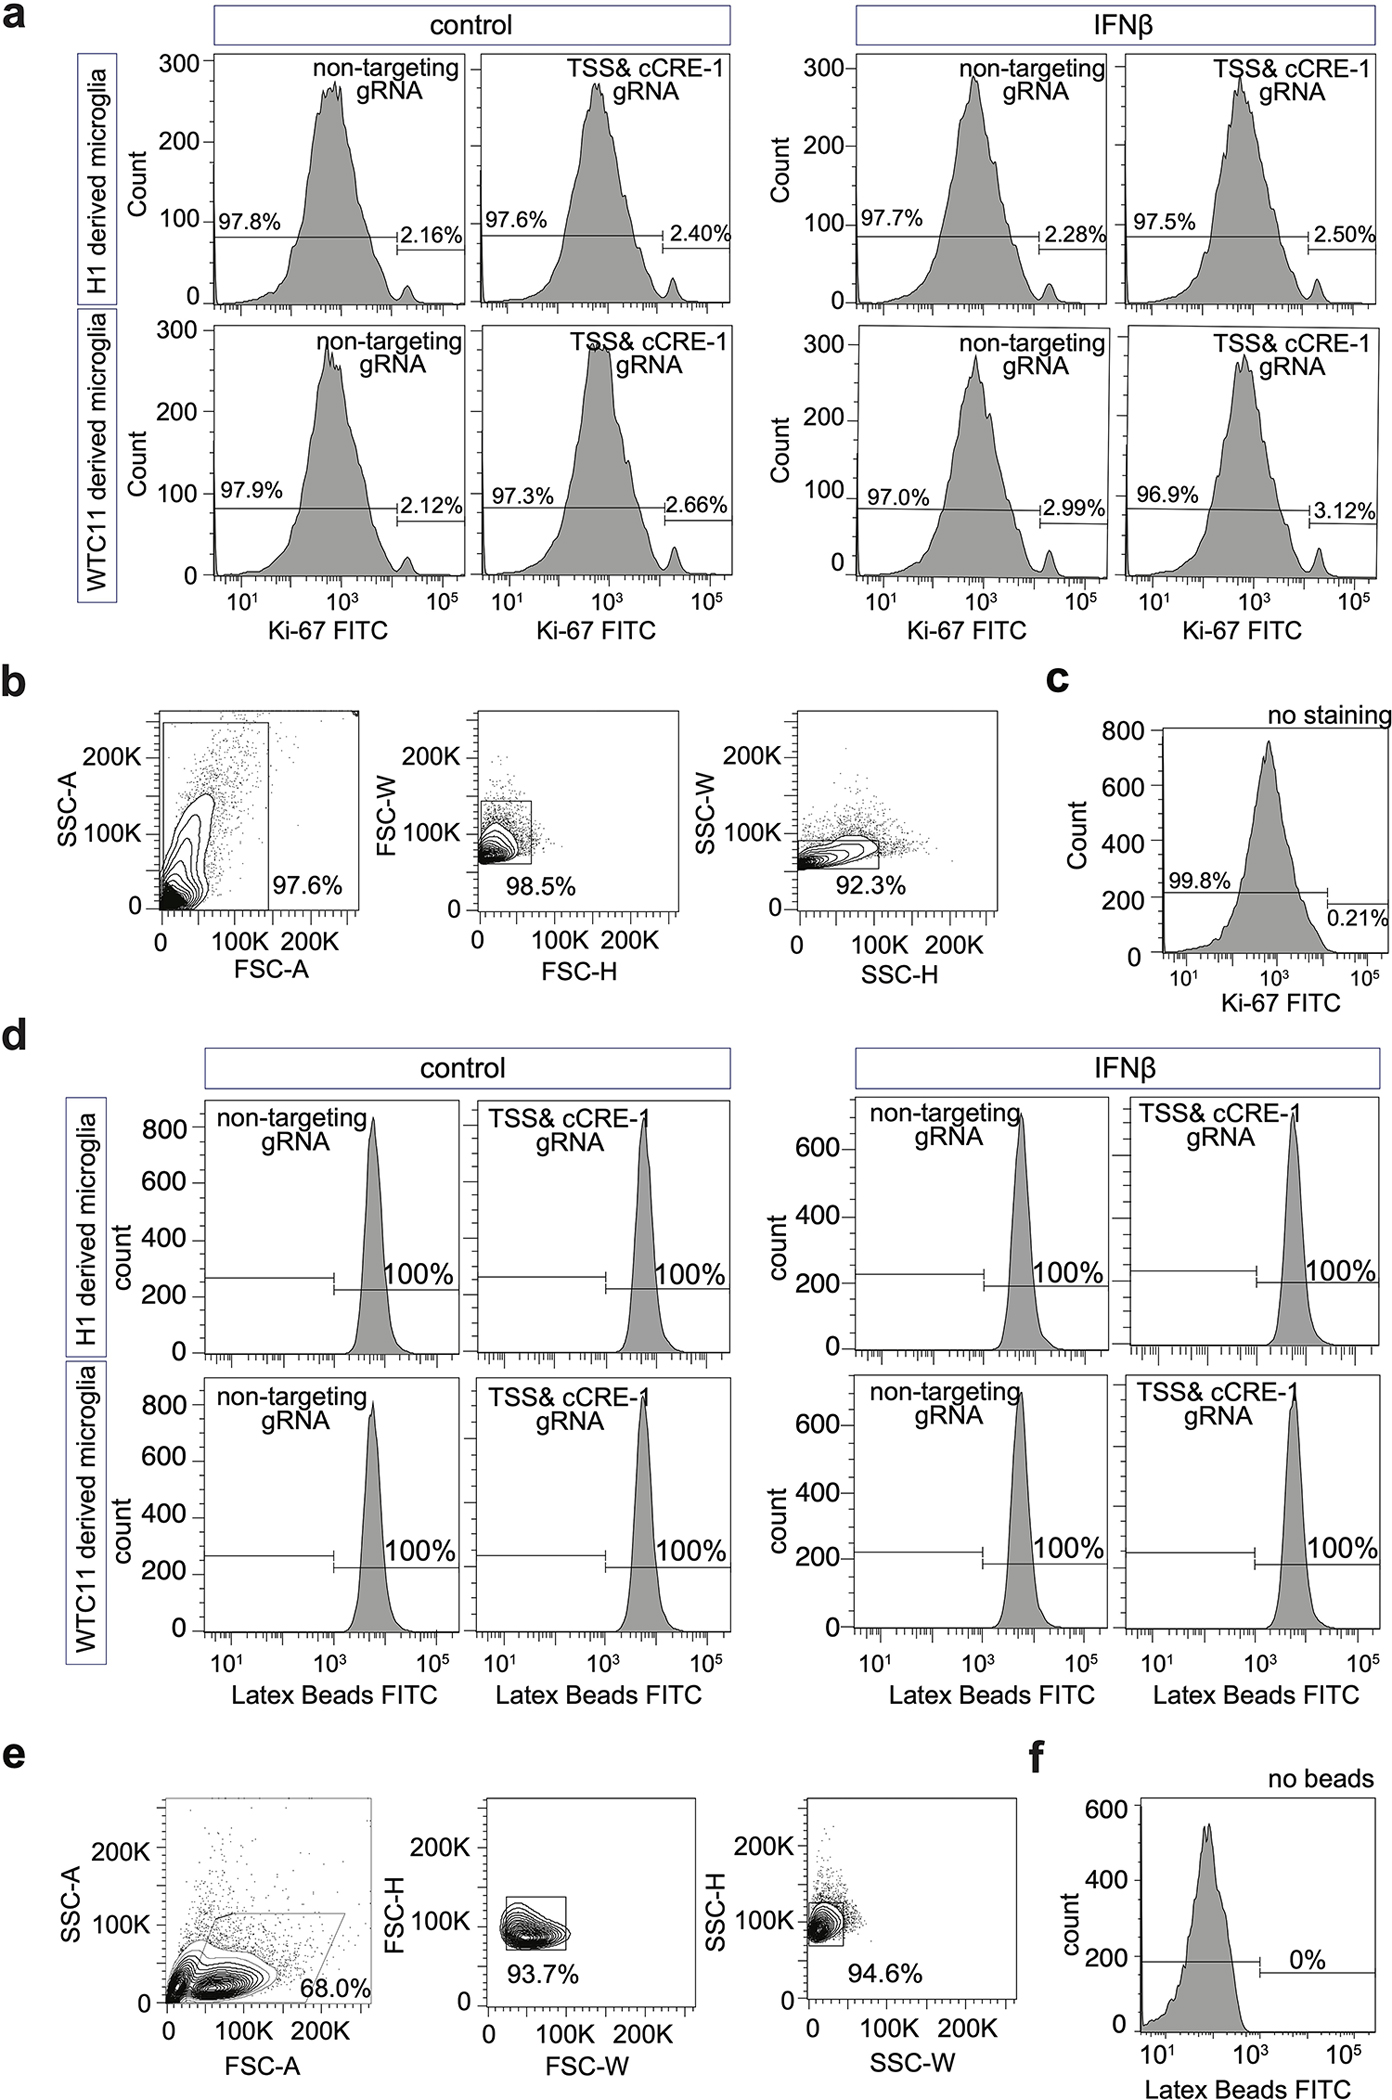
a, FACS analysis of proliferation for WTC11- and H1-derived microglia-like cells perturbed with synergistic inhibition of TREM2 enhancer and promoter in both control and IFNβ stimulated conditions. b, Representative contour plots of Ki-67 FITC FACS gating strategy. Cells were separated from debris based on the forward scatter area and side scatter area. Two singlet gates were applied using the width and height metrics of the side scatter and forward scatter. Ki-67 FITC signals are shown for all singlets. c, Negative control population using microglia not stained with Ki-67 antibody. d, FACS analysis of phagocytosis capacity for WTC11- and H1-derived microglia-like cells perturbed with synergistic inhibition of TREM2 enhancer and promoter in both control and IFNβ stimulated conditions. e, Representative contour plots of Latex beads-FITC FACS gating strategy. Cells were separated from debris based on the forward scatter area and side scatter area. Two singlet gates were applied using the width and height metrics of the side scatter and forward scatter. Latex beads-FITC signals are shown for all singlets. f, Negative control population using microglia not incubated with Latex beads.
Extended Data Fig. 8. Validation of prioritized AD variants by allelic analysis.
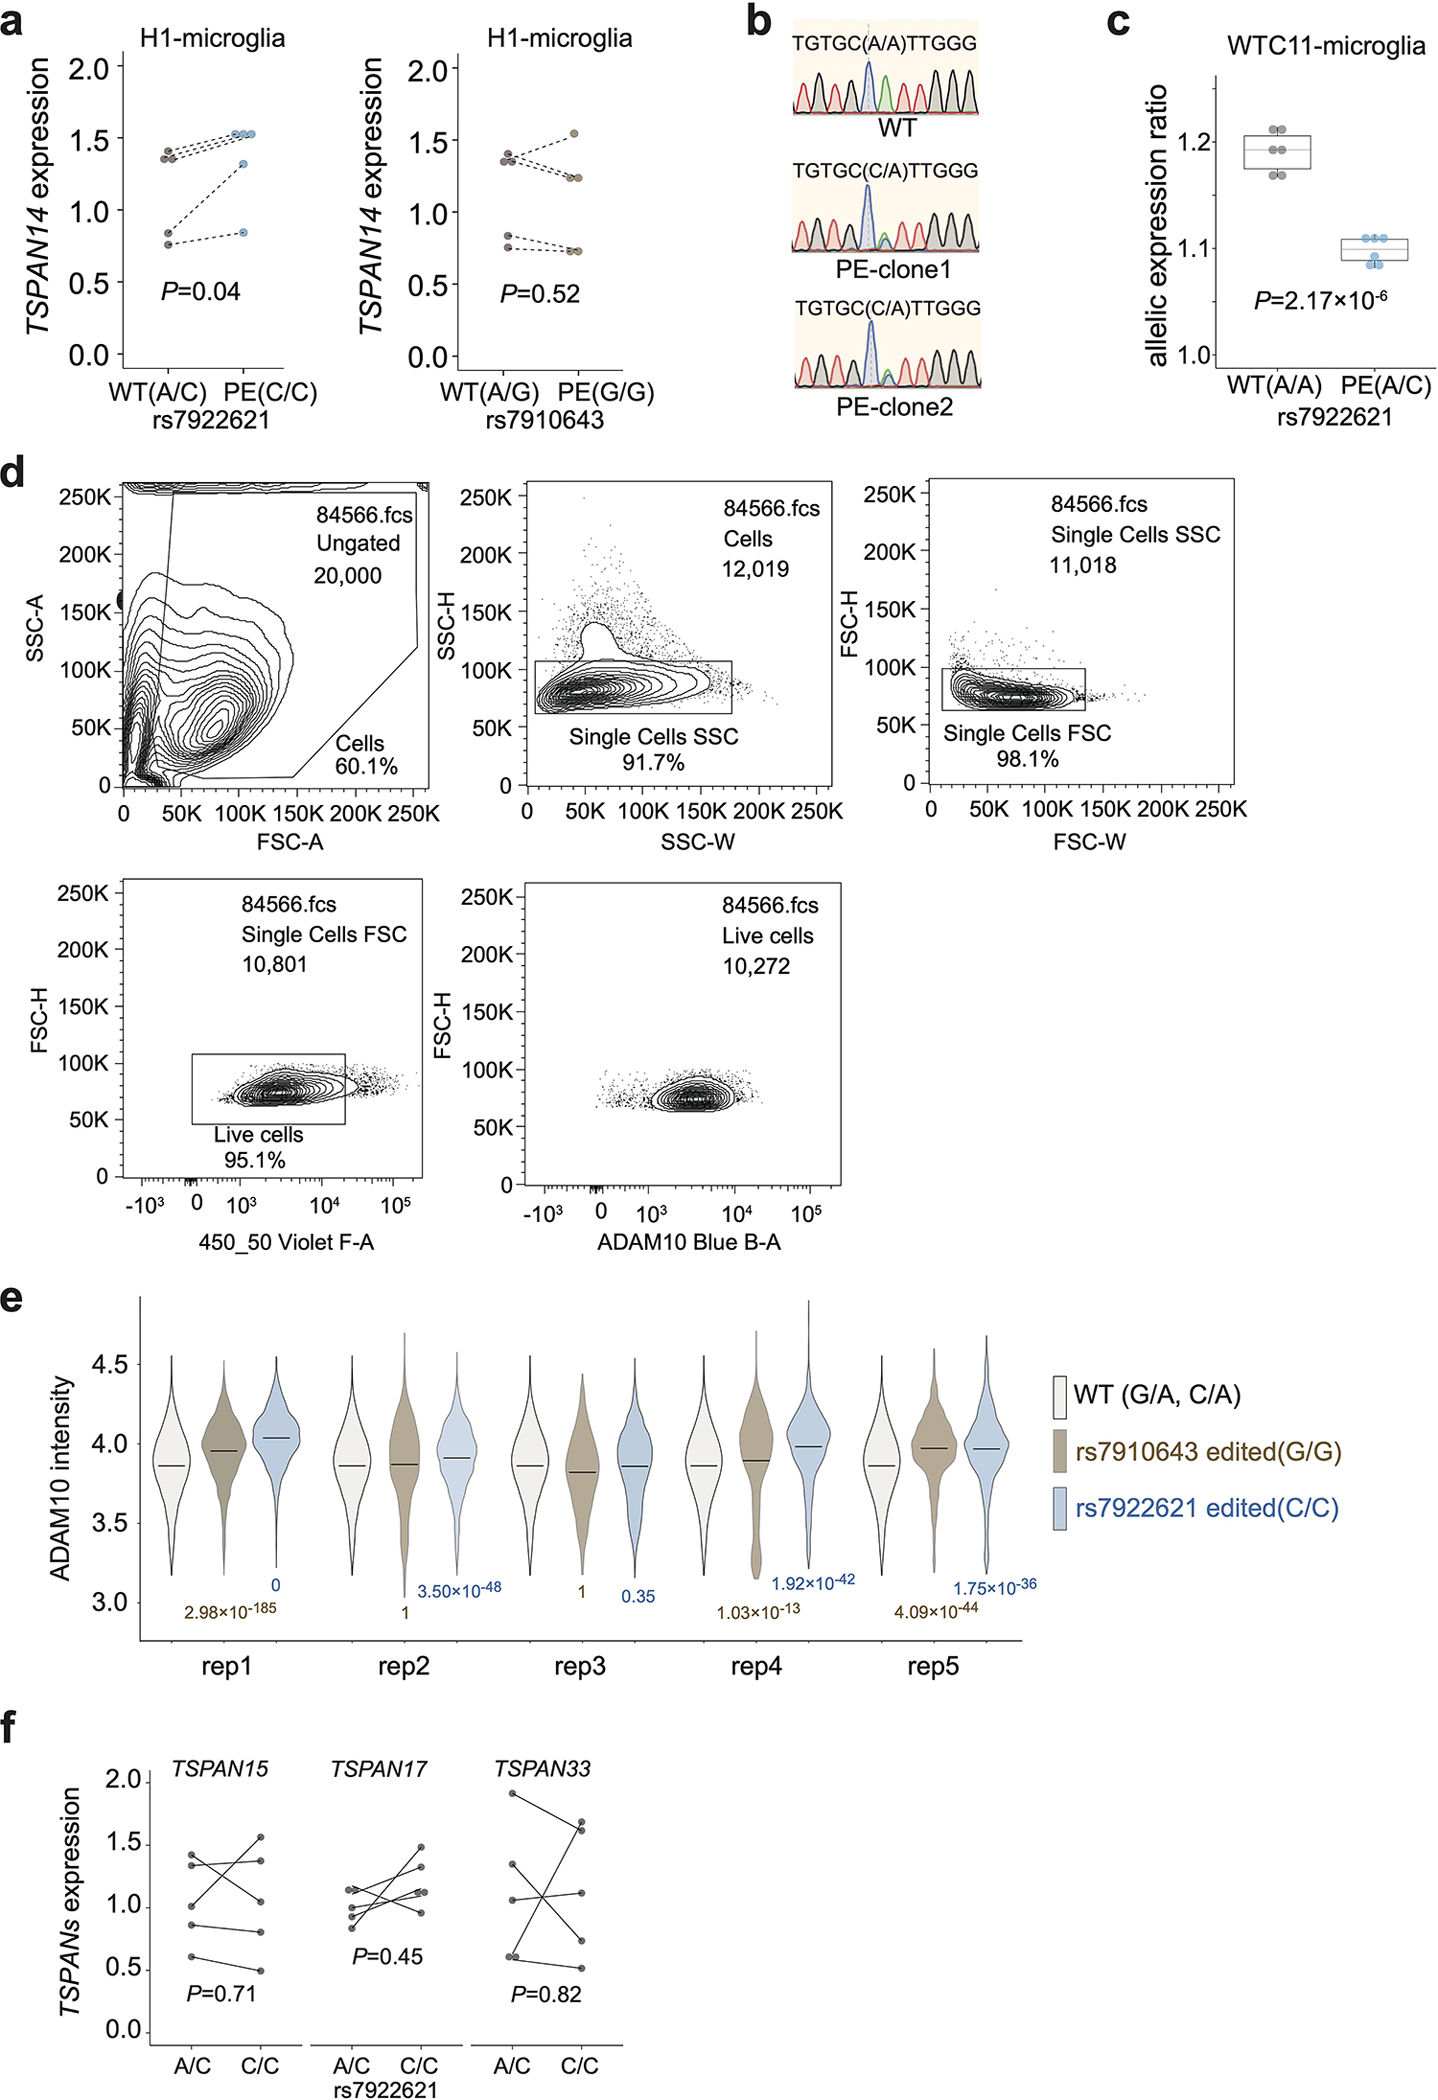
a, The total expression levels of TSPAN14 are elevated in microglia-like cells derived from H1 with prime editing rs7922621 (A/C to C/C), but not in microglia with prime editing at rs7910643 (A/G to G/G). P values are calculated with two-sided paired t-test (dash line indicating the pairing within each differentiation batch, n = 5). Each dot represents one biological replicate. b, Representative results from sanger sequencing display WTC11 rs7922621 wildtype (A/A) and KI clones (A/C). c. The ratios of allelic expression of TSPAN14 decrease in microglia-like cells derived from KI clones (rs7922621, A/C) compared to those derived from wildtype clones rs7922621 (A/A). P values calculated using two-sided two-sample t-test (n = 6). Boxplots indicate the median and interquartile range. Whiskers mark the 5th and 95th percentiles. d, Representative contour plots of ADAM10 FACS gating strategy. Cells were separated from debris based on the forward scatter area and side scatter area. Two singlet gates were applied using the width and height metrics of the side scatter and forward scatter. Live cells are selected based on SYTOX Blue signal and ADAM10 signals are shown for all live singlets. e, Violin plot of log10(ADAM10 intensity) in flow cytometry for WT controls, rs7922621 (G/G) edited cells, rs7910643 (C/C) edited cells across all replicates. P values are calculated using one-sided two-sample Wilcoxon test on ADAM10 levels for all cells compared to WT control within each replicate (n = 5). The horizontal line indicates the median. f, RT-qPCR experiments show that editing rs7922621 from A/C to C/C does not affect the expression levels of TSPAN15, TSPAN17, or TSPAN33 in microglia. P values are calculated with two-sided paired t-test (dash line indicating the pairing within each differentiation batch, n = 5). Each dot represents one biological replicate.
Extended Data Fig. 9. Phenotypic analysis of rs7922621 prime-edited WTC11- and H1-derived microglia-like cells.
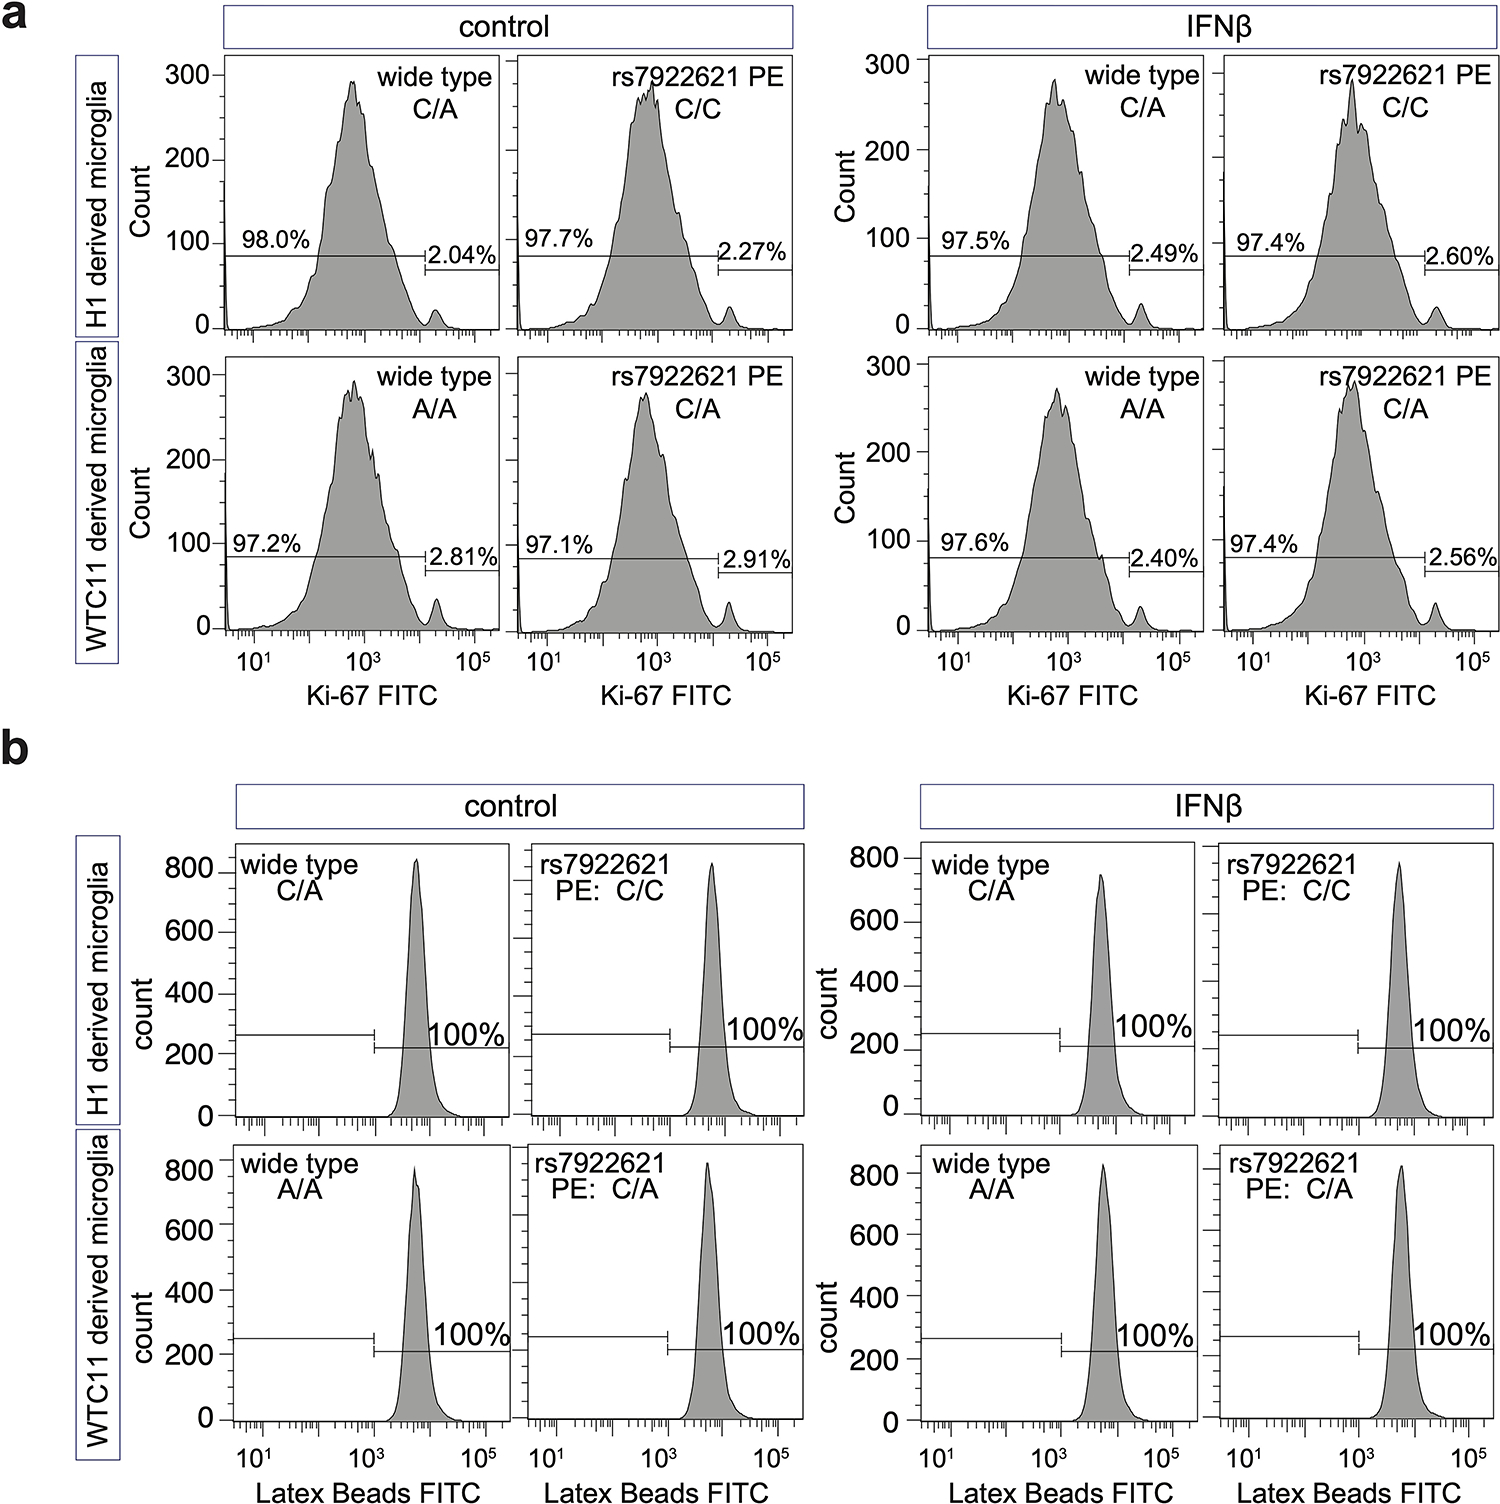
FACS analysis of a, proliferation and b, phagocytosis capacity of WTC11 and H1 wild type and rs7922621 prime-edited clones derived microglia-like cells in both control and IFNβ stimulated conditions.
Supplementary Material
Acknowledgements
We thank Dr. Bing Ren (University of California, San Diego) for sharing genome-wide pcHi-C probes, Dr. Jesse Engreitz (Stanford University) for sharing HyPR-seq gRNA detection barcodes, and Dr. Ryan Corces (Gladstone Institutes) for his valuable advice on ATAC-seq analysis. This work was supported by the National Institutes of Health (NIH) grants R01AG057497 and RF1AG079557 (to Y.S. and L.G.), R56AG079271 and R01AG079271 (to Y.S., L.G, and Y.L.), R01EY027789 and UM1HG009402 (to Y.S.), R01AG072758 and R01AG054214 (to L.G), the Hillblom Foundation, and the American Federation for Aging Research New Investigator Award in Alzheimer’s Disease (to Y.S). This work was also supported by NIH grants U01HG011720, P50HD103573, R01MH125236, and R01MH123724 (to Y.L.). This work was made possible in part by NIH grants P30DK063720, and S101S10OD021822-01 to the UCSF Parnassus Flow Cytometry Core. Sequencing was performed at the UCSF CAT, supported by UCSF PBBR, RRP IMIA, and NIH 1S10OD028511-01 grants.
Footnotes
Competing interests statement
The authors declare no competing financial interests.
Code availability
A copy of the custom code used for data analysis in the CRISRPi/HyPR-seq screen is released on Zenodo (https://doi.org/10.5281/zenodo.8206584).
Data availability
All datasets used in this study (pcHi-C, ATAC-seq, RNA-seq, scRNA-seq, and HypR-seq) are available under GEO accession number GSE173316. Data can be visualized on the WashU Epigenome Browser using the following session bundle ID: b62e2e70-f64c-11ec-9287-3f211c43000c.
Reference
- 1.Nott A et al. Brain cell type-specific enhancer-promoter interactome maps and disease-risk association. Science 366, 1134–1139, doi: 10.1126/science.aay0793 (2019). [DOI] [PMC free article] [PubMed] [Google Scholar]
- 2.Neuner SM, Tcw J & Goate AM Genetic architecture of Alzheimer's disease. Neurobiol Dis 143, 104976, doi: 10.1016/j.nbd.2020.104976 (2020). [DOI] [PMC free article] [PubMed] [Google Scholar]
- 3.Song M et al. Mapping cis-regulatory chromatin contacts in neural cells links neuropsychiatric disorder risk variants to target genes. Nat Genet 51, 1252–1262, doi: 10.1038/s41588-019-0472-1 (2019). [DOI] [PMC free article] [PubMed] [Google Scholar]
- 4.Song M et al. Cell-type-specific 3D epigenomes in the developing human cortex. Nature 587, 644–649, doi: 10.1038/s41586-020-2825-4 (2020). [DOI] [PMC free article] [PubMed] [Google Scholar]
- 5.Martin P et al. Capture Hi-C reveals novel candidate genes and complex long-range interactions with related autoimmune risk loci. Nat Commun 6, 10069, doi: 10.1038/ncomms10069 (2015). [DOI] [PMC free article] [PubMed] [Google Scholar]
- 6.Martin JS et al. HUGIn: Hi-C Unifying Genomic Interrogator. Bioinformatics 33, 3793–3795, doi: 10.1093/bioinformatics/btx359 (2017). [DOI] [PMC free article] [PubMed] [Google Scholar]
- 7.Ousman SS & Kubes P Immune surveillance in the central nervous system. Nat Neurosci 15, 1096–1101, doi: 10.1038/nn.3161 (2012). [DOI] [PMC free article] [PubMed] [Google Scholar]
- 8.Gjoneska E et al. Conserved epigenomic signals in mice and humans reveal immune basis of Alzheimer's disease. Nature 518, 365–369, doi: 10.1038/nature14252 (2015). [DOI] [PMC free article] [PubMed] [Google Scholar]
- 9.Schwartzentruber J et al. Genome-wide meta-analysis, fine-mapping and integrative prioritization implicate new Alzheimer's disease risk genes. Nat Genet 53, 392–402, doi: 10.1038/s41588-020-00776-w (2021). [DOI] [PMC free article] [PubMed] [Google Scholar]
- 10.Bellenguez C et al. New insights into the genetic etiology of Alzheimer's disease and related dementias. Nat Genet 54, 412–436, doi: 10.1038/s41588-022-01024-z (2022). [DOI] [PMC free article] [PubMed] [Google Scholar]
- 11.Douvaras P et al. Directed Differentiation of Human Pluripotent Stem Cells to Microglia. Stem Cell Reports 8, 1516–1524, doi: 10.1016/j.stemcr.2017.04.023 (2017). [DOI] [PMC free article] [PubMed] [Google Scholar]
- 12.Gosselin D et al. An environment-dependent transcriptional network specifies human microglia identity. Science 356, doi: 10.1126/science.aal3222 (2017). [DOI] [PMC free article] [PubMed] [Google Scholar]
- 13.Abud EM et al. iPSC-Derived Human Microglia-like Cells to Study Neurological Diseases. Neuron 94, 278–293 e279, doi: 10.1016/j.neuron.2017.03.042 (2017). [DOI] [PMC free article] [PubMed] [Google Scholar]
- 14.Heinz S et al. Transcription Elongation Can Affect Genome 3D Structure. Cell 174, 1522–1536 e1522, doi: 10.1016/j.cell.2018.07.047 (2018). [DOI] [PMC free article] [PubMed] [Google Scholar]
- 15.Carlin AF et al. Deconvolution of pro- and antiviral genomic responses in Zika virus-infected and bystander macrophages. Proc Natl Acad Sci U S A 115, E9172–E9181, doi: 10.1073/pnas.1807690115 (2018). [DOI] [PMC free article] [PubMed] [Google Scholar]
- 16.Levine KS et al. Virus exposure and neurodegenerative disease risk across national biobanks. Neuron, doi: 10.1016/j.neuron.2022.12.029 (2023). [DOI] [PMC free article] [PubMed] [Google Scholar]
- 17.Sayed FA et al. AD-linked R47H-TREM2 mutation induces disease-enhancing microglial states via AKT hyperactivation. Sci Transl Med 13, eabe3947, doi: 10.1126/scitranslmed.abe3947 (2021). [DOI] [PMC free article] [PubMed] [Google Scholar]
- 18.Olah M et al. Single cell RNA sequencing of human microglia uncovers a subset associated with Alzheimer's disease. Nat Commun 11, 6129, doi: 10.1038/s41467-020-19737-2 (2020). [DOI] [PMC free article] [PubMed] [Google Scholar]
- 19.Mathys H et al. Temporal Tracking of Microglia Activation in Neurodegeneration at Single-Cell Resolution. Cell Rep 21, 366–380, doi: 10.1016/j.celrep.2017.09.039 (2017). [DOI] [PMC free article] [PubMed] [Google Scholar]
- 20.Dolan M-J et al. A resource for generating and manipulating human microglial states in vitro. BioRxiv, 2022.2005.2002.490100 (2022). [Google Scholar]
- 21.Bottcher C et al. Human microglia regional heterogeneity and phenotypes determined by multiplexed single-cell mass cytometry. Nat Neurosci 22, 78–90, doi: 10.1038/s41593-018-0290-2 (2019). [DOI] [PubMed] [Google Scholar]
- 22.Zhou Y et al. Human and mouse single-nucleus transcriptomics reveal TREM2-dependent and TREM2-independent cellular responses in Alzheimer's disease. Nat Med 26, 131–142, doi: 10.1038/s41591-019-0695-9 (2020). [DOI] [PMC free article] [PubMed] [Google Scholar]
- 23.Mostafavi S et al. A molecular network of the aging human brain provides insights into the pathology and cognitive decline of Alzheimer's disease. Nat Neurosci 21, 811–819, doi: 10.1038/s41593-018-0154-9 (2018). [DOI] [PMC free article] [PubMed] [Google Scholar]
- 24.Morabito S et al. Single-nucleus chromatin accessibility and transcriptomic characterization of Alzheimer's disease. Nat Genet 53, 1143–1155, doi: 10.1038/s41588-021-00894-z (2021). [DOI] [PMC free article] [PubMed] [Google Scholar]
- 25.Kosoy R et al. Genetics of the human microglia regulome refines Alzheimer's disease risk loci. Nat Genet 54, 1145–1154, doi: 10.1038/s41588-022-01149-1 (2022). [DOI] [PMC free article] [PubMed] [Google Scholar]
- 26.Ray J et al. Chromatin conformation remains stable upon extensive transcriptional changes driven by heat shock. Proc Natl Acad Sci U S A 116, 19431–19439, doi: 10.1073/pnas.1901244116 (2019). [DOI] [PMC free article] [PubMed] [Google Scholar]
- 27.Jin F et al. A high-resolution map of the three-dimensional chromatin interactome in human cells. Nature 503, 290–294, doi: 10.1038/nature12644 (2013). [DOI] [PMC free article] [PubMed] [Google Scholar]
- 28.Kiani K, Sanford EM, Goyal Y & Raj A Changes in chromatin accessibility are not concordant with transcriptional changes for single-factor perturbations. Mol Syst Biol 18, e10979, doi: 10.15252/msb.202210979 (2022). [DOI] [PMC free article] [PubMed] [Google Scholar]
- 29.Calderon D et al. Landscape of stimulation-responsive chromatin across diverse human immune cells. Nat Genet 51, 1494–1505, doi: 10.1038/s41588-019-0505-9 (2019). [DOI] [PMC free article] [PubMed] [Google Scholar]
- 30.Ghavi-Helm Y et al. Enhancer loops appear stable during development and are associated with paused polymerase. Nature 512, 96–100, doi: 10.1038/nature13417 (2014). [DOI] [PubMed] [Google Scholar]
- 31.Proitsi P et al. Alzheimer's disease susceptibility variants in the MS4A6A gene are associated with altered levels of MS4A6A expression in blood. Neurobiol Aging 35, 279–290, doi: 10.1016/j.neurobiolaging.2013.08.002 (2014). [DOI] [PubMed] [Google Scholar]
- 32.Finucane HK et al. Partitioning heritability by functional annotation using genome-wide association summary statistics. Nat Genet 47, 1228–1235, doi: 10.1038/ng.3404 (2015). [DOI] [PMC free article] [PubMed] [Google Scholar]
- 33.Kichaev G et al. Integrating functional data to prioritize causal variants in statistical fine-mapping studies. PLoS Genet 10, e1004722, doi: 10.1371/journal.pgen.1004722 (2014). [DOI] [PMC free article] [PubMed] [Google Scholar]
- 34.Pickrell JK Joint analysis of functional genomic data and genome-wide association studies of 18 human traits. Am J Hum Genet 94, 559–573, doi: 10.1016/j.ajhg.2014.03.004 (2014). [DOI] [PMC free article] [PubMed] [Google Scholar]
- 35.Mathys H et al. Single-cell transcriptomic analysis of Alzheimer's disease. Nature 570, 332–337, doi: 10.1038/s41586-019-1195-2 (2019). [DOI] [PMC free article] [PubMed] [Google Scholar]
- 36.Marshall JL et al. HyPR-seq: Single-cell quantification of chosen RNAs via hybridization and sequencing of DNA probes. Proc Natl Acad Sci U S A 117, 33404–33413, doi: 10.1073/pnas.2010738117 (2020). [DOI] [PMC free article] [PubMed] [Google Scholar]
- 37.Fernandes S et al. SHIP1 Deficiency in Inflammatory Bowel Disease Is Associated With Severe Crohn's Disease and Peripheral T Cell Reduction. Front Immunol 9, 1100, doi: 10.3389/fimmu.2018.01100 (2018). [DOI] [PMC free article] [PubMed] [Google Scholar]
- 38.Fu Q et al. SHIP1 inhibits cell growth, migration, and invasion in nonsmall cell lung cancer through the PI3K/AKT pathway. Oncol Rep 41, 2337–2350, doi: 10.3892/or.2019.6990 (2019). [DOI] [PubMed] [Google Scholar]
- 39.Hamaoui D & Subtil A ATG16L1 functions in cell homeostasis beyond autophagy. FEBS J 289, 1779–1800, doi: 10.1111/febs.15833 (2022). [DOI] [PubMed] [Google Scholar]
- 40.Dixon JR et al. Chromatin architecture reorganization during stem cell differentiation. Nature 518, 331–336, doi: 10.1038/nature14222 (2015). [DOI] [PMC free article] [PubMed] [Google Scholar]
- 41.Anzalone AV et al. Search-and-replace genome editing without double-strand breaks or donor DNA. Nature 576, 149–157, doi: 10.1038/s41586-019-1711-4 (2019). [DOI] [PMC free article] [PubMed] [Google Scholar]
- 42.Noy PJ et al. TspanC8 Tetraspanins and A Disintegrin and Metalloprotease 10 (ADAM10) Interact via Their Extracellular Regions: EVIDENCE FOR DISTINCT BINDING MECHANISMS FOR DIFFERENT TspanC8 PROTEINS. J Biol Chem 291, 3145–3157, doi: 10.1074/jbc.M115.703058 (2016). [DOI] [PMC free article] [PubMed] [Google Scholar]
- 43.Kleinberger G et al. TREM2 mutations implicated in neurodegeneration impair cell surface transport and phagocytosis. Sci Transl Med 6, 243ra286, doi: 10.1126/scitranslmed.3009093 (2014). [DOI] [PubMed] [Google Scholar]
- 44.Zhong L et al. Soluble TREM2 ameliorates pathological phenotypes by modulating microglial functions in an Alzheimer's disease model. Nat Commun 10, 1365, doi: 10.1038/s41467-019-09118-9 (2019). [DOI] [PMC free article] [PubMed] [Google Scholar]
- 45.Ewers M et al. Increased soluble TREM2 in cerebrospinal fluid is associated with reduced cognitive and clinical decline in Alzheimer's disease. Sci Transl Med 11, doi: 10.1126/scitranslmed.aav6221 (2019). [DOI] [PMC free article] [PubMed] [Google Scholar]
- 46.Franzmeier N et al. Higher CSF sTREM2 attenuates ApoE4-related risk for cognitive decline and neurodegeneration. Mol Neurodegener 15, 57, doi: 10.1186/s13024-020-00407-2 (2020). [DOI] [PMC free article] [PubMed] [Google Scholar]
- 47.Hu WT et al. Higher CSF sTNFR1-related proteins associate with better prognosis in very early Alzheimer's disease. Nat Commun 12, 4001, doi: 10.1038/s41467-021-24220-7 (2021). [DOI] [PMC free article] [PubMed] [Google Scholar]
- 48.Haining EJ et al. The TspanC8 subgroup of tetraspanins interacts with A disintegrin and metalloprotease 10 (ADAM10) and regulates its maturation and cell surface expression. J Biol Chem 287, 39753–39765, doi: 10.1074/jbc.M112.416503 (2012). [DOI] [PMC free article] [PubMed] [Google Scholar]
- 49.Jansen IE et al. Genome-wide meta-analysis identifies new loci and functional pathways influencing Alzheimer's disease risk. Nat Genet 51, 404–413, doi: 10.1038/s41588-018-0311-9 (2019). [DOI] [PMC free article] [PubMed] [Google Scholar]
- 50.Kunkle BW et al. Genetic meta-analysis of diagnosed Alzheimer's disease identifies new risk loci and implicates Abeta, tau, immunity and lipid processing. Nat Genet 51, 414–430, doi: 10.1038/s41588-019-0358-2 (2019). [DOI] [PMC free article] [PubMed] [Google Scholar]
Methods-only reference
- 51.Choi SW & O'Reilly PF PRSice-2: Polygenic Risk Score software for biobank-scale data. Gigascience 8, doi: 10.1093/gigascience/giz082 (2019). [DOI] [PMC free article] [PubMed] [Google Scholar]
- 52.Quinlan AR & Hall IM BEDTools: a flexible suite of utilities for comparing genomic features. Bioinformatics 26, 841–842, doi: 10.1093/bioinformatics/btq033 (2010). [DOI] [PMC free article] [PubMed] [Google Scholar]
- 53.Korsunsky I et al. Fast, sensitive and accurate integration of single-cell data with Harmony. Nat Methods 16, 1289–1296, doi: 10.1038/s41592-019-0619-0 (2019). [DOI] [PMC free article] [PubMed] [Google Scholar]
- 54.Heinz S et al. Simple combinations of lineage-determining transcription factors prime cis-regulatory elements required for macrophage and B cell identities. Mol Cell 38, 576–589, doi: 10.1016/j.molcel.2010.05.004 (2010). [DOI] [PMC free article] [PubMed] [Google Scholar]
- 55.Robinson MD, McCarthy DJ & Smyth GK edgeR: a Bioconductor package for differential expression analysis of digital gene expression data. Bioinformatics 26, 139–140, doi: 10.1093/bioinformatics/btp616 (2010). [DOI] [PMC free article] [PubMed] [Google Scholar]
- 56.Corces MR et al. An improved ATAC-seq protocol reduces background and enables interrogation of frozen tissues. Nat Methods 14, 959–962, doi: 10.1038/nmeth.4396 (2017). [DOI] [PMC free article] [PubMed] [Google Scholar]
- 57.Rosen JD et al. HPRep: Quantifying Reproducibility in HiChIP and PLAC-Seq Datasets. Curr Issues Mol Biol 43, 1156–1170, doi: 10.3390/cimb43020082 (2021). [DOI] [PMC free article] [PubMed] [Google Scholar]
- 58.Love MI, Huber W & Anders S Moderated estimation of fold change and dispersion for RNA-seq data with DESeq2. Genome Biol 15, 550, doi: 10.1186/s13059-014-0550-8 (2014). [DOI] [PMC free article] [PubMed] [Google Scholar]
- 59.Ross-Innes CS et al. Differential oestrogen receptor binding is associated with clinical outcome in breast cancer. Nature 481, 389–393, doi: 10.1038/nature10730 (2012). [DOI] [PMC free article] [PubMed] [Google Scholar]
- 60.Cairns J, Orchard WR, Malysheva V & Spivakov M Chicdiff: a computational pipeline for detecting differential chromosomal interactions in Capture Hi-C data. Bioinformatics 35, 4764–4766, doi: 10.1093/bioinformatics/btz450 (2019). [DOI] [PMC free article] [PubMed] [Google Scholar]
- 61.Yu G, Wang LG, Han Y & He QY clusterProfiler: an R package for comparing biological themes among gene clusters. OMICS 16, 284–287, doi: 10.1089/omi.2011.0118 (2012). [DOI] [PMC free article] [PubMed] [Google Scholar]
- 62.Jiang MZ et al. Canonical correlation analysis for multi-omics: Application to cross-cohort analysis. PLoS Genet 19, e1010517, doi: 10.1371/journal.pgen.1010517 (2023). [DOI] [PMC free article] [PubMed] [Google Scholar]
- 63.Huang L et al. TOP-LD: A tool to explore linkage disequilibrium with TOPMed whole-genome sequence data. Am J Hum Genet 109, 1175–1181, doi: 10.1016/j.ajhg.2022.04.006 (2022). [DOI] [PMC free article] [PubMed] [Google Scholar]
- 64.Sun Q et al. From GWAS variant to function: A study of approximately 148,000 variants for blood cell traits. HGG Adv 3, 100063, doi: 10.1016/j.xhgg.2021.100063 (2022). [DOI] [PMC free article] [PubMed] [Google Scholar]
- 65.Young AMH et al. A map of transcriptional heterogeneity and regulatory variation in human microglia. Nat Genet 53, 861–868, doi: 10.1038/s41588-021-00875-2 (2021). [DOI] [PMC free article] [PubMed] [Google Scholar]
- 66.Van Buren E et al. TWO-SIGMA: A novel two-component single cell model-based association method for single-cell RNA-seq data. Genet Epidemiol 45, 142–153, doi: 10.1002/gepi.22361 (2021). [DOI] [PMC free article] [PubMed] [Google Scholar]
- 67.Zhang B et al. Integrated systems approach identifies genetic nodes and networks in late-onset Alzheimer's disease. Cell 153, 707–720, doi: 10.1016/j.cell.2013.03.030 (2013). [DOI] [PMC free article] [PubMed] [Google Scholar]
- 68.Perez AR et al. GuideScan software for improved single and paired CRISPR guide RNA design. Nat Biotechnol 35, 347–349, doi: 10.1038/nbt.3804 (2017). [DOI] [PMC free article] [PubMed] [Google Scholar]
- 69.Hsu JY et al. PrimeDesign software for rapid and simplified design of prime editing guide RNAs. Nat Commun 12, 1034, doi: 10.1038/s41467-021-21337-7 (2021). [DOI] [PMC free article] [PubMed] [Google Scholar]
- 70.van de Geijn B, McVicker G, Gilad Y & Pritchard JK WASP: allele-specific software for robust molecular quantitative trait locus discovery. Nat Methods 12, 1061–1063, doi: 10.1038/nmeth.3582 (2015). [DOI] [PMC free article] [PubMed] [Google Scholar]
Associated Data
This section collects any data citations, data availability statements, or supplementary materials included in this article.
Supplementary Materials
Data Availability Statement
All datasets used in this study (pcHi-C, ATAC-seq, RNA-seq, scRNA-seq, and HypR-seq) are available under GEO accession number GSE173316. Data can be visualized on the WashU Epigenome Browser using the following session bundle ID: b62e2e70-f64c-11ec-9287-3f211c43000c.


