

Abstract
Folding of the cerebral cortex is a prominent characteristic of mammalian brains. Alterations or deficits in cortical folding are strongly correlated with abnormal brain function, cognition, and behavior. Therefore, a precise mapping between the anatomy and function of the brain is critical to our understanding of the mechanisms of brain structural architecture in both health and diseases. Gyri and sulci, the standard nomenclature for cortical anatomy, serve as building blocks to make up complex folding patterns, providing a window to decipher cortical anatomy and its relation with brain functions. Huge efforts have been devoted to this research topic from a variety of disciplines including genetics, cell biology, anatomy, neuroimaging, and neurology, as well as involving computational approaches based on machine learning and artificial intelligence algorithms. However, despite increasing progress, our understanding of the functional anatomy of gyro-sulcal patterns is still in its infancy. In this review, we present the current state of this field and provide our perspectives of the methodologies and conclusions concerning functional differentiation between gyri and sulci, as well as the supporting information from genetic, cell biology, and brain structure research. In particular, we will further present a proposed framework for attempting to interpret the dynamic mechanisms of the functional interplay between gyri and sulci. Hopefully, this review will provide a comprehensive summary of anatomo-functional relationships in the cortical gyro-sulcal system together with a consideration of how these contribute to brain function, cognition, and behavior, as well as to mental disorders.
Keywords: cortical folding, gyro-sulcal pattern, brain anatomo-function
Introduction
Cortical folding is a hallmark of brain topography whose variability across individuals and groups is strongly coupled with inter-individual and inter-group differences in brain function, cognition, and behavior. Gyri and sulci are the standard nomenclature (Fig. 1) and are usually defined and applied to anatomical domains (Cachia et al., 2003a; Toro and Burnod, 2003). The anatomical and functional relationships between gyri and sulci have not been clearly elucidated. For example, at a coarser resolution of cortical region parcellation, primary sulci have relatively more constant relationships with cytoarchitecture or functional architecture, while the accuracy of this alignment drops for secondary/tertiary sulci on higher-order association cortices involved in complex cognitive functions (Zilles et al., 1997; Roland and Zilles, 1998; Hasnain et al., 2001; Morosan et al., 2001; Fischl et al., 2008; Hinds et al., 2008; Frost and Goebel, 2012). An increasing number of studies over the last decade have therefore investigated, at a finer resolution, whether these two elementary anatomical units could serve as building blocks of cortical morphology and brain function, and whether they could be functionally and cognitively differentiated (e.g. Uddin et al., 2010; Deng et al., 2014; Jiang et al., 2015a, 2018a).
Figure 1:
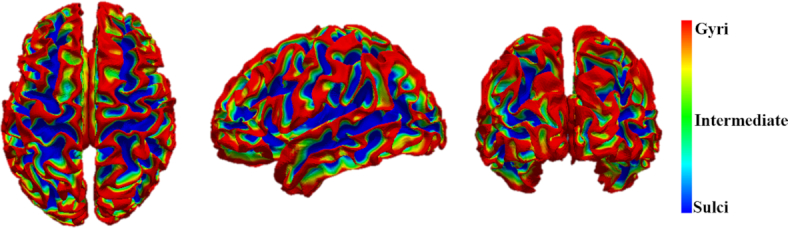
The gyral/sulcal parcellation of cortical surface based on the anatomical information (average convexity in this figure, adapted from Liu et al., 2019). Gyri has larger average convexity than sulci.
It has been demonstrated repeatedly that the local gyro-sulcal morphology of many cortical regions could predict the location of functional activity in adult human brains (Amiez et al., 2006, 2013; Benson et al., 2012; Amiez and Petrides, 2014, 2018; Li et al., 2015; Weiner et al., 2018; Troiani et al., 2020). For instance, the locations of visuomotor eye and hand conditional activity are localized in different sub-regions within the superior precentral sulcus (Amiez et al., 2006). The retinotopic organization of striate cortex can be predicted by surface topology (Benson et al., 2012) and feedback-related activity during exploration is differentially located in the cingulate sulcus and paracingulate sulcus of different individuals (Amiez et al., 2013). There are also three somatotopically organized cingulate motor areas along the cingulate sulcus, each of which is associated with specific morphological features of the cingulate/paracingulate cortex (Amiez and Petrides, 2014). The functional activities of different action controls are localized in different sulci in the posterior lateral frontal cortex (Amiez and Petrides, 2018) and different value signals are localized in different sulcal regions of the orbitofrontal cortex (Li et al., 2015; Troiani et al., 2020). Moreover, local gyro-sulcal morphology can predict the location of functional organization in adult human brains, with the presence/absence of the inferior rostral sulcus and the subgenual intralimbic sulcus influencing inter-participant variability in the ventromedial prefrontal cortex (vmPFC) sulcal morphology, and the vmPFC peak location in the default mode network (Lopez-Persem et al., 2019).
Associations between gyro-sulcal patterns and human behavior have also been demonstrated to investigate brain-behavior relationships as well as neuropsychological correlates of inter-participant cortical folding variations (Fornito et al., 2004; Whittle et al., 2009; Cachia et al., 2018; Yang et al., 2019). For instance, inter-participant differences in paracingulate sulcus asymmetry in healthy males have been shown to be related to individual differences in executive abilities in cognitively demanding tasks (Fornito et al., 2004). The leftward anterior cingulate cortex asymmetry pattern of male early adolescents is associated with individual differences in temperament (Whittle et al., 2009). Adults whose left lateral occipito-temporal sulcus were interrupted by the gyrus in the posterior portion showed better reading fluency than those who had a continuous one, and the greater the interruption, the better was their performance (Cachia et al., 2018). Another study reported more gyral than sulcal regions within the middle frontal cortex, inferior parietal lobe, and visual cortex, for which rs-fMRI signal temporal variability was positively correlated with fluid intelligence (Yang et al., 2019). In addition to studies on adults, one on newborns has reported that there were specific morphological characteristic differences between twins and singletons, as well as between normally developed newborns and those with intrauterine growth restriction. Indeed, these brain morphological measures at birth could predict infants’ cerebral volumes and neurobehavioral development at term-equivalent age (Dubois et al., 2008).
To measure brain functional activity, functional magnetic resonance imaging (fMRI), rather than other techniques including electroencephalography (EEG), magnetoencephalography (MEG), and functional near infrared spectroscopy (fNIRS), has been predominantly adopted for gyro-sulcal functional characteristic studies. This has been due to the development of advanced in vivo fMRI technologies for both high spatial and temporal resolution that can both guarantee accuracy of gyri/sulci localization and measure the bandwidth range of their blood oxygen level dependent (BOLD) signals (Biswal et al., 1995; Logothetis, 2008; Friston, 2009; Van Essen et al., 2013). Gyro-sulcal functional characteristics have been extensively studied during performance of different tasks based on task-based fMRI (t-fMRI) (Logothetis, 2008; Friston, 2009; Barch et al., 2013), or during task-free rest conditions based on resting state fMRI (rs-fMRI) (Biswal et al., 1995; Smith et al., 2013). In addition to the commonly adopted fMRI data in volume space, the Human Connectome Project (HCP) has also publicly released "grayordinate" fMRI data (Barch et al., 2013; Glasser et al., 2013; Smith et al., 2013; Van Essen et al., 2013). The HCP grayordinate data consists of both cortical surface vertices and subcortical voxels of gray matter in the standard MNI152 space, which correspond closely across different individual brains to facilitate group-wise analysis (Glasser et al., 2013). The grayordinate fMRI (including both t-fMRI and rs-fMRI) data is especially suitable for gyro-sulcal functional characteristic studies since the gyri/sulci as well as their fMRI signals are defined on the cortical surface vertices with satisfying accuracy in the grayordinate space (Glasser et al., 2013). In this review, our focus will be on fMRI-based studies since reported findings are substantially more extensive and better established.
This review article will include the following sections: (i) a review of gyral/sulcal definition and labeling scheme in individual brains; (ii) a review of structural substrates for gyro-sulcal functional differences; (iii) a review of the major findings of gyro-sulcal functional differences; (iv) a dynamic functional model of gyri and sulci; and (v) discussion of future research priorities.
Gyral/Sulcal Definition and Labeling Scheme in Individual Brains
Definition of gyri and sulci
In previous studies, gyri and sulci are usually treated as morphological and anatomical nomenclature, and usually defined based on morphological features (Li G. et al., 2009, 2010). For example, in FreeSurfer (Fischl, 2012), a mid-surface is defined such that the displacements of all vertices from their original locations to it are summed to zero. Usually, gyral vertices have negative values (larger average convexity) and sulcal vertices have positive values (Fig. 1). An alternative approach is labeling sulci and gyri via matching individual images to a gyro-sulcal atlas. This approach has caught the attention of neuroscientists since the pioneering work of Brodmann (1909), which demonstrates that architectonic/functional boundaries align with sulci on human brains (Watson et al., 1993; Roland and Zilles, 1994; Tzourio-Mazoyer et al., 2002; Fischl et al., 2008). Although this anatomy–function relation is less pronounced in secondary and tertiary cortices across participants due to great inter-individual variabilities in folding geometry (Fischl et al., 2008; Onoet al., 1990), major sulci and gyri, which develop earlier, have usually been used as anatomical proxies, or landmarks, to align macroscale functional regions. It is worth noting that biological definition and delineation of gyral and sulcal regions, as well as the transition area of gyral wall, warrants extensive studies in the future.
Methods for sulci/gyri labeling
In general, there are two main methods for sulci/gyri labeling. The first method uses deformable registration to warp the labeled sulci/gyri on template to a single subject (Behnke et al., 2003; Desikan et al., 2006). Most of these registration methods were traditionally designed to achieve automatic volumetric alignment but do not constrain cortices to align (Talairach and Szikla, 1967; Woods et al., 1998; Johnson and Christensen, 2002; Shen and Davatzikos, 2003; Joshi et al., 2007). With an increasing interest in cortex, many recent registration approaches have been performed on the entire cortical surface, rather than volumes, to align shape metrics such as curvature and sulcal depth (Fischl et al., 1999; Tosun, Rettmann and Prince, 2004; Goebelet al., 2006). These methods, aiming at the alignment of the entire volume or cortical surface, however, could lead to misalignment of cortical landmarks of interest such as sulci/gyri (Pantazis et al., 2010). Therefore, in a second method, manually or automatically identified landmarks, such as sulci/gyri, have been explicitly used to constrain the registrations of volumes and surfaces (Thompson and Toga, 1996; Davatzikos, 1997; Joshi and Miller, 1997; Collins et al., 1998; Van Essen et al., 1998; Thompson et al., 2000; Hellier and Barillot, 2003; Glaunes et al., 2004; Van Essen, 2005; Desikan et al., 2006; Joshi et al., 2007). These methods have thus demonstrated achievement of direct improvement of the cross-subject correspondence for landmarks (Desai et al., 2005; Pantazis et al., 2010).
In addition to the registration methods, there are studies that directly identify and label sulci/gyri in individual spaces from volumes and cortical surfaces (Mangin et al., 1995; Goualher et al., 1997; Lohmann, 1998; Lohmann and von Cramon, 2000; Zhou et al., 1999; Rivière et al., 2002; Rettmann et al., 2002; Kao et al., 2007; Li G et al., 2009, 2010). These methods preserve inter-individual variability to the best extent, especially for the secondary and tertiary sulci/gyri, but still might need additional steps (possibly registration methods) before or after the labeling in individual space to estimate cross-subject correspondence (Joshi et al., 2012).
In summary, these sulci/gyri labeling methods were developed on a prerequisite that these anatomic landmarks align well with brain cytoarchitecture and functions such that they can be used as a proxy. However, such a relationship is variable in more developed higher-order cortices (Ono et al., 1990; Cachia et al., 2003b; Fischl et al., 2008), which have abundantly more variable secondary and tertiary cortical folding that could often produce misalignment across participants or unsatisfactory labeling in individual spaces. Therefore, a fundamental improvement could possibly be achieved by exploring a more precise and higher-resolution mapping between folding patterns and brain cytoarchitecture or brain functions.
Structural Substrates for Gyro-Sulcal Functional Differentiation
Neuronal processes and gyro-sulcal pattern development
The developing brain undergoes a number of complicated and inter-related neuronal processes (Smart et al., 2002; Betizeau et al, 2013; Borrell and Götz, 2014; Florio and Huttner, 2014; Lewitus et al, 2014; Taverna et al., 2014). Many of these processes have been demonstrated to be relevant to cortical folding and even to specific gyral/sulcal patterns (Noctor et al., 2004; Englund et al., 2005; Fietz et al., 2010; Hansen et al., 2010; Reillo et al., 2011; Wang et al., 2011; Reillo and Borrell, 2012; Betizeau et al., 2013; Pilz et al., 2013; de Juan Romero and Borrell, 2015; Johnson et al., 2015). In particular, the abundance of basal radial glia cells (bRGCs) in the outer subventricular zone (oSVZ) is suggested to be tangentially heterogeneous (Borrell and Gotz, 2014), such that an increase in bRGC number in local areas gives rise to the fanning-out of a radial fiber scaffold and dispersion of radially migrating neurons, leading to a gyrus-like structure in the corresponding locations in the cortical plate while the germinal layers remain unfolded (Fietz et al., 2010; Hansen et al., 2010; Reillo et al., 2011; Wang et al., 2011; Pilz et al., 2013; Stahl et al., 2013; Borrell and Götz, 2014; Gertz and Kriegstein, 2015). The regulation of basal progenitor heterogeneity in the fetal phase persists in the mature stage. Gyri also have a relatively higher absolute cortical thickness and total neuron number, especially in the deep cortical layers (V + VI) (Hiletag and Barbas, 2005).
However, it is still unclear whether the timing of abundance of progenitors in oSVZ is concordant with that of gyrogenesis (Kroenke and Bayly, 2018), because the cerebrum is still lissencephalic when neurogenesis is complete around embryonic day (E) 90 (Rash et al., 2019). In this regard, other processes, such as gliogenesis, axonogenesis, and myelinogenesis are also correlated with the development and growth of cortical folding (Chi et al., 1977; Huang et al., 2009; Takahashi et al., 2010, 2012; White et al., 2010; Dubois et al., 2014; Hagemeyer et al., 2017; Rash et al., 2019). Taking gliogenesis as an example, as the oSVZ grows, more astrocytes and oligodendrocytes are produced than neurons until after E125, which coincides with the formation of white matter cortical connections and the onset of gyrification (∼E100–E125). Nevertheless, the contribution of gliogenesis alone may be insufficient to induce cortical folding and may additionally need to be considered jointly considered with axonogenesis (Rash et al., 2019). Axonogenesis has been relatively better studied and is more closely related to cortical folding, not only due to its concomitant occurrence with gyrification (Huang et al., 2009; White et al., 2010; Takahashi et al., 2012; Dubois et al., 2014), but also due to abundant direct support from observations that manipulations of axon growth lead to massive alterations in gyrification patterns (Rakic, 1988).
Neuronal processes and gyro-sulcal functional differentiation
The heterogeneity in neuron distribution (Hiletag and Barbas, 2005) and axon distribution (Huang et al., 2009; Takahashi et al., 2012; Ouyang et al., 2017), induced by the processes described in the section of 'Neuronal processes and gyro-sulcal pattern development', is related to gyro-sulcal functional differentiation. Within the cortex, somata and arbors of pyramidal neurons are stretched in gyri and compressed in sulci due to the heterogeneity in neuron numbers (Hiletag and Barbas, 2005), resulting in different lengths of apical segments. Identical neurons with different lengths of apical segments have been demonstrated to produce different types of action potentials (Fig. 2A, Hiletag and Barbas, 2005). Thus, differences in dendrite morphology between sulci and gyri result in putative functional differences in attenuation of excitatory postsynaptic potentials, and possibly provide a fundamental explanation for gyro-sulcal differences in fMRI signal time-frequency characteristics outlined in the section of 'Gyro-sulcal functional activity time-frequency differences'.
Figure 2:

(A) A low magnification overview of coronal sections through 8AD (area 8 of cortex, anterodorsal part) and 8B (area 8B of cortex) in the rhesus monkey prefrontal cortex. Tissue was processed for SMI-32, which labels largely pyramidal neurons in cortical layers II + III and V + VI. (A1)–(A3) High magnification views of layer V and II at the gyral crest and gyral wall in 8AD, and sulcal fundus in 8B. Arrowheads highlight the neurons of typical morphologies. Elongated dendritic arbors and cell bodies are observed in (A1) and (A2) while tangentially oriented dendrites and flattened cell bodies are observed in (A3). (B) A low magnification overview of coronal section through 8AD and 8B. Weil's stain was applied to the tissue, where the myelin sheaths are stained dark blue. (B1)–(B3) High magnification views of boundaries between white matters and gray matters at gyral crest and gyral wall in 8AD, and sulcal fundus in 8B. Arrowheads in (B1) and (B2) highlight the myelin sheaths that radially oriented across the boundaries. Such myelin sheaths are barely seen in (B3), where myelin sheaths tangentially course along the sulcal fundus. These data in (A) and (B) were available at http://brainmaps.org (Mikula et al., 2007). (C) White matter axonal wiring patterns between gyri and sulci. Left column: maximum principal curvature (CUR) and diffusion tensor imaging (DTI) derived white matter fiber density (FD) were mapped to the cortical surface as references. Middle: illustration of DTI fiber connection strength between precentral gyri (PCG, postcentral gyri (POG), central sulcus (CS), and postcentral sulcus (POS) on two hemispheres. Line thickness indicates the connection strength. Right: DTI fiber connections between PCG, POC, CS, and POS in detail. The red, white, green, and blue bubbles represent the regions of interest (ROI) on PCG, POG, CS, and POS, respectively. Lines between ROI as well as the colors indicate the presence of connections and their strength. These figures in the middle and the right panels were adapted from Deng et al., 2014. (D) Left: cortical thickness (CT) and graphic metrics, including the degree (DEG), strength (STR), efficiency (EFF), betweenness (BET), and participation (PAR) of a structural connective network mapped to a white matter cortical surface. Right: comparison between gyri and sulci regarding the metrics in (C) and (D). These figures are adapted from Zhang et al., 2020.
Axonal transmission of action potentials is a key component of communication between neurons and a variety of theories have been proposed to interpret the contribution of axons to gyro-sulcal patterns and their related functional architecture (Van Essen, 1997; Xu et al., 2010; Nie et al., 2012; Budde and Annese, 2013; Chen et al., 2013; Zhang et al., 2014). In Van Essen, 1997, axons were found to be under a form of tension and assumed to pull cortical regions closer to each other. The cortical regions being pulled became gyral walls or sulci, leaving the other interleaved cortical regions with weaker axonal connections as gyri. Although tension along axons has been demonstrated by microdissection, the axons, as shown in Fig. 2B, were aligned circumferentially beneath the sulcal depth and radially inside gyri (Xu et al., 2010). Such a spatial relation between axons and gyro-sulcal patterns, which has gained support from both microscale (Budde and Annese, 2013) and macroscale observations (Nie et al., 2012; Zhang et al., 2014), is, however, not consistent with the proposed caudal effects of axon tension on folding in Van Essen(1997). Despite the spatial relation argument, there might nevertheless be a consensus that axonal wiring patterns are different between gyri and sulci. Also, axonogenesis is unlikely to be the only driving force for cortical folding since other neuronal maturation and mechanical processes could make significant contributions (Bayly et al., 2013; Ronan et al., 2014; Razavi et al., 2015; Zhang et al., 2016, 2017).
More importantly, the different axonal wiring patterns between gyri and sulci suggest that they may play different functional roles (Van Essen, 1997; Deng et al., 2014; Zhang et al., 2020). According to parsimonious principles of brain development (Chklovskii et al., 2002; Laughlin and Sejnowski, 2003; Bullmore and Sporns, 2012), Van Essen (1997) has proposed that cortical regions connected by denser axons are pulled closer to each other, such that the information communication and wiring construction costs are reduced. However, the cortico-cortical axon wiring diagram in this theory seems to consist of repeated units: cortical pairs connected by axons. If the axon-tension solution for wiring optimization is applied to all units, however, there would only be short-range connections over the entire cortex. In fact, many studies have reported the presence of considerable number of long-range axons, and that the nature of the axon wiring diagram is a "small-world" or "rich-world" network rather than a composition of repeated units linked by local short-range axons (Watts and Strogatz, 1998; He et al., 2007; van den Heuvel and Sporns, 2011; van den Heuvel et al., 2012). Brain networks allow the presence of long-range connections between gyri (Xu et al., 2010; Nie et al., 2012; Budde and Annese, 2013; Chen et al., 2013; Deng et al., 2014; Zhang et al., 2014), which are distant from one other. Regarding cortical folding patterns, long-range gyro-gyral white matter connections have been demonstrated to be stronger than gyro-sulcal and sulco-sulcal ones (Fig. 2C, Nie et al., 2012; Deng et al., 2014). These long-range gyro-gyral connections introduce a higher wiring cost but this can be offset by their higher capacity as shortcuts in reducing communication steps and upgrading global integration in brain networks (Kaise and Hilgetag, 2006). In this sense, denser gyro-gyral long-range connections might endow gyri with a plausible role as "hubs" of a structural network, which has been demonstrated in Zhang et al. (2020) (Fig. 2D), and will be revealed by functional connectivity/network analyses in the section of 'Gyro-Sulcal Functional Differences from Various Perspectives'.
Support from cross-species comparative studies on brain structure
The complexity of cortical convolution increases generally along the phylogenetic tree and is usually related to species intelligence (Roth and Dicke, 2005). Thus, identifying species-preserved and -specific anatomy and function is a unique and important approach to understanding the development of cortical folding, as well as its relation to structural and functional architectures (Orban et al., 2004; Rilling et al., 2008; de Schotten et al., 2012; Chen et al., 2013; Zhang et al., 2013; Zhang et al., 2014; Li et al., 2017; de Schotten et al., 2019; Eichert et al., 2020).
By limiting our interests to gyro-sulcal patterns, we have found that denser long-range axons between gyri in the section of 'Neuronal processes and gyro-sulcal functional differentiation' are preserved across humans and other primate species such as chimpanzees, macaques, and marmosets (Nie et al., 2012; Chen et al., 2013; Zhang et al., 2014; Li et al., 2020a), as well as in other mammalian species such as ferrets (Xu et al., 2010) and even mice (cerebellum, Zeng et al., 2015). In addition, cross-species comparative studies have revealed that U-shaped short-range fibers coursing along sulcal fundi comprise a larger portion of the human brain relative to that of chimpanzees and macaques (Zhang et al., 2014). In Chen et al.(2013) the elaboration and complexity of gyral folding increases from macaque to human and is positively correlated with an increase in the complexity of axons connected to these gyri. These observations have led to a hypothesis that gyral folding and fiber connection patterns "co-evolve" in primate brainsl (Chen et al., 2013). This co-evolution of gyral folding and fiber connection patterns is also related to the evolution of brain function. For example, de Schotten et al. (2012) and Rilling et al. (2008) found major differences between human and non-human primates in the arcuate fasciculus that may underlie language function. A graph analysis in Zhang et al. (2020) has also revealed that, in contrast to sulci, gyri play an increasingly important role in core cortico-cortical networks across non-human and human primates. Taken together, these cross-species studies, although in their infancy, suggest that gyro-sulcal patterns are critical to cortical adaption along the phylogenetic tree and strongly related to the evolution of brain structural/functional organization, cognition, and behavior (Roth and Dicke, 2005; Eichert et al., 2020).
Gyro-Sulcal Functional Differences from Various Perspectives
By adopting the methods of sulci/gyri definition and labeling in individual brains in the section of 'Gyral/Sulcal Definition and Labeling Scheme in Individual Brains' and further co-registering the individual volumetric fMRI to the structural data, the fMRI signals of gyri/sulci in the volume space were mapped and separated (Deng et al., 2014). The fMRI signals of gyri/sulci in the cortical space were also separated via mapping the co-registered fMRI signals onto the cortical surface or directly adopting the HCP grayordinate fMRI data.
Gyro-sulcal functional activity time-frequency differences
The human brain is considered to be a multi-frequency oscillation system (Deco et al., 2017), in which high-frequency activity may reflect local domain cortical processing, and low-frequency activity synchronization across distributed brain regions (von Stein and Sarnthein, 2000; Buzsáki and Draguhn, 2004; Canolty and Knight, 2010; Siegel et al., 2012; Buzsáki et al., 2013). While the conventional temporal resolution of fMRI with a repetition time (TR) of 2 s corresponding to a sampling frequency of 0.5 Hz has warranted the gyro-sulcal functional activity time-frequency analysis without bias (Zhang et al., 2018a; Ge et al., 2019), the development of in vivo fMRI techniques has significantly improved fMRI signal temporal resolution and further facilitated the analysis in wider frequency bands of brain activity. For example, the HCP fMRI data (Barch et al., 2013; Smith et al., 2013) has a TR of 0.72 s corresponding to a sampling frequency of 1.39 Hz, which covers multiple frequency bands of brain activity (0.01–0.027, 0.027–0.073, 0.073–0.198, 0.198–0.5, and 0.5–0.69 Hz) based on previous electrophysiological studies (Penttonen and Buzsáki, 2003; Buzsáki et al., 2013). Investigating the potential time-frequency differences between gyro-sulcal fMRI signals has therefore received increasing interest.
Fast Fourier transformation has commonly been used in previous studies for calculating the power spectrum of gyral/sulcal signals (Zhang et al., 2018a; Ge et al., 2019; Liu et al., 2019; Jiang et al., 2020). The power spectrum distribution characteristics across different frequency bands, as well as other measures (e.g. "1/f" characteristic of the power spectral density plot) have been analyzed and compared between gyro-sulcal signals (Zhang et al., 2018a; Ge et al., 2019; Liu et al., 2019; Jiang et al., 2020). Wavelet entropy (Mallat, 1989; Coifman and Wickerhauser, 1992; Daubechies, 1992; Sang et al., 2011) analysis has also been used (Liu et al., 2019), which quantifies the degree of temporal signal complexity, with higher entropy indicating a more complex signal temporal pattern (Sang et al., 2011).
With the rapid development of deep learning techniques (LeCun et al., 2015) in medical image analysis studies (Litjens et al., 2017; Shen et al., 2017), the convolutional neural network (CNN) has also been adopted for gyral/sulcal fMRI signal analysis given its ability in learning meaningful and discriminative features from raw data as well as class-specific and nonlinearly distributed features of signals in different frequency scales (Golik et al., 2015; Zhou et al., 2016; Huang et al., 2017). Liu et al. (2019) performed one of the earliest studies using a CNN-based classifier to reveal differences in gyro-sulcal functional activities based on HCP grayordinate rs-fMRI and t-fMRI BOLD signals. In another study (Zhang et al., 2018a), the CNN-based classification model was modified by adding more convolution layers to improve the classification accuracy of volumetric fMRI data. Macaque rs-fMRI data was also used for cross-species studies (Zhang et al., 2018a). In a recent study (Ge et al., 2019), the CNN-based model was adopted on both healthy people and autism spectrum disorder (ASD) patients. Finally, a more recent study (Jiang et al., 2020) adopted a region-specific one-dimensional CNN model to investigate the characteristics of such gyro-sulcal functional activity differences within each brain region instead of in the whole brain.
The gyral and sulcal t-fMRI/rs-fMRI signals (TR ranges from 0.72 to 2 s) can be effectively differentiated based on the proposed time-frequency-based analysis as well as deep-learning-based approaches (Zhang et al., 2018a; Ge et al., 2019; Liu et al., 2019; Jiang et al., 2020). Moreover, as shown in Fig. 3A, the sulcal t-fMRI/rs-fMRI signals have been found to have more diverse temporal patterns as well as higher frequency than gyral signals at the whole-brain level (Zhang et al., 2018a; Ge et al., 2019; Liu et al., 2019), which has been validated by an independent wavelet entropy analysis (Liu et al., 2019). A recent study (Jiang et al., 2020) further found that gyral/sulcal signals could be differentiated within each brain region, and that gyral/sulcal temporal patterns have different frequency scale characteristics across different brain regions.
Figure 3:

Summary of gyro-sulcal functional differences. (A) Gyro-sulcal functional activity time-frequency difference. The average power spectrum of gyral and sulcal temporal patterns is shown in the seven t-fMRI data sets from the HCP, which is adapted from Liu et al. (2019). (B) Gyro-sulcal functional connectivity/interaction difference. The left sub-figure shows the gyro-sulcal functional connectivity (black edges) within the primary motor and somatosensory system. Thicker edges represent stronger connections. The middle sub-figure shows the gyro-sulcal functional connectivity patterns of one example participant. The red, white, green, and blue bubbles represent the ROI on PCG, POG, CS, and POS, respectively. The edges are colored based on the functional connectivity strength. The left and middle sub-figures are adapted from Deng et al. (2014). The right sub-figure shows the graph-theory-based property difference of gyro-sulcal functional connectivity, which is adapted from Liu et al. (2017). (C) Gyro-sulcal functional network spatial overlap pattern difference. The static gyro-sulcal overlap pattern difference across multiple tasks is adapted from Jiang et al. (2015a). The temporal dynamics of gyro-sulcal overlap pattern difference in Emotion task from the HCP is adapted from Jiang et al. (2018a). (D) Gyro-sulcal functional signal representation accuracy difference. The gyro-sulcal signal representation residual is shown across the eight fMRI from the HCP, which is adapted from Zhao et al. (2020).
Gyro-sulcal functional connectivity/interaction differences
Functional connectivity (FC) is used to characterize functional integration and is defined as statistical dependencies among remote brain regions (Friston, 2011). One of the most commonly used measures of FC is the Pearson correlation coefficient (PCC), which calculates the temporal correlation of fMRI BOLD signals between voxels or brain regions (Fox and Raichle, 2007). A larger coefficient value represents stronger FC, and vice versa.
Deng et al. (2014) performed one of the earliest FC studies to investigate gyro-sulcal FC differences. They first focused on the primary motor and somatosensory systems as a test bed example, since these systems are proven to be structurally and functionally connected (Kandel et al., 2000). It has been found that within the primary motor and somatosensory systems, including four gyral regions (bilateral precentral gyrus and postcentral gyrus) and four sulcal regions (bilateral central sulcus and postcentral sulcus), the rs-FC strength is strong between gyro-gyral regions, moderate between gyro-sulcal regions, and weak between sulco-sulcal regions (Fig. 3B). Deng et al. (2014) further performed whole-brain analysis based on the A-DICCCOL (anatomy-guided dense individualized and common connectivity-based cortical landmarks) system (Jiang et al., 2015b), which defined 555 cortical landmarks on 68 major gyral/sulcal regions in the whole cerebral cortex, and obtained a similar gyro-sulcal rs-FC difference. In another study (Liu et al., 2017), the task-based FC was calculated using the PCC of t-fMRI temporal patterns between any pair of gyral/sulcal components, and found to be stronger in gyro-gyral than in sulco-sulcal regions in the whole brain across the seven different tasks of the HCP. In addition to investigating static FC by averaging scan-length rs-fMRI/t-fMRI time series (Deng et al., 2014; Liu et al., 2017), the temporal-varying dynamic FC differences between gyri and sulci have also been explored (Yang et al., 2019). The FC dynamic temporal variability within or between brain regions has been extensively demonstrated (Gilbert and Sigman, 2007; Chang and Glover, 2010; Smith et al., 2011; Calhoun et al., 2014; Li et al., 2014; Ou et al., 2014; Yuan et al., 2018). In Yang et al., 2019, the rs-fMRI BOLD signals were divided into non-overlapping time windows, and the temporal-varying FC dynamics of each gyral/sulcal region assessed by means of calculating the variance of the PCC of BOLD signals between any pair of time windows, to allow differences between gyri and sulci to be examined. It has been found that the dynamic temporal variance of the rs-fMRI signal was larger in gyral than in sulcal regions in the whole brain (Yang et al., 2019). Instead of assessing the FC between gyro-sulcal regions directly (Deng et al., 2014; Liu et al., 2017; Yang et al., 2019), another study explored the differential FC of gyri/sulci with other brain regions (Uddin et al., 2010). It has been found that the angular gyrus and the intraparietal sulcus, which are a part of the inferior parietal lobule, have differential rs-FCs with other brain regions (Uddin et al., 2010). Other measures have also been used to characterize functional interaction by quantifying the temporal correlation of fMRI signals. (Li et al., 2013) adopted a cross wavelet transform to measure the functional interaction between two regions. The functional interaction strength was defined as the locations where both signals shared high co-power in the time-frequency domain, and the gyro-sulcal difference was then obtained (Li et al., 2013).
Based on the FC/functional interaction network among gyral/sulcal regions, some studies have further adopted graph theory-based properties (Bullmore and Sporns, 2009; Rubinov and Sporns, 2010) to investigate the functional integration/segregation of such FC/functional interaction networks as well as their differences between gyri and sulci (Li et al., 2013; Deng et al., 2014; Liu et al., 2017). First, the FC/functional interaction networks were constructed within gyral/sulcal/mixed (both gyral and sulcal) brain regions, respectively. Second, certain graph theory-based properties such as edge degree, global efficiency, modularity, small-worldness, etc. were measured and compared among those networks. It has been found that the resting state functional interaction network composed of gyral regions has higher global and local economical properties, and stronger small-worldness and functional interaction strength than the sulcal network (Li et al., 2013). Within the rs-FC network, the graph edge degree of the gyral regions is significantly higher than that of the sulcal regions (Deng et al., 2014). Liu et al.(2017) have found that the FC network composed of gyral regions has higher average cluster coefficients and global efficiency than those of sulcal regions in both rs-fMRI and the seven t-fMRI data (Fig. 3B). In terms of modularity property, the sulcal network is significantly higher than the gyral one in t-fMRI but not rs-fMRI data (Liu et al., 2017).
Gyro-sulcal functional network spatial overlap pattern differences
The functional network spatial overlap pattern is defined as the set of brain regions that are spatially overlapped and involved in multiple brain networks. Previous studies have demonstrated extensively that there are multiple spatially overlapped brain functional networks that are interacting with each other (Bullmore and Sporns, 2009; Lv et al., 2014, 2015). The functional network spatial overlap pattern thus represents the higher-order brain regions that are involved in multiple cognitive tasks.
Sparse coding has been widely used for rs-fMRI and t-fMRI analysis to infer brain functional characteristics including the functional network spatial overlap pattern (Abolghasemi et al., 2015; Lv et al., 2014, 2015). The whole-brain fMRI BOLD signals are denoted as a matrix X = [x1, x2, …, xn] ∈ ℝt × n, in which xn is the fMRI BOLD signal of voxel n normalized to zero mean and standard deviation of 1 (Mairal et al., 2010), t is the length of the fMRI signal. By applying the online dictionary learning/sparse coding approach (Mairal et al., 2010), X is represented as
 |
(1) |
where D = [d1, d2, …, dm] ∈ ℝt × m (m denotes dictionary size, m > t and m<<n) is an over-complete dictionary matrix, α = [α1, α2, …, αn] ∈ ℝm × n is a sparse coefficient matrix, and ε is error term. Each fMRI signal xi is represented as  = D × αi + ε. Note that each column of D (dm) is a basis functional temporal pattern which is representative of whole-brain fMRI BOLD signals, and each row of α represents the spatial pattern of the functional network that corresponds to the basis temporal pattern. The meaningful functional network spatial overlap patterns can then be effectively identified (Zhang W. et al., 2019).
Using sparse coding approaches, Jiang et al. (2015a) characterized task-based heterogeneous functional regions (THFRs), which represented those higher-order brain regions involved in multiple cognitive tasks, based on all identified task-evoked and intrinsic functional network patterns. It has been found that both task-evoked and intrinsic connectivity functional networks can be effectively and robustly identified across the seven different t-fMRI of HCP grayordinate data (Jiang et al., 2015a). Moreover, the THFRs are located more on gyral than on sulcal regions within the bilateral parietal lobe, frontal lobe, and visual association cortices across different t-fMRI data (Fig. 3C). To further investigate the temporal dynamics of THFRs [i.e. spatial overlap patterns of functional networks (SOPFNs)] on gyri/sulci, SOPFNs and their spatial distribution proportion on gyri/sulci were identifed based on t-fMRI data within each sliding time window (Jiang et al., 2018a). It has been shown that the SOPFNs are also located more on gyral than on sulcal regions within bilateral parietal lobe, frontal lobe, and visual association cortices within each time window, and it is of interest that there is variability in the SOPFNs distribution percentage between gyri and sulci across different time windows (Fig. 3C). Specifically, the SOPFNs distribution percentage value of gyral regions was increased and achieved a peak value during the task blocks of block design t-fMRI, while that of sulcal regions was decreased and reached a trough value during the task blocks. When the task paradigm was changed from a task block to a resting state block, the SOPFNs distribution percentage was decreased from the peak for gyral regions and increased from the trough for sulcal regions, and achieved relatively the same percentage before starting the next task block (Jiang et al., 2018a). These findings were also consistent across the seven different block design t-fMRI of HCP grayordinate data (Jiang et al., 2018a).
Gyro-sulcal functional signal representation accuracy differences
The fMRI signal representation accuracy is defined as the PCC between the original signal xi and the represented signal  based on Equation (1) (Jiang et al., 2018b). Since sparse coding approaches can compactly represent the original fMRI BOLD signals using the identified small number of basis functional temporal patterns and corresponding functional network patterns, a larger PCC value indicates better representation of xi as well as better participation of xi in the neural function during a specific task.
Using nine intrinsic functional networks including default mode, visual, motor, auditory, executive control, and bilateral frontal/parietal networks (Smith et al., 2009), Jiang et al. (2018b) assessed and compared the signal representation of emotion processing t-fMRI data between gyral and sulcal regions within each of the nine networks. It has been found that during the emotion processing, gyral regions have better signal representation accuracy than sulcal regions within the nine intrinsic functional networks. In another recent study (Zhao et al., 2020), the signal representation accuracy was defined as the residual between the original signal xi and the represented signal  . Inversely, a smaller value of the residual indicates better representation of xi. The signal representation accuracy was further assessed and compared between gyral and sulcal regions within the nine intrinsic functional networks under both the resting state and seven different assessment tasks including assessment of emotions, gambling, language, motor skills, relational skills, social skills, and working memory from the HCP. The variability magnitude of such gyro-sulcal differences was also assessed across different tasks/resting state and in intrinsic functional networks (Fig. 3D). It has been found that gyral regions consistently have better signal representation accuracy than sulcal regions within all nine intrinsic functional networks across all seven different t-fMRI of HCP grayordinate data. Moreover, the magnitudes of such gyro-sulcal differences vary across resting state/tasks and intrinsic functional networks. Specifically, in the resting state and "low-demand" tasks such as motor tasks, the gyro-sulcal signal representation accuracy contrast values are lowest and more consistent within the nine intrinsic networks as well as the whole-brain level across different participants. On the contrary, the gyro-sulcal contrast is higher in “high-demand" tasks, such as language and social and working memory, and less consistent across different participants. Moreover, the gyro-sulcal signal representation accuracy contrast is more pronounced within the default mode and executive control networks compared to the other intrinsic functional networks in all seven tasks, while it is the lowest within the sensorimotor network across all tasks (Zhao et al., 2020).
A Dynamic Functional Model of Gyri and Sulci
We have previously proposed a functional model of gyri and sulci at the whole-brain level (Deng et al., 2014) (Fig. 4B) and within functional networks (Jiang et al., 2018b) (Fig. 4D): individual gyri exchange information with other distant gyri through long-range fibers and with neighboring sulci through short-range fibers, while individual sulci exchange information directly with neighboring gyri through short-range fibers and indirectly with other regions through the neighboring gyri.
Figure 4:

Proposed functional models of gyri and sulci in previous studies. (A) The gyri/sulci defined in the whole-brain; (B) the proposed functional model of gyri and sulci at the whole-brain scale; and (C) an example of a motor functional network with two ROI. Each ROI consists of gyri and sulci. (D) The proposed functional model of gyri and sulci within functional networks.
However, this model does not explicitly explain how the interplay between gyri and sulci or their resulting dynamic interactions occurs. In this review, we would therefore like to propose a dynamic functional model of gyri and sulci as illustrated in Fig. 5, in which the involvement of gyri and sulci in global functional networks is dynamically balanced analogous to an activator–inhibitor system (Turing, 1952; Meinhardt and Gierer, 1974; Nakamasu et al., 2009; Yagi, 2009). The gyro-sulcal functional differences summarized in the section of 'Gyro-Sulcal Functional Differences from Various Perspectives' and Figs 3 and 4 from various perspectives are the foundation of this dynamic model. Compared with sulci, gyri have less diverse temporal patterns as well as lower frequency of fMRI signals, higher static or dynamic resting state/task-based FC, different graph-theory-based properties (higher global/local economical properties, graph edge degree, average cluster coefficient, and global efficiency; stronger small-worldness, and functional interaction), a greater distribution of THFRs and SOPFNs, and a higher signal representation accuracy. In the dynamic model in Fig. 5, when the task in a block design t-fMRI is loaded onto brain networks the gyri are activated. The SOPFNs distribution percentage of gyri begins to increase and achieves a peak value analogous to an activator since gyri are hypothesized to be the global functional center, while that of sulci begins to be inhibited to decrease and reach a trough value (Fig. 5B). When the task load is removed and the next resting state block starts, the excitatory and inhibitory effects vanish. The SOPFNs distribution percentage of gyri begins to drop from the peak point, while that of sulci begins to increase from the trough, until achieving relatively the same SOPFNs distribution percentage by the end of the resting state block (Fig. 5A). Such a gyro-sulcal dynamic balancing procedure then repeats when the next task block starts (Jiang et al., 2018a). The excitatory and inhibitory effects can be regulated by strong gyro-gyral functional connections and weak gyro-sulcal ones, analogous to an activator-inhibitor regulation system (Turing, 1952; Meinhardt and Gierer, 1974; Nakamasu et al., 2009; Yagi, 2009), underpinned by long-range and short-range axons, respectively, as illustrated in the model in Fig. 4.
Figure 5:

(A) and (B) An illustration of the dynamic functional model of gyri and sulci, at resting state (A) and during task performance (B). Two ROI as well as their connections are used to represent the whole-brain network. Areas of the gyri and sulci within each ROI illustrate the degree of involvement in global networks. The thickness of the double-head arrows illustrate the excitatory (thick) and inhibitory (thin) effects, putatively regulated by functional connections. (C) The degrees of involvement in global networks of gyri (red) and sulci (blue) during a task performance (Jiang et al., 2018a).
As a substrate for the dynamic model, long-range connections and short-range connections are needed to coincide in the axonal system. We have discussed the presence of long-range association projections in the section of 'Neuronal processes and gyro-sulcal functional differentiation', which are usually radial to the cortical surface of two remote gyri. The presence of a short-range axonal system, the connections of which are between two neighboring gyri and superficial to and parallel with the cortical surface, has also been demonstrated (Bullmore and Sporns, 2009; Sepulcre et al., 2010; Reveley, et al., 2015; Yoshino et al., 2020). Although the regulation mechanisms of long- and short-range axons in the dynamic model are still far from being clear, some studies have shown some progress toward achieving this goal. The functional network segregation is suggested to be driven by the abundance of short-range axons (Cao et al., 2017) while the long-range ones are involved in global information integration (Gao et al., 2009). A precise balance between the decreased short-range axon numbers and increased long-range axon numbers from 2 to 7 years in humans (Ouyang et al., 2017) has been shown to be positively associated with the reconfiguration of a developmental functional connectome from segregation to integration (Fair et al., 2009). A disturbance of this balance could result in brain disorders, such as hyperconnectivity for ASD and hypoconnectivity for schizophrenia (SZ) (Ouyang et al., 2017).
It is noteworthy that the excitatory and inhibitory effects might be implemented by the diffusion of functional gradients, as suggested in activator-inhibitor models (Turing, 1952; Meinhardt and Gierer, 1974; Nakamasu et al., 2009; Yagi, 2009). In fact, a global gradient has been observed in the cortex from a variety of perspectives ranging from genes to behavior (Huntenburg et al., 2018). Similarly, a gyro-sulcal gradient could also exist, although it might be overwhelmed by the global one. Indeed, a gradient between gyro-sulcal functional differences has been evidenced. During the dynamic balancing procedure of gyro-sulcal functions, the SOPFNs distribution percentage of gyri/sulci is increased or decreased in a gradient manner along with the task/resting state blocks instead of an abrupt change (Jiang et al., 2018a). Moreover, the gyro-sulcal pattern is associated with the functional localization gradient (Li et al., 2015; Troiani et al., 2020). For instance, it was found that the theoretically proposed rostral-caudal gradient of secondary-primary rewards is consistent with the spatial location of different rewards along a rostral-caudal gradient in the medial orbital sulcus (Li et al., 2015).
The gyro-sulcal gradient could be deeply rooted by a genetic protomap. In fact, a global scale predominant direction of gene expression gradients in the cortex has been widely reported (Miller et al., 2014; Burt et al., 2018; Huntenburg et al., 2018; Fulcher et al., 2019; Li et al., 2020b). In particular, distant cortical regions could also show similar gene expression if they have long-range connections (Richiardi et al., 2015; Krienen et al., 2016). In this sense, it could be inferred that cortical areas sharing a similar structural property could show similar gene expression, which would result in a gene expression gradient along the given structural property. Provided that gyri and sulci are two basic anatomical units of cortical morphology, the existence of a gyro-sulcal gradient is predicted, although overwhelmed by the global diffusion. This inference has gained partial support from several studies where differential expression of a great number of genes between gyri and sulci have been observed (de Juan Romero and Borrell, 2015; Zeng et al., 2015; Li et al., 2020). Some of gene differences already exist in the germinal layers, providing a protomap with abrupt gradients to locations of gyri and sulci that develop later (de Juan Romero and Borrell, 2015).
Future Research Directions
Definitions of gyri and sulci
As demonstrated in the section of 'Definition of gyri and sulci', gyri and sulci are usually treated as morphological and anatomical nomenclature. However, it is not clear how to define their morphological boundary. For example, if the zero level of convexity in FreeSurfer is used as a strict gyro-sulcal boundary, gyri below it would be defined as sulci. In this respect, it is difficult to define a clear boundary, if any, between gyri and sulci. Also, a group of gyri, termed pli de paset a (Gratiolet, 1854; Parent, 2014), were found to be buried in the depth of sulci and interrupting the continuity of the sulci, challenging the conventional definition of gyri, as being in continuity with each other across the entire cortex. Because of their specialty, pli de passage are suggested as benchmarks for cortical folding development modeling (Regis et al., 2005; Mangin et al., 2019) and a linkage between gyral and sulcal systems.
In this review, we have discussed the possibility of a mapping between gyro-sulcal patterns and functions and suggest that these two anatomical patterns could serve as basic blocks for a complex building of brain functions. Although conventional definitions of gyri and sulci are used in these studies, it is thought provoking that definitions could be revised by integrating axonal wiring and function information (Zhu et al., 2013; Jiang et al., 2015b; Lv et al., 2014, 2015; Zhang et al., 2018b, 2019a, b). For example, Jiang et al. (2015b) proposed 555 cortical landmarks on major cortical regions with gyro-sulcal anatomical and fiber connection correspondences across different participants. Zhang et al. (2018b, 2019a, b) further combined functional, structural, and anatomical information to identify cortical landmarks across participants. More effort needs to be devoted in the future to systematically investigate the gyro-sulcal definitions as well as their influences on functional models of gyri and sulci.
Gyro-sulcal framework is far from being sufficient
Another important question that needs to be asked is, are gyri and sulci the ultimate basic units for deciphering cortical morphology and anatomo-function relation, or can they be sub-divided? In fact, a group of studies (Lohmann et al., 2008; Im et al., 2010, 2011; Meng et al., 2014) have particularly focused on the deepest local regions of sulci, termed sulcal pits, the spatial placements of which remain invariant during brain growth. This invariance is closely related to intellectual ability (Im et al., 2011) and a protomap of functional areas (Lohmann et al., 2008; Im et al., 2010). In our studies, we have defined a novel gyral folding pattern (Li K. et al., 2010), termed the gyral hinge, which is the conjunction of multiple gyri from different directions. Gyral hinges are distinguished from other gyral regions because they have the thickest cortices, the strongest long-range axonal connections, the most aggregative functional profiles (Li K. et al., 2010; Yu et al., 2013; Chen et al., 2014; Jiang et al., 2015a, 2018a; Li et al., 2017; Ge et al., 2018), and comprise a majority portion of the cortico-cortical network's "core" (Zhang et al., 2020). Taken together, these studies indicate that classic gyro-sulcal patterns could be further sub-divided to meaningful units, such as ordinary sulci, ordinary gyri, sulcal pits, and gyral hinges.
Importance and necessity of considering gyro-sulcal functional differences in brain disorder studies
Size, morphology, and spatial patterns of cortical folding have been related to various brain functions (Barkovich et al., 2012; Fernández et al., 2016). Abnormalities and changes in cortical folding have been reported to lead to severe brain malfunctions and problems in intellectual and cognitive functioning (Barkovich et al., 2012; Fernándezet al., 2016). Some congenital cortical abnormalities, such as lissencephaly, microcephaly, and polymicrogyria, provide extreme examples of associations with severe anatomical pathology and mental deficits (Richman et al., 1974; Richman et al., 1975; Stutterd and Leventer, 2014; Di Donato et al., 2017: for a full review of these findings, see Fernández et al., 2016). Moreover, mild folding abnormalities, in developmental psychiatric disorders such as ASD and SZ, are also associated with cognition and behavioral impairments (White et al., 2003; Nordahl et al., 2007; Csernansky et al., 2008; Blanken et al., 2015; Dierker et al., 2015; Ecker et al., 2015). In ASD, these include deficits in social communication, social reciprocity, and repetitive and stereotyped behaviors and interests (Wing, 1997), and in attention, memory, social withdrawal and executive functions in SZ (Gur et al., 2000; Goldberg, 2003). Patients with ASD have also been reported to exhibit polymicrogyria, schizencephaly, and microgyria in the cortex (Piven et al., 1990). In particular, some sulci, such as the Sylvian fissure, are elongated (Levitt et al., 2003) and the gyrification of the frontal lobe is increased (Hardan et al, 2004). Similarly, in SZ patients, widespread abnormalities in cortical folding patterns have also been reported (Narr et al., 2004; Arnold et al., 2005) including in the temporal lobes (Kikinis et al., 1994) and frontal, occipital, and parietal cortices (Shenton et al., 2001; Narr et al., 2004).
A number of studies have focused on gyro-sulcal patterns with the aim of providing a more precise anatomo-functional mapping of potential contributions to mental disorders (reviewed by Nakamura et al., 2020). These studies have developed an approach for extracting gyro-sulcal patterns according to their spatial topology. In these studies, a set of H-shaped sulci in the orbito-frontal cortex (OFC) was of major interest because of its linkage with cognitive and social deficits in a variety of brain disorders (Ongur and Price, 2000). The OFC gyro-sulcal pattern has been classified into three types (Chiavaras and Petrides, 2000—type I, type II, and type III in order of frequency). In general, in type I the lateral orbital sulci (LOS) are continuous while the medial orbital sulci (MOS) are interrupted; in type II, both LOS and MOS are continuous; and in type III, both LOS and MOS are interrupted. It was found that the most common type I expression in healthy controls was decreased while the least common type III expression in healthy controls was increased in SZ (Nakamura et al., 2007). Similar atypical distributions of the gyro-sulcal patterns have been reported in ASD (Watanabe et al., 2014), attention deficit/hyperactivity disorder (ADHD), and bipolar disorder (BD) (Patti and Troiani, 2018).
However, most of those studies only focus on general morphological measures such as the gyrification index, cortical area, etc., while gyro-sulcal functional difference characteristics have received far less attention in existing human behavior and brain disorder studies. Conventional cognitive, psychological, and psychiatric studies usually select a large brain region of interest (ROI) (e.g. prefrontal cortex) based on an available brain atlas that neglects gyro-sulcal functional differences within it. As a consequence, subsequent ROI-based analyses (e.g. activation detection, FC analysis) are therefore inaccurate and may lose useful findings or generate false positive ones, especially when performing between-group comparisons. Since a number of mental disorder studies have demonstrated the possibility that gyro-sulcal topological patterns could be used as a proxy for brain functions and cognition (Nakamura et al., 2020; Troiani et al., 2020), it may be more important to use gyro-sulcal functional patterns as neurodevelopmental markers for future brain disorder diagnosis, cognitive, psychological, and psychiatric studies to obtain more accurate and reliable findings.
ACKNOWLEDGEMENTS
This work was supported by the National Natural Science Foundation of China (nos. 61976045 and 61703073 to X.J., 31971288, U1801265, and 31671005 to T.Z., 31530032 to K.M.K.), the Fundamental Research Funds for the Central Universities (no. 06100/G2020KY05105 to SZ) and high-level researcher start-up projects (no. 06100–20GH020161 to S.Z.), and Key Scientific and Technological Projects of Guangdong Province Government (no. 2018B030335001 to K.M.K.).
Contributor Information
Xi Jiang, School of Life Science and Technology, MOE Key Laboratory for Neuroinformation, University of Electronic Science and Technology of China, Chengdu 611731, China.
Tuo Zhang, School of Automation, Northwestern Polytechnical University, Xi'an 710129, China.
Shu Zhang, Center for Brain and Brain-Inspired Computing Research, School of Computer Science, Northwestern Polytechnical University, Xi'an 710129, China.
Keith M Kendrick, School of Life Science and Technology, MOE Key Laboratory for Neuroinformation, University of Electronic Science and Technology of China, Chengdu 611731, China.
Tianming Liu, Cortical Architecture Imaging and Discovery Laboratory, Department of Computer Science and Bioimaging Research Center, The University of Georgia, Athens, GA 30605, USA.
Author contributions
X.J.: conceptualization, visualization, writing of the original draft, and funding acquisition. T.Z.: conceptualization, visualization, writing of the original draft, and funding acquisition; S.Z.: conceptualization, writing of the original draft, and funding acquisition; K.M.K.: writing; review and editing, and funding acquisition; T.L.: supervision, conceptualization, and writing, review and rditing.
Conflict of interests
One of the authors, K.K., is also the editor-in-chief of Psychoradiology. He was blinded from reviewing or making decisions on the manuscript. The authors declare no other conflict of interests.
References
- Abolghasemi V, Ferdowsi S, Sanei S (2015) Fast and incoherent dictionary learning algorithms with application to fMRI. SIViP. 9:147–58. [Google Scholar]
- Amiez C, Kostopoulos P, Champod ASet al. (2006) Local morphology predicts functional organization of the dorsal premotor region in the human brain. J Neurosci. 26:2724–31. [DOI] [PMC free article] [PubMed] [Google Scholar]
- Amiez C, Neveu R, Warrot Det al. (2013) The location of feedback-related activity in the midcingulate cortex is predicted by local morphology. J Neurosci. 33:2217–28. [DOI] [PMC free article] [PubMed] [Google Scholar]
- Amiez C, Petrides M (2014) Neuroimaging evidence of the anatomo-functional organization of the human cingulate motor areas. Cereb Cortex. 24:563–78. [DOI] [PubMed] [Google Scholar]
- Amiez C, Petrides M (2018) Functional rostro-caudal gradient in the human posterior lateral frontal cortex. Brain Struct Funct. 223:1487–99. [DOI] [PubMed] [Google Scholar]
- Arnold SE, Talbot K, Hahn CG (2005) Neurodevelopment, neuroplasticity, and new genes for schizophrenia. Prog Brain Res. 147:319–45. [DOI] [PubMed] [Google Scholar]
- Barch DM, Burgess GC, Harms MPet al. (2013) Function in the human connectome: task-fMRI and individual differences in behavior. Neuroimage. 80:169–89. [DOI] [PMC free article] [PubMed] [Google Scholar]
- Barkovich AJ, Guerrini R, Kuzniecky RIet al. (2012) A developmental and genetic classification for malformations of cortical development: update 2012. Brain. 135:1348–69. [DOI] [PMC free article] [PubMed] [Google Scholar]
- Bayly P, Okamoto R, Xu Get al. (2013) A cortical folding model incorporating stress-dependent growth explains gyral wavelengths and stress patterns in the developing brain. Phys Biol. 10:016005. [DOI] [PMC free article] [PubMed] [Google Scholar]
- Behnke KJ, Rettmann ME, Pham DLet al. (2003) Automatic classification of sulcal regions of the human brain cortex using pattern recognition. Proceedings of SPIE. 5032:1499–510. [Google Scholar]
- Benson NC, Butt OH, Datta Ret al. (2012) The retinotopic organization of striate cortex is well predicted by surface topology. Curr Biol. 22:2081–5. [DOI] [PMC free article] [PubMed] [Google Scholar]
- Betizeau M, Cortay V, Patti Det al. (2013) Precursor diversity and complexity of lineage relationships in the outer subventricular zone of the primate. Neuron. 80:442–57. [DOI] [PubMed] [Google Scholar]
- Biswal B, Yetkin FZ, Haughton VMet al. (1995) Functional connectivity in the motor cortex of resting human brain using echo-planar MRI. Magn Reson Med. 34:537–41. [DOI] [PubMed] [Google Scholar]
- Blanken LM, Mous SE, Ghassabian Aet al. (2015) Cortical morphology in 6-to 10-year old children with autistic traits: a population-based neuroimaging study. AJP. 172:479–86. [DOI] [PubMed] [Google Scholar]
- Borrell V, Götz M (2014) Role of radial glial cells in cerebral cortex folding. Curr Opin Neurobiol. 27:39–46. [DOI] [PubMed] [Google Scholar]
- Brodmann K (1909) Vergleichende Lokalisationslehre der Grosshirnrinde in ihren Prinzipien dargestellt auf Grund des Zellenbaues. Leipzig: Barth. [Google Scholar]
- Budde MD, Annese J (2013) Quantification of anisotropy and fiber orientation in human brain histological sections. Front. Integr. Neurosci. 7:3. [DOI] [PMC free article] [PubMed] [Google Scholar]
- Bullmore E, Sporns O (2009) Complex brain networks: graph theoretical analysis of structural and functional systems. Nat Rev Neurosci. 10:186–98. [DOI] [PubMed] [Google Scholar]
- Bullmore E, Sporns O (2012) The economy of brain network organization. Nat Rev Neurosci. 13:336–49. [DOI] [PubMed] [Google Scholar]
- Burt JB, Demirtaş M, Eckner WJet al. (2018) Hierarchy of transcriptomic specialization across human cortex captured by structural neuroimaging topography. Nat Neurosci. 21:1251–9. [DOI] [PMC free article] [PubMed] [Google Scholar]
- Buzsáki G, Draguhn A (2004) Neuronal oscillations in cortical networks. Science. 304:1926–9. [DOI] [PubMed] [Google Scholar]
- Buzsáki G, Logothetis N, Singer W (2013) Scaling brain size, keeping timing: evolutionary preservation of brain rhythms. Neuron. 80:751–64. [DOI] [PMC free article] [PubMed] [Google Scholar]
- Cachia A, Mangin JF, Rivière Det al. (2003a) A primal sketch of the cortex mean curvature: a morphogenesis based approach to study the variability of the folding patterns. IEEE Trans Med Imaging. 22:754–65. [DOI] [PubMed] [Google Scholar]
- Cachia A, Mangin JF, Rivière Det al. (2003b) A generic framework for the parcellation of the cortical surface into gyri using geodesic Voronoï diagrams. Med Image Anal. 7:403–16. [DOI] [PubMed] [Google Scholar]
- Cachia A, Roell M, Mangin J-Fet al. (2018) How interindividual differences in brain anatomy shape reading accuracy. Brain Struct Funct. 223:701–12. [DOI] [PubMed] [Google Scholar]
- Calhoun VD, Miller R, Pearlson Get al. (2014) The chronnectome: time-varying connectivity networks as the next frontier in fMRI data discovery. Neuron. 84:262–74. [DOI] [PMC free article] [PubMed] [Google Scholar]
- Canolty RT, Knight RT (2010) The functional role of cross-frequency coupling. Trends Cogn Sci. 14:506–15. [DOI] [PMC free article] [PubMed] [Google Scholar]
- Cao M, He Y, Dai Zet al. (2017) Early development of functional network segregation revealed by connectomic analysis of the preterm human brain. Cereb Cortex. 27:1949–63. [DOI] [PMC free article] [PubMed] [Google Scholar]
- Chang C, Glover GH (2010) Time–frequency dynamics of resting-state brain connectivity measured with fMRI. Neuroimage. 50:81–98. [DOI] [PMC free article] [PubMed] [Google Scholar]
- Chen H, Zhang T, Guo Let al. (2013) Coevolution of gyral folding and structural connection patterns in primate brains. Cereb Cortex. 23:1208–17. [DOI] [PMC free article] [PubMed] [Google Scholar]
- Chen H, Yu X, Jiang Xet al. (2014) Evolutionarily-preserved consistent gyral folding patterns across primate brains. IEEE 11th International Symposium on Biomedical Imaging (ISBI). 1218–21. [Google Scholar]
- Chi JG, Dooling EC, Gilles FH (1977) Gyral development of the human brain. Ann Neurol. 1:86–93. [DOI] [PubMed] [Google Scholar]
- Chiavaras MM, Petrides M (2000) Orbitofrontal sulci of the human and macaque monkey brain. J Comp Neurol. 422:35–54. [PubMed] [Google Scholar]
- Chklovskii DB, Schikorski T, Stevens CF (2002) Wiring optimization in cortical circuits. Neuron. 34:341–7. [DOI] [PubMed] [Google Scholar]
- Coifman RR, Wickerhauser MV (1992) Entropy-based algorithms for best basis selection. IEEE Trans Inform Theory. 38:713–8. [Google Scholar]
- Collins DL, Goualher GL, Evans AC (1998) Non-linear cerebral registration with sulcal constraints. Int Conf Med Image Comput Comput Assist Interv. 974–84. [Google Scholar]
- Csernansky JG, Gillespie SK, Dierker DLet al. (2008) Symmetric abnormalities in sulcal patterning in schizophrenia. Neuroimage. 43:440–6. [DOI] [PMC free article] [PubMed] [Google Scholar]
- Daubechies I (1992) Ten Lectures on Wavelets: SIAM. [Google Scholar]
- Davatzikos C (1997) Spatial transformation and registration of brain images using elastically deformable models. Comput Vision Image Understanding. 66:207–22. [DOI] [PubMed] [Google Scholar]
- de Juan Romero C, Borrell V (2015) Coevolution of radial glial cells and the cerebral cortex. Glia. 63:1303–19. [DOI] [PMC free article] [PubMed] [Google Scholar]
- Desai R, Liebenthal E, Possing ETet al. (2005) Volumetric vs. surface-based alignment for localization of auditory cortex activation. Neuroimage. 26:1019–29. [DOI] [PubMed] [Google Scholar]
- de Schotten MT, Dell'Acqua F, Valabregue Ret al. (2012) Monkey to human comparative anatomy of the frontal lobe association tracts. Cortex. 48:82–96. [DOI] [PubMed] [Google Scholar]
- de Schotten MT, Croxson PL, Mars RB (2019) Large-scale comparative neuroimaging: where are we and what do we need?. Cortex. 118:188–202. [DOI] [PMC free article] [PubMed] [Google Scholar]
- Deco G, Cabral J, Woolrich MWet al. (2017) Single or multiple frequency generators in on-going brain activity: a mechanistic whole-brain model of empirical MEG data. Neuroimage. 152:538–50. [DOI] [PMC free article] [PubMed] [Google Scholar]
- Deng F, Jiang X, Zhu Det al. (2014) A functional model of cortical gyri and sulci. Brain Struct Funct. 219:1473–91. [DOI] [PMC free article] [PubMed] [Google Scholar]
- Desikan RS, Se´gonne F, Fischl Bet al. (2006) An automated labeling system for subdividing the human cerebral cortex on MRI scans into gyral based regions of interest. Neuroimage. 31:968–80. [DOI] [PubMed] [Google Scholar]
- Di Donato N, Chiari S, Mirzaa GMet al. (2017) Lissencephaly: expanded imaging and clinical classification. Am J Med Genet. 173:1473–88. [DOI] [PMC free article] [PubMed] [Google Scholar]
- Dierker DL, Feczko E, Pruett JR Jret al. (2015) Analysis of cortical shape in children with simplex autism. Cereb Cortex. 25:1042–51. [DOI] [PMC free article] [PubMed] [Google Scholar]
- Dubois J, Benders M, Borradori-Tolsa Cet al. (2008) Primary cortical folding in the human newborn: an early marker of later functional development. Brain. 131:2028–41. [DOI] [PMC free article] [PubMed] [Google Scholar]
- Dubois J, Dehaene-Lambertz G, Kulikova Set al. (2014) The early development of brain white matter: a review of imaging studies in fetuses, newborns and infants. Neuroscience. 276:48–71. [DOI] [PubMed] [Google Scholar]
- Ecker C, Bookheimer SY, Murphy DG (2015) Neuroimaging in autism spectrum disorder: brain structure and function across the lifespan. The Lancet Neurology. 14:1121–34. [DOI] [PubMed] [Google Scholar]
- Eichert N, Robinson EC, Bryant KLet al. (2020) Cross-species cortical alignment identifies different types of anatomical reorganization in the primate temporal lobe. eLife. 9:e53232. [DOI] [PMC free article] [PubMed] [Google Scholar]
- Englund C, Fink A, Lau Cet al. (2005) Pax6, Tbr2, and Tbr1 are expressed sequentially by radial glia, intermediate progenitor cells, and postmitotic neurons in developing neocortex. J Neurosci. 25:247–51. [DOI] [PMC free article] [PubMed] [Google Scholar]
- Fair DA, Cohen AL, Power JDet al. (2009) Functional brain networks develop from a “local to distributed” organization. PLoS Comput Biol. 5:e1000381. [DOI] [PMC free article] [PubMed] [Google Scholar]
- Fernández V, Llinares-Benadero C, Borrell V (2016) Cerebral cortex expansion and folding: what have we learned?. EMBO J. 35:1021–44. [DOI] [PMC free article] [PubMed] [Google Scholar]
- Fietz SA, Kelava I, Vogt Jet al. (2010) OSVZ progenitors of human and ferret neocortex are epithelial-like and expand by integrin signaling. Nat Neurosci. 13:690–9. [DOI] [PubMed] [Google Scholar]
- Fischl B, Sereno MI, Tootell RBHet al. (1999) High-resolution intersubject averaging and a coordinate system for the cortical surface. Hum Brain Mapp. 8:272–84. [DOI] [PMC free article] [PubMed] [Google Scholar]
- Fischl B, Rajendran N, Busa Eet al. (2008) Cortical folding patterns and predicting cytoarchitecture. Cereb Cortex. 18:1973–80. [DOI] [PMC free article] [PubMed] [Google Scholar]
- Fischl B (2012) FreeSurfer. Neuroimage. 62:774–81. [DOI] [PMC free article] [PubMed] [Google Scholar]
- Florio M, Huttner WB (2014) Neural progenitors, neurogenesis and the evolution of the neocortex. Development. 141:2182–94. [DOI] [PubMed] [Google Scholar]
- Fornito A, Yücel M, Wood Set al. (2004) Individual differences in anterior cingulate/paracingulate morphology are related to executive functions in healthy males. Cereb Cortex. 14:424–31. [DOI] [PubMed] [Google Scholar]
- Fox MD, Raichle ME (2007) Spontaneous fluctuations in brain activity observed with functional magnetic resonance imaging. Nat Rev Neurosci. 8:700–11. [DOI] [PubMed] [Google Scholar]
- Friston K (2009) Causal modelling and brain connectivity in functional magnetic resonance imaging. PLoS Biol. 7:e1000033. [DOI] [PMC free article] [PubMed] [Google Scholar]
- Friston KJ (2011) Functional and effective connectivity: a review. Brain Connect. 1:13–36. [DOI] [PubMed] [Google Scholar]
- Frost MA, Goebel R (2012) Measuring structural-functional correspondence: spatial variability of specialised brain regions after macro-anatomical alignment. Neuroimage. 59:1369–81. [DOI] [PubMed] [Google Scholar]
- Fulcher BD, Murray JD, Zerbi Vet al. (2019) Multimodal gradients across mouse cortex. Proc Natl Acad Sci USA. 116:4689–95. [DOI] [PMC free article] [PubMed] [Google Scholar]
- Gao W, Zhu H, Giovanello KSet al. (2009) Evidence on the emergence of the brain's default network from 2-week-old to 2-year-old healthy pediatric subjects. Proc Natl Acad Sci USA. 106:6790–5. [DOI] [PMC free article] [PubMed] [Google Scholar]
- Ge F, Li X, Razavi MJet al. (2018) Denser growing fiber connections induce 3-hinge gyral folding. Cereb Cortex. 28:1064–75. [DOI] [PMC free article] [PubMed] [Google Scholar]
- Ge F, Zhang S, Huang Het al. (2019). Exploring intrinsic functional differences of gyri, sulci and 2-hinge, 3-hinge joints on cerebral cortex. In: IEEE 16th International Symposium on Biomedical Imaging (ISBI 2019), IEEE. Venice, Italy; 1585–89. [Google Scholar]
- Gertz CC, Kriegstein AR (2015) Neuronal migration dynamics in the developing ferret cortex. J Neurosci. 35:14307–15. [DOI] [PMC free article] [PubMed] [Google Scholar]
- Gilbert CD, Sigman M (2007) Brain states: top-down influences in sensory processing. Neuron. 54:677–96. [DOI] [PubMed] [Google Scholar]
- Glasser MF, Sotiropoulos SN, Wilson JAet al. (2013) The minimal preprocessing pipelines for the Human Connectome Project. Neuroimage. 80:105–24. [DOI] [PMC free article] [PubMed] [Google Scholar]
- Glaunes J, Vaillant M, Miller MI (2004) Landmark matching via large deformation diffeomorphisms on the sphere: special issue on mathematics and image analysis. J Math Imaging Vision. 20:179–200. [Google Scholar]
- Goebel R, Esposito F, Formisano E (2006) Analysis of functional image analysis contest (fiac) data with brainvoyager qx: from single-subject to cortically aligned group general linear model analysis and self-organizing group independent component analysis. Hum Brain Mapp. 27:392–401. [DOI] [PMC free article] [PubMed] [Google Scholar]
- Goldberg T (2003) Neurocognitive deficits in schizophrenia. Schizophrenia. 168–84. [Google Scholar]
- Golik P, Tüske Z, Schlüter Ret al. (2015) Convolutional neural networks for acoustic modeling of raw time signal in LVCSR. The 16th Annual Conference of the International Speech Communication Association. Dresden, Germany; 26–30. [Google Scholar]
- Goualher GL, Barillot C, Bizais Y (1997) Three-dimensional segmentation and representation of cortical sulci using active ribbons. Int J Pattern Recognit Artif Intell. 11:1295–315. [Google Scholar]
- Gratiolet P (1854) Mémoire sur les plis cérébraux de l'homme et des primates. Vol. 1. Paris: A. Bertrand. [Google Scholar]
- Gur RC, Moelter ST, Ragland JD (2000) Learning and memory in schizophrenia. In: Sharma T, Harvey P (eds), Cognition in Schizophrenia : Impairments, Importance, Treatment Strategies. Oxford: Oxford University Press, 73–91. [Google Scholar]
- Hagemeyer N, Hanft K-M, Akriditou M-Aet al. (2017) Microglia contribute to normal myelinogenesis and to oligodendrocyte progenitor maintenance during adulthood. Acta Neuropathol. 134:441–58. [DOI] [PMC free article] [PubMed] [Google Scholar]
- Hasnain MK, Fox PT, Woldorff MG (2001) Structure–function spatial covariance in the human visual cortex. Cereb Cortex. 11:702–16. [DOI] [PubMed] [Google Scholar]
- Hansen DV, Lui JH, Parker PRLet al. (2010) Neurogenic radial glia in the outer subventricular zone of human neocortex. Nature. 464:554–61. [DOI] [PubMed] [Google Scholar]
- Hardan AY, Jou RJ, Keshavan MSet al. (2004) Increased frontal cortical folding in autism: a preliminary MRI study. Psyc Res Neuroimaging. 131:263–8. [DOI] [PubMed] [Google Scholar]
- He Y, Chen ZJ, Evans AC (2007) Small-world anatomical networks in the human brain revealed by cortical thickness from MRI. Cereb Cortex. 17:2407–19. [DOI] [PubMed] [Google Scholar]
- Hellier P, Barillot C (2003) Coupling dense and landmark-based approaches for nonrigid registration. IEEE Trans Med Imaging. 22:217–27. [DOI] [PubMed] [Google Scholar]
- Hilgetag CC, Barbas H (2005) Developmental mechanics of the primate cerebral cortex. Anat Embryol. 210:411–7. [DOI] [PubMed] [Google Scholar]
- Hinds OP, Rajendran N, Polimeni JRet al. (2008) Accurate prediction of V1 location from cortical folds in a surface coordinate system. Neuroimage. 39:1585–99. [DOI] [PMC free article] [PubMed] [Google Scholar]
- Huang H, Xue R, Zhang Jet al. (2009) Anatomical characterization of human fetal brain development with diffusion tensor magnetic resonance imaging. J Neurosci. 29:4263–73. [DOI] [PMC free article] [PubMed] [Google Scholar]
- Huang H, Hu X, Zhao Yet al. (2017) Modeling task fMRI data via deep convolutional autoencoder. IEEE Trans Med Imaging. 37:1551–61. [DOI] [PubMed] [Google Scholar]
- Huntenburg JM, Bazin PL, Margulies DS (2018) Large-scale gradients in human cortical organization. Trends Cogn Sci. 22:21–31. [DOI] [PubMed] [Google Scholar]
- Im K, Jo HJ, Mangin JFet al. (2010) Spatial distribution of deep sulcal landmarks and hemispherical asymmetry on the cortical surface. Cereb Cortex. 20:602–11. [DOI] [PubMed] [Google Scholar]
- Im K, Choi YY, Yang JJet al. (2011) The relationship between the presence of sulcal pits and intelligence in human brains. Neuroimage. 55:1490–6. [DOI] [PubMed] [Google Scholar]
- Jiang M, Yang S, Yan Jet al. (2020) Exploring functional difference between gyri and sulci via region-specific 1D convolutional neural networks. The International Workshop on Machine Learning in Medical Imaging. Lima, Peru: Springer, 250–9. [Google Scholar]
- Jiang X, Li X, Lv Jet al. (2015a) Sparse representation of HCP grayordinate data reveals novel functional architecture of cerebral cortex. Hum Brain Mapp. 36:5301–19. [DOI] [PMC free article] [PubMed] [Google Scholar]
- Jiang X, Zhang T, Zhu Det al. (2015b) Anatomy-guided dense individualized and common connectivity-based cortical landmarks (A-DICCCOL). IEEE Trans Biomed Eng. 62:1108–19. [DOI] [PMC free article] [PubMed] [Google Scholar]
- Jiang X, Li X, Lv Jet al. (2018a) Temporal dynamics assessment of spatial overlap pattern of functional brain networks reveals novel functional architecture of cerebral cortex. IEEE Trans Biomed Eng. 65:1183–92. [DOI] [PMC free article] [PubMed] [Google Scholar]
- Jiang X, Zhao L, Liu Het al. (2018b) A cortical folding pattern-guided model of intrinsic functional brain networks in emotion processing. Front Neurosci. 12:575. [DOI] [PMC free article] [PubMed] [Google Scholar]
- Johnson HJ, Christensen GE (2002) Consistent landmark and intensity-based image registration. IEEE Trans Med Imaging. 21:450–61. [DOI] [PubMed] [Google Scholar]
- Johnson MB, Wang PP, Atabay KDet al. (2015) Single-cell analysis reveals transcriptional heterogeneity of neural progenitors in human cortex. Nat Neurosci. 18:637–46. [DOI] [PMC free article] [PubMed] [Google Scholar]
- Joshi SC, Miller MI (1997) On the geometry and shape of brain sub-manifolds. Int J Pattern Recognit Artif Intell. 11:1317–43. [Google Scholar]
- Joshi A, Shattuck D, Thompson Pet al. (2007) Surface-constrained volumetric brain registration using harmonic mappings. IEEE Trans Med Imaging. 26:1657–69. [DOI] [PMC free article] [PubMed] [Google Scholar]
- Joshi AA, Shattuck DW, Damasio Het al. (2012) Geodesic curvature flow on surfaces for automatic sulcal delineation. IEEE Int Symp Biomed Imaging (ISBI). 430–3. [DOI] [PMC free article] [PubMed] [Google Scholar]
- Kaiser M, Hilgetag CC (2006) Nonoptimal component placement, but short processing paths, due to long-distance projections in neural systems. PLoS Comput Biol. 2:e95. [DOI] [PMC free article] [PubMed] [Google Scholar]
- Kandel ER, Schwartz JH, Jessell TM (2000) Principles of Neural Science, 4th edn, 50. McGraw-Hill, 823–39. [Google Scholar]
- Kao CY, Hofer M, Sapiro Get al. (2007) A geometric method for automatic extraction of sulcal fundi. IEEE Trans Med Imaging. 26:530–40. [DOI] [PubMed] [Google Scholar]
- Kikinis R, Shenton ME, Gerig Get al. (1994) Temporal lobe sulco-gyral pattern anomalies in schizophrenia: an in vivo MR three-dimensional surface rendering study. Neurosci Lett. 182:7–12. [DOI] [PubMed] [Google Scholar]
- Krienen FM, Yeo BT, Ge Tet al. (2016) Transcriptional profiles of supragranular-enriched genes associate with corticocortical network architecture in the human brain. Proc Natl Acad Sci USA. 113:E469–78. [DOI] [PMC free article] [PubMed] [Google Scholar]
- Kroenke CD, Bayly PV (2018) How forces fold the cerebral cortex. J Neurosci. 38:767–75. [DOI] [PMC free article] [PubMed] [Google Scholar]
- Laughlin SB, Sejnowski TJ (2003) Communication in neuronal networks. Science. 301:1870–4. [DOI] [PMC free article] [PubMed] [Google Scholar]
- LeCun Y, Bengio Y, Hinton G (2015) Deep learning. Nature. 521:436–44. [DOI] [PubMed] [Google Scholar]
- Levitt JG, Blanton RE, Smalley Set al. (2003) Cortical sulcal maps in autism. Cereb Cortex. 13:728–35. [DOI] [PubMed] [Google Scholar]
- Lewitus E, Kelava I, Kalinka ATet al. (2014) An adaptive threshold in mammalian neocortical evolution. PLoS Biol. 12:e1002000. [DOI] [PMC free article] [PubMed] [Google Scholar]
- Li G, Guo L, Nie Jet al. (2009) Automatic cortical sulcal parcellation based on surface principal direction flow field tracking. Neuroimage. 46:923–37. [DOI] [PMC free article] [PubMed] [Google Scholar]
- Li G, Guo L, Nie Jet al. (2010) An automated pipeline for cortical sulcal fundi extraction. Med Image Anal. 14:343–59. [DOI] [PMC free article] [PubMed] [Google Scholar]
- Li K, Guo L, Li Get al. (2010) Gyral folding pattern analysis via surface profiling. Neuroimage. 52:1202–14. [DOI] [PMC free article] [PubMed] [Google Scholar]
- Li X, Hu X, Jiang Xet al. (2013) Assessing structural organization and functional interaction in gyral, sulcal and cortical networks. The International Workshop on Multimodal Brain Image Analysis. 8159:9–17. [Google Scholar]
- Li X, Zhu D, Jiang Xet al. (2014) Dynamic functional connectomics signatures for characterization and differentiation of PTSD patients. Hum Brain Mapp. 35:1761–78. [DOI] [PMC free article] [PubMed] [Google Scholar]
- Li X, Chen H, Zhang Tet al. (2017) Commonly preserved and species-specific gyral folding patterns across primate brains. Brain Struct Funct. 222:2127–41. [DOI] [PubMed] [Google Scholar]
- Li X, Liu T, Liu Yet al. (2020a) Marmoset brain ISH data revealed molecular difference between cortical folding patterns. Cereb Cortex. 31:1660–74. [DOI] [PubMed] [Google Scholar]
- Li Y, Sescousse G, Amiez Cet al. (2015) Local morphology predicts functional organization of experienced value signals in the human orbitofrontal cortex. J Neurosci. 35:1648–58. [DOI] [PMC free article] [PubMed] [Google Scholar]
- Li Y, Huang H, Chen Het al. (2020b) Deep neural networks for in situ hybridization grid completion and clustering. IEEE/ACM Trans Comput Biol Bioinf. 17:536–46. [DOI] [PMC free article] [PubMed] [Google Scholar]
- Litjens G, Kooi T, Bejnordi BEet al. (2017) A survey on deep learning in medical image analysis. Med Image Anal. 42:60–88. [DOI] [PubMed] [Google Scholar]
- Liu H, Jiang X, Zhang Tet al. (2017) Elucidating functional differences between cortical gyri and sulci via sparse representation HCP grayordinate fMRI data. Brain Res. 1672:81–90. [DOI] [PMC free article] [PubMed] [Google Scholar]
- Liu H, Zhang S, Jiang Xet al. (2019) The cerebral cortex is bisectionally segregated into two fundamentally different functional units of gyri and sulci. Cereb Cortex. 29:4238–52. [DOI] [PMC free article] [PubMed] [Google Scholar]
- Logothetis NK (2008) What we can do and what we cannot do with fMRI. Nature. 453:869–78. [DOI] [PubMed] [Google Scholar]
- Lohmann G (1998) Extracting line representations of sulcal and gyral patterns in MR images of the human brain. IEEE Trans Med Imaging. 17:1040–8. [DOI] [PubMed] [Google Scholar]
- Lohmann G, von Cramon DY (2000) Automatic labelling of the human cortical surface using sulcal basins. Med Image Anal. 4:179–88. [DOI] [PubMed] [Google Scholar]
- Lohmann G, von Cramon DY, Colchester AC (2008) Deep sulcal landmarks provide an organizing framework for human cortical folding. Cereb Cortex. 18:1415–20. [DOI] [PubMed] [Google Scholar]
- Lopez-Persem A, Verhagen L, Amiez Cet al. (2019) The human ventromedial prefrontal cortex: sulcal morphology and its influence on functional organization. J Neurosci. 39:3627–39. [DOI] [PMC free article] [PubMed] [Google Scholar]
- Lv J, Jiang X, Li Xet al. (2014) Holistic atlases of functional networks and interactions reveal reciprocal organizational architecture of cortical function. IEEE Trans Biomed Eng. 62:1120–31. [DOI] [PubMed] [Google Scholar]
- Lv J, Jiang X, Li Xet al. (2015) Sparse representation of whole-brain fMRI signals for identification of functional networks. Med Image Anal. 20:112–34. [DOI] [PubMed] [Google Scholar]
- Mairal J, Bach F, Ponce Jet al. (2010) Online learning for matrix factorization and sparse coding. J Machine Learn Res. 11:19–60. [Google Scholar]
- Mallat SG (1989) A theory for multiresolution signal decomposition: the wavelet representation. IEEE Trans Pattern Anal Mach Intell. 11:674–93. [Google Scholar]
- Mangin JF, Frouin V, Bloch Iet al. (1995) From 3D magnetic resonance images to structural representations of the cortex topography using topology preserving deformations. J Math Imaging Vis. 5:297–318. [Google Scholar]
- Mangin JF, Le Guen Y, Labra Net al. (2019) “Plis de passage” deserve a role in models of the cortical folding process. Brain Topogr. 32:1035–48. [DOI] [PMC free article] [PubMed] [Google Scholar]
- Meinhardt H, Gierer A (1974) Applications of a theory of biological pattern formation based on lateral inhibition. J Cell Sci. 15:321–46. [DOI] [PubMed] [Google Scholar]
- Meng Y, Li G, Lin Wet al. (2014) Spatial distribution and longitudinal development of deep cortical sulcal landmarks in infants. Neuroimage. 100:206–18. [DOI] [PMC free article] [PubMed] [Google Scholar]
- Mikula S, Trotts I, Stone Jet al. (2007) Internet-enabled high-resolution brain mapping and virtual microscopy. Neuroimage. 35:9–15. [DOI] [PMC free article] [PubMed] [Google Scholar]
- Miller JA, Ding S-L, Sunkin SMet al. (2014) Transcriptional landscape of the prenatal human brain. Nature. 508:199–206. [DOI] [PMC free article] [PubMed] [Google Scholar]
- Morosan P, Rademacher J, Schleicher Aet al. (2001) Human primary auditory cortex: cytoarchitectonic subdivisions and mapping into a spatial reference system. Neuroimage. 13:684–701. [DOI] [PubMed] [Google Scholar]
- Nakamasu A, Takahashi G, Kanbe Aet al. (2009) Interactions between zebrafish pigment cells responsible for the generation of Turing patterns. Proc Natl Acad Sci USA. 106:8429–34. [DOI] [PMC free article] [PubMed] [Google Scholar]
- Nakamura M, Nestor PG, McCarley RWet al. (2007) Altered orbitofrontal sulcogyral pattern in schizophrenia. Brain. 130:693–707. [DOI] [PMC free article] [PubMed] [Google Scholar]
- Nakamura M, Nestor PG, Shenton ME (2020) Orbitofrontal sulcogyral pattern as a transdiagnostic trait marker of early neurodevelopment in the social brain. Clin EEG Neurosci. 51:1550059420904180. [DOI] [PMC free article] [PubMed] [Google Scholar]
- Narr KL, Bilder RM, Kim Set al. (2004) Abnormal gyral complexity in first-episode schizophrenia. Biol Psychiatry. 55:859–67. [DOI] [PubMed] [Google Scholar]
- Nie J, Guo L, Li Ket al. (2012) Axonal fiber terminations concentrate on gyri. Cereb Cortex. 22:2831–9. [DOI] [PMC free article] [PubMed] [Google Scholar]
- Noctor SC, Martínez-Cerdeño V, Ivic Let al. (2004) Cortical neurons arise in symmetric and asymmetric division zones and migrate through specific phases. Nat Neurosci. 7:136–44. [DOI] [PubMed] [Google Scholar]
- Nordahl CW, Dierker D, Mostafavi Iet al. (2007) Cortical folding abnormalities in autism revealed by surface-based morphometry. J Neurosci. 27:11725–35. [DOI] [PMC free article] [PubMed] [Google Scholar]
- Öngür D, Price JL (2000) The organization of networks within the orbital and medial prefrontal cortex of rats, monkeys and humans. Cereb Cortex. 10:206–19. [DOI] [PubMed] [Google Scholar]
- Ono M, Kubick S, Abernathey C (1990) Atlas of the Cerebral Sulci. Thieme Medical Publishers. [Google Scholar]
- Orban GA, Van Essen D, Vanduffel W (2004) Comparative mapping of higher visual areas in monkeys and humans. Trends Cogn Sci. 8:315–24. [DOI] [PubMed] [Google Scholar]
- Ou J, Lian Z, Xie Let al. (2014) Atomic dynamic functional interaction patterns for characterization of ADHD. Hum Brain Mapp. 35:5262–78. [DOI] [PMC free article] [PubMed] [Google Scholar]
- Ouyang M, Kang H, Detre JAet al. (2017) Short-range connections in the developmental connectome during typical and atypical brain maturation. Neurosci Biobehav Rev. 83:109–22. [DOI] [PMC free article] [PubMed] [Google Scholar]
- Pantazis D, Joshi A, Jiang Jet al. (2010) Comparison of landmark-based and automatic methods for cortical surface registration. Neuroimage. 49:2479–93. [DOI] [PMC free article] [PubMed] [Google Scholar]
- Parent A (2014) Louis Pierre Gratiolet (1815-1865) and his contribution to the study of cerebral convolutions in primates. Neurosci Med. 5:1–8. [Google Scholar]
- Patti MA, Troiani V (2018) Orbitofrontal sulcogyral morphology is a transdiagnostic indicator of brain dysfunction. NeuroImage: Clinical. 17:910–7. [DOI] [PMC free article] [PubMed] [Google Scholar]
- Penttonen M, Buzsáki G (2003) Natural logarithmic relationship between brain oscillators. Thalamus Related Systems. 2:145–52. [Google Scholar]
- Pilz G-A, Shitamukai A, Reillo Iet al. (2013) Amplification of progenitors in the mammalian telencephalon includes a new radial glial cell type. Nat Commun. 4:2125. [DOI] [PMC free article] [PubMed] [Google Scholar]
- Piven J, Berthier ML, Starkstein SEet al. (1990) Magnetic resonance imaging evidence for a defect of cerebral cortical development in autism. Am J Psychiatry. 147:734–9. [DOI] [PubMed] [Google Scholar]
- Rakic P (1988) Specification of cerebral cortical areas. Science. 241:170–6. [DOI] [PubMed] [Google Scholar]
- Rash BG, Duque A, Morozov YMet al. (2019) Gliogenesis in the outer subventricular zone promotes enlargement and gyrification of the primate cerebrum. Proc Natl Acad Sci USA. 116:7089–94. [DOI] [PMC free article] [PubMed] [Google Scholar]
- Razavi MJ, Zhang T, Li Xet al. (2015) Role of mechanical factors in cortical folding development. Phys Rev E. 92:032701. [DOI] [PubMed] [Google Scholar]
- Régis J, Mangin J-F, Ochiai Tet al. (2005) “Sulcal root” generic model: a hypothesis to overcome the variability of the human cortex folding patterns. Neurol. Med. Chir. 45:1–17. [DOI] [PubMed] [Google Scholar]
- Reillo I, de Juan Romero C, García-Cabezas MÁet al. (2011) A role for intermediate radial glia in the tangential expansion of the mammalian cerebral cortex. Cereb Cortex. 21:1674–94. [DOI] [PubMed] [Google Scholar]
- Reillo I, Borrell V (2012) Germinal zones in the developing cerebral cortex of ferret: ontogeny, cell cycle kinetics, and diversity of progenitors. Cereb Cortex. 22:2039–54. [DOI] [PubMed] [Google Scholar]
- Rettmann ME, Han X, Xu Cet al. (2002) Automated sulcal segmentation using watersheds on the cortical surface. Neuroimage. 15:329–44. [DOI] [PubMed] [Google Scholar]
- Reveley C, Seth AK, Pierpaoli Cet al. (2015) Superficial white matter fiber systems impede detection of long-range cortical connections in diffusion MR tractography. Proc Natl Acad Sci USA. 112:E2820–8. [DOI] [PMC free article] [PubMed] [Google Scholar]
- Richiardi J, Altmann A, Milazzo ACet al. (2015) Correlated gene expression supports synchronous activity in brain networks. Science. 348:1241–4. [DOI] [PMC free article] [PubMed] [Google Scholar]
- Richman DP, Stewart R, Caviness V Jr (1974) Cerebral microgyria in a 27-week fetus: an architectonic and topographic analysis. J Neuropathol Exp Neurol. 33:374–84. [DOI] [PubMed] [Google Scholar]
- Richman DP, Stewart RM, Hutchinson JW Jr (1975) Mechanical model of brain convolutional development. Science. 189:18–21. [DOI] [PubMed] [Google Scholar]
- Rilling JK, Glasser MF, Preuss TMet al. (2008) The evolution of the arcuate fasciculus revealed with comparative DTI. Nat Neurosci. 11:426–8. [DOI] [PubMed] [Google Scholar]
- Rivière D, Mangin JF, Papadopoulos-Orfanos Det al. (2002) Automatic recognition of cortical sulci of the human brain using a congregation of neural networks. Med Image Anal. 6:77–92. [DOI] [PubMed] [Google Scholar]
- Roland PE, Zilles K (1994) Brain atlases - a new research tool. Trends Neurosci. 17:458–67. [DOI] [PubMed] [Google Scholar]
- Roland PE, Zilles K (1998) Structural divisions and functional fields in the human cerebral cortex. Brain Res Rev. 26:87–105. [DOI] [PubMed] [Google Scholar]
- Ronan L, Voets N, Rua Cet al. (2014) Differential tangential expansion as a mechanism for cortical gyrification. Cereb Cortex. 24:2219–28. [DOI] [PMC free article] [PubMed] [Google Scholar]
- Roth G, Dicke U (2005) Evolution of the brain and intelligence. Trends Cogn Sci. 9: 250–7. [DOI] [PubMed] [Google Scholar]
- Rubinov M, Sporns O (2010) Complex network measures of brain connectivity: uses and interpretations. Neuroimage. 52:1059–69. [DOI] [PubMed] [Google Scholar]
- Sang Y-F, Wang D, Wu J-Cet al. (2011) Wavelet-based analysis on the complexity of hydrologic series data under multi-temporal scales. Entropy. 13:195–210. [Google Scholar]
- Sepulcre J, Liu H, Talukdar Tet al. (2010) The organization of local and distant functional connectivity in the human brain. PLoS Comput Biol. 6:e1000808. [DOI] [PMC free article] [PubMed] [Google Scholar]
- Shen D, Davatzikos C (2003) Very high-resolution morphometry using mass-preserving deformations and hammer elastic registration. Neuroimage. 18:28–41. [DOI] [PubMed] [Google Scholar]
- Shen D, Wu G, Suk HI (2017) Deep learning in medical image analysis. Annu Rev Biomed Eng. 19:221–48. [DOI] [PMC free article] [PubMed] [Google Scholar]
- Shenton ME, Dickey CC, Frumin Met al. (2001) A review of MRI findings in schizophrenia. Schizophr Res. 49:1–52. [DOI] [PMC free article] [PubMed] [Google Scholar]
- Siegel M, Donner TH, Engel AK (2012) Spectral fingerprints of large-scale neuronal interactions. Nat Rev Neurosci. 13:121–34. [DOI] [PubMed] [Google Scholar]
- Smart IHM, Dehay C, Giroud Pet al. (2002) Unique morphological features of the proliferative zones and postmitotic compartments of the neural epithelium giving rise to striate and extrastriate cortex in the monkey. Cereb Cortex. 12:37–53. [DOI] [PMC free article] [PubMed] [Google Scholar]
- Smith SM, Fox PT, Miller KLet al. (2009) Correspondence of the brain's functional architecture during activation and rest. Proc Natl Acad Sci. 106:13040–5. [DOI] [PMC free article] [PubMed] [Google Scholar]
- Smith SM, Miller KL, Salimi-Khorshidi Get al. (2011) Network modelling methods for FMRI. Neuroimage. 54:875–91. [DOI] [PubMed] [Google Scholar]
- Smith SM, Beckmann CF, Andersson Jet al. (2013) Resting-state fMRI in the human connectome project. Neuroimage. 80:144–68. [DOI] [PMC free article] [PubMed] [Google Scholar]
- Stahl R, Walcher T, De Juan Romero Cet al. (2013) TRNP1 regulates expansion and folding of the mammalian cerebral cortex by control of radial glial fate. Cell. 153:535–49. [DOI] [PubMed] [Google Scholar]
- Stutterd CA, Leventer RJ (2014) Polymicrogyria: a common and heterogeneous malformation of cortical development. Am J Med Genet. 166C:227–39. [DOI] [PubMed] [Google Scholar]
- Takahashi E, Dai G, Wang Ret al. (2010) Development of cerebral fiber pathways in cats revealed by diffusion spectrum imaging. Neuroimage. 49:1231–40. [DOI] [PMC free article] [PubMed] [Google Scholar]
- Takahashi E, Folkerth RD, Galaburda AMet al. (2012) Emerging cerebral connectivity in the human fetal brain: an MR tractography study. Cereb Cortex. 22:455–64. [DOI] [PMC free article] [PubMed] [Google Scholar]
- Talairach J, Szikla G (1967) Atlas of Stereotaxic Anatomy of the Telencephalon. Paris: Masson and Cie. [Google Scholar]
- Taverna E, Götz M, Huttner WB (2014) The cell biology of neurogenesis: toward an understanding of the development and evolution of the neocortex. Annu Rev Cell Dev Biol. 30:465–502. [DOI] [PubMed] [Google Scholar]
- Thompson PM, Toga AW (1996) A surface-based technique for warping three dimensional images of the brain. IEEE Trans Med Imaging. 15:402–17. [DOI] [PubMed] [Google Scholar]
- Thompson PM, Woods RP, Mega Met al. (2000) Mathematical/computational challenges in creating deformable and probabilistic atlases of the human brain. Hum Brain Mapp. 9:81–92. [DOI] [PMC free article] [PubMed] [Google Scholar]
- Toro R, Burnod Y (2003) Geometric atlas: modeling the cortex as an organized surface. Neuroimage. 20:1468–84. [DOI] [PubMed] [Google Scholar]
- Tosun D, Rettmann ME, Prince JL (2004) Mapping techniques for aligning sulci across multiple brains. Med Image Anal. 8:295–309. [DOI] [PMC free article] [PubMed] [Google Scholar]
- Troiani V, Patti MA, Adamson K (2020) The use of the orbitofrontal H-sulcus as a reference frame for value signals. Eur J Neurosci. 51:1928–43. [DOI] [PMC free article] [PubMed] [Google Scholar]
- Turing AM (1952) The chemical basis of morphogenesis. Philosoph Transac R Soc of Lond Series B, Biol Sci. 237:37–72. [DOI] [PMC free article] [PubMed] [Google Scholar]
- Tzourio-Mazoyer N, Landeau B, Papathanassiou Det al. (2002) Automated anatomical labeling of activations in SPM using a macroscopic anatomical parcellation of the MNI MRI single-subject brain. Neuroimage. 15:273–89. [DOI] [PubMed] [Google Scholar]
- Uddin LQ, Supekar K, Amin Het al. (2010) Dissociable connectivity within human angular gyrus and intraparietal sulcus: evidence from functional and structural connectivity. Cereb Cortex. 20:2636–46. [DOI] [PMC free article] [PubMed] [Google Scholar]
- Van Den Heuvel MP, Sporns O (2011) Rich-club organization of the human connectome. J Neurosci. 31:15775–86. [DOI] [PMC free article] [PubMed] [Google Scholar]
- Van Den Heuvel MP, Kahn RS, Goñi Jet al. (2012) High-cost, high-capacity backbone for global brain communication. Proc Natl Acad Sci USA. 109:11372–7. [DOI] [PMC free article] [PubMed] [Google Scholar]
- Van Essen DC (1997) A tension-based theory of morphogenesis and compact wiring in the central nervous system. Nature. 385:313–8. [DOI] [PubMed] [Google Scholar]
- Van Essen DC, Drury HA, Joshi Set al. (1998) Functional and structural mapping of human cerebral cortex: solutions are in the surfaces. Proc Natl Acad Sci USA. 95:788–95. [DOI] [PMC free article] [PubMed] [Google Scholar]
- Van Essen DC (2005) A population-average, landmark- and surface-based (pals) atlas of human cerebral cortex. Neuroimage. 28:635–62. [DOI] [PubMed] [Google Scholar]
- Van Essen DC, Smith SM, Barch DMet al. (2013) The WU-Minn human connectome project: an overview. Neuroimage. 80:62–79. [DOI] [PMC free article] [PubMed] [Google Scholar]
- Von Stein A, Sarnthein J (2000) Different frequencies for different scales of cortical integration: from local gamma to long range alpha/theta synchronization. Int J Psychophysiol. 38:301–13. [DOI] [PubMed] [Google Scholar]
- Wang X, Tsai JW, LaMonica Bet al. (2011) A new subtype of progenitor cell in the mouse embryonic neocortex. Nat Neurosci. 14:555–61. [DOI] [PMC free article] [PubMed] [Google Scholar]
- Watanabe H, Nakamura M, Ohno Tet al. (2014) Altered orbitofrontal sulcogyral patterns in adult males with high-functioning autism spectrum disorders. Soc Cogn Affect Neurosci. 9:520–8. [DOI] [PMC free article] [PubMed] [Google Scholar]
- Watson JDG, Myers R, Frackowiak RSJet al. (1993) Area v5 of the human brain: evidence from a combined study using positron emission tomography and magnetic resonance imaging. Cereb Cortex. 3:79–94. [DOI] [PubMed] [Google Scholar]
- Watts DJ, Strogatz SH (1998) Collective dynamics of ‘small-world' networks. Nature. 393:440–2. [DOI] [PubMed] [Google Scholar]
- Weiner KS, Natu VS, Grill-Spector K (2018) On object selectivity and the anatomy of the human fusiform gyrus. Neuroimage. 173:604–9. [DOI] [PMC free article] [PubMed] [Google Scholar]
- White T, Andreasen NC, Nopoulos Pet al. (2003) Gyrification abnormalities in childhood-and adolescent-onset schizophrenia. Biol Psychiatry. 54:418–26. [DOI] [PubMed] [Google Scholar]
- White T, Su S, Schmidt Met al. (2010) The development of gyrification in childhood and adolescence. Brain Cogn. 72:36–45. [DOI] [PMC free article] [PubMed] [Google Scholar]
- Whittle S, Allen NB, Fornito Aet al. (2009) Variations in cortical folding patterns are related to individual differences in temperament. Psychiatry Research: Neuroimaging. 172:68–74. [DOI] [PubMed] [Google Scholar]
- Wing L (1997) The autistic spectrum. Lancet North Am Ed. 350:1761–6. [DOI] [PubMed] [Google Scholar]
- Woods R, Grafton ST, Holmes CJet al. (1998) Automated image registration: I. general methods and intrasubject, intramodality validation. J Comput Assist Tomogr. 22:139–52. [DOI] [PubMed] [Google Scholar]
- Xu G, Knutsen AK, Dikranian Ket al. (2010) Axons pull on the brain, but tension does not drive cortical folding. J Biomech Eng. 132:071013. [DOI] [PMC free article] [PubMed] [Google Scholar]
- Yagi A (2009) Abstract Parabolic Evolution Equations and their Applications. Springer Berlin Heidelberg. [Google Scholar]
- Yang S, Zhao Z, Cui Het al. (2019) Temporal variability of cortical gyral-sulcal resting state functional activity correlates with fluid intelligence. Front Neural Circ. 13:36. [DOI] [PMC free article] [PubMed] [Google Scholar]
- Yoshino M, Saito K, Kawasaki Ket al. (2020) The origin and development of subcortical U-fibers in gyrencephalic ferrets. Mol Brain. 13:1–9. [DOI] [PMC free article] [PubMed] [Google Scholar]
- Yu X, Chen H, Zhang Tet al. (2013) Joint analysis of gyral folding and fiber shape patterns. In: The 2013 IEEE 10th International Symposium on Biomedical Imaging. [Google Scholar]
- Yuan J, Li X, Zhang Jet al. (2018) Spatio-temporal modeling of connectome-scale brain network interactions via time-evolving graphs. Neuroimage. 180:350–69. [DOI] [PMC free article] [PubMed] [Google Scholar]
- Zeng T, Chen H, Fakhry Aet al. (2015) Allen mouse brain atlases reveal different neural connection and gene expression patterns in cerebellum gyri and sulci. Brain Struct Funct. 220:2691–703. [DOI] [PubMed] [Google Scholar]
- Zhang D, Guo L, Zhu Det al. (2013) Diffusion tensor imaging reveals evolution of primate brain architectures. Brain Struct Funct. 218:1429–50. [DOI] [PMC free article] [PubMed] [Google Scholar]
- Zhang S, Liu H, Huang Het al. (2018) Deep learning models unveiled functional difference between cortical gyri and sulci. IEEE Trans Biomed Eng. 66:1297–308. [DOI] [PMC free article] [PubMed] [Google Scholar]
- Zhang S, Zhao Y, Jiang Xet al. (2018b) Joint representation of consistent structural and functional profiles for identification of common cortical landmarks. Brain Imaging Behav. 12:728–42. [DOI] [PMC free article] [PubMed] [Google Scholar]
- Zhang S, Dong Q, Zhang Wet al. (2019a) Discovering hierarchical common brain networks via multimodal deep belief network. Med Image Anal. 54:238–52. [DOI] [PMC free article] [PubMed] [Google Scholar]
- Zhang S, Jiang X, Zhang Wet al. (2019b) Joint representation of connectome-scale structural and functional profiles for identification of consistent cortical landmarks in macaque brain. Brain Imaging Behav. 13:1427–43. [DOI] [PMC free article] [PubMed] [Google Scholar]
- Zhang T, Chen H, Guo Let al. (2014) Characterization of U-shape streamline fibers: methods and applications. Med Image Anal. 18:795–807. [DOI] [PMC free article] [PubMed] [Google Scholar]
- Zhang T, Razavi MJ, Li Xet al. (2016) Mechanism of consistent gyrus formation: an experimental and computational study. Sci Rep. 6:1–11. [DOI] [PMC free article] [PubMed] [Google Scholar]
- Zhang T, Razavi MJ, Chen Het al. (2017) Mechanisms of circumferential gyral convolution in primate brains. J Comput Neurosci. 42:217–29. [DOI] [PubMed] [Google Scholar]
- Zhang T, Li X, Jiang Xet al. (2020) Cortical 3-hinges could serve as hubs in cortico-cortical connective network. Brain Imaging Behav. 1–18. [DOI] [PMC free article] [PubMed] [Google Scholar]
- Zhang W, Lv J, Li Xet al. (2019) Experimental comparisons of sparse dictionary learning and independent component analysis for brain network inference from fMRI data. IEEE Trans Biomed Eng. 66:289–99. [DOI] [PubMed] [Google Scholar]
- Zhao L, Zhang T, Guo Let al. (2020) Gyral-sulcal contrast in intrinsic functional brain networks across task performances. Brain Imaging Behav. 3:1–16. [DOI] [PubMed] [Google Scholar]
- Zhou B, Khosla A, Lapedriza Aet al. (2016) Learning deep features for discriminative localization. In: The Proceedings of the IEEE Conference on Computer Vision and Pattern Recognition. Las Vegas, NV, USA: IEEE, 2921–9. . [Google Scholar]
- Zhou Y, Thompson PM, Toga AW (1999) Extracting and representing the cortical sulci. IEEE Comput Graph Appl. 19:49–55. [DOI] [PMC free article] [PubMed] [Google Scholar]
- Zhu D, Li K, Guo Let al. (2013) DICCCOL: dense individualized and common connectivity-based cortical landmarks. Cereb Cortex. 23:786–800. [DOI] [PMC free article] [PubMed] [Google Scholar]
- Zilles K, Schleicher A, Langemann Cet al. (1997) Quantitative analysis of sulci in the human cerebral cortex: development, regional heterogeneity, gender difference, asymmetry, intersubject variability and cortical architecture. Hum Brain Mapp. 5:218–22. [DOI] [PubMed] [Google Scholar]