

Summary
Mechanisms governing the maintenance of blood-producing hematopoietic stem and multipotent progenitor cells (HSPC) are incompletely understood; particularly, those regulating fate, ensuring long-term maintenance, and preventing aging-associated stem cell dysfunction. We uncovered a role for transitory free cytoplasmic iron as a rheostat for adult stem cell fate control. We found that HSPCs harbor comparatively small amounts of free iron and show activation of a conserved molecular response to limited iron - particularly during mitosis. To study the functional and molecular consequences of iron restriction, we developed models allowing for transient iron bioavailability limitation and combined single-molecule RNA quantification, metabolomics, single-cell transcriptomic analyses with functional studies. Our data reveal that activation of the limited iron response triggers coordinated metabolic and epigenetic events establishing stemness-conferring gene regulation. Notably, we find that aging-associated cytoplasmic iron loading reversibly attenuates iron-dependent cell fate control, explicating intervention strategies for dysfunctional aged stem cells.
eTOC Blurb
Preservation of adult stem cell identity following cell division is essential for sustained tissue maintenance and repair. Will, Kao and colleagues identify iron as a crucial regulator allowing hematopoietic stem cells to orchestrate metabolic and gene regulatory control during regenerative fate determination.
Graphical Abstract

Introduction
Bone marrow resident hematopoietic stem and multipotent progenitor cells (HSPC) sustain life-long blood formation1–4, but their function declines during aging.5,6 Accumulation of genetic and epigenetic gene-regulatory alterations occur in hematopoietic stem cells (HSC) over time and multiple cell replications.7,8 Albeit DNA repair-inflicted epigenetic infidelity has emerged as an important and reversible driver of aging9, clinically attainable strategies resetting this epigenetic attrition are unknown. Several mechanisms controlling stem cell identity and fate ensure long-term maintenance. How these programs are coordinated, particularly during cell division, and what triggers their aging-associated dysfunction10,11 has been unresolved. HSPC, as several other somatic stem cells, reside mostly in a quiescent state;3 infrequently dividing only when cued by distinct intrinsic12 and extrinsic signals13 to undergo cell division and contribute to mature blood cell production or replenish the stem cell pool.14,15 Each cell division demands wide-ranging molecular adaptations to meet the changing energetic and structural demands of mitosis.16–20 As these adaptations are largely incompatible with their sustained long-term function, stem cells must counteract mitosis-related molecular alterations - the processes at play have remained elusive thus far.
Our previous work uncovered the ability of iron chelating compounds to enhance the regenerative activity of human and mouse HSPC.21,22 The mechanistic driver had not been unresolved but our data suggested that intracellular labile iron restriction may play a critical role. Readily available iron catalyzes electron transfer reactions governing fundamental cellular processes, particularly those key for cell division.23 Eukaryotic cells contain numerous proteins relying on iron as a cofactor (e.g. in iron-sulfur (Fe-S) clusters) which are essential for DNA replication and repair, as well as metabolic catalysis and cell cycle progression24. However, cells limit the size of the intracellular labile iron pool (LIP), making up 0.1–3% of the total amount of cellular iron25, which curtails Fenton reaction-mediated ROS generation.26,27 Mechanisms defining LIP sizes are not well understood but may, at least partially, arise from a defined equilibrium of iron demand, storage capacity and local availability. Perturbations in LIP size rapidly trigger cellular iron homeostasis mechanisms, such as the activation of a highly conserved limited iron response restoring the LIP upon insufficient iron availability.27,28 Whether LIP size or iron homeostasis pathway activation change during hematopoiesis, and particularly cell division, has been unknown.
This study aimed at delineating the role and consequences of LIP restriction in the context of stem cell-specific metabolic and gene regulation, as well as in fate determination.
Results
HSPC contain the most restricted LIP among immature hematopoietic cells
The size of readily accessible functional intracellular LIP is influenced by the cellular state and function of cells.29,30 We employed a ferrous iron chemisensor (FeRhoNox) and fluorescence activated cell sorting (FACS) analysis to quantify cytoplasmic labile iron in cells of bone marrow (BM) derived immature hematopoietic cell compartments in young (2–3 months (mos.) old) mice.31,32 Compared with highly proliferative Lineage− (Lin−) and myeloid-restricted progenitor cells (Lin− cKit+ Sca-1−, LK), HSPC which are comprised of HSC (CD48− CD150+ 33 or CD34− 34 LSK (Lin−Sca-1+cKit+)) and multipotent progenitor (CD48−CD150− LSK33; MPP) cells harbor well detectable but smaller LIP (Fig. 1A), consistent with their lower energetic requirements.35–39 Moreover, key regulators of iron sensing, transport and storage are detectable at the protein level in HSPC (Fig. S1A). We found robust expression of iron importer CD71 (transferrin receptor, Tfrc) in HSC (Fig. S1A,B), albeit only a small fraction was presented at the cell surface (Fig. S1B’) as reported before40–42. HSC showed low expression of iron responsive protein 2 (IRP2; Ireb2) (Fig. S1A), an iron sensor degraded by the proteasome in iron replete conditions.43,44 These data show that young HSPC curtail their LIP under steady state conditions, and suggested iron homeostasis activation in at least a subpopulation of stem cells.
Figure 1. LIP restriction activates the limited iron response in HSC.
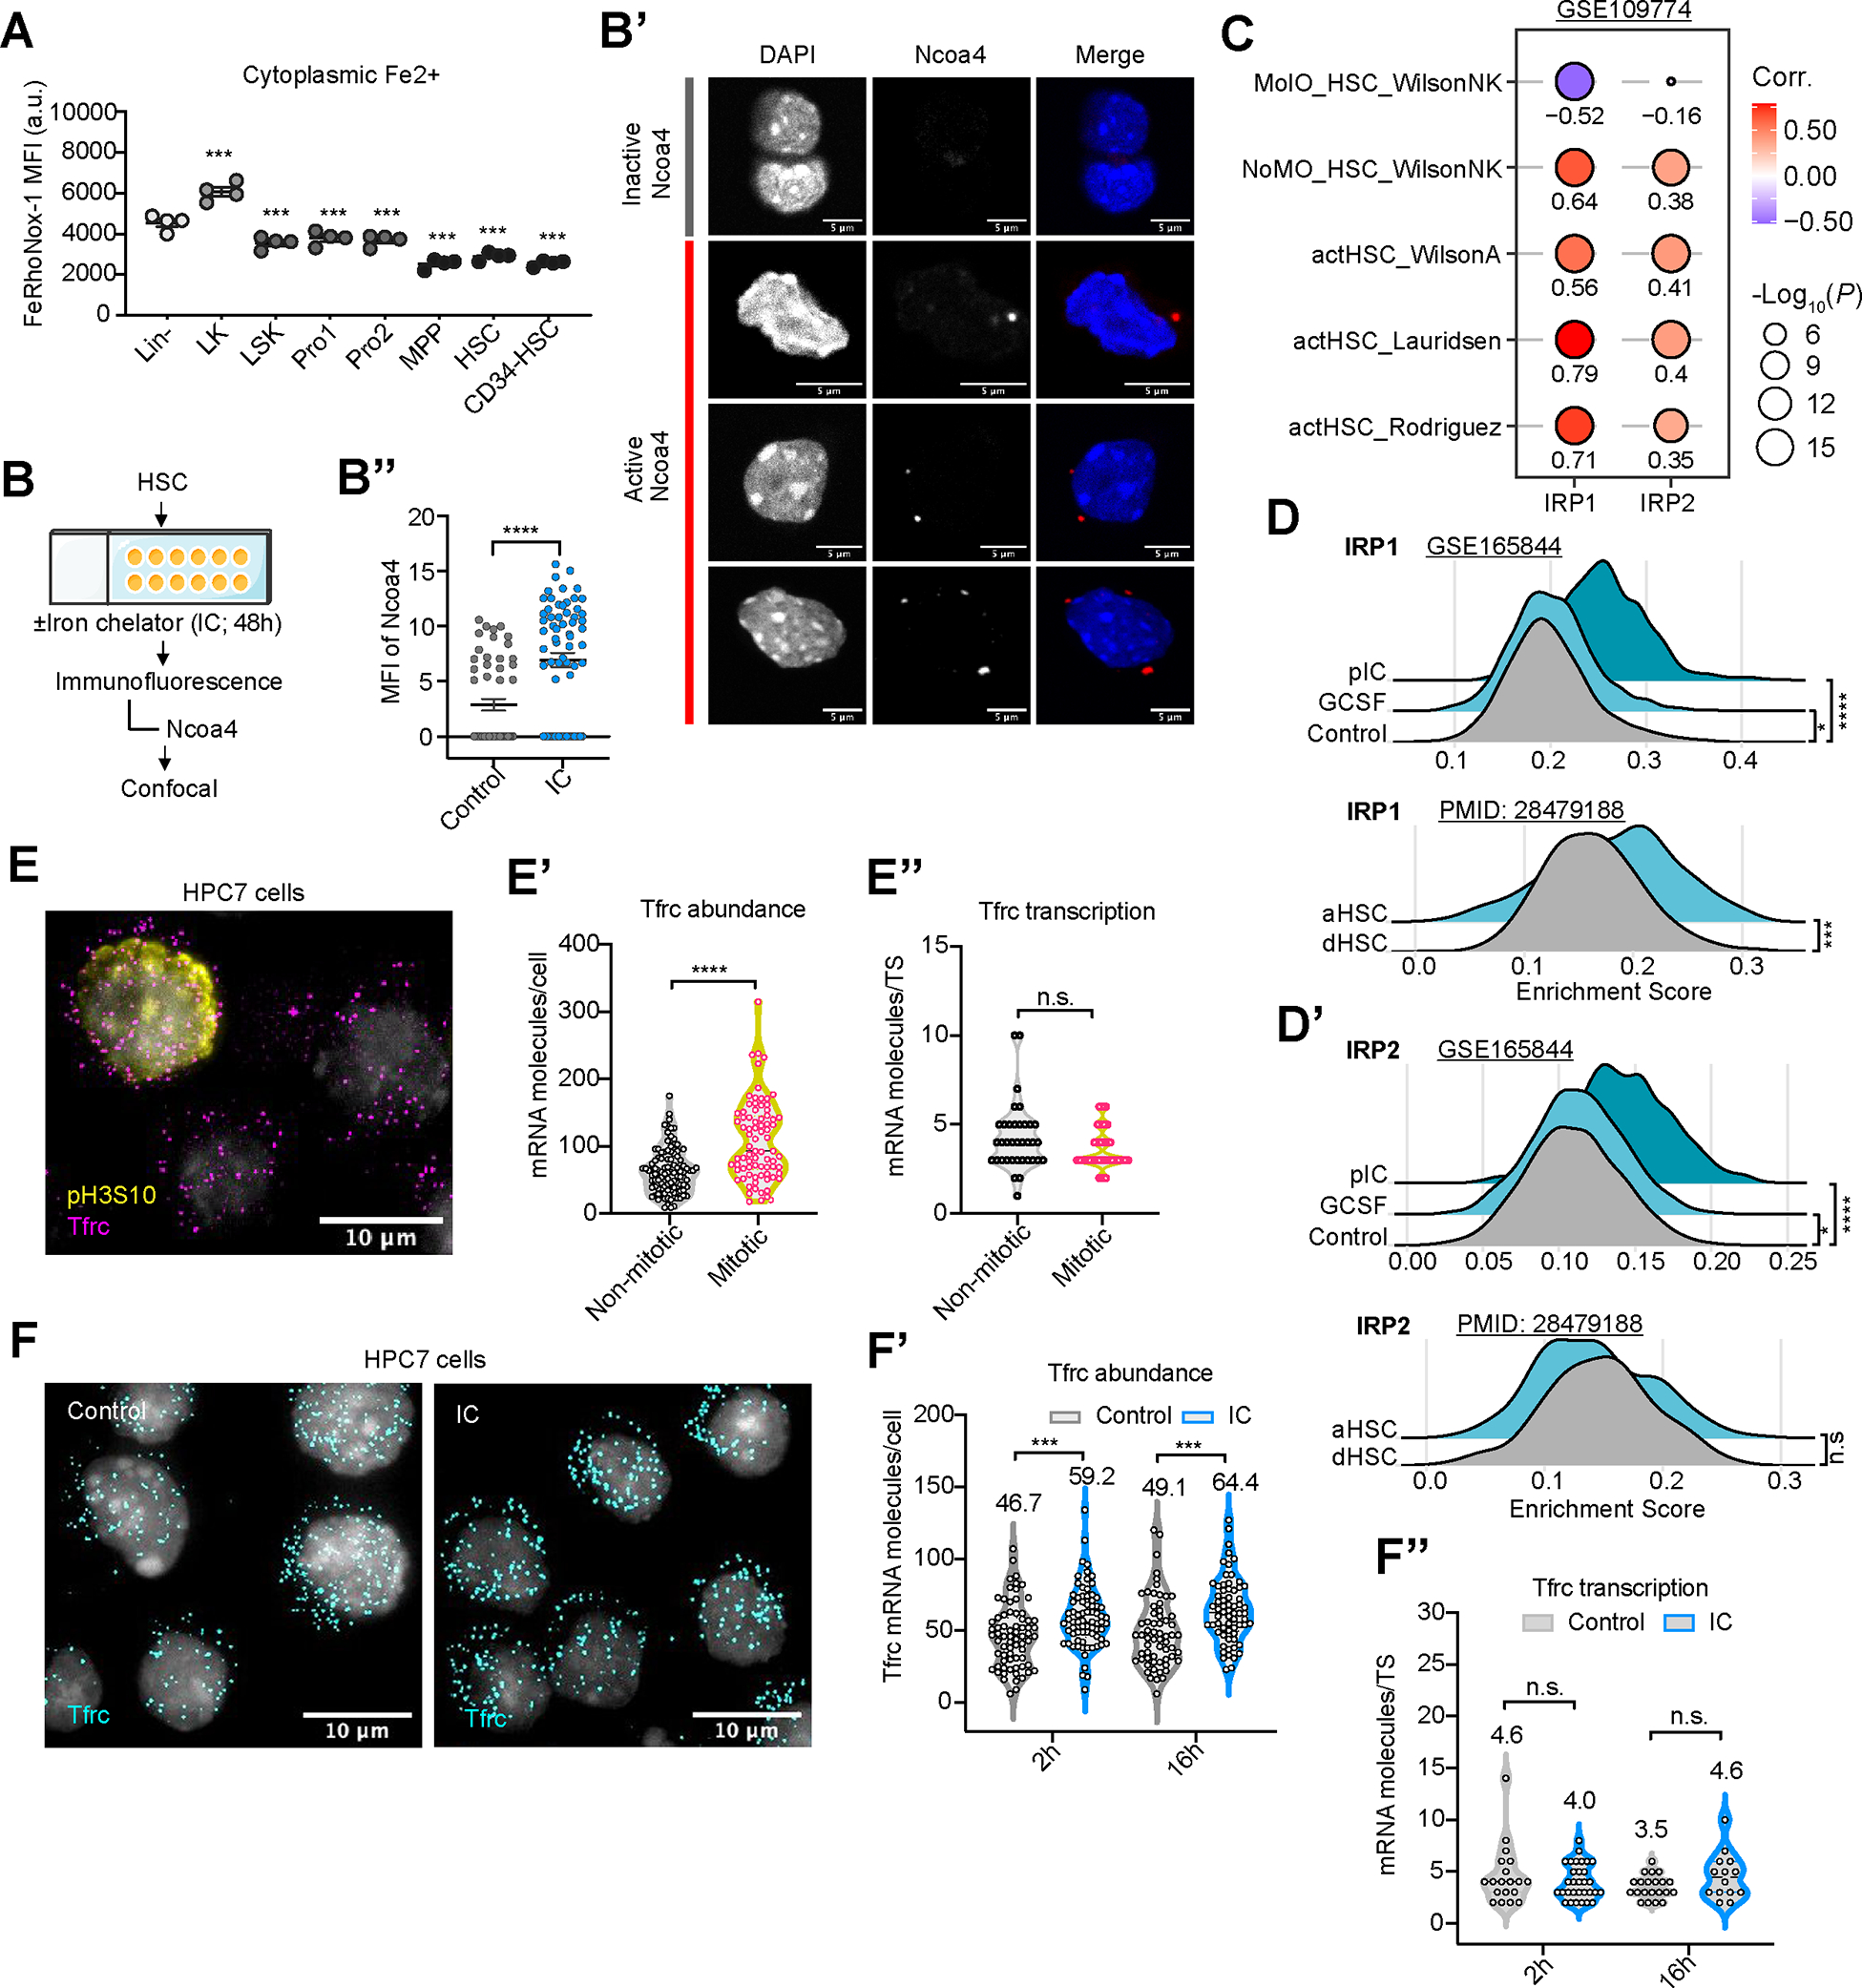
(A) Fe2+ LIP measurements in BM stem (HSC, CD150+CD48− LSK) and progenitor (LK, Lin− c-Kit+) cells using FeRhoNox and analysis by flow cytometry. n=4.
(B-B’’) Scheme of measuring ferritinophagy in HSC (B). Representative images (B’) and number of cells with activated Naco4 are shown (B’’). n=55 (Control), 66 (IC) cells.
(C) Correlation of enrichment score (ES) of IRP1 and IRP2 targets with ES of signatures for activated or quiescent HSC (using GSE109774). HSC activation signatures from Rodriguez et al (PMID: 32669716), Lauridsen et al (PMID: 30021172), Wilson A et al (PMID: 19062086), no molecular overlap (NoMO) from PMID:26004780. Signatures for quiescent HSC were defined by PMID:26004780 as the molecular overlapping population (MolO). Correlation estimated using Pearson coefficient R and linear regression t-test.
(D,D’) ES of IRP1 (D) and IRP2 (D’) targets in activated vs. quiescent HSC in scRNA-seq datasets GSE165844 (HSC activation after 2hr exposure to G-CSF or poly(I:C)); PMID 28479188: GFP label-retaining dormant HSC (dHSC) or GFP-negative activated HSC (aHSC).
(E-E’’) Filtered and overlaid images of treated HPC7 stained with Tfrc smRNA FISH, phosphoSer10 Histone H3 (E) and DAPI. Scale bars, 10 μm; Violin plots of absolute numbers of cytoplasmic Tfrc mRNA molecules per cell (E’), pS10H3+ (mitotic; n=80) and pS10H3− (non-mitotic; n =104) cells; Violin plot of Tfrc nascent mRNA per transcription start site (TS) in non-mitotic (n=36) and mitotic (n=34) cells (E’’).
(F-F’’) Filtered and overlaid images of cells stained with smRNA FISH for Tfrc, control vs. IC-treated HPC7 cells. Violin plots of Tfrc mRNA molecules per cell after 2hrs (n=71 (Control); n=74 (IC)) or 16hs (n=62 (control); n=66 (IC)) (F); or nascent Tfrc mRNA per TS after 2hrs (n=19 (Control); n=31 (IC)); or 16hrs (n=21 (control); n=14 (IC)) (F’’).
If not specified otherwise, data are mean ± SEM (A, B’’). Significance indicated as *p<0.05, **p<0.01, ***p<0.001, ****p<0.0001 was calculated using Student’s t test (unpaired: B’’, D, D’, E’, E’’, F’, and F’’; paired: A).
HSPC activate a limited iron response during mitosis
We next probed how HSPC would respond to acute experimental iron limitation (Fig. S1C). Compared with controls, iron chelator (IC)-exposed primary HSPC showed elevated CD71 cell surface presentation (Fig. S1D), and increased uptake of transferrin (Fig. S1E–E’’) upon IC treatment. IC exposure further led to stabilization Ncoa4, a rate-limiting ferritinophagy effector45 (Fig. 1B–B’’; S1F); it also prompted rapid decrease of iron-soring ferritin (Fig. S1G,H) in HPC7 cells, a well-established mouse HSPC cell line46.
Restriction of intracellular labile iron is sensed and corrected by iron responsive proteins 1 and 2 (IRP1, IRP2). These proteins bind RNA stem loops formed by iron responsive elements (IRE) in transcripts encoding proteins driving iron-, oxygen- and energy metabolism, including CD71-encoding Tfrc, to post-transcriptionally control protein translation.47 Single cell gene expression data set analysis of murine BM cells showed a strong, positive correlation of experimentally validated IRP-targets in regenerating (activated) HSPC (Fig. 1C). Similarly, IRP targets were significantly enriched in activated primary HSC (Fig. 1D,D’). Short-term exposure to IC triggered differential transcript expression of known IRP targets in purified HSC (Fig. S1I). We hypothesized that metabolic changes in the lead-up to cell division increase iron demand and stimulate the IRP/IRE system which is experimentally phenocopied by exposure to IC. To test this prediction, we quantified Tfrc abundance and transcription at single cell and single-molecule resolution using single-molecule RNA fluorescence in situ hybridization (smRNA-FISH)48 (Fig. S1J–K’’). We performed Tfrc smRNA-FISH on cell cycle-synchronized HPC7 cells along with detection of pH3S10 to allow for the identification of mitotic cells (Fig. 1E). Compared with non-mitotic (pH3S10neg) cells, mitotic (pH3S10pos) cells showed an increase in cytoplasmic mRNA levels (Fig. 1E’) without elevated transcriptional activity (Fig. 1E’’; S1L,L’). Consistently, IC exposure of only 2hrs sufficed to significantly augment cytoplasmic Tfrc (Fig. 1F–F’). At the same time, IC-exposed cells displayed no signs of increased transcriptional activity at the Tfrc locus (Fig. 1F’’; S1M). In further support, Tfrchigh expressing primary HSPC showed significantly higher enrichment of gene signatures of activated stem cells than Tfrclow expressing cells (Fig. S1N).
These observations demonstrate that HSPC sense and counteract acute iron limitation by mounting a canonical limited iron response.
Activation of the limited iron response increases HSPC regeneration
To gain better insights into the acute molecular effects of experimental iron limitation in stem cells from young animals, we conducted single cell transcriptomic analysis of primary HSPC (CD150+CD48− LSK (Lin−Sca-1+cKit+)) following ex vivo IC (or vehicle control) treatment for 48hrs (Fig. S2A). Uniform manifold approximation and projection (UMAP) analysis uncovered seven clusters (C0–6) in control and IC-treated specimen (Fig. 2A); latent time prediction identified C0 and C1 as the least, and C4–6 as more differentiated cell entities (Fig. 2A’). Gene set enrichment analysis (Fig. S2B; Table S1) allowed the inference of cell identities denominating cell in C0–3 as HSC-like, and C4–6 as megakaryocytic (Mk) lineage-primed multipotent progenitor cells (Fig. 2B). We found 9.6% more stem-like cells (C0–3) at the expense of Mk-primed HSPC (C4–6) following IC exposure compared with controls (Fig. 2B’; S2C,D).
Figure 2. Activation of the labile iron response enhances regenerative activity of HPSC.
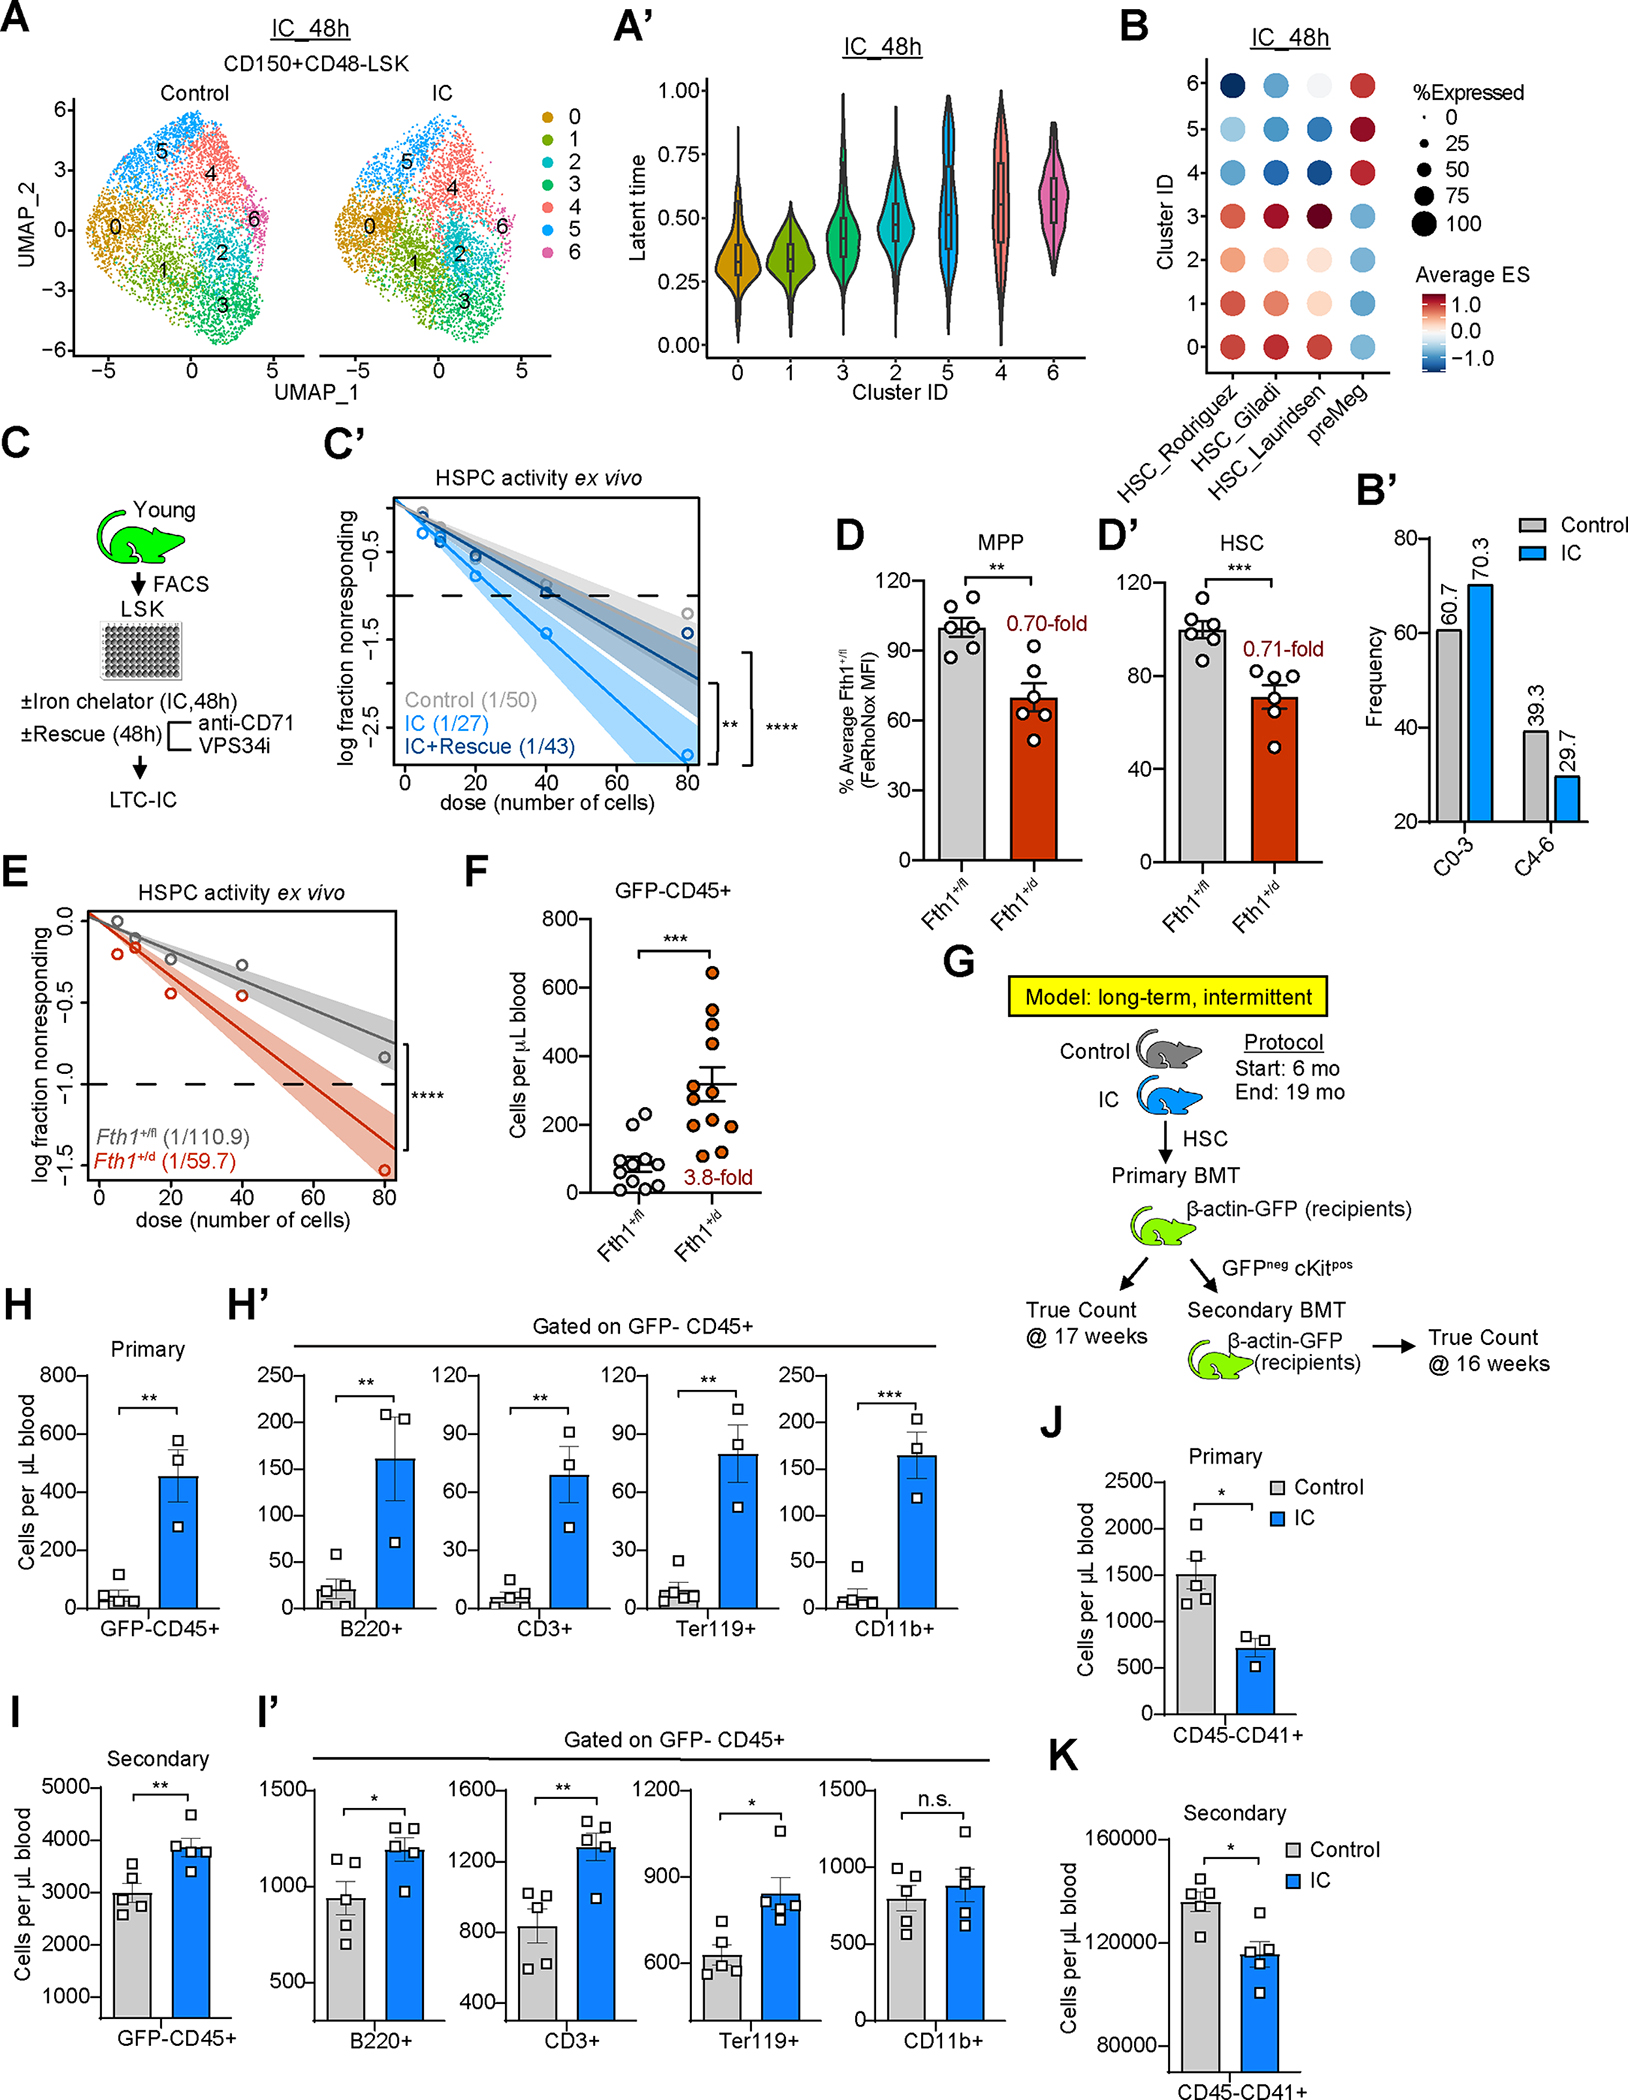
(A-A’) UMAP plot of cell clustering of HSC 48hrs after ex vivo treatment with DFO (IC) or vehicle control. Equal numbers of cells (4000) shown for IC and control (A). Latent time analysis of HSC clusters. Latent time of 0 represents least differentiated state (A’).
(B-B’) Score of HSC signatures from Rodriguez et al. (PMID: 32669716), Giladi et al. (PMID: 29915358), and Lauridsen et al. (PMID: 30021172), as well as pre-meg (Mk-primed) signature from Rodriguez et al. (PMID: 32669716) in induced clusters (B). Proportion of HSC-like (C0, C1, C2, C3) and Mk-primed (C4, C5, C6) clusters in IC vs. control (B’).
(C-C’) Experimental strategy to quantify regenerative HSC activity upon IC exposure alone or with Vps34 inhibitor and a CD71 blocking antibody (C). LTC-IC frequencies (shown in parentheses) by ELDA (C’). n=5
(D,D’) Fe2+ LIP measurements in MPP (D) and HSC (D’) cells comparing heterozygous Fth1 (Fth1+/d) or wild-type (Fth1+/fl) BM by FeRhoNox and flow cytometry. n=6
(E) Quantification of functional HSPC in heterozygous Fth1 (Fth1+/d) or wild-type (Fth1+/fl) LSK cells using LTC-IC assay. LTC-IC frequencies were shown in parentheses. n=7
(F) 6-week engraftment after intra-femural transplantation of Fth1+/d or Fth1+/fl HSC into beta-actin-GFP expressing recipients. n=11 (control) or 12 (+/d). Overall donor cell (GFP−CD45+) chimerism.
(G) Experimental strategy.
(H-I’) Multi-lineage cell output of HSC after LT-Int IC. Donor cell engraftment of control or IC-treated HSC in recipient mice upon primary (H, H’) and secondary (I, I’) transplantation. (H,I) CD45+ donor (GFP−) cells; (H’,I’) B220+ B cells, CD3+ T cells, Ter119+ erythroid cells, and CD11b+ myeloid cells.
(J,K) Donor-derived cells derived platelets (GFP−CD45− CD41+ FSC/SSClow) in recipient mice of primary (J) and secondary (K) transplantation.
If not specified otherwise, data are mean ± SEM (D, D’, F and H-K). Significance indicated as *p<0.05, **p<0.01, ***p<0.001, ****p<0.0001 was calculated using Student’s t test (unpaired: D, D’, F, and H-K), or Poisson statistics (C’, E).
To test whether acute activation of the limited iron response has functional consequences in HSPC, we pulse-treated purified young LSK cells with IC alone or in combination with pharmacological blockade of iron import and intracellular iron mobilization. We then measured stem cell activity in long-term culture-initiating cell (LTC-IC) assays (without any further treatment), which showed that inhibition of iron homeostasis pathway activation reversed the stem cell-stimulatory phenotype of transient acute iron limitation (Fig. 2C,C’; S2E). Moreover, heterozygous deletion of Fth1 (Fth1flox)49 by Vav-Cre (referred to as Fth1d/wt; Fig. S2F,G; Fig. 2H–H’’’)50, restricting Fe2+ in MPP and HSC by ~30% (Fig. 2D,D’), increased LTC-IC activity of Fth1d/wt LSK cells (Fig. 2E) and multilineage regeneration capacity of HSC six weeks after transplantation (Fig. 2F; Fig. S2I–J’’’’) compared with controls. These results demonstrate that activation of the limited iron response is important for regenerating HSPC.
Development of a model of controlled iron restriction
We next established in vivo mouse models of controlled transient experimental iron limitation using deferoxamine (DFO), an extracellular IC.51 DFO is extensively used for mitigating pathological iron accumulation in patients; it is safe and precisely adjustable to the degree of iron overload in pediatric and adult patients52,53; and does not lead to iron deficiency in adults54–56 or children57,58 with appropriate total body iron content. To monitor acute effects of IC-mediated LIP restriction on HSPC in vivo, we subjected young mice (2–3-mos. old) for 14 days to daily injections of IC (or vehicle) (Fig. S2K; referred to as short-term IC intervention). This regimen effectively reduced body and cellular iron levels without causing overt iron deficiency phenotype (Fig. S2K’–M’’). While we did not observe a change in phenotypical HSPC numbers (Table S2), we found an increase in regenerative capacity (LTC-IC activity) of LSK cells isolated from IC-treated mice compared with vehicle control-treated cells (Fig. S2N).
Regenerative capacity of HSPC gradually declines over time in humans and mice.59–62 We next probed for the consequences of experimental iron restriction on long-term HSPC regeneration for which we subjected 6-month-old mice to a 13-month intermittent IC regimen (Fig. S2O; referred to as long-term intermittent (LT-Int) IC treatment). This treatment was well tolerated (S2P–Q’’) and restricted LIP size by 13.4% ± 7.1% (p<0.01) in HSC and 14.3% ± 8% (p<0.05) in myeloid-biased CD41+ HSC compared with mock treated control animals (Fig. S2R–R’’). We did not observe quantitative changes of phenotypical HSPC or mature hematopoietic cells upon this treatment (Table S2). However, HSC isolated from LT-Int IC-treated mice showed a remarkably augmented regenerative capacity evidenced by an almost 10.1 ± 3.4-fold (p=0.001) increase in total donor-derived hematopoietic cells along with robust and balanced multi-lineage output (Fig. 2G–H’) following adoptive cell transfer. The enhanced regenerative capacity of LT-Int IC-exposed HSPC persisted upon secondary transplantation (in absence on continued IC treatment) (Fig. 2I,I’). We also found reduced donor HSPC-originating platelets (Fig. 2J,K) and Mk-progenitors (Fig. S2S) in recipients of LT-IC HSC, in line with the observed reduction of Mk-biased HPSC following long-term LIP restriction (Fig. 2B,B’).
Together, this set of data strongly supports that intracellular iron limitation enhances the regenerative capacity of HSC and suggested long-term LIP restriction may be beneficial to safeguard HSPC function during aging.
Labile iron pool restriction improves the regenerative capacity of aged HSPC
Loss of iron homeostasis can occur during aging and manifests as iron deficiency anemia63; perturbed intracellular iron partition; decreased Fe-S cluster and heme biosynthesis64–68; or intracellular iron loading in terminally differentiated cells of several tissues69–73. We next assessed whether aging-associated impairment of iron homeostasis may contribute to the functional attrition of aged HSPC.
Comparative analysis of differential gene expression in aged mouse HSC and plasma protein levels in elderly humans (vs. young controls) uncovered a substantial overlap of dysregulated molecular pathways;74,75 which resembled genetically-induced iron overload76 (Fig. S3A). Gene expression alterations in aged HSC were inversely correlated with those found upon short-term IC exposure; particularly genes upregulated during aging were detected at lower abundance upon pharmacological LIP restriction (Fig. S3B,B’; Table S3). These affected genes with roles in megakaryopoiesis, and were enriched in mostly dormant Mk lineage-biased, von Willebrandt factor positive (Vwf+) HSC (Mk-HSC; known to expand and confer a platelet-bias during aging)77,78,79 (Fig. S3C). We also found an expanded LIP in HSC (by 34% ± 24.6%, p=0.024), and lineage-committed progenitors (by 23% ± 5%, p=0.018) isolated from aged mice compared with control cells from young animals (Fig. 3A,A’); a similar expansion of the LIP was detected in aged multipotent and committed progenitor cells (Fig. S3D). Assessment of peripheral blood iron parameters of aged mice showed no signs of an overt systemic iron overload (Fig. S3E).
Figure 3. LIP restriction protects HSC regeneration during aging.
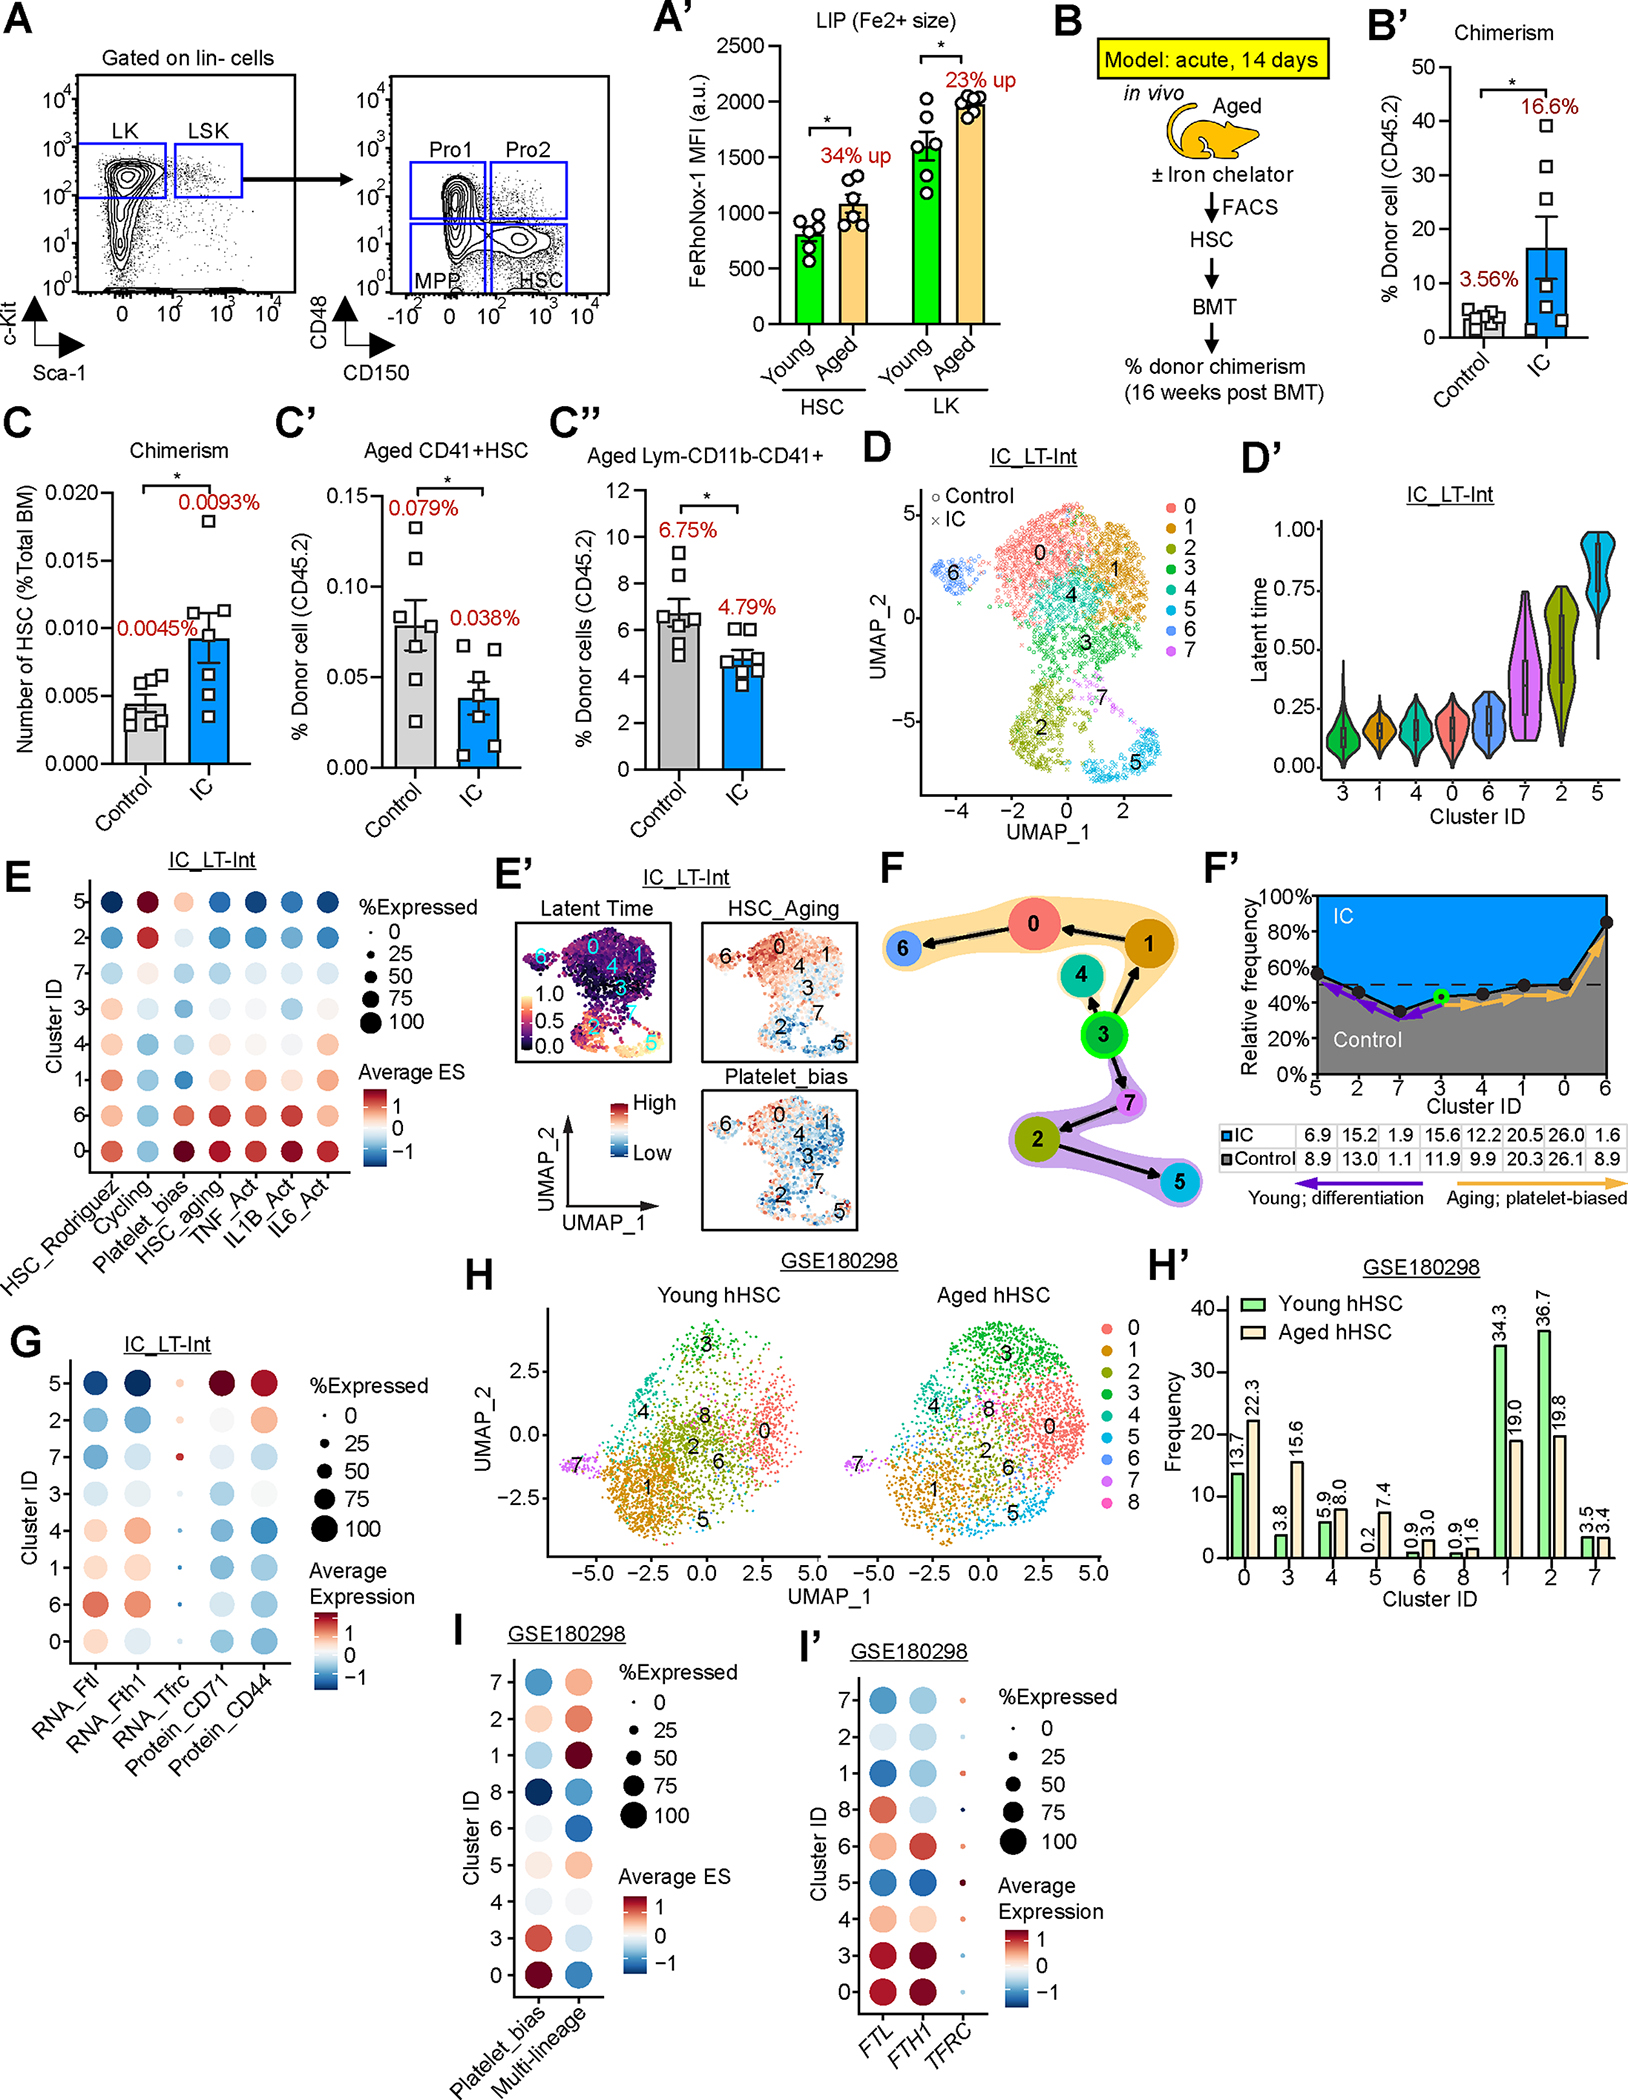
(A) Gating strategy for HSPC.
(A’) Fe2+ measurements in BM stem (HSC, CD150+CD48− LSK) and progenitor (LK, Lin−c-Kit+) cells (as in (A) from young (2–3mos.) and aged (22–24mos.) mice using FeRhoNox and FACS analysis. n 6.
(B-C’’) Donor-derived cells in recipient bone marrow 16 weeks after transplantation. (B) Experimental strategy to evaluate the effect of acute iron chelation on aged HSC. (B’) total CD45.2+ cells in BM of recipients; (C) CD45.2+ HSC; (C’) CD41+ HSC; (C’’) Mk-progenitors (CD41+CD3−CD4−CD8−B220−CD11b−). n=7.
(D-G) CITE-seq analysis of HSPC from LT-Int mice IC at 19 mos. of age. (D) UMAP plot of HSC clustering; (D’) Latent time analysis; (E) Average signature score of different gene sets across HSC clusters. (E’) UMAP plot with scores of the latent time, signature of HSC aging and platelet bias gene sets across different clusters. (F,F’) Trajectory inference of HSC clusters determined by scVelo latent time and PAGA. Arrows indicate differentiation direction between clusters with highest connectivity (F). Relative frequency of HSC clusters in IC vs. control groups; frequencies of different clusters shown underneath (F’). Relative frequencies stacked onto a 100% scale. (G) Average abundance of Tfrc, Ftl, and Fth1, as well as CD44 and CD71 on the cell across clusters.
(H-I’) Analysis of scRNA-seq data from human HSPC (GSE180298). (H) UMAP plot of clustering aged vs. young human cells. HSC cluster defined by positive expression of CD34, CRHBP, and HOPX. (H’) Proportion of clusters found altered in aged donors. (I,I’) Average signature scores of gene signatures for HSC with platelet bias or multi-lineage potential (I); average expression of FTL, FTH1, and TFRC across HSC clusters (I’).
If not specified otherwise, data are mean ± SEM (A’ and B’-C’’). Significance indicated as *p<0.05 was calculated using Student’s t test (unpaired: A’, B’-C’’).
Chronic iron overload can be detrimental for cells,80 and is known to compromise HSC maintenance76,81. To test whehter modest intracellular iron loading contributes to the dysfunction of aged HSPC, we subjected aged mice to short-term in vivo iron limitation and subsequently assessed stem cell function by competitively transplanting equal numbers of purified phenotypical HSC into lethally irradiated young congenic recipients (Fig. 3B). The treatment was well tolerated in these cohorts (Fig. S3F; Table S2). All recipients showed an overall low donor cell chimerism, in line with previous work82; notably, recipients of short-term IC-treated aged donor stem cells showed an increase in overall donor cell chimerism (Fig. 3B’; S3G), and a 2.1 ± 1.1-fold (p=0.028) increase in donor-derived phenotypical HSC (Fig. 3C). We detected a concomitant 0.49 ± 0.31-fold (p=0.033) decrease in HSC and progenitors with cell surface presentation of glycoprotein (Gp) IIb/IIIa integrin (CD41) (Fig. 3C’). CD41+ HSC harbor a Mk-lineage differentiation bias and expand during aging.77 Recipients of IC-treated aged HSC showed reduced Mk-cell generation compared with control cell recipients (Fig. 3C’’). Consistently, ex vivo IC treatment of purified HSC followed by quantification of Mk-progenitors showed alleviation of the Mk-differentiation bias of aged stem cells (Fig. S3H) upon iron limitation (Fig. S3H’, H’’) consistent with a cell-autonomous effect. These data support that a moderately expanded LIP contributes to reversible aging-associated HSC dysfunction.
CITE-seq analysis of purified LSK populations isolated from aged mice having undergone LT-Int IC treatment (Fig. S3I) suggested that long-term LIP restriction can attenuate HSPC aging. We identified eight clusters (C0–7) (Fig. 3D) within CD150-presenting CD48-negative HSC (Fig. S3J); latent time analysis predicted C3, 1, 4, 0 and 6 as the least differentiated- and clusters 7, 2, and 5 as more differentiated stem cells (Fig. 3D’). Clusters 0, 1, and 6 showed higher enrichment scores of signatures for HSC aging and pro-inflammatory pathways, while gene expression of C3 cells resembled that of the young (Fig. 3E; S3K,K’); C0 and 6 were found likely to be platelet-biased HSC, and C5 Mk/platelet-biased progenitors (Fig. 3E,E’). LT-Int IC treatment increased lineage-unbiased HSC (C3) and actively cycling HSPC (C2) while reducing aged Mk/platelet-biased stem (C6) and progenitor (C5) cell populations (Fig. 3F–F’; Table S4).
Together, these observations show that iron loading and LIP expansion occur in aging HSPC and raised the possibility of iron-mediated fate determination.
Iron dependent stem cell fate control
We next quantified mRNA levels of Tfrc and Ftl and Fth1, as well as cell surface abundance of iron importers, CD71 and CD44 across C0–7 mouse HSC (Fig. 3G); and similarly analyzed published human single HSPC data (Fig. 3H–I’). Molecularly “young”, lineage-unbiased HSC seem to curtail their LIP as efficiently as chronologically young stem cells. Low-output/quiescent and high(er)-output/moderately cycling mouse HSC (C3 and 7, respectively) lacked the molecular tell-tale signs of aging, inflammation and platelet bias (Fig. 3E) and showed low Ftl and Fth1 expression and CD71 and CD44 cell surface presentation (Fig. 3G), in agreement with an iron-limited status. Aged human HSPC (Fig. 3H,H’) also harbored “young-like” subpopulations hallmarked by a lack of Mk-lineage bias (Fig. 3I; S3L) and low levels of FTL and FTH (C1, 2, 7; Fig. 3I’; S3M,N); notably, relative frequencies of some of these cell populations (C1, C2) markedly decline in the elderly (Fig. 3H’). This strongly suggests that LIP expansion does not uniformly occur in the aging HSPC population.
We collected evidence that primary dividing stem cells activate the limited iron response in vivo. Cycling mouse HSPC which lack aging and inflammation-associated signatures (C2, 5, 7; Fig. 3E) show the highest presentation of CD71 and/or CD44 on their cell surface; some of these cells also harbored high Tfrc expression alongside low abundance of Ftl and Fth1 (Fig. 3G). C2, 5 and 7 together constitute 20% of the HSC and consistent with the size of non-quiescent stem cell pools at steady state83. The HSC activation signature also strongly correlated with gene expression in stem cells with high Tfrc abundance (Fig. S3O,O’). We found similar subsets of cells showing an increase in TFRC abundance in a distinct subset of human HSPC (C1, 5 and 7; Fig. 3I’) with multilineage reconstitution capacity (Fig. 3I) in concomitant functional assays79.
Furthermore, we found evidence for an aged, Mk-biased HSC population to be sensitive to experimental LIP restriction. We observed a marked reduction of molecularly defined dormant Mk-primed mouse HSC (dMk-HSC) (C6) upon in vivo iron limitation (1.6% vs. 8.9% in controls) (Fig. 3F’). HSC subpopulations, unified by molecular features of stem cell aging and inflammation (Fig. 3E; C0, 1, 4 and 6), showed increased Ftl abundance with concomitantly low CD71 and CD44 presentation (Fig. 3G) consistent with an elevated intracellular iron load in these cells. Particularly C6 cells showed the highest levels of Ftl and Fth1 and lower abundance of CD71 and CD44 on their cell surface across all clusters. In support, young Vwf+ stem cells (enriched for dMk-HSC)84,85 also harbor increased expression of Ftl1 mRNA levels compared with Vwf-negative HSC (which are highly regenerative and lack Mk-bias84) (Fig. S3P–P’’). Elevated Ftl mRNA levels in Vwf+ HSC vs. Vwf− HSC and upon aging strongly suggest that mouse dMk-HSC have a higher labile iron content86,87 than other stem cell populations. Consistently, Mk-biased human HSC (C0, C3) not only expand during aging (Fig. 3H’,I) they also share the highest FTL and FTH levels among all HSPC subpopulations (Fig. 3I’).
These observations strongly support that iron homeostasis is essential for HSC fate control during long-term regeneration, and that iron-responsive gene regulation preserves stemness-programs in HSC. We next set out to characterize the underlying molecular mechanism at play.
Iron-responsive gene regulation is controlled by Tip60
Compared with controls, short-term ex vivo IC exposed HSPC showed signs of lysine acetyl transferase 5 / HIV-1 Tat-interacting protein 60 kD (Tip60) activation (Fig. 4A,B; Fig. S4A,B). Upon nuclear localization, Tip60 acts as the catalytic subunit of the NuA4 (nucleosome acetyltransferase of histone 4) complex; its chromatin binding activity increases due to co-factor independent autoacetylation upon elevated acetyl-CoA levels.88,89 Tip60/NuA4 activates select genes through acetylation of core histone (H) 4 at lysines (K) 5, 8 and 12, H2A at K5,90,91 and histone variants H2AX and H2AZ.92 We found a positive enrichment of H2AZac, H4K5ac, H4K8ac, H4K12ac, or H4K16ac-decorated genes in HSC following IC exposure (Fig. 4C); and noted enrichment of genes with transcription-activating mono- and tri methylation marks on H3K493, and transcriptional fidelity-enhancing trimethylated H3K3694 in HSC following IC treatment, which appeared to be concentrated at Tip60-occupied genes (Fig. 4C). Nuclear abundance of Tip60 (Fig. 4D,D’) and its chromatin recruitment (Fig. 4E) increased upon LIP restriction in young HSPC.
Figure 4. LIP restriction enhances Tip60-dependent fatty acid turn-over in HSPC.
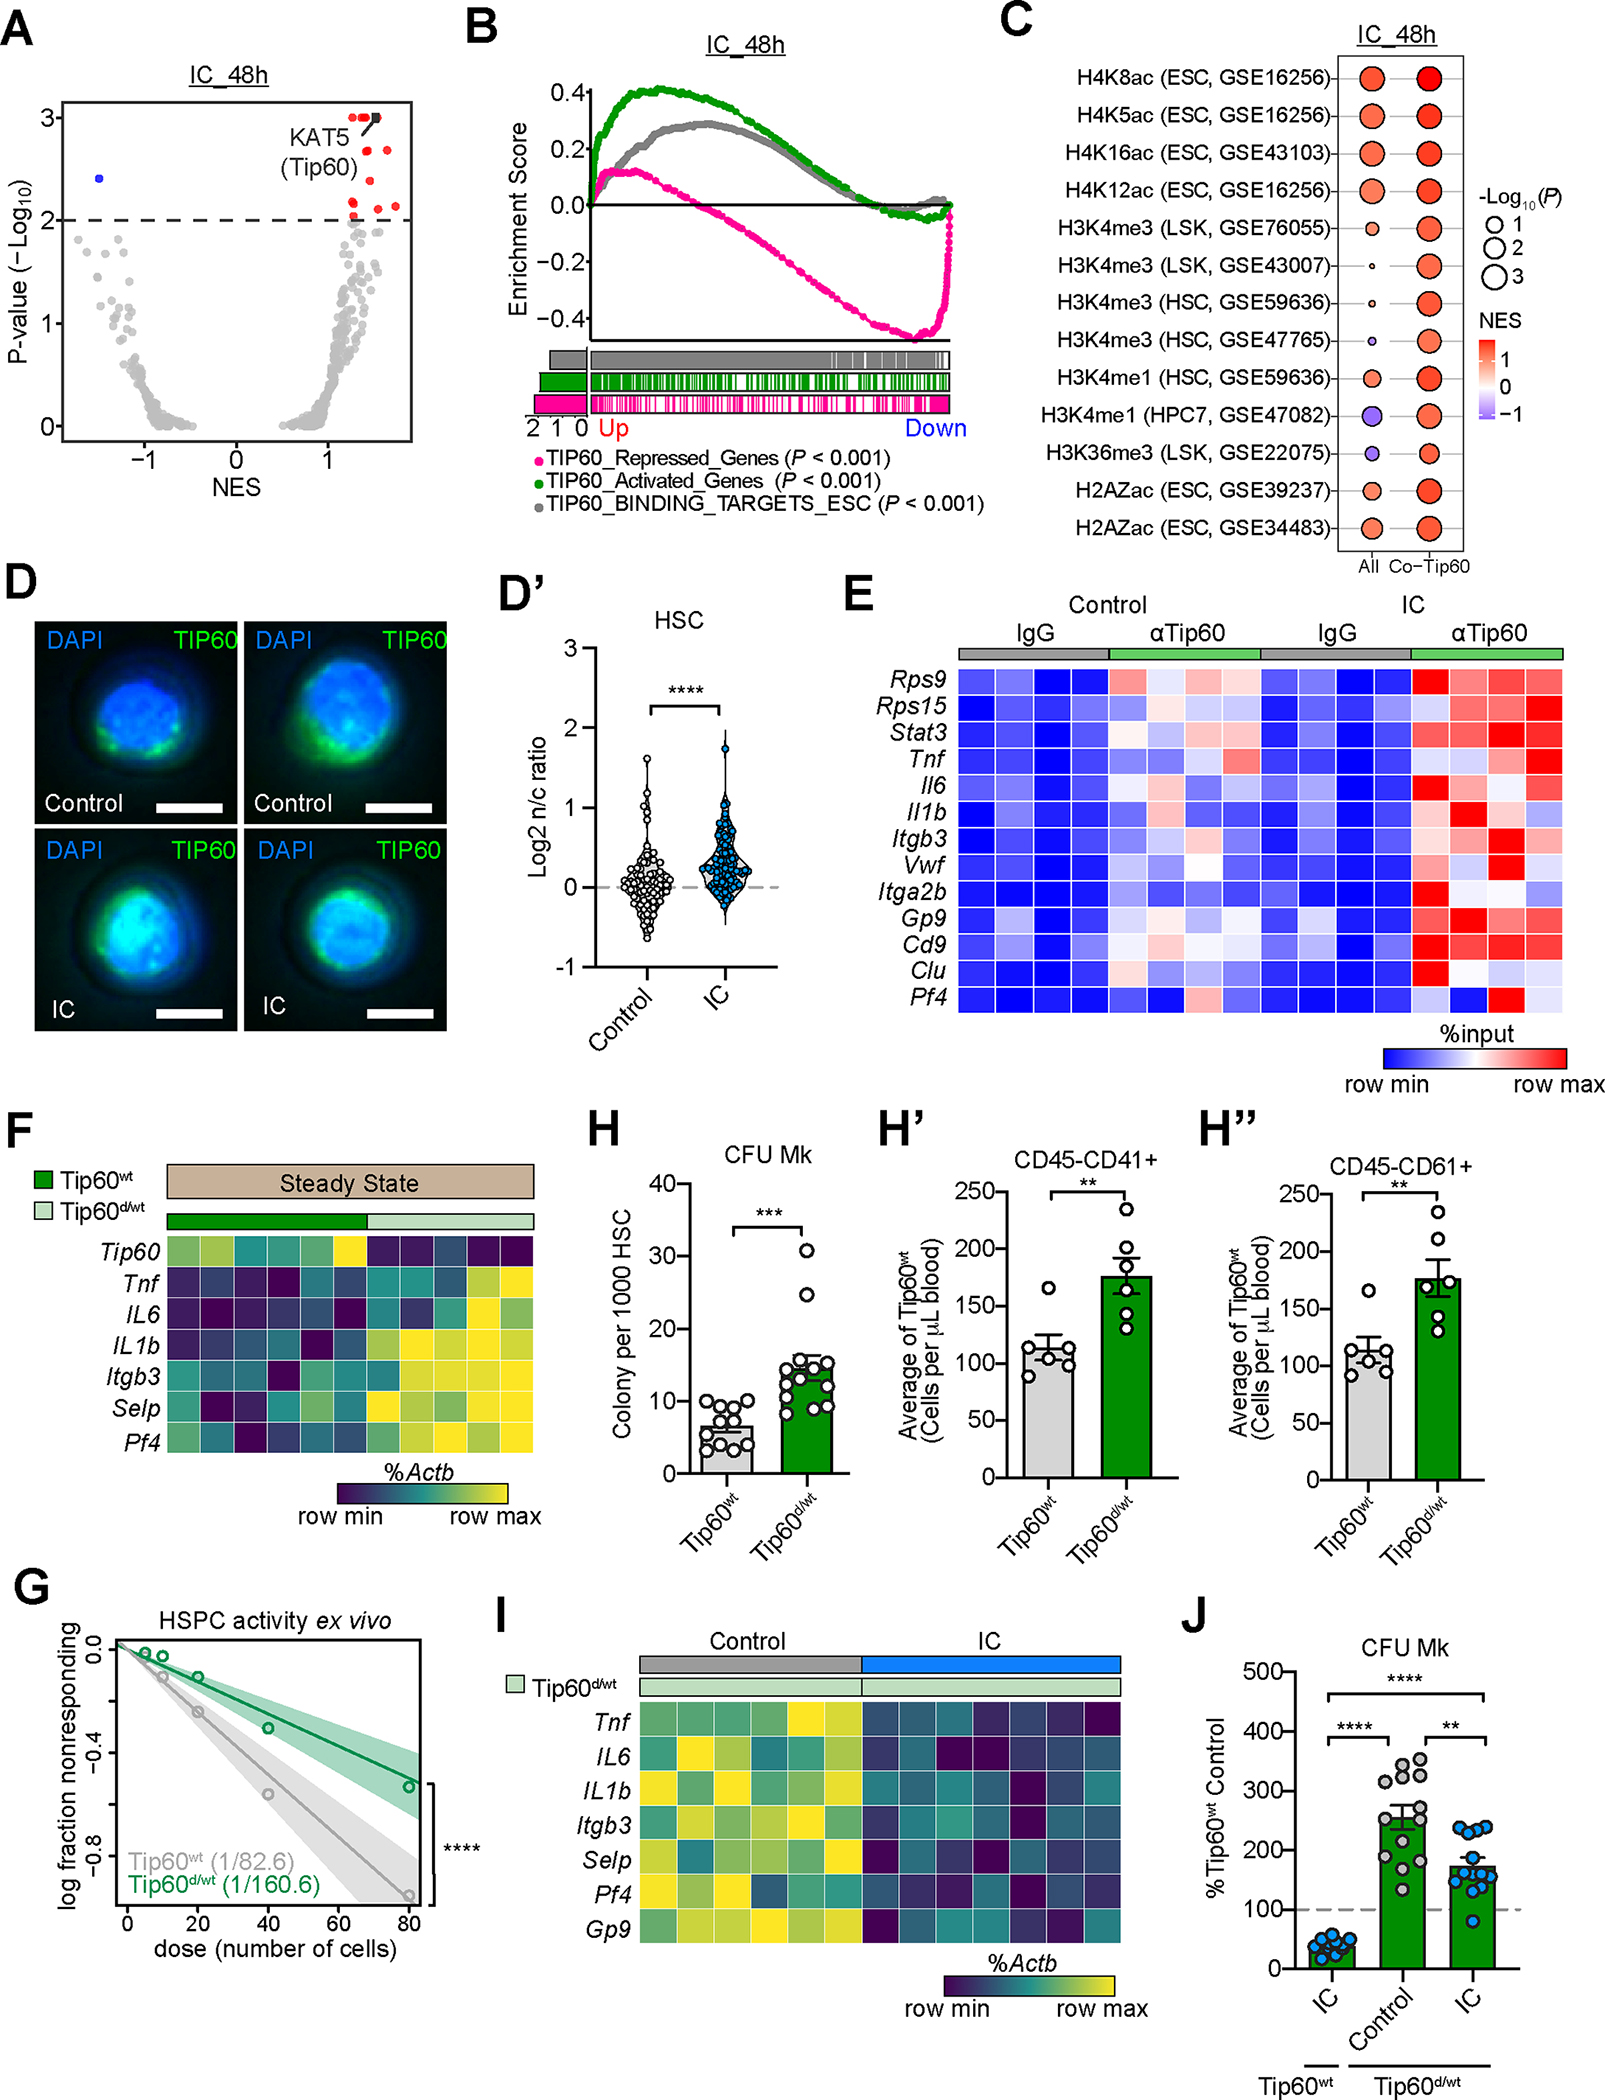
(A-C) scRNA-seq of HSC following ex vivo IC (or vehicle) treatment for 48hrs. (A) Volcano plot of normalized enrichment scores (NES) of transcription factor targets (C3 GTRD transcription factor targets) by GSEAPreranked analysis. (B) GSEAPreranked analysis with Tip60-related up-regulated (Up) and down-regulated (Down) gene sets. (C) Balloon plot showing GSEAPreranked analysis of IC-associated expression profile in HSC with histone modifications and Tip60 binding-associated gene sets.
(D,D’) Nuclear to cytoplasmic ratio (n/c) of Tip60 protein upon IC stimulation ex vivo for 16hrs in young HSC. Immunofluorescence images (D) and quantification (D’) are shown. n=79 or 94. Scale bars, 5μm.
(E) Tip60 occupancy in gene promoters by CUT&RUN using LSK cells ex vivo cultured with IC or vehicle control for 48hrs, followed by qPCR with pull-down DNA. Data presented as % of input; color was scaled relative to the minimal (blue) and maximum (red) values of each gene. Significantly different (p<0.05) gene occupancy by Tip60 (IC vs. Control) are shown. n=4
(F) Expression of Tip60 regulated iron dependent genes in purified HSC from Tip60 wildtype (Tip60wt) and Tip60 haploinsufficient (Tip60d/wt) mice by qRT-PCR. Data are presented as % of Actb, color was scaled relative to the minimal (dark teal) and maximum (yellow) values of each gene. Significantly different (p<0.05) gene expression (wt vs. d/wt) are shown. n=6
(G) Quantification of functional HSPC in Tip60d/wt or Tip60wt LSK cells using LTC-IC assay. LTC-IC frequencies shown in parentheses. n=7 or 8
(H-H’’) Megakaryocytic output of purified HSC (CD150+CD48− LSK) fromTip60d/wt mice compared with Tip60wt controls. Ex vivo colony formation in MegaCult assays (H, n=11 or 13); in vivo platelet generation (CD45− CD41+ (H’) and CD45−CD61+ (H’’); n=6) upon transplantation.
(I) Expression of Tip60-regulated iron-dependent genes in activated (2-month continuous low-dose lipopolysaccharide treatment in vivo) Tip60d/wt HSC treated with vehicle or intermittent IC (LPS+IC; rescue). n=6 or 7
(J) Quantification of CFU-Mk colonies from Tip60wt or Tip60d/wt HSC, and their response to IC normalized to percent of wildtype control. n=11–13
If not specified otherwise, data are mean (H-H’’ and J) ± SEM. Significance indicated as *p<0.05, **p<0.01, ***p<0.001, ****p<0.0001 was calculated using Student’s t test (unpaired: D’ and H-H’’; paired: J), or Poisson statistics (G).
See also Figure S4.
Gene-specificity of the Tip60/NuA4 complex is conferred by several transcription factors, including Myc95,96,92. In the absence of elevated cMyc in the majority of stem cells upon IC exposure (Fig. S4C), Myc target genes were differentially expressed upon IC treatment (Fig. S4D), consistent with increased Myc activity in regenerating HSC97,98 (Fig. S4E,E’). HSPC isolated from a mouse model of iron overload76 further showed a substantial overlap of pathways shared with differential gene expression found in Myc or Tip60 deficient HSC (Fig. S4F). Moreover, we discovered that transient inhibition of Tip60 or Myc99 curtailed the gene regulatory and functional effects of acute iron limitation in HSPC (Fig. S4G–H’’). These data show that Tip60 and Myc cooperate in the regulation of functionally relevant iron-responsive gene expression in HSPC.
Tip60 is essential for sustained HSC maintenance; its homozygous loss in hematopoietic cells leads to rapid BM failure in mice.92 We next assessed, whether reduced Tip60 levels would be sufficient to compromise HSC function. HSPC derived from young hematopoietic cell-specific Tip60 haploinsufficient mice (Tip60flx/wt CAGGCre-ER™; referred to as Tip60d/wt)100 (Fig. S4I,I’) exhibited loss of Tip60 dependent gene regulation, particularly the de-repression of Mk and inflammation-associated genes (Fig. 4F; S4I’’). LTC-IC activity was reduced upon deletion Tip60 (Fig. 4G) alongside increased platelet production in vivo (Fig. 4H–H’’; S4J,J’). While acute iron limitation did not rescue the compromised function of Tip60-null (Tip60d/d) HSC (Fig. S4K–K’’), it restored Tip60-dependent gene regulation and curtailed the aberrant Mk-bias in regenerating Tip60d/wt HSC (Fig. 4I,J; S4L,L’).
Labile iron pool restriction augments fatty acid turnover
In support of LIP restriction impinging on metabolic control in stem cells, we found that primary mouse HSPC showed activation of gene expression of programs associated with lipid- and arachidonic acid metabolism, as well as fatty acid (FA) biosynthesis following LIP restriction compared with controls (Fig. 5A); and metabolomics analysis uncovered changes consistent with elevated lipid metabolism and acetyl-CoA levels following acute experimental iron limitation in HSPC (Fig. S5A; Table S5).
Figure 5. LIP restriction protects regenerative capacity of HSC during aging.
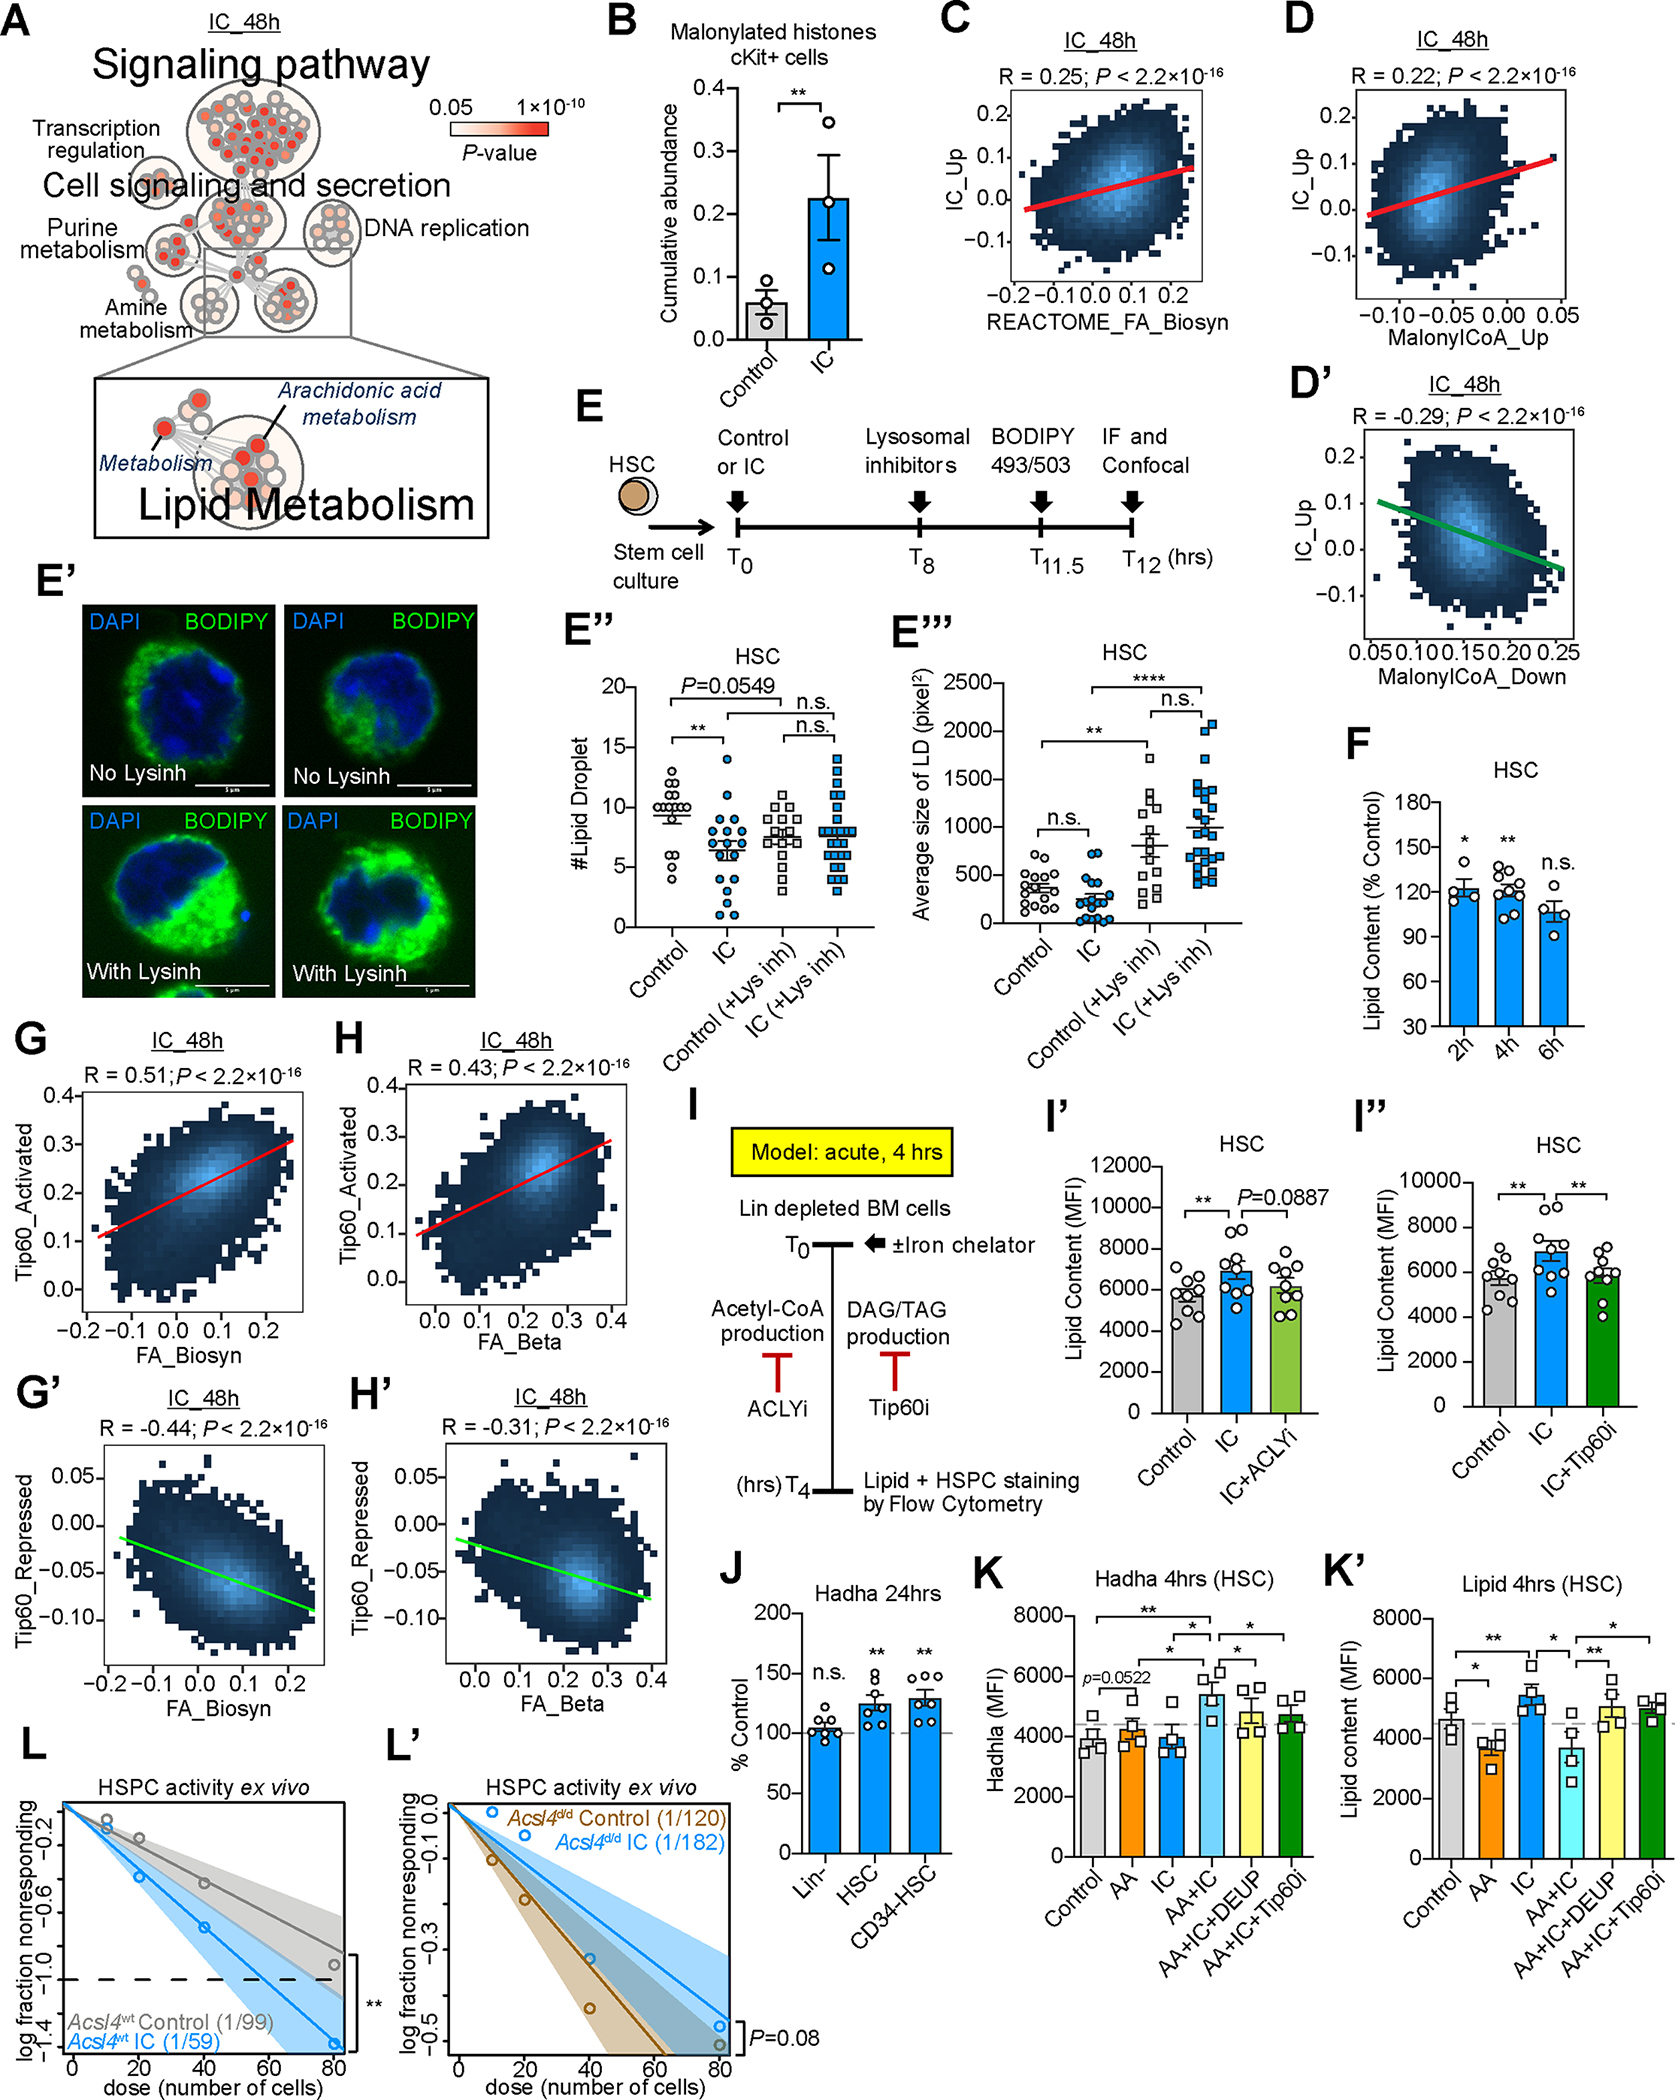
(A) Pathway network analysis of differential genes in mouse HSC upon 48 hours IC in vitro exposure. Significantly enriched pathways (p<0.05) by NetworkAnalyst analysis. Each circle represents a pathway, the color intensity is a mapping of enrichment significance p-value.
(B) Abundance of malonylated histones in control versus IC (DFO, 10 μM) treated c-Kit+ BM cells for 12hrs. n=3
(C-D’) Correlation of enrichment score of up-regulated genes in IC-treated HSC (CD150+CD48− LSK), with fatty acid biosynthesis (C) and up-regulated (D) or down-regulated (D’) DEG in malonyl-CoA treated LSK cells (GSE173256) in scRNA-seq of 48h IC-treated HSC.
(E-E’’’) LD turnover in young HSC upon a 12hr IC (or vehicle) treatment. Scheme illustrating introduction of iron chelator (IC, DFO), lysosomal inhibitors (leupeptin, NH4Cl) and lipid labeling dye (BODIPY 493/503) (E). Representative immunofluorescence images (control) are shown (E’), along LD numbers (E’’) and size (E’’’). n=18–39
(F) Quantification of neutral lipid content in young HSC after acute IC for 2, 4 or 6hrs in culture using LipiGreen and analysis by flow cytometry. n=4–9
(G-G’) Correlation of enrichment scores of genes activated (G) and repressed (G’) by Tip60 and associated with FA anabolism.
(H-H’) Correlation of enrichment scores of genes activated (H) and repressed (H’) by Tip60 and associated with FA catabolism.
(I-I’’) Scheme illustrating quantification of neutral lipid content in young HSC upon 4hrs in culture in the presence of an iron chelator alone, in combination with ATP citrate lyase inhibition (ACLYi, 20 μM SB 204990), or a Tip60 inhibitor (TH1834, 10 μM) (I). Neutral lipid content after acute IC alone or in combination with ACLYi (I’). n=9. Lipid content after acute iron chelation alone or in combination with Tip60i (I’’). n=9.
(J) Quantification of Hadha levels in Lin− BM cells, HSC and CD34− HSC populations 24hrs after IC exposure compared with vehicle controls. n=7
(K-K’) Quantification of Hadha levels (K) and lipid content (K’) by flow cytometry analysis in aged HSC after a 4hr exposure to arachidonic acid (AA, 40 μM) or IC (DFO, 20μM) alone, or in combination with inhibition of lipase (DEUP, 20μM) or Tip60 (TH1834, 10 μM). n=4
(L-L’) HSPC enumeration by LTC-IC following IC treatment with LSK cells from Acsl4 wildtype (Acsl4wt, L) or Acsl4 KO (Acsl4d/d, L’). Estimated LTC-IC frequencies in parentheses. n=4
If not specified otherwise, data are mean (B, E’’, E’’’, F, I’, I’’, and J-K’) ± SEM. Significance indicated as *p<0.05, **p<0.01, ***p<0.001, ****p<0.0001 were calculated using Student’s t test (unpaired: E’’, E’’’; paired: B, F, I’, I’’, and J-K’), Poisson statistics (L and L’), or Pearson coefficient R and linear regression t test (C-D’ and G-H’).
FA metabolism is required for stem cell self-renewal101. In support of ongoing fatty acid synthesis (FAS), we found increased global histone acetylation, a highly sensitive and reversible sensor for fluctuating acetyl-CoA levels102; especially a gain in malonyl marks (Fig. 5B), activation of FAS (Fig. 5C), and malonyl-CoA associated gene expression programs (Fig. 5D,D’) in HSPC following IC treatment. FA can be subjected to de novo lipogenesis (DNL) of storage lipids (such as triacylglycerides (TAG) and diacylglycerides (DAG)) budding off the endoplasmic reticulum as lipid droplets (LD).103 We next quantified LD-formation and turnover104 in primary HSC (Fig. 5E,E’). Compared with controls, IC-treated HSC showed a lower number of LD (Fig. 5E’’) with a modestly reduced average size (Fig. 5E’’’). Inhibition of LD turnover105 increased LD size while modestly reducing LD numbers in control cells, consistent with increased fusion events103. LD-turnover inhibition similarly affected IC and control HSC (Fig. 5E’’,E’’’). Together, this indicated constitutive lipid mobilization in HSC at steady state which increases upon acute iron limitation. Next, we quantified neutral lipid abundance106 longitudinally following acute iron limitation. Compared with vehicle-cultured HSC (Fig. S5B), IC exposure acutely increased neutral lipid content at 2 and 4hrs, which became indistinguishable at 6hrs after treatment (Fig. 5F), indicating augmented DNL following iron restriction. As we also found strong correlation of Tip60-dependent gene regulation with FA oxidation (FAO) and biosynthesis-associated gene expression programs (Fig. 5G–H’), we speculated that Tip60, an activator of DNL in adipocytes107, partakes in the control of lipid metabolism in HSPC. In support, we found that acute impairment of Tip60 attenuated acute neutral lipid accumulation upon IC in primary HSC (Fig. 5I–I’’). This implicates Tip60 in HSPC FA metabolism and revealed that synthesized FA are primarily subjected to TAG/DAG production.
Under nutrient deprivation, cells mobilize FA from LD to increase FAO108,109. We next tested whether acute iron limitation increased FA flux to enhance mitochondrial β-oxidation in HSPC. In line, compared with control HSPC, we found elevated levels of hydroxyacyl-CoA dehydrogenase trifunctional multienzyme complex subunit alpha (Hadha), a rate limiting enzyme catalyzing long-chain FA oxidation,110 24hrs after IC treatment (Fig. 5J; S5C), or upon heterozygous deletion of Fth1 (Fig. S5D–D’’’). Furthermore, we observed increased abundance of Hadha in IC-treated HPC7 cells (Fig. S5E–E’’) which showed a concomitant increase in long-chain polyunsaturated FA arachidonic acid (20:4; AA) levels (Fig. S5F). We speculated that increasing extracellular AA abundance may augment IC-triggered lipid turnover and FAO. In support, combined AA supplementation and IC treatment increased Hadha levels in primary HSC (Fig. 5K,K’), as well as lineage-committed progenitor cells (Fig. S5G) compared with single agent controls. Notably, purified primary HSC showed a concomitantly decreased LD content when exposed to AA alone or in combination with IC, which could be abrogated by blocking either lipolysis or TAG synthesis (Fig. 5K’). This indicates that DNL and AA uptake synergistically enhance FAO upon acute iron limitation in HSC. In contrast, lineage-restricted progenitor cells increased Hadha upon IC and AA single agent treatment, but did not show a further elevation upon co-treatment (Fig. S5G), indicating that progenitor cells increase FAO predominantly through extracellular FA uptake.
We furhter found that inhibition of carnitine palmitoyltransferase I (CPT-1a), mediating long-chain FA import into mitochondria111, prevented LTC-IC activity stimulation upon acute IC treatment of HSPC compared with single agent and mock treatment controls (Fig. S5H–H’’). Genetic ablation of acyl-CoA synthetase long-chain family member 4 (Acsl4), which preferentially activates AA112 for mitochondrial import and whose abundance increased upon IC treatment (Fig. S5I), also attenuated the stem cell stimulatory effects of IC treatment in primary HSPC (Fig. 5L,L’; Fig. S5J–L’’).
Together, these data show that regenerative HSPC activity is supported by iron-dependent augmentation of FA metabolism.
Mitigating intracellular iron loading restores Tip60 activity in aged HSC
We next predicted that aging-associated LIP expansion may blunt Tip60 activation. In support, we found that gene signatures of Tip60 impairment strongly correlated with HSC aging (Fig. S6A–B), or genetically-induced iron overload (Fig. S6B). Compared with young counterparts, aged HSC showed reduced Tip60 protein abundance (Fig. 6A,A’), chromatin recruitment (Fig. 6B) and loss of Tip60-dependent gene regulation (Fig. 6C–D’). Platelet-biased HSC with inferior peripheral blood contribution (“low-output”) (Fig. S6C–D’) showed loss of Tip60-dependent gene repression and activation compared with high-output HSC (Fig. S6E–F’). These observations suggested loss of iron-dependent Tip60-mediated gene expression as a functional driver of HSC aging. In line, ex vivo IC treatment increased Tip60’s nuclear abundance (Fig. 6E,E’), chromatin occupancy (Fig. 6F) and target gene expression (Fig. 6G; S6G) in aged stem cells compared with vehicle treated control stem cells. Notably, we found that iron-dependent Tip60-mediated gene regulation relied on FA metabolism (Fig. 6H,H’), and appears to be a driver of IC-mediated Mk-differentiation restriction in aged HSC (Fig. S6H–H’’). Together, these data establish Tip60 activation as an important mechanistic component of the enhanced regenerative capacity of aged HSC following LIP restriction.
Figure 6. Iron chelator-mediated labile iron pool restriction restores Tip60 activity and mitigates aging-associated HSC dysfunction.
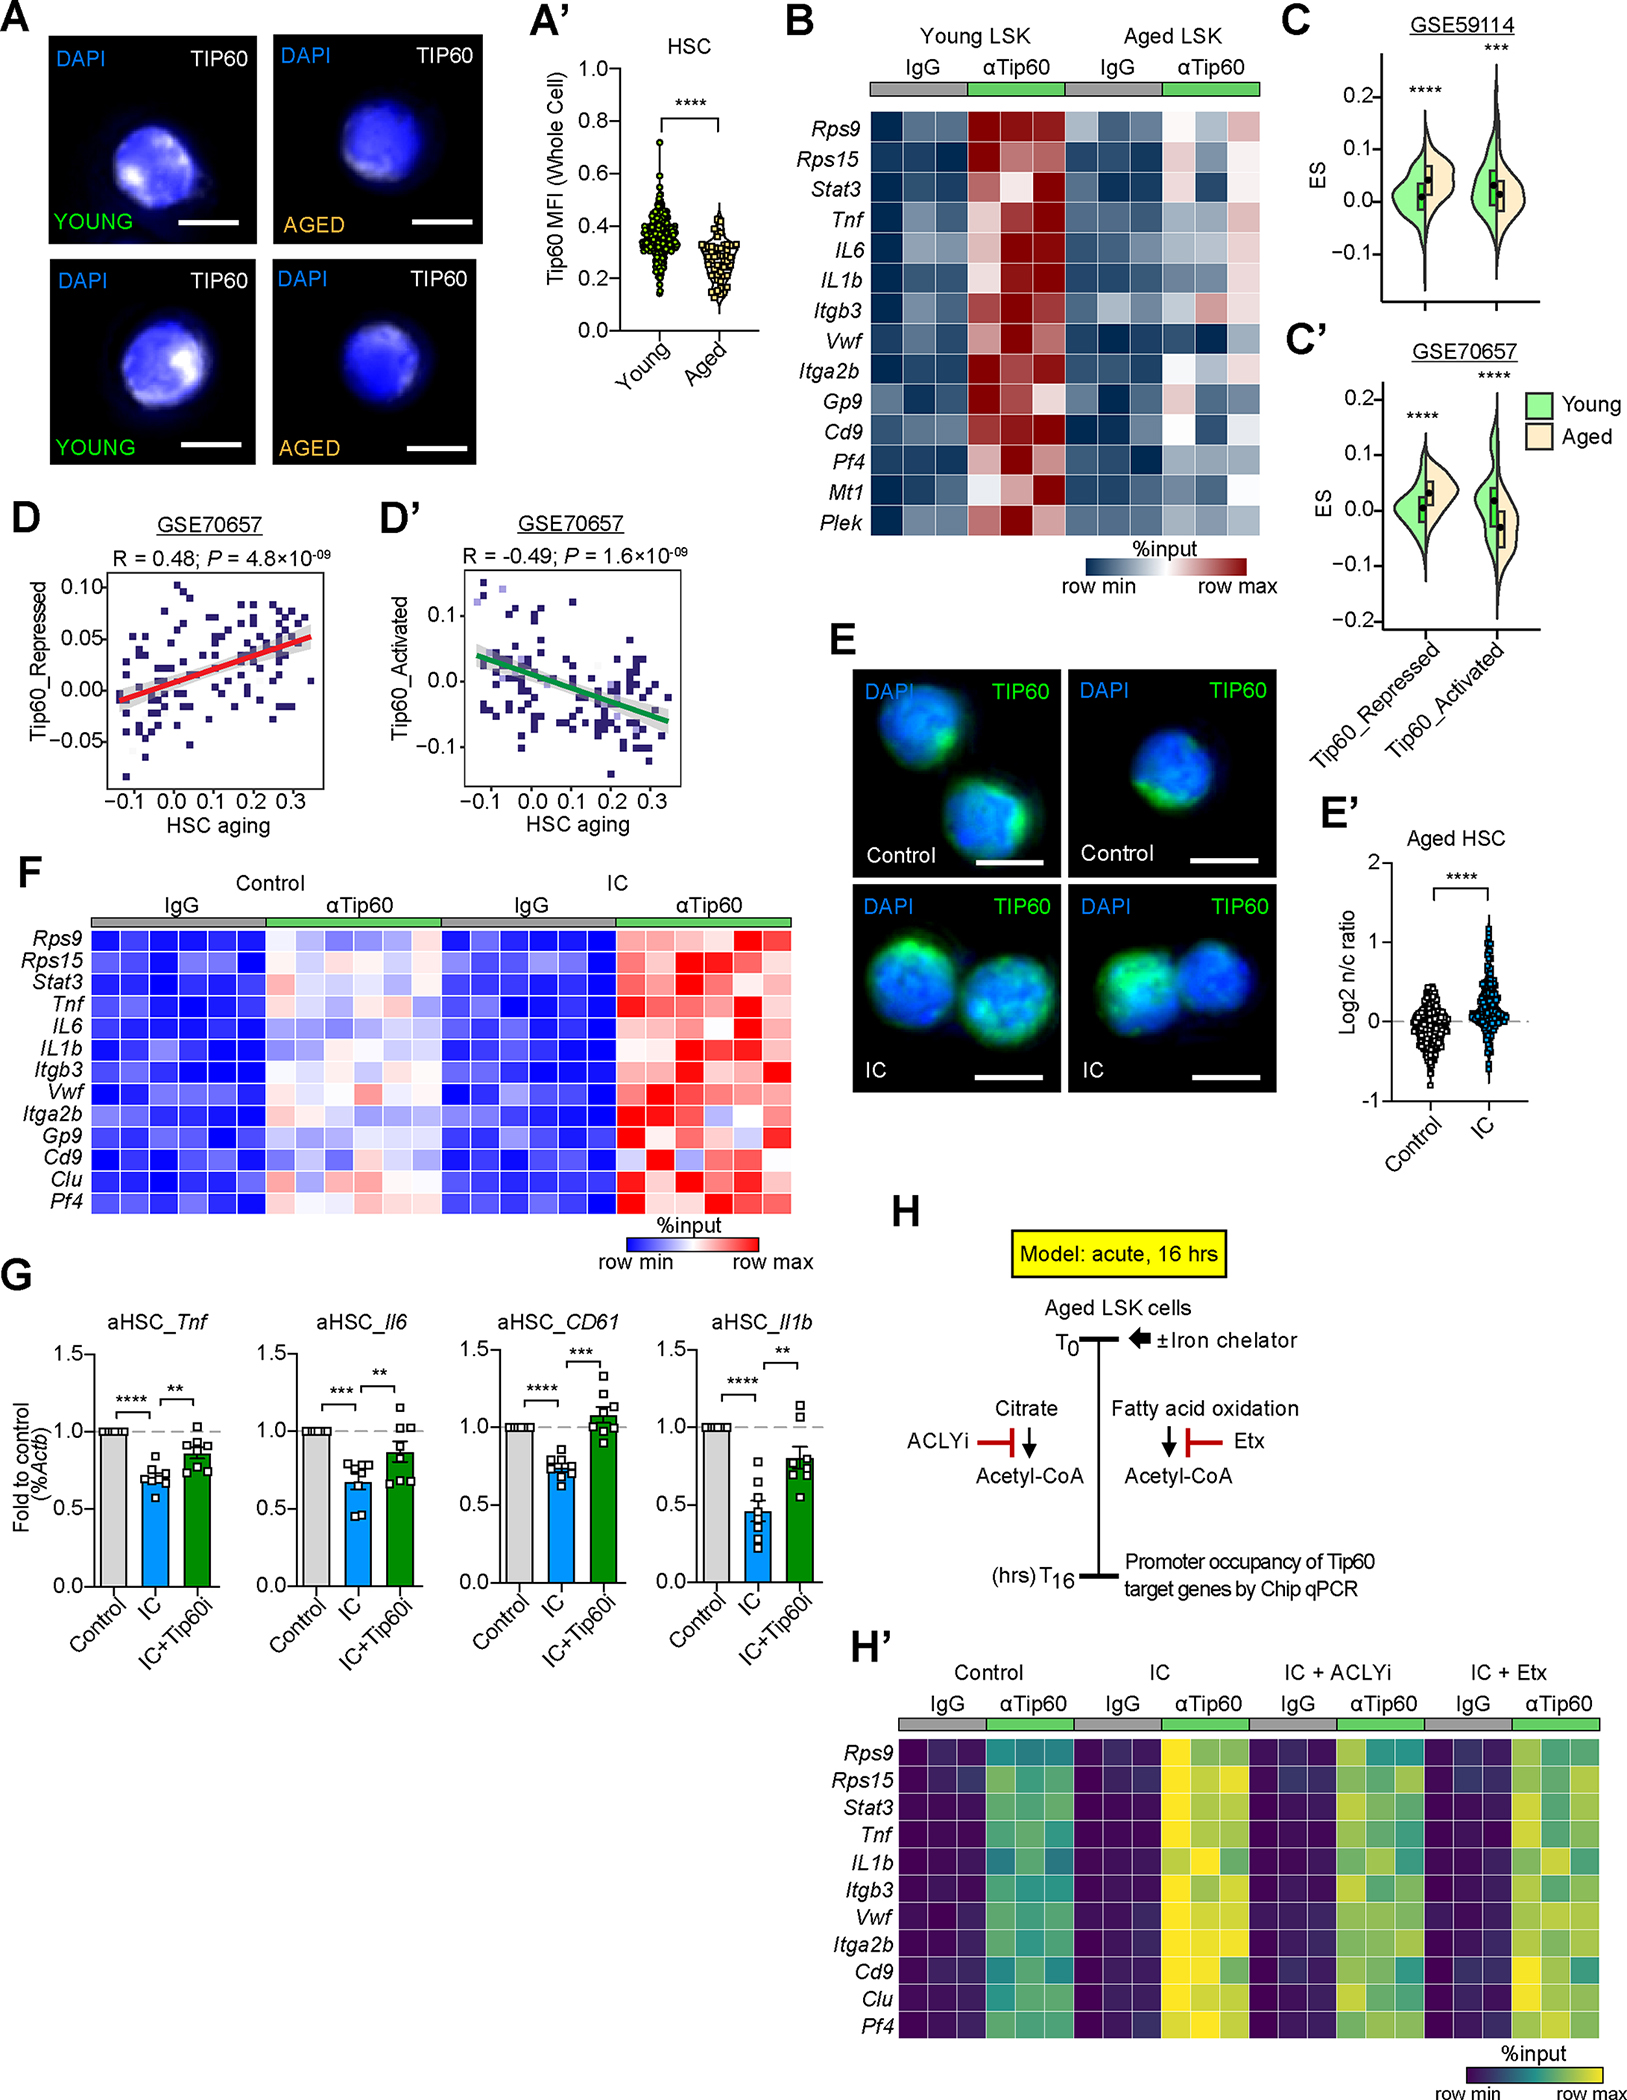
(A,A’) Tip60 protein abundance (MFI) in young and aged HSC (CD150+CD48− LSK). Immunofluorescence images of Tip60 protein abundance and subcellular localization in young and aged HSC (A). Tip60 MFI in young and aged HSC (A’). n=297 (young) and 51 (aged). Scale bars, 5μm.
(B) Tip60 occupancy in gene promoters in young and aged LSK. Significantly different (p<0.05) gene occupancy by Tip60 (young LSK vs. aged LSK) is shown. n=3
(C,C’) Scores of Tip60 regulated genes in aged versus young HSC scRNAseq datasets GSE59114 (C) and GSE70657 (C’). Up-regulated (Tip60 repressed) and down-regulated (Tip60 activated) genes upon Tip60 knockout in LSK cells used as gene sets.
(D,D’) Correlation of Tip60 regulated genes with HSC aging signature, using single cell expression data from GSE70657. Up-regulated (D) and down-regulated (D’) genes upon Tip60 knockout in LSK cells were used as gene sets. Correlation using Pearson coefficient R and linear regression t test.
(E,E’) Nuclear to cytoplasmic ratio (n/c) of Tip60 protein in aged HSC upon IC stimulation ex vivo for 16hrs. Immunofluorescence images (E) and quantification (E’) are shown. Scale bars, 5μm. n=299 or 160.
(F) Tip60 occupancy in gene promoters in aged LSK cells cultured for 48hrs with vehicle or IC. Significantly different (p<0.05) gene occupancy by Tip60 (IC vs. Control) are shown. n=6
(G) Expression changes of Tip60/Myc target genes in aged HSC after IC treatment alone or in combination with inhibition of Tip60 (Tip60i) by qPCR analysis. Fold changes of genes across treatment groups are shown. Data are mean ± SEM. n=8.
(H,H’) Scheme for assessing IC-mediated Tip60 dependent acetyl-CoA production in increasing Tip60 promoter occupancy of target genes (H). (H’) Heatmap showing ChIP-qPCR of aged LSK cells ex vivo cultured for 16hrs with vehicle or IC alone, or IC in combination with inhibitors for ACLY (SB 204990, 20 μM) or CPT1a (Etomoxir, 10 μM). Significantly different (p<0.05) gene occupancy by Tip60 (IC vs. Control, ACLYi or CPT1i) are shown. n=3
Significance indicated as *p<0.05, **p<0.01, ***p<0.001, ****p<0.0001 was calculated using Student’s t test (unpaired: A’, C, C’, and E’; paired: G and H’).
See also Figure S6.
Collectively, our study’s findings establish the pool of readily accessible cytoplasmic iron as a key cellular rheostat allowing HSC to enable and orchestrate metabolic and gene regulatory fate control at steady state and during regeneration; they further suggest that cytoplasmic iron loading is a key factor in driving HSC dysfunction via Tip60 perturbation during aging (Fig. S6I).
Discussion
Intact iron homeostasis is known to ensure proper hematopoietic progenitor cell expansion and differentiation,113 and limit oxidative damage-induced elimination of hematopoietic stem cells.76 Here, we have delineated four additional molecular principles governing iron-dependent adult stem cell function.
We uncovered that HSPC limit their LIP and show an ongoing limited iron response at steady state which is augmented during mitosis and by experimental acute iron limitation. This demonstrates that the size of the LIP is tightly regulated and closely linked with the functional state of quiescent and metabolically less active stem cells35–39. It also reveals that metabolic demands during mitosis provide an effective trigger for enhancing iron homeostasis pathway activation in HSPC.
We show increased lipid carbon-associated epigenetic regulation to follow iron homeostasis pathway activation in HSC; and discovered a central role for lysine acetyl transferase Tip60/KAT5 in HSPC lipid synthesis, likely via acetylation and activation of Lipin1107. Our data support that Tip60 constitutes a gene-regulatory switch in HSPC - following acute iron limitation, presumably following autoacetylation114 in response to increasing cytoplasmic acetyl-CoA levels, which enhances Tip60-dependent gene regulation. The mechanism behind the observed locus-specific gene regulatory effects of Tip60 in HSPC involves cooperating factor cMyc92,115, which may counteract TFEB-dependent lysosomal activation to allow for HSC activation42. While the exact drivers of Tip60-dependent gene regulation in HSPC remain to be elucidated, our findings strengthen the emerging paradigm of a tight interconnection between lipid metabolism and epigenetic control in stem cells116,117 - a circuit also hijacked by malignant stem cells establishing therapy resistance 118. Given that many somatic stem cells share principle regulatory mechanisms,119 it is possible that LIP serves as a general rheostat in various adult stem cells.
Our data show that LIP restriction serves as a unique molecular relay, licensing specific metabolic pathways under regenerative stress - particularly FAO which is known to expand the HSC pool37. In contrast to highly proliferative progenitor cells, HSPC appear to employ DNL to fuel mitochondrial FAO. Simultaneous activation of anabolic along with catabolic FA metabolism is a unique metabolic circuit which is typically suppressed in most cells120. However, a reduced redox state (such as during iron limitation121) appears to allow HSPC to establish and enforce this peculiar metabolic circuit.122–124
Lastly, we demonstrate that cytoplasmic iron loading underpins stem cell aging through impairing FA metabolism and Tip60-dependent gene regulation; and that mitigating LIP expansion safeguards HSC function during aging. This finding is in line with health benefits of frequent blood donations125 which reduce body iron,126,127 select against pre-leukemic HSPC clones,128 and curtail the risk of acute myeloid leukemia129. Future work needs to delineate the exact trigger(s) increasing the LIP in aging hematopoietic (stem) cells. As loss of iron homeostasis is observed in a large fraction of the elderly,130 in patients with chronic inflammation131 or cancer,132 our findings will have implications in understanding and therapeutic mitigation of altered stem cell function in a wide range of degenerative and malignant pathologies.
Limitations of the study
In previous work21 and herein, we have corroborated all key observations on acute iron limitation in HSPC using several clinically available IC. The use of genetic models to impair central metabolic regulators of cellular homeostasis come with the caveat of permanent metabolic adaptation to the absence of key enzymes which trigger a cache of compensatory metabolic effects we cannot control for. This makes testing the acute effects of metabolic pathway interference essential. We accomplished this through chemical impairment of enzymes using specific and validated pharmacologic modulators. This study identified mice with hematopoietic Fth1 haploinsufficiency as promising models for genetic LIP restriction; yet, future efforts are needed to firmly establish the mode and long-term consequences of LIP restriction through Fth1 dose reduction.
Resource Availability
Lead contact
Further information and requests for resources and reagents should be directed to and will be fulfilled by the lead contact, Britta Will (britta.will@einsteinmed.edu).
Materials availability
All unique reagents generated in the study are available from the lead contact under material transfer request.
Data and code availability
NGS data generated during this study have been deposited at GEO and are publicly available as of the date of publication. Accession numbers are listed in the key resources table.
This paper analyzes existing, publicly available data. These accession numbers for the datasets are listed in the key resources table.
This paper does not report original code.
Any additional information required to reanalyze the data reported in this paper is available from the lead contact upon request.
Key Resources Table.
| REAGENT or RESOURCE | SOURCE | IDENTIFIER |
|---|---|---|
| Antibodies | ||
| Hadha Unconjugated; Anti-mouse [Clone: EPR17940] | Abcam | Cat#ab203114; RRID:AB_3083611 |
| Alexa Fluor 647 goat anti-rabbit IgG (H+L) | Invitrogen | Cat#A21245; RRID:AB_2535813 |
| biotinylated anti-CD44 | Invitrogen | Cat#13-0441-82; RRID:AB_466442 |
| Alexa Fluor 594 donkey anti-goat IgG (H+L) | Invitrogen | Cat#A-11037; RRID:AB_2534095 |
| Alexa Fluor 488 goat anti-rabbit IgG (H+L) | Invitrogen | Cat#A-11008; RRID:AB_143165 |
| CD3e eFluor 450; Anti-mouse [Clone: 145-2C11] | eBioscience | Cat#48-0031-82; RRID:AB_10735092 |
| CD4 eFluor 450; Anti-mouse [Clone: GK1.5] | eBioscience | Cat#48-0041-82; RRID:AB_10718983 |
| CD8a eFluor 450; Anti-mouse [Clone: 53-6.7] | eBioscience | Cat#48-0081-82; RRID:AB_1272198 |
| CD19 eFluor 450; Anti-mouse [Clone: eBio1D3(1D3)] | eBioscience | Cat#48-0193-82; RRID:AB_2734905 |
| B220 eFluor 450; Anti-mouse [Clone: RA3-6B2] | eBioscience | Cat#48-0452-82; RRID:AB_1548761 |
| Ter119 eFluor 450; Anti-mouse [Clone: TER-119] | eBioscience | Cat#48-5921-82; RRID:AB_1518808 |
| Gr1 eFluor 450; Anti-mouse [Clone: RB6-8C5] | eBioscience | Cat#48-5931-82; RRID:AB_1548788 |
| Sca-1 APC; Anti-mouse [Clone: D7] | eBioscience | Cat#17-5981-82; RRID:AB_469487 |
| c-Kit APC-Cy7; Anti-mouse [Clone: 2B8] | eBioscience | Cat#A15423; RRID:AB_2534436 |
| CD150 PE; Anti-mouse [Clone: TC15-12F12.2] | Biolegend | Cat#115904; RRID:AB_313683 |
| CD48 PE-Cy7; Anti-mouse [Clone: HM48-1] | Biolegend | Cat#103424; RRID:AB_2075049 |
| CD34 FITC; Anti-mouse [Clone: RAM34] | eBioscience | Cat#11-0341-82; RRID:AB_465021 |
| CD41 eFluor 450; Anti-mouse [Clone: eBioMWReg30 ] | eBioscience | Cat#48-0411-82; RRID:AB_1582238 |
| CD3e PE-Cy5; Anti-mouse [Clone: 145-2C11] | eBioscience | Cat#15-0031-82; RRID:AB_468690 |
| CD4 PE-Cy5; Anti-mouse [Clone: GK1.5] | eBioscience | Cat#15-0041-82; RRID:AB_468695 |
| CD8a PE-Cy5; Anti-mouse [Clone: 53-6.7] | eBioscience | Cat#15-0081-82; RRID:AB_468706 |
| CD19 PE-Cy5; Anti-mouse [Clone: eBio1D3(1D3)] | eBioscience | Cat#15-0193-82; RRID:AB_657672 |
| B220 PE-Cy5; Anti-mouse [Clone: RA3-6B2] | eBioscience | Cat#15-0452-82; RRID:AB_468755 |
| Ter119 PE-Cy5; Anti-mouse [Clone: TER-119] | eBioscience | Cat#15-5921-82; RRID:AB_468810 |
| Gr1 PE-Cy5; Anti-mouse [Clone: RB6-8C5] | eBioscience | Cat#15-5931-82; RRID:AB_468813 |
| CD3e Biotin; Anti-mouse [Clone: 145-2C11] | eBioscience | Cat#13-0031-82; RRID:AB_466319 |
| CD4 Biotin; Anti-mouse [Clone: GK1.5] | eBioscience | Cat#13-0041-82; RRID:AB_466325 |
| CD8a Biotin; Anti-mouse [Clone: 53-6.7] | eBioscience | Cat#13-0081-82; RRID:AB_466346 |
| CD19 Biotin; Anti-mouse [Clone: eBio1D3(1D3)] | eBioscience | Cat#13-0193-82; RRID:AB_657656 |
| B220 Biotin; Anti-mouse [Clone: RA3-6B2] | eBioscience | Cat#13-0452-82; RRID:AB_466449 |
| Ter119 Biotin; Anti-mouse [Clone: TER-119] | eBioscience | Cat#13-5921-82; RRID:AB_466797 |
| Gr1 Biotin; Anti-mouse [Clone: RB6-8C5] | eBioscience | Cat#13-5931-82; RRID:AB_466800 |
| Sca-1 Brilliant Violet 421; Anti-mouse [Clone: D7] | eBioscience | Cat#404-5981-82; RRID:AB_2929076 |
| c-Kit Brilliant Violet 605; Anti-mouse [Clone: 2B8] | Biolegend | Cat#105847; RRID:AB_2783047 |
| CD150 PE-Cy7; Anti-mouse [Clone: TC15-12F12.2] | Biolegend | Cat#115914; RRID:AB_439797 |
| CD48 APC-Cy7; Anti-mouse [Clone: HM48-1] | Biolegend | Cat#103432; RRID:AB_2561463 |
| CD41 FITC; Anti-mouse [Clone: eBioMWReg30 ] | eBioscience | Cat#11-0411-82; RRID:AB_763481 |
| CD45.1 PerCP-Cy5.5; Anti-mouse [Clone: A20] | eBioscience | Cat#A14794; RRID:AB_2534309 |
| CD45.2 BV510; Anti-mouse [Clone: 104] | BD Biosciences | Cat#740131; RRID:AB_2739888 |
| cKit PE; Anti-mouse [Clone: 104D2] | BioLegend | Cat#105807; RRID:AB_313216 |
| CD48 APC-eFluor 780; Anti-mouse [Clone: HM48-1] | eBioscience | Cat#47-0481-82; RRID:AB_2573962 |
| CD3e PE-Cy7; Anti-mouse [Clone: 145-2C11] | eBioscience | Cat#25-0031-82; RRID:AB_469572 |
| CD4 PE-Cy7; Anti-mouse [Clone: GK1.5] | eBioscience | Cat#25-0041-82; RRID:AB_469576 |
| CD8 PE-Cy7; Anti-mouse [Clone: 53-6.7] | eBioscience | Cat#A15385; RRID:AB_2534399 |
| B220 APC-eFluor 780; Anti-mouse [Clone: RA3-6B2] | eBioscience | Cat#47-0452-82; RRID:AB_1518810 |
| CD11b Alexa Fluor 488; Anti-mouse [Clone: M1/70] | eBioscience | Cat#53-0112-82; RRID:AB_469901 |
| CD41 PE; Anti-mouse [Clone: eBioMWReg30 ] | eBioscience | Cat#12-0411-82; RRID:AB_763485 |
| CD71 APC; Anti-mouse [Clone: R17217] | eBioscience | Cat#17-0711-82; RRID:AB_1834355 |
| CD45.2 APC-Cy7; Anti-mouse [Clone: 104] | eBioscience | Cat#47-0454-82; RRID:AB_1272175 |
| CD61 APC; Anti-mouse [Clone: 2C9.G3] | eBioscience | Cat#17-0611-82; RRID:AB_2848288 |
| B220 BV510; Anti-mouse [Clone: RA3-6B2] | BD Horizon | Cat#563103; RRID:AB_2738007 |
| CD11b PE-Cy7; Anti-mouse [Clone: M1/70] | eBioscience | Cat#25-0112-82; RRID:AB_469588 |
| CD11b eFluor 450; Anti-mouse [Clone: M1/70] | eBioscience | Cat#48-0112-82; RRID:AB_1582236 |
| Sca1 APC; Anti-mouse [Clone: E13-161.7] | BioLegend | Cat#122512; RRID:AB_756197 |
| c-kit APC-Cy7; Anti-mouse [Clone: ACK2] | BioLegend | Cat#135136; RRID:AB_2632809 |
| TotalSeq™-C Mouse Universal Cocktail, V1.0 | BioLegend | Cat#199903; RRID:AB_2924498 |
| TotalSeq™-C0098 anti-mouse CD135 [Clone: A2F10] | BioLegend | Cat#135321; RRID:AB_2832480 |
| TotalSeq™-C0857 anti-mouse CD34 [Clone: HM34] | BioLegend | Cat#128623; RRID:AB_2888791 |
| TotalSeq™-C0229 anti-mouse/rat CD62P [Clone: RMP-1] | BioLegend | Cat#148313; RRID:AB_2892302 |
| TotalSeq™-C0301 anti-mouse Hashtag 1 (Control) [Clone: M1/42; 30-F11] | BioLegend | Cat#155861; RRID:AB_155861 |
| TotalSeq™-C0302 anti-mouse Hashtag 2 (IC) [Clone: M1/42; 30-F11] | BioLegend | Cat#155863; RRID:AB_2800694 |
| Anti-ACSL4 | Santa Cruz Biotechnology | Cat#sc-365230; RRID:AB_10843105 |
| Anti ferritin light chain (FTL) | abcam | Cat#ab109373; RRID:AB_10862715 |
| Anti ferritin heavy chain (FTH1) | abcam | Cat#ab65080; RRID:AB_10564857 |
| Anti actin | abcam | Cat#ab3280; RRID:AB_303668 |
| Anti Tip60 for CUT&RUN | Cell Signaling Technology | Cat#12058S; RRID:AB_2797811 |
| IgG control for CUT&RUN | Cell Signaling Technology | Cat#2729S; RRID:AB_1031062 |
| Anti-Ncoa4 | Santa Cruz Biotechnology | Cat#sc-15984; RRID:AB_2151209 |
| Anti-Tip60 | Thermo Fisher | Cat#10827-1-AP; RRID:AB_2128431 |
| Chemicals, peptides, and recombinant proteins | ||
| Deferoxamine mesylate salt | Sigma | Cat#D9533-1G |
| Deferoxamine Mesylate | Calbiochem | Cat#25275 |
| Eltrombopag | Novartis | N/A |
| 10058-F4 | Selleck Chemicals | Cat#S7153 |
| TH1834 | Axon | Cat#2339 |
| SB 204990, ACLY inhibitor | Tocris | Cat#49-621-0R |
| Etomoxir | Sigma | Cat#E1905 |
| VPS34 | Reagency | Cat#RGNCY-0041/0042 |
| BODIPY 493/503 | Invitrogen | Cat#D3922 |
| BSA-arachidonate polyunsaturated fatty acid complex | Cayman Chemical | Cat#34931 |
| Diethylumbelliferyl phosphate | Sigma | Cat#D7692 |
| CD71-blocking antibody | Bio-Rad | Cat#MCA2396EL |
| Recombinant mouse SCF | R&D Systems | Cat#455-MC-050/CF; 455-MC-050 |
| Recombinant mouse TPO | R&D Systems | Cat#488-TO-025/CF; 488-TO-025 |
| Recombinant mouse IL-3 | R&D Systems | Cat#403-ML-050 |
| Recombinant mouse Flt3 Ligand | R&D Systems | Cat#427-FL-025 |
| Critical commercial assays | ||
| HSC007 methylcellulose media | R&D Systems | Cat#HSC007 |
| Trucount™ tubes | Becton Dickinson | Cat#663028 |
| Cytofix/Cytoperm buffer | Becton Dickinson | Cat#554714 |
| Lipi-Green | Dojindo | Cat#LD-02 |
| FeRhoNox-1 | Goryo Chemical | Cat#GC901 |
| MegaCult®-C medium | STEMCELL Technologies | Cat#4960 |
| Chromium Single Cell 3′ Reagent Kits | 10x Genomics | Cat#PN-1000268 |
| Chromium Next GEM Single Cell 5’ Reagent Kit v2 | 10x Genomics | Cat#PN-1000265 |
| Mouse Transferrin ELISA kit | Abcam | Cat#ab157724 |
| Mouse Ferritin (FTL) ELISA kit | Abcam | Cat#ab157713 |
| CUT&RUN Assay Kit | Cell Signaling Technology | Cat#86652 |
| Deposited data | ||
| scRNAseq of HSC with 48hours treatment with IC | This study | GSE157821 |
| CITE-seq of LSK cells from long-term intermittent treatment study | This study | GSE232022 |
| Single cell RNA-seq of HSPC isolated from young and old mice | Kowalczyk et al.153 | GEO: GSE59114 |
| Single cell RNA-seq of HSC isolated from young and old mice | Grover et al.91 | GEO: GSE70657 |
| Single cell RNA-seq of mouse bone marrow cells | Tabula Muris Consortium154 | GEO: GSE109774 |
| Single cell RNA-seq of human HSC isolated from young and old donors | Ainciburu et al.155 | GEO: GSE180298 |
| Single cell RNA-seq of activated versus quiescent mouse HSC | Fast et al.156 | GEO: GSE165844 |
| Single cell RNA-seq of activated versus label-retaining dormant mouse HSC | Cabezas-Wallscheid et al.157 | ArrayExpress: E-MTAB-4547 |
| Microarrays of mRNA composition from IRP1 and IRP2 immunoprecipitation | Sanchez et al.158 | GEO: GSE17096; GSE17097 |
| Expression profiling of Fbxl5-KO vs WT mouse HSC | Muto et al.66 | GEO: GSE93649 |
| ChIP-seq of Tip60 in mouse ESC | Ravens et al.159 | GEO: GSE69671 |
| Expression profiling of Tip60 KO vs WT mouse LSK | Numata et al.109 | GEO: GSE120705 |
| Expression profiling of c-Myc/N-Myc DKO vs WT mouse HSC | Laurenti et al.115 | GEO: GSE12538 |
| ChIP-seq of H2AZac in ESC | Hu et al.160 | GEO: GSE34483 |
| ChIP-seq of H2AZac in ESC | Ku et al.161 | GEO: GSE39237 |
| ChIP-seq of H4K5ac in ESC | Roadmap162 | GEO: GSE16256 |
| ChIP-seq of H4K8ac in ESC | Roadmap162 | GEO: GSE16256 |
| ChIP-seq of H4K12ac in ESC | Roadmap162 | GEO: GSE16256 |
| ChIP-seq of H4K16ac in ESC | Taylor et al.163 | GEO: GSE43103 |
| ChIP-seq of H3K4me1 in HSC | Lara-Astiaso et al.164 | GEO: GSE59636 |
| ChIP-seq of H3K4me1 in HPC7 cells | Org et al.165 | GEO: GSE47082 |
| ChIP-seq of H3K4me3 in HSC | Lara-Astiaso et al.164 | GEO: GSE59636 |
| ChIP-seq of H3K4me3 in LSK cells | Hasemann et al.166 | GEO: GSE43007 |
| ChIP-seq of H3K4me3 in HSC | Sun et al.167 | GEO: GSE47765 |
| ChIP-seq of H3K4me3 in LSK cells | Aranda-Orgilles et al.168 | GEO: GSE76055 |
| ChIP-seq of H3K36me3 in LSK cells | Adli et al.169 | GEO: GSE22075 |
| Experimental models: Cell lines | ||
| HPC-7 | Dr. Omar Abdel-Wahab, Memorial Sloan Kettering Cancer Center61 | RRID:CVCL_RB19 |
| Experimental models: Organisms/strains | ||
| C57/BL6 mouse | Jackson Laboratories | stock number: 000664 |
| Pepc/BoyJ mouse | Jackson Laboratories | stock number: 002014 |
| beta-actin-GFP mouse | Jackson Laboratories | strain number: 006567 |
| CAGGCre-ER™ mouse | Jackson Laboratories | stock number: 004682 |
| Tip60LoxP mouse | Drs. Susumu Kobayashi and Daniel Tenen (Harvard Medical School)109 | N/A |
| Vav-iCre mouse | Jackson Laboratories | Stock No. 008610 |
| Fth1 mouse | Jackson Laboratories | Stock number: 018063 |
| Acsl4 mouse | Dr. Andrew Greenberg(Tufts University)170 | N/A |
| Oligonucleotides | ||
| Primers | This study | Table S6 |
| TaqMan assays | This study | Table S6 |
| Tfrc smFISH probe | This study | Table S6 |
| pGFP-C-shLenti vector | OriGene | Cat#TR30021 |
| Short hairpin RNA targeting Acsl4 #3 | OriGene | Cat#TL502838C |
| Short hairpin RNA targeting Acsl4 #4 | OriGene | Cat#TL502838D |
| Software and algorithms | ||
| FlowJo V10.2 | Becton Dickinson | https://www.flowjo.com/; RRID:SCR_008520 |
| FISHquant v2 | Imbert et al.171 | https://fish-quant.github.io/ |
| MATLAB R2020b | MathWorks | RRID:SCR_001622 |
| ELDA: Extreme Limiting Dilution Analysis | Hu et al. 172 | https://bioinf.wehi.edu.au/software/elda/; RRID:SCR_018933 |
| Transcriptome Analysis Console 3.0 | Affymetrix | RRID:SCR_016519 |
| limma v3.54.0 | Ritchie et al.173 | DOI: 10.18129/B9.bioc.limma; RRID:SCR_010943 |
| NetworkAnalyst 3.0 | Zhou et al.174 | https://www.networkanalyst.ca/; RRID:SCR_016909 |
| Ingenuity Pathway Analysis | Qiagen | RRID:SCR_008653 |
| Cell Ranger v7.0.1 | 10x Genomics | RRID:SCR_017344 |
| Loupe Browser v6.4.0 | 10x Genomics | RRID:SCR_018555 |
| R v4.2.2 | R Core Team | https://www.R-project.org/; RRID:SCR_001905 |
| Seurat v4.3.0 | Satija et al.175 | https://satijalab.org/seurat/; RRID:SCR_007322 |
| escape v1.4.0 | Borcherding et al.176 | DOI: 10.18129/B9.bioc.escape |
| scVelo v0.2.5 | Bergen et al.177 | https://scvelo.readthedocs.io; RRID:SCR_018168 |
| velocyto.py v0.17.17 | La Manno et al.178 | https://velocyto.org/velocyto.py/; RRID:SCR_018167 |
| ImageJ 1.52r | Schneider et al.179 | https://imagej.nih.gov/ij/; RRID:SCR_003070 |
| CellProfiler v4.2.1 | Stirling et al.180 | https://cellprofiler.org/; RRID:SCR_007358 |
| Wave v2.6.0.31 | Agilent | RRID:SCR_014526 |
| SRA Toolkit 2.10.7 | The NCBI | https://hpc.nih.gov/apps/sratoolkit.html; RRID:SCR_024350 |
| Salmon 1.2.1 | Patro et al.181 | https://combine-lab.github.io/salmon/; RRID:SCR_017036 |
| DESeq2 1.28.0 | Love et al.182 | https://github.com/mikelove/DESeq2; RRID:SCR_015687 |
| tximeta 1.6.2 | Love et al.183 | https://github.com/mikelove/tximeta |
| BioRender | BioRender.com | RRID:SCR_018361 |
Experimental Model and Subject Details
Animals
All animal experiments were approved by the Institutional Animal Care and Use Committee of the Albert Einstein College of Medicine (Protocol# 0000–1015). All procedures were performed in accordance with guidelines from the Institutional Animal Care and Use Committee of the Albert Einstein College of Medicine. Wild type as well as genetically modified mice were purchased from Jackson Laboratories (JAX) and housed in animal facilities at the Albert Einstein College of Medicine; commercial strains included C57/BL6 (stock number 000664), Pepc/BoyJ (JAX stock number: 002014), beta-actin-GFP (JAX stock number: 006567), and Fth1flox mice (stock number: 018063). Acsl4LoxP mice were kindly provided by Dr. Andrew Greenberg (Tufts University) and crossed with Vav-iCre (JAX stock number: 008610) mice to generate Vav-iCre; Fth1LoxP mice. Tip60LoxP mice were kindly provided by Dr. Susumu Kobayashi (Harvard Medical School), and crossed with CAGGCre-ER™ (JAX stock number: 004682)100 mice to generate Cre-ER™; Tip60LoxP mice. Male and female mice at the age of 6–12 weeks (young) or 18–24 months (aged) were utilized for the experiments. For gene knockout experiments, Cre expression was induced by 4 consecutive, daily doses of tamoxifen of 0.2 mg/g body weight of tamoxifen by oral gavage.
Cell lines
HPC-7 cells were passaged in IMDM with 5% fetal bovine serum (FBS), 1% penicillin/streptomycin, 1% sodium pyruvate, 6.9 ng/mL monothioglycerol (Sigma) and 100 ng/ml recombinant mouse (rm) SCF.133 293T cells were cultured in DMEM with 10% FBS and 1% Penicillin/Streptomycin.
Primary cell culture
Primary HSC and progenitor cells were isolated by cell sorting on a Moflo Astrios EQ (Beckman Coulter). Lin−Sca-1+c-Kit+CD150+CD48− (HSC) or Lin−Sca-1+c-Kit+CD150+CD48−CD34− (CD34−HSC) populations were cultured in Myelocult M5300 (STEMCELL Technologies) with 100 μg/ml Primocin (Invivogen) supplemented with 100 ng/ml recombinant mouse (rm) SCF (R&D Systems) and 50 ng/ml rmTPO (R&D Systems). For lineage-negative (Lin−) and Lin−c-kit+ (LK) cells, 50 ng/ml of rmSCF and rmTPO were used, with 20 ng/ml rmIL-3 (R&D Systems), 50 ng/ml Flt3-Ligand (R&D Systems) supplemented to the culture. Cells were maintained at 37 °C and 5% CO2 unless otherwise specified. HPC-7 cells were passaged in IMDM with 5% fetal bovine serum (FBS), 1% penicillin/streptomycin, 1% sodium pyruvate, 6.9 ng/mL monothioglycerol (Sigma) and 100 ng/ml recombinant mouse (rm) SCF.133 BA/F3 cells were cultured in RPMI 1640 with 10% FBS, 2 ng/ml rmIL-3 and 1% penicillin/streptomycin.134 293T cells were cultured in DMEM with 10% FBS and 1% Penicillin/Streptomycin. Cells were maintained at 37 °C and 5% CO2 unless otherwise specified.
Methods Details
Chemicals and Reagents
Eltrombopag (EP, pure compound provided by Novartis) was reconstituted in sterile distilled water as 1 mg/ml stock and was stored at ambient temperature, light-protected for up to 2 weeks. Deferoxamine (DFO, Sigma) was freshly prepared with sterile distilled water for every experiment. Etomoxir (Sigma) was stored at −20°C in aliquots of 10 mM stocks. Inhibitors for VPS34 (RGNCY-0041/0042, Reagency), Myc (10058-F4, Selleck) and Tip60 (TH1834, Axon) were reconstituted in dimethyl sulfoxide (DMSO) and stored at −80°C until use. Iron chemo-sensors FeRhoNox-1 (Goryo Chemical) were stored light-protected at −20°C and were freshly reconstituted in DMSO for every experiment. ATP citrate lyase (ACLY) inhibitor SB 204990 (Tocris, Minneapolis, MN) was reconstituted in DMSO with a stock concentration of 10 mM and stored at −80°C until use. BSA-arachidonate polyunsaturated fatty acid complex (Cayman Chemical) is composed of arachidonic acid and bovine serum albumin (BSA), at a 6:1 molar ratio of arachidonate:BSA and stored with a stock concentration of 1 mM and stored at −20°C until use.
Models for acute iron limitation
Ex vivo acute iron limitation
Murine HSPC were freshly isolated from bone marrow and FACS purified based on cell surface markers against lineage, Sca1 and c-Kit. LSK (Lin− Sca1+ c-kit+) cells were cultured in Myelocult M5300 based conditioned media, supplemented with recombinant thrombopoietin (TPO, 50 ng/ml), SCF (50 ng/ml) and hydrocortisone (1 μM), as we have previously described (LTC-IC media).21 Limiting dilutions of LSK cells were incubated with iron chelators such as deferoxamine (10 μM, Sigma) and eltrombopag (10 μg/ml , Novartis) for 48 hrs to elicit an acute iron limitation response. Cells were re-cultured in the absence of chelators for 4 weeks in LTC-IC media followed by a 1-week culture in complete methylcellulose media (HSC007, R&D). Long-term stem and progenitor cell function is read out as the number of LTC-IC units as predicted by Poisson statistics.135
Acute iron limitation in vivo
All animal experiments were approved by the Institutional Animal Care and Use Committee of the Albert Einstein College of Medicine (Protocol# 0000–1015). All procedures were performed in accordance with guidelines from the Institutional Animal Care and Use Committee of the Albert Einstein College of Medicine. Young (2–3 months) and aged (20–22 months) mice were given one dose of deferoxamine (Calbiochem) daily for 14 consecutive days. Vehicle (HBSS) or iron chelator were administered through intraperitoneal injection at 50 mg per kilogram of body weight. Animals were weighed before and after the 14-day treatment regimen, no noticeable changes to body weight were found. Complete blood count (CBC) was performed before and after treatment to monitor changes in blood parameters. Blood sera were subjected to ferritin and transferrin measurements using the ELISA assay kits (Abcam) to monitor changes in systemic iron level.
Long-term intermittent iron chelation in vivo
Young mice (6 months) were subjected to either vehicle (HBSS) or deferoxamine (Calbiochem) daily for 5 consecutive days every 4 weeks for a period of 13 months. Dosing and route of drug delivery used were as described in the in vivo acute iron limitation model. Body weights were monitored every 4 weeks and blood were drawn for CBC every 2 months. Experimental mice were at least 19 months old at the time of sacrifice. The labile iron pool size in phenotypical HSPC was measured using FeRhoNox-1 (Goryo Chemical).
Iron chelation in activated Tip60d/wt HSC in vivo
Tip60d/wt mice of 2–3 months old were assigned randomly into lipopolysaccharides (LPS) or control treatment groups and subjected to either continuous low dose of LPS (0.1μg per g of body weight) or vehicle (HBSS) injection intraperitoneally 3 times per week for 10 weeks. Mice from the LPS cohort were randomly selected to receive deferoxamine (Calbiochem) daily for 14 consecutive days every 4 weeks for 10 weeks. Mice receiving iron limitation protocol were put on deferoxamine (50mg per kilogram of body weight) for 14 days before subjected to continuous LPS challenge.
Flow cytometry analysis and sorting
Cell preparation and sorting.
Isolation of mononuclear cells (MNC) from mouse bone marrow was performed as previously described.21 Briefly, MNC were lineage-depleted using 1:200 dilution of anti-mouse CD4, CD8, B220, CD19, Ter119 and Gr-1, all biotin-conjugated, rotating at 4°C for 30 min. Cells were washed and then stained with triple-washed anti-IgG magnetic beads (Untouched Mouse T Cells Kit, Thermo Fisher) rotating at 4°C for 30 min. Cells were washed and then depleted of lineage-positive cells by passing through a magnetic separation column (MACS LD Column, Miltenyi Biotec) loaded on a DynaMag-5 Magnet (Invitrogen). Lineage-negative cells were then stained for 30 min on ice with stem and progenitor cell markers (Sca-1, c-Kit, CD150, CD48, CD34; 1:100). A detailed description of mouse antibodies can be found in Table S6. Lin−Sca-1+c-Kit+CD150+CD48− (HSC) or Lin−Sca-1+c-Kit+CD150+CD48−CD34− (CD34−HSC) and Lin−Sca-1+c-Kit+ (LSK) cells were sorted on MoFlo Astrios EQ (Beckman Coulter).
Absolute cell counting.
Quantification of absolute numbers of hematopoietic cell lineage populations in peripheral blood was performed with Trucount™ tubes (BD) following manufacturer’s instructions. Briefly, 50 μL of blood was transferred to Trucount™ tubes by reserve pipetting, and 10 μL of antibody mix was carefully added to the tube without touching the beads pellet. After gentle mixing, cells were incubated with bead and antibody mix for 15 minutes in the dark at RT. Thereafter, 450μL of 1X BD FACS lysing solution was added for 15 minutes in the dark at RT before FACS analysis. A total of 5000–10,000 beads were recorded on BD FACS Aria II (Becton Dickinson) for absolute quantification of lineage output. The absolute cell number per μL of blood was calculated by:
Quantification of Hadha.
For primary cells, lineage-depleted MNC were treated with iron chelators (10 μM DFO) for 24 hours, followed by staining with FACS antibodies against surface markers for HSPC. Thereafter, stained cells were fixed and permeabilized with Cytofix/Cytoperm buffer for 20 min on ice. For HPC7, cells were treated with iron chelators (10 μM DFO or 5 μg/ml EP) for 24 hours before fixation and permeabilization with Cytofix/Cytoperm buffer. Intracellular staining with anti-Hadha antibody (abcam, ab203114) for 1 hour at RT, followed by secondary staining with Alexa Fluor 647 goat anti-rabbit IgG (H+L) (Invitrogen, A21245) for 30 min at RT.
Quantification of lipid droplet.
Lineage-depleted MNC were cultured in the presence of iron chelator (10 μM DFO) or vehicle (ddH2O) for 4 hours, followed by incubation with 1 μM of Lipi-Green (LD-02, Dojindo) for 30 min. Cells were maintained at 37 °C and 5% CO2 for the culture and labelling of lipid droplets. Thereafter, Lipi-Green labeled cells were washed with PBS, incubated with antibody cocktail for HSPC surface staining for 30 min on ice, light protected. Cells were washed twice with PBS and subjected to FACS analysis. Unless otherwise specified, fluorescent signals were acquired with BD FACS Aria II system (Becton Dickinson) and analysed with FlowJo V10.2.
Quantification of labile iron pools.
Intracellular iron levels were also measured with FeRhoNox-1 fluorescent imaging probe specific for ferrous iron (Goryo Chemical). For primary cells, lineage-depleted MNC were incubated with 20 μM FeRhoNox-1 at 37°C for 1 hour. Antibody cocktail for HSPC surface staining was added in the last 10 min of FeRhoNox-1 incubation. For HPC-7, cells were pre-treated with VPS34 inhibitor (Reagency, RGNCY-0042) for 2 hours before exposure to vehicle or iron chelator (10 μg/ml eltrombopag) for 1 hour at 37°C. Thereafter, treated cells were washed with PBS, and incubated with 20 μM FeRhoNox-1 at 37°C for 1 hour. Cells were washed twice with PBS and subjected to FACS analysis. Unless otherwise specified, fluorescent signals were acquired with BD FACS Aria II system (Becton Dickinson) and analysed with FlowJo V10.2.
Single molecule RNA FISH
To design Tfrc mRNA-specific probes for sequential single molecule FISH (smFISH), full length transcript of Tfrc (NM_011638) was used as input for PaintSHOP136 to retrieve 22 primary targeting sequences (30–40bp, Table S6), separated by at least 10bp. Putative sequences were then screened for off-target activity using NCBI Blast (https://blast.ncbi.nlm.nih.gov/Blast.cgi) against mouse transcriptome. Selected sequences were then concatenated on the 5′ and 3′ end with flanking readout 20mer sequences (GTTTGAAGATTCGACCTGGA), generating a final ‘primary probe’. SmFISH immunofluorescence staining procedure and analysis were performed as described previously.48,137 Briefly, treated and control cells were attached to coverslips using biotinylated anti-CD44 coating.138 Residual media was washed with PBS, and cells were fixed in 3.2% PFA (Electron Microscopy Sciences), diluted in PBS with 1 mM MgCl2 (PBSM), for 10 minutes at room temperature. Cells were then permeabilized in 0.1% Triton X-100 in PBSM for 10 minutes. After washing with PBSM, cells were incubated at room temperature with 30% prehybridization buffer (30% formamide, 2X saline-sodium citrate buffer) for 30 minutes. Primary hybridization was done in 30% hybridization buffer consisting of 10% dextran sulfate, 30% formamide, 2X saline-sodium citrate (SSC), 2 mM VRC, 10 μg/ml sheared ssDNA from salmon sperm, 10 μg/ml E. coli tRNA, 10 μg/ml molecular grade bovine serum albumin (BSA), and 200 ng of primary probe mixes, overnight at 37 °C. Thereafter, cells were washed twice with 30% pre-hybridization buffer for 20 min at 37 °C and once with 2X SSC. Cells were then post fixed in 3.2% PFA in PBSM for 10 min, followed by washing in 2X SSC. Primary stained cells were incubated with 10% prehybridization buffer (10% formamide, 2X SSC) for 10 min at 37 °C and stained with 10% dextran sulfate, 10% formamide, 2X SSC, 2 mM VRC, 10 μg/ml sheared ssDNA from salmon sperm, 10 μg/ml E. coli tRNA, 10 μg/ml molecular BSA, and 10 ng Cy5-labelled readout probe of 20mer readout probe (RO2-Cy5) for Tfrc gene for 3 hrs at 37 °C. Cells were then washed twice for 10 min in 10% prehybridization buffer, followed by a final wash in 2X SSC. Before the immunostaining for pS10H3, cells were again fixed with 3.2% PFA in PBS for 10 min at room temperature (RT). Cells were washed once with PBS for 5 min at room temperature. Blocking was performed in blocking buffer (PBS, 1% RNAse-free BSA, 0.2% Triton X-100) for 30 min at room temperature. Next, cells were incubated with the primary antibody (1:200 mouse anti-pS10H3, Cell Signaling Technology) in antibody dilution buffer (PBS, 0.1% BSA, 0.1% Triton X-100) overnight at 4°C. On the next day, cells were washed thrice with PBS for 5 min at RT before incubation with the secondary antibody (1:200 rabbit anti-mouse AlexaFluor 488, Cell Signaling Technology) in antibody dilution buffer for 1 hour at RT. Excess antibody was removed by washing cells with 1xPBS for 5 min at RT. Cells were then mounted in Prolong Diamond Antifade reagent plus DAPI (Invitrogen). Images were acquired using oil immersion 100X objective on an epifluorescence Olympus Digital Station 6 microscope. Exposure times were 1000 ms, 50 ms, 100 ms for Cy5, AlexaFluor 488 and DAPI respectively. Z stacks spanning the entire volume of the cells were acquired by imaging every 300 nm along the z-axis. Acquisition control of the microscope was achieved using IPLab software. For data analysis, single molecule mRNA and transcription site detection was performed using freely available and MATLAB-written software FISHquant, by 3D Gaussian fitting of thresholded spots, implemented in MATLAB R2020b.138 Further experimental details, validation, and discussion of this methodology in the hematopoietic system can be found in Wheat et al.48.
Stroma-free long-term culture-initiating cell assay
Conditioned media derived from mouse stromal cells were collected as previously described.21 Long-term culture-initiating cell (LTC-IC) assays were performed as previously described21 for the assessment of the frequency of functional stem cells ex vivo. Briefly, limiting dilutions of LSK cells were FACS-sorted into 96-well plates containing Myelocult M5300 and conditioned media at 1:1 ratio, supplemented with 50 ng/ml rmSCF, 50 ng/ml rmTPO, 1 μM hydrocortisone (STEMCELL Technologies), and 200 μg/ml Primocin. After 4 weeks of culture at 32°C, 5% CO2, limiting dilutions of LSK cells and their respective replicate wells were subjected to methylcellulose colony assay with HSC007 (R&D Systems) at 37°C, 5% CO2 for 1 week. Colony forming units were identified and scored using inverted light microscope. Stem cell frequency was estimated using extreme limiting dilution analysis (ELDA) algorithm.135 For inhibiting the activation of iron homeostasis regulatory pathways upon intracellular iron reduction, a CD71-blocking antibody (Bio-Rad, MCA2396EL)139 and VPS34 inhibitor (Reagency, RGNCY-0041)140 were used to simultaneously block iron uptake and mobilization, respectively. For inhibiting fatty acid oxidation, etomoxir (Sigma, E1905) was used to irreversibly block mitochondrial carnitine palmitoyltransferase-1.141,142 For inhibiting ATP citrate lyase (ACLY) mediated de novo lipogenesis, SB 204990 (Tocris, Minneapolis, MN) was used.143 For inhibiting Myc, 10058-F4 (Selleck Chemicals, S7153) was used to block the dimerization of Myc and Max at concentrations with validated on-target efficacy99,144. For inhibiting histone acetyltransferase activity of Tip60, TH1834 (Axon, 2339)145 was used.
Colony-forming unit assays of megakaryocyte progenitors
For the detection of colony-forming unit (CFU) of mouse megakaryocyte progenitors, 2000 sorted HSC (Lin−/Sca1+/cKit+/CD150+/CD48−) were plated in a collagen-based medium in double chamber culture slides and cultured for 7 days at 37°C, 5% CO2 (MegaCult®-C Medium without Cytokines, STEMCELL Technologies). Cultures were supplemented with human recombinant 50 ng/ml TPO (Peprotech), 20 ng/ml human recombinant IL-6 (STEMCELL Technologies) and 10 ng/ml mouse recombinant IL-3 (R&D) according to manufacturer’s instructions. Staining for acetylcholinesterase content and scoring of CFU-Mk colonies were performed according to manufacturer’s protocol, and colonies with at least eight-cell cluster were scored using Inverted Infinity and Phase Contrast Microscope (Fisher Scientific). Where indicated, media were supplemented with: 10 μM DFO (Sigma)21, 3 μg/ml eltrombopag (Novartis)21, 10 μM Tip60 histone acetyltransferase inhibitor (TH1834, Axon), 25 μM c-Myc inhibitor (10058-F4, Selleck Chemicals)99.
Hematopoietic stem cell transplantation
Aged mice (22 to 24 mos) obtained from National Institutes for Aging were subjected to in vivo treatment of iron chelator (Deferoxamine, 50 mg/kg) or vehicle control (sterile HBSS) daily for 14 days. Treatments were administered by intraperitoneal injection. Thereafter, HSC (Lin−/Sca1+/cKit+/CD150+/CD48−) were prospectively FACS-sorted from treated mice and pooled according to experimental group, where 500 HSC along with 1×10⁶ Sca-1-depleted CD45.2 Pepc/BoyJ BMMNC were transplanted into CD45.2 recipient mouse irradiated with 2 rounds of 500 rads irradiation. Detailed procedures for HSC transplantation were described previously.21 Chimerism of donor-derived hematopoietic stem and progenitor, as well as lineage reconstitution were assessed at 16-weeks post transplantation and analyzed with BD FACS Aria II system (Becton Dickinson) and FlowJo V10.2. Detailed information of the antibodies used for donor chimerism analysis can be found in Table S6.
For long-term, intermittent iron limitation study, iron chelator (Deferoxamine, 50 mg/kg) or vehicle control (HBSS) were administered daily for consecutive 7 days, repeated every 4 weeks for a total of 13 months. Mice were 6 months old at the start of the regime, and were at least 19 months old at end-point analysis. For bone marrow transplantation, bone marrow cells from the same treatment group were pooled, and 500 sorted HSC were retro-orbitally transplanted into each recipient. We utilized a β-actin-GFP model (Strain #:006567) as recipient mice to examine the CD45 negative fraction of donor derived platelets. One million (1×10⁶) Sca-1-depleted BMMNC from β-actin-GFP mice were mixed with donor-derived HSC for transplantation. Recipients were irradiated with 2 rounds of 500 rads irradiation. At 17 weeks post transplantation, absolute counts of donor-derived lineage output were analyzed with Trucount™ tubes (BD) as described above. FACS-purified, ~400,000 donor-derived GFP-cKit+ cells were subsequently re-transplanted into secondary recipients following the same transplantation procedure as described in primary setting.
For transplantation assays to assess the impact of iron chelation regimen on the repopulating ability of Tip60d/d HSC in vivo, 10,000 FACS-sorted HSC (LSKCD150+CD48−) from Tip60flox/flox ;Cre-ER™ or Tip60flox/flox wildtype mice were retro-orbitally transplanted into CD45.2 Pepc/BoyJ mice pre-conditioned with 2 rounds of 600 rads of irradiation. Four weeks after transplantation, flow cytometry analysis of peripheral blood confirmed similar reconstitution activity in Tip60flox/flox ;Cre-ER™ or Tip60flox/flox wildtype HSC. Thereafter, 4 doses of tamoxifen at 0.2 mg/g body weight were administered over the course of 5 days by oral gavage to delete Tip60 in the hematopoietic system of recipient hosts. Three weeks after the last dose of tamoxifen treatment, Tip60flox/flox and Tip60d/d transplants were assigned randomly into control or IC treatment groups. Iron chelator (50 mg/kg DFO) or vehicle control (HBSS) were intraperitoneally administered daily for consecutive 14 days, repeated every 4 weeks for a total of 3 rounds. At 22 weeks post transplantation (or 16 weeks post tamoxifen induction), absolute counts of donor-derived lineage output were analyzed with Trucount™ tubes and FACS.
RNA extraction and quantitative PCR
RNA extraction, reverse transcription, and quantitative PCR (qPCR) were performed as previously described21. Briefly, RNA was extracted with the Qiagen RNeasy Micro Kit, and reverse-transcription of extracted RNA was performed using Superscript II reverse transcriptase (Invitrogen). For qPCR, 10 μl reaction volume containing 2 μl cDNA (5 ng/μl), 0.5 μl of each forward and reverse target primers (5 μM), 5μl of Power SYBR Green mix (Applied Biosystems), and 2 μl of nuclease-free water were used. Triplicate samples and five serial dilutions of standards were prepared for each target gene. Thereafter, qPCR was performed using ViiA 7 Real-Time PCR system (Applied Biosystems) according to the manufacturer’s instructions. Gene expression levels were calculated based on the standard curve with subsequent normalization to internal control. A list of qPCR primers for target genes can be found in Table S6.
Single cell RNA sequencing
For single cell RNA sequencing (scRNA-seq) with 10x Genomics platform, FACS-sorted HSC (Lin−Sca-1+c-Kit+CD150+CD48−CD34−) were exposed to iron chelator (10μM DFO) or vehicle (H2O) for 48 hours. Treated cells were collected; viability of >95% was confirmed by trypan blue exclusion. 20,000 cells from each treatment group were subjected to for library preparation using Chromium Single Cell 3′ Reagent Kits (v3) following the manufacturer’s sample preparation guide (PN CG00054 Rev B; Fluidigm). Following quality control assessment with Agilent 2100 Bioanalyzer, approximately 50 ng libraries were sequenced on the BGISEQ-500 platform with 28+8+91bp reads (read 1: 28bp; read 2: 91bp plus 8bp for index) using two lanes per sample. Sequencing data were deposited on GEO database (GSE157821).
For Cellular Indexing of Transcriptomes and Epitopes by Sequencing (CITE-seq),146 lineage depleted bone marrow cells were stained for 30 min with antibodies for lineage, Sca-1, c-Kit, Total-seq and sample-specific hashing antibodies (Table S6). Stained cells were then sorted on Moflo Astrios EQ (Beckman Coulter), and approximately 20,000 LSK cells were acquired per sample. Single cell CITE-seq libraries were generated using the 10x Genomics Chromium Next GEM Single Cell 5’ Reagent Kit v2 (10x Genomics, Pleasanton, CA, USA). FACS-sorted LSK cells from bone marrow were stained and pooled in equal amounts prior to chip loading. Libraries were constructed according to manufacturer instructions. Libraries were purified and paired-end sequenced using NovaSeq 6000 S4 Reagent Kit v1.5 with 150 cycles (Illumina, San Diego, CA, USA). Sequencing data were deposited on GEO database (GSE232022).
Bioinformatic analysis of scRNA-seq data
For bioinformatic analysis of 10x Chromium scRNA-seq data, cell barcode processing, transcriptome alignment (mm10), and gene UMI counting were performed for each of the samples using the count module of Cell Ranger v7.0.1.147 Samples were aggregated using the aggr module with default parameters to generate cell-feature count matrix for downstream analysis. The resulting files from Cell Ranger were subjected to differential expression analysis by Loupe Browser v6.4.0, with genes expressed in >10% of all cells.
For CITE-seq library preparation, we utilized same dual purposes library for antibody tags and cell hashing; however, Cell Ranger requires separate, non-identical fastq files for antibody-derived tags (ADT) and Cell Multiplexing Oligo (CMO) libraries. To resolve this, we created separate fastqs for CMO by removing the first sequencing reads of the dual purposes library according to recommendation by 10x genomics. Thereafter, CITE-seq data was analysed with multi module of Cell Ranger to process together the sequencing data of gene expression (GEX), ADT and CMO. Cell-feature count matrix from all samples were then merged and analysed with Seurat (v4.3.0) following the multimodal pipeline (https://satijalab.org/seurat/articles/multimodal_vignette.html).148,149
For both 10x scRNAseq and CITE-seq, cells with UMI counts <2,000 or >10,000 were excluded from further analysis to rule out contamination from potentially dead or non-single cells. Cells with mitochondrial mRNAs >15%, and genes that were expressed in less than 50 cells were also excluded. The gene expression matrix was normalized with Seurat by the total number of unique reads, multiplied by a scale factor of 10,000 and log-transformed. The protein expression matrix of CITE-seq was normalized by ‘CLR’ method. To define HSC, MPP, HPC, and progenitor cell populations, ADT level greater than 1 was defined as CD150 and CD48 positive, and HSC was defined as CD150+CD48− (Figure. S3J).
Dimensionality reduction was done with gene matrix by Seurat. After detection of top 2000 variable features with FindVariableFeatures function of Seurat using default parameters, we applied a linear transformation of gene expression with ScaleData function prior to linear dimensional reduction with RunPCA function. UMAP algorithm was applied to visualize the cell clustering using 25 principal components. We further examined the percentage of mitochondrial mRNAs across clusters, and the one cluster with significant higher mitochondrial mRNAs were excluded from downstream analysis. Gene set enrichment scores of signatures (Table S1) in each individual cell were calculated by R package escape (v1.4.0) with normalized gene matrix.150 Correlation of gene expression or signature score was performed with the R build-in function cor.test.
Latent time analysis and trajectory inference
Latent time of each individual cell was inferred by scVelo python package (v0.2.5) based on RNA velocity to examine the cell states.151 To prepare for scVelo analysis, spliced and unspliced reads were counted using the velocyto.py package (v0.17.17)152 from reference alignment results generated by Cell Ranger. scVelo analysis was performed with spliced and unspliced read counts with default parameters, and resulting latent time vector was embedded into the UMAP space. Thereafter, trajectory inference of HSC clusters was performed with scVelo extended partition-based graph abstractions (PAGA) map.153 The directionality between HSC clusters were determined by latent time results from scVelo.
Gene expression analysis by Fluidigm
Sorted HSC (Lin−Sca-1+c-Kit+CD150+CD48−) were treated with vehicle control, iron chelator (IC, 10 μM DFO), as well as IC along with inhibition of c-Myc (Myci, 10058-F4 at a previously validated concentration, 50 μM154–157) or Tip60 (Tip60i, 20 μM TH1834). Forty-eight hours post treatment, RNA extraction and reverse transcription were performed as described above. Taqman assays (Applied Biosystems) of target genes for Fluidigm gene expression analysis are listed in Table S6. For pre-amplification of cDNA, reaction mixtures containing 1 μL PreAmp Master (Fluidigm, CA), 1.25 μL pooled 0.2x TaqMan assays, and 2.75 μL cDNA product were used. PCR amplification was performed as follows: 95°C for 2 min; 14 cycles of 95°C for 15 sec and 60°C for 4 min. No template control (NTC) was included in the pre-amplification as negative control. For sample Pre-Mix solution preparation, 2.25 μL pre-amplification product was mixed with 2.5 μL TaqMan Fast Advanced Master Mix (Applied Biosystems) and 0.25 μL 20X GE sample loading reagent (Fluidigm). Thereafter, sample Pre-Mix solutions were transferred to a 96-well plate. For 10X TaqMan assay preparation, 5 μL of each 20X TaqMan assay was diluted with 5 μL 2X assay loading reagent (Fluidigm), followed by transferring to a 96-well plate. Thereafter, plates containing sample Pre-Mix solutions and TaqMan assays were loaded onto 96.96 Dynamic Array IFC (Fluidigm) in Biomark HD system (Fluidigm). Each of the sample Pre-Mix solutions was mixed with each TaqMan assay in the IFC by Biomark system, and qPCR reactions were performed according to manufacturer’s protocol.
Data were analysed with Fluidigm Real-Time PCR Analysis Software v4.5.1 to obtain the Ct values of genes in each sample. For differential expression analysis, Delta Ct (ΔCt) of each gene was calculated by comparing the Ct value to the internal control Actb. Delta delta Ct (ΔΔCt) and fold change (2−ΔΔCt) were calculated by comparing ΔCt in each treatment condition to ΔCt in control.
Immunofluorescence staining
The following primary antibodies were used for immunofluorescence: anti-Ncoa4 (Santa Cruz Biotechnology, sc-15984),45 anti-Numb (abcam, ab4147)99 and anti-Tip60 (Thermo Fisher, 10827-1-AP). The secondary antibodies used were: Alexa Fluor 594 donkey anti-goat IgG (H+L) (Invitrogen, A-11037) and Alexa Fluor 488 goat anti-rabbit IgG (H+L) (Invitrogen, A-11008). Fluorescent dyes used were BODIPY 493/503 (Invitrogen).
Cell culture and pre-treatment:
HSC (Lin−Sca-1+c-Kit+CD150+CD48−) from wildtype C57BL/6 mice were sorted into 16-well chamber slides (Thermo Fisher Scientific) coated with RetroNectin (Takara Bio). HSC were cultured in M5300 media with 100 μg/ml Primocin supplemented with 100 ng/ml rmSCF and 50 ng/ml rmTPO. Ncoa4-mediated ferritinophagy assessment: HSC were subjected to either vehicle (H2O) or iron chelator (DFO, Sigma) treatment for 48 hours. To allow the detection of Ncoa4 foci, chloroquine (10 μM, Sigma) was added in the last 4 hour of culture to impair degradation of autophagosomes.
Cell staining and imaging:
Cells were fixed with 4% PFA for 10 min and permeabilized with 0.15% Triton X-100/PBS for 5 min at RT. Cells were then blocked in 2% BSA/0.15% Triton X-100 in PBS for 1 hour at RT and incubated overnight at 4°C with the first antibody diluted in 1% BSA/0.15% Triton X-100 followed by 45 min incubation at RT with fluorescence-conjugated secondary antibodies. Cells were washed 3 times with PBS and mounted with Prolong Gold (Molecular Probes) containing 1 μg/ml DAPI. All the images were acquired with a Confocal microscope (SP5, Leica) using 63.0× 1.40 NA oil objective and the Leica LAS-AF software. Image processing and analysis were performed using ImageJ (https://imagej.nih.gov/ij/). For Tip60 subcellular localization experiment, images were acquired using 3D Histech P250 High Capacity Slide Scanner (grant SIG #1S10OD019961–01). Tip60 intensity and nuclear/cytoplasmic ratio of each individual cells were subsequently analyzed using CellProfiler v4.2.1 as previously described.158,159
Metabolomics
Metabolomic profiling and analysis were performed as previously described.21 Ex vivo treated human CD34+ cells, as well as murine HPC7, primary HSC, LSK, MPP and LK cells were flash-frozen in liquid nitrogen and stored at −80°C before use. Samples were either sent to the Biological Mass Spectrometry Core Facility at University of Colorado Denver, or the Einstein-Mt Sinai Diabetes Center Stable Isotope & Metabolomics Core for further processing and analysis.
Cell pellets were lysed with lysis solution (methanol:acetonitrile:water 5:3:2 v/v/v) before ice cold extraction by vortexing for 30 min at 4°C. Insoluble proteins were pelleted by centrifugation (15,000 × g for 10 min at 4°C) and supernatants were analysed using a UHPLC system (Vanquish, ThermoFisher) coupled online to a mass spectrometer (Q Exactive, ThermoFisher). Samples were resolved over a Kinetex C18 column (2.1 × 150 mm, 1.7 μm; Phenomenex) at 25°C using a 9-minute gradient at 400 μl/min from 5% to 95% B (A: water/0.1% formic acid; B: acetonitrile/0.1% formic acid). MS analysis and data analysis were performed as described before.160,161 Metabolite assignments were performed using a metabolomics data analyser (MAVEN). For data analysis, the level of each metabolite was normalized to internal standard (heptadecanoic acid) and cell number. Moreover, differentially altered metabolites in each treatment condition were also analysed for biological function, upstream regulators, and canonical pathways using IPA.
Acsl4 knockdown
Short hairpin RNAs (shRNAs) targeting Acsl4 (TL502838, OriGene) were packaged in the pGFP-C-shLenti plasmid system. A nontargeting 29-mer scrambled shRNA cassette in pGFP-C-shLenti vector (TR30021, OriGene) served as a control. The sequences of Acsl4 shRNAs can be found in Table S6. For production of virus particles, lentiviral shRNA expression constructs were transfected together with packaging vectors (VSV-G, RSV-Rev and GAG-Pol) into 293T producer cells using CalPhos Transfection Kits (Takara Bio) following the manufacturer’s instructions. Supernatants were harvested after 48 and 72 hours post transfection, and concentrated by ultracentrifugation (25,000 rpm at 4°C for 2 hours). For primary mouse bone marrow cells, lineage-depleted MNC were enriched for c-Kit+ cells by magnetic-activated cell sorting (MACS) following manufacturer’s protocol. Briefly, Lin- cells were re-suspended in 2%FBS/PBS and incubated with FcR blocking reagent for 10 min on ice and then mouse monoclonal CD117-microbeads (Miltenyi; 130-091-224) for 15 min on ice. Prior to lentiviral transduction, Lin-c-Kit+ (LK) cells were pre-cultured for 4 hours in M5300 media supplemented with 100 μg/ml primocin, 50 ng/ml rmSCF, 50 ng/ml rmFlt3L, 50 ng/ml rmTPO, and 2 ng/ml rmIL-3. Lentiviruses for shAcsl4 and scrambled nontargeting control were added to RetroNectin (TaKaRa)-coated 12-well plates and centrifuged for 2 hours at 1000 × g at 32°C. After centrifugation, supernatant was discarded and pre-cultured LK cells were added immediately at a density of 500,000 cell/ml. Thereafter, the cells were spin-infected for 2 hours at 1000 × g at 37°C. After spin-infection the virus-containing media was removed and replenished with fresh M5300 media supplemented with cytokines. Forty-eight hours post transduction, GFP-positive cells were sorted on BD FACS Aria II (Becton Dickinson) and knockdown of Acsl4 was confirmed using qPCR and western blot.
Western blot
To assess Acsl4 knockdown, sorted primary GFP-positive cells were analyzed by Western blot. For HPC7 cell analyses, cells treated with iron chelators or vehicle control, protein expression changes were assessed for Acsl4, Cox1/Ptgs1, ferritin heavy (Fth1) and light (Flt1) chains. Proteins were extracted from cells using RIPA buffer (50 mM Tris, pH 7.4, 1 mM EDTA, 150 mM NaCl, 1% Triton X-100, 1% deoxycholate and 0.1% SDS) supplemented with EDTA-free protease inhibitor cocktail (Sigma, 11873580001) and 1 mM PMSF. Protein concentrations were determined using Protein Assay Kit (BioRad, 5000002). Prior to loading, cell extracts were mixed with appropriate volumes of 5x protein loading buffer (10% SDS, 25% 2-Mercapoethanol, 50% Glycerol, 125 mM Tris-HCl pH 6.8, and 0.125% Bromophenol blue) and boiled at 95°C for 10 min. Subsequently, 20–30 μg of total proteins from each sample were separated by SDS/polyacrylamide gel electrophoresis in running buffer (25 mM Tris pH 8.3, 192 mM Glycine, 0.1% SDS) and transferred onto nitrocellulose (NC) membranes (Bio-Rad, 1620094) in transfer buffer (25 mM Tris pH 8.3, 192 mM Glycine) under 300 mA constant current for respective period of time depending on the molecular weight of the target proteins. NC membranes were washed once with Tris-buffered saline-Tween 20 (TBST, 20 mM Tris pH 8.3, 137 mM NaCl, 0.1% Tween 20) and blocked in 5% skim milk/TBST for 1 hour at RT. After washing three times with TBST, NC membranes were probed overnight at 4°C with the following primary antibodies: Acsl4 (Santa Cruz Biotech, sc-365230), ferritin light chain (abcam, ab109373), ferritin heavy chain (abcam, ab65080) and actin (abcam, ab3280). Prior to and after the incubation with goat anti-rabbit (Santa Cruz Biotech, sc-2004) or goat anti-mouse (Santa Cruz Biotech, sc-2005) IgG-HRP diluted in 5% skim milk/TBST at RT for 1 hour, NC membranes were washed with TBST for three times. All blots were developed using Pierce™ ECL Western Blotting Substrate (Thermo Fisher Scientific, 32106). Signals were visualized and collected by LI-COR Odyssey Fc (LI-COR Biosciences). ImageJ (https://imagej.nih.gov/ij/) was used for quantification.
ELISA
For the preparation of serum, peripheral blood was collected from mice into non-anticoagulant-treated tube and left undisturbed at RT to clot for 30 minutes. Clot was removed by centrifuging at 2,000 RCF for 10 minutes in a refrigerated centrifuge, and supernatant was then transferred and aliquoted into 1.5 mL clean polypropylene tubes for storage at −80°C until use. ELISA assay was performed with Mouse Transferrin ELISA kit (ab157724, Abcam, Waltham, MA) and Mouse Ferritin (FTL) ELISA kit (ab157713, Abcam) according to manufacturer’s protocols. Briefly, serum sample was diluted 1:40, or 1: 100,000 with 1X diluent for the quantification of ferritin or transferrin protein, respectively. Standard samples were prepared according to manufacturer’s instructions. 100 μL diluted sample or standard control were transferred to 96 well plate strips and incubated in the dark at RT for 30 minutes. Thereafter, each well was emptied and washed four times with 200 μL 1X Wash buffer. 100 μL of 1X HRP-Antibody conjugate was then transferred to each well and incubated in the dark at RT for 30 minutes, followed by four washes with 1X Wash buffer. Thereafter, 100 μL of TMB Substrate Solution was transferred to each well and incubated in the dark at RT for 10 minutes. Reaction was stopped by adding 100 μL of Stop Solution to each well. Absorbance at 450 nM was then measured with FLUOstar Omega Microplate reader (BMG, Cary, NC). The protein level was calculated using the standard curve of standard samples.
CUT & RUN
Experiment was performed with CUT&RUN Assay Kit (Cell Signaling Technology, 86652) following manufacturer’s protocol. Briefly, at least 100,000 cells were used for CUT&RUN of Tip60 (Cell Signaling Technology, 12058S) or IgG (Cell Signaling Technology, 2729S) antibodies, or input control. After washing and resuspension in 100μL 1X Wash Buffer, cells for Tip60 or IgG CUT&RUN were incubated with 10uL of activated concanavalin A magnetic beads for 5 minutes RT, whereas cells for input control were kept in 4°C until DNA purification step. Supernatant in bead-bound cell solution was removed using a magnetic rack, and the remaining bead-bound cells were resuspended in 100μL of Antibody Binding Buffer. Thereafter, 5 μL of antibodies was added to the suspension and incubated at 4°C overnight. After washing with 1mL Digitonin Buffer, 50 μL of pAG-MNase pre-mix was used to resuspend the bead-bound cells and incubated at 4°C for one hour. pAG-MNase was activated by incubating with 3μL Calcium Chloride at 4°C for 30 min. 150 μl of 1X Stop Buffer was then added to the bead-bound solution, followed by DNA release at 37°C for 10 min. DNA was then purified with spin columns (Cell Signaling Technology, 14209). Input DNA was extracted with 200μL of DNA Extraction Buffer by incubating at 55°C for one hour. Input DNA purification was performed with phenol/chloroform extraction and ethanol precipitation method according to manufacturer’s protocol. DNA quantification was performed with qPCR using primers probing for the Tip60 binding region at the upstream promoter of target genes (Table S6), with an amplicon size less than 110bp. For comparison, % of input was calculated by normalizing the Ct values for Tip60 or IgG samples to the matched input controls.
Integrative analysis with published data sets
Full list of published data sets used for comparative analyses is available in key resources table. For microarray data sets (GSE93649 and GSE12538, GSE17096 and GSE17097), CEL files were retrieved from Gene Expression Omnibus (GEO) database. Gene expression signals across samples were normalized with RMA algorithm, and differential expression analysis was performed with R package limma.162 For bulk RNA-seq data sets (GSE120705), sequencing reads were retrieved from Sequence Read Archive (SRA) database with SRA Toolkit 2.10.7. After the removal of adapter contamination and low-quality reads with Trim Galore v0.6.5 (https://github.com/FelixKrueger/TrimGalore), gene expression quantification was performed with Salmon 1.2.1.163 Differential expression analysis was performed with tximeta 1.6.2 and DESeq2 1.28.0.164,165 Gene signatures of murine aged HSC were obtained from the resource web tool (https://agingsignature.webhosting.rug.nl/) from a previous study by Svendsen AF et al.74 Mouse bone marrow scRNAseq dataset (GSE109774) was downloaded from CytoTRACE server (https://cytotrace.stanford.edu/) and the CytoTRACE score was calculated as before.166 Briefly, all the expressed/detectable genes were used to calculate the gene count per single cell, followed by capturing genes whose expression patterns correlated with gene counts using Pearson correlation. Gene counts signature (GCS) were then defined by taking the top 200 genes whose mean expression patterns most positively correlated with gene counts. Finally, the estimate of the GCS vector was iteratively refined by leveraging the local similarity between cells using nearest neighbor graph created from a Markov model. The resulting values were ranked and scaled between 0 and 1, representing the predicted order of cells by their relative differentiation status (0, more differentiated; 1, less differentiated). For this study, we downloaded the single cell RNA-seq datasets with CytoTRACE scores from the online server, and used the scores for our downstream analysis.
For scRNA-seq datasets of aged and young HSPC (GSE70657, GSE59114, and GSE180298) and activated versus quiescent HSC (GSE165844), matrix of gene counts were obtained from GEO database. scRNA-seq dataset of label-retaining cells (LRC, dormant HSC) versus non-LRC (activated HSC) was obtained from ArrayExpress database (E-MTAB-4549). Downstream analyses of scRNAseq datasets were performed with Seurat as described above. For datasets with separated sample batches or sequencing runs (GSE180298 and GSE165844), Seurat integration was performed before dimensionality reduction, cell clustering and gene set analysis. For chromatin immunoprecipitation sequencing (ChIP-seq) data sets (GSE69671, GSE34483, GSE39237, GSE16256, GSE43103, GSE59636, GSE47082, GSE43007, GSE47765, GSE76055, and GSE22075), binding peaks and gene targets were retrieved from Cistrome Data Browser. Only genes with regulatory potential score > 0.5 were used as targets for further analysis.
Quantification and statistical analysis
All results were expressed as the mean values ± s.e.m. unless otherwise noted. Prism 9 (www.graphpad.com) or R were used for statistical analyses with Student’s t-tests. Unless otherwise specified, all statistical tests were two-sided, and analyses for significant differences between two groups of paired and unpaired samples were conducted using paired and unpaired Student’s t-test, respectively. Hypergeometric tests were performed with built-in phyper function of R, to assess the significance of overlapping between gene sets or binding peaks. Two-sample Kolmogorov-Smirnov tests were performed with built-in ks.test function of R, to compare the difference of frequency distribution of Tfrc transcript per cell under different conditions. Differential expression analysis with microarray data was performed with Limma Bioconductor package.162 Differential expression analysis with RNA-seq data was performed with DESeq2.165 Enrichment analyses of pathways were performed with Networkanalyst using KEGG167 and Reactome168 databases; upstream regulators analysis and comparison were conducted using Ingenuity Pathway Analysis (IPA). Enrichment analyses of gene sets were performed with GSEA for scRNA-seq data of iron chelator-treated HSC (GSEAPreranked analysis). Pre-ranked gene list for iron chelator-treated HSC were genes expressed in >10% of all the single cells in the scRNA-seq data, and ranked by the fold changes in iron chelator treatment compared to control. Signature enrichment score in scRNAseq datasets was calculated with R package escape (v1.4.0) with normalized gene expression matrix.150 Estimation of stem cell frequency and significant differences in stem cell frequency between different groups in LTC-IC assays were estimated with ELDA method in the R package statmod.169
Algorithms
Prism 9 (www.graphpad.com) or R were used for statistical analyses. FACS data were analyzed using the BD FACSDiva software and FlowJo V10.2 (both Becton Dickinson). Biorender was used for the creation of schemes illustrating experimental strategy, and the mechanistic model, as well as the graphical abstract.
Supplementary Material
Table S2. Frequency of hematopoietic cell populations cells after completion of iron limitation protocol, related to Figure 2–3
Table S3. Differentially expressed genes in iron chelator (IC)-treated HSC (48hrs) by scRNA-seq, related to Figure 2, 5
Table S4. Marker genes for HSC clusters C2, C3, and C6 by CITE-seq, related to Figure 3
Table S5. Altered metabolites after iron chelator treatment, related to Figure 5
Table S6. List of antibodies and oligos used in this study, related to the Key Resources Table
Highlights.
Quiescent HSC strongly restrict their pool of cytoplasmic labile iron
Regenerating HSC activate iron homeostasis pathways
Iron homeostasis is functionalized for stem cell fate determination and relies on Tip60
Reversible modest iron loading drives functional decline of aging HSC
Acknowledgements
We thank all members of the Will lab for feedback on and discussions of the study; Drs. Hilda Ye and Amit Verma for feedback on the manuscript; Drs. Sofiya Milman, Derek Huffman and Nir Barzilai for feedback on the study and access to aged mice and Longenity cohort data. We thank Victor Thiruthuvanathan, and Sonia Gallego for assistance with animal work; Drs. Justin Wheat and Goichi Tatsumi for technical support of the smRNA FISH experiments; Swathi-Rao Narayanagari and Dr. Jinghang Zhang for technical assistance with flow cytometry-based cell sorting; David Reynolds for single cell capture for RNA-seq; Yunping Qiu and Xueliang Du of the Einstein-Mount Sinai Diabetes Center Stable Isotope & Metabolomics Core, the Einstein Analytical Imaging Facility, the Einstein Institute for Animal Studies, and Peter Schultes and Jason Justiniano for expert support and technical assistance. The graphical abstract was created using Biorender. This study was supported by grants from the National Institutes of Health (P30CA013330 (core support grant), DK10513, CA230756 (to B.W.); HL157948 (to U.S. and B.W.); R35CA253127 (to U.S.); RF1AG043517 and DK123327 to R.S.), investigator-initiated research projects sponsored by GlaxoSmithKline and Novartis Pharmaceuticals (to B.W.), and a Pershing Square Sohn Prize for Young Investigators in Cancer Research (to B.W); a T32 Training grant in Aging Research (AG023475; PI: Barzilai to Y.R.K.), the Einstein Training Program in Stem Cell Research (NYSTEM C30292GG; PI: Frenette to M.M.A.), a postdoctoral fellowship from the Leukemia & Lymphoma Society (R.K.), an American Society of Hematology Scholar Award (Y.M.), an NCI Transition Award (K00CA223044 to S.S.), and a Walter Benjamin Fellowship from the German Research Foundation (J.G.). This work was supported by Jane A. and Myles P. Dempsey. B.W. is the Diane and Arthur B. Belfer Scholar in Cancer Research at Albert Einstein College of Medicine and is a Leukemia and Lymphoma Society Scholar. U.S. holds the Edward P. Evans Endowed Professorship in Myelodysplastic Syndromes at Albert Einstein College of Medicine.
Footnotes
Declaration of interests: B.W. and U.S. have received funds for research projects and serving on advisory boards from Novartis Pharmaceuticals.
Publisher's Disclaimer: This is a PDF file of an unedited manuscript that has been accepted for publication. As a service to our customers we are providing this early version of the manuscript. The manuscript will undergo copyediting, typesetting, and review of the resulting proof before it is published in its final form. Please note that during the production process errors may be discovered which could affect the content, and all legal disclaimers that apply to the journal pertain.
References
- 1.Till JE, McCulloch EA, and Siminovitch L (1964). A Stochastic Model of Stem Cell Proliferation, Based on the Growth of Spleen Colony-Forming Cells. Proceedings of the National Academy of Sciences of the United States of America 51, 29–36. 10.1073/pnas.51.1.29. [DOI] [PMC free article] [PubMed] [Google Scholar]
- 2.Spangrude GJ, Heimfeld S, and Weissman IL (1988). Purification and characterization of mouse hematopoietic stem cells. Science 241, 58–62. 10.1126/science.2898810. [DOI] [PubMed] [Google Scholar]
- 3.Suda T, Suda J, and Ogawa M (1983). Proliferative kinetics and differentiation of murine blast cell colonies in culture: evidence for variable G0 periods and constant doubling rates of early pluripotent hemopoietic progenitors. J Cell Physiol 117, 308–318. 10.1002/jcp.1041170305. [DOI] [PubMed] [Google Scholar]
- 4.Baum CM, Weissman IL, Tsukamoto AS, Buckle AM, and Peault B (1992). Isolation of a candidate human hematopoietic stem-cell population. Proceedings of the National Academy of Sciences of the United States of America 89, 2804–2808. 10.1073/pnas.89.7.2804. [DOI] [PMC free article] [PubMed] [Google Scholar]
- 5.Morrison SJ, Wandycz AM, Akashi K, Globerson A, and Weissman IL (1996). The aging of hematopoietic stem cells. Nat Med 2, 1011–1016. 10.1038/nm0996-1011. [DOI] [PubMed] [Google Scholar]
- 6.de Haan G, and Lazare SS (2018). Aging of hematopoietic stem cells. Blood 131, 479–487. 10.1182/blood-2017-06-746412. [DOI] [PubMed] [Google Scholar]
- 7.Busque L, Mio R, Mattioli J, Brais E, Blais N, Lalonde Y, Maragh M, and Gilliland DG (1996). Nonrandom X-inactivation patterns in normal females: lyonization ratios vary with age. Blood 88, 59–65. [PubMed] [Google Scholar]
- 8.Busque L, Patel JP, Figueroa ME, Vasanthakumar A, Provost S, Hamilou Z, Mollica L, Li J, Viale A, Heguy A, et al. (2012). Recurrent somatic TET2 mutations in normal elderly individuals with clonal hematopoiesis. Nat Genet 44, 1179–1181. 10.1038/ng.2413. [DOI] [PMC free article] [PubMed] [Google Scholar]
- 9.Yang JH, Hayano M, Griffin PT, Amorim JA, Bonkowski MS, Apostolides JK, Salfati EL, Blanchette M, Munding EM, Bhakta M, et al. (2023). Loss of epigenetic information as a cause of mammalian aging. Cell 186, 305–326 e327. 10.1016/j.cell.2022.12.027. [DOI] [PMC free article] [PubMed] [Google Scholar]
- 10.Will B, Vogler TO, Narayanagari S, Bartholdy B, Todorova TI, da Silva Ferreira M, Chen J, Yu Y, Mayer J, Barreyro L, et al. (2015). Minimal PU.1 reduction induces a preleukemic state and promotes development of acute myeloid leukemia. Nat Med 21, 1172–1181. 10.1038/nm.3936. [DOI] [PMC free article] [PubMed] [Google Scholar]
- 11.Dong S, Wang Q, Kao YR, Diaz A, Tasset I, Kaushik S, Thiruthuvanathan V, Zintiridou A, Nieves E, Dzieciatkowska M, et al. (2021). Chaperone-mediated autophagy sustains haematopoietic stem-cell function. Nature 591, 117–123. 10.1038/s41586-020-03129-z. [DOI] [PMC free article] [PubMed] [Google Scholar]
- 12.Orford KW, and Scadden DT (2008). Deconstructing stem cell self-renewal: genetic insights into cell-cycle regulation. Nat Rev Genet 9, 115–128. 10.1038/nrg2269. [DOI] [PubMed] [Google Scholar]
- 13.Arai F, and Suda T (2007). Maintenance of quiescent hematopoietic stem cells in the osteoblastic niche. Ann N Y Acad Sci 1106, 41–53. 10.1196/annals.1392.005. [DOI] [PubMed] [Google Scholar]
- 14.Cheng T, Rodrigues N, Shen H, Yang Y, Dombkowski D, Sykes M, and Scadden DT (2000). Hematopoietic stem cell quiescence maintained by p21cip1/waf1. Science 287, 1804–1808. 10.1126/science.287.5459.1804. [DOI] [PubMed] [Google Scholar]
- 15.Wilson A, Laurenti E, Oser G, van der Wath RC, Blanco-Bose W, Jaworski M, Offner S, Dunant CF, Eshkind L, Bockamp E, et al. (2008). Hematopoietic stem cells reversibly switch from dormancy to self-renewal during homeostasis and repair. Cell 135, 1118–1129. 10.1016/j.cell.2008.10.048. [DOI] [PubMed] [Google Scholar]
- 16.Martinez-Balbas MA, Dey A, Rabindran SK, Ozato K, and Wu C (1995). Displacement of sequence-specific transcription factors from mitotic chromatin. Cell 83, 29–38. 10.1016/0092-8674(95)90231-7. [DOI] [PubMed] [Google Scholar]
- 17.Wang Z, Fan M, Candas D, Zhang TQ, Qin L, Eldridge A, Wachsmann-Hogiu S, Ahmed KM, Chromy BA, Nantajit D, et al. (2014). Cyclin B1/Cdk1 coordinates mitochondrial respiration for cell-cycle G2/M progression. Dev Cell 29, 217–232. 10.1016/j.devcel.2014.03.012. [DOI] [PMC free article] [PubMed] [Google Scholar]
- 18.Palozola KC, Donahue G, Liu H, Grant GR, Becker JS, Cote A, Yu H, Raj A, and Zaret KS (2017). Mitotic transcription and waves of gene reactivation during mitotic exit. Science 358, 119–122. 10.1126/science.aal4671. [DOI] [PMC free article] [PubMed] [Google Scholar]
- 19.Javasky E, Shamir I, Gandhi S, Egri S, Sandler O, Rothbart SB, Kaplan N, Jaffe JD, Goren A, and Simon I (2018). Study of mitotic chromatin supports a model of bookmarking by histone modifications and reveals nucleosome deposition patterns. Genome Res 28, 1455–1466. 10.1101/gr.230300.117. [DOI] [PMC free article] [PubMed] [Google Scholar]
- 20.Vander Heiden MG, Cantley LC, and Thompson CB (2009). Understanding the Warburg effect: the metabolic requirements of cell proliferation. Science 324, 1029–1033. 10.1126/science.1160809. [DOI] [PMC free article] [PubMed] [Google Scholar]
- 21.Kao YR, Chen J, Narayanagari SR, Todorova TI, Aivalioti MM, Ferreira M, Ramos PM, Pallaud C, Mantzaris I, Shastri A, et al. (2018). Thrombopoietin receptor-independent stimulation of hematopoietic stem cells by eltrombopag. Sci Transl Med 10. 10.1126/scitranslmed.aas9563. [DOI] [PMC free article] [PubMed] [Google Scholar]
- 22.Safaee Talkhoncheh M, Baudet A, Ek F, Subramaniam A, Kao YR, Miharada N, Karlsson C, Oburoglu L, Rydstrom A, Zemaitis K, et al. (2023). Ciclopirox Ethanolamine Preserves the Immature State of Human HSCs by Mediating Intracellular Iron Content. Blood Adv. 10.1182/bloodadvances.2023009844. [DOI] [PMC free article] [PubMed] [Google Scholar]
- 23.Aisen P, Enns C, and Wessling-Resnick M (2001). Chemistry and biology of eukaryotic iron metabolism. Int J Biochem Cell Biol 33, 940–959. 10.1016/s1357-2725(01)00063-2. [DOI] [PubMed] [Google Scholar]
- 24.Richardson DR, and Milnes K (1997). The potential of iron chelators of the pyridoxal isonicotinoyl hydrazone class as effective antiproliferative agents II: the mechanism of action of ligands derived from salicylaldehyde benzoyl hydrazone and 2-hydroxy-1-naphthylaldehyde benzoyl hydrazone. Blood 89, 3025–3038. [PubMed] [Google Scholar]
- 25.Jacobs A (1976). An intracellular transit iron pool. Ciba Found Symp, 91–106. 10.1002/9780470720325.ch5. [DOI] [PubMed] [Google Scholar]
- 26.Rothman RJ, Serroni A, and Farber JL (1992). Cellular pool of transient ferric iron, chelatable by deferoxamine and distinct from ferritin, that is involved in oxidative cell injury. Mol Pharmacol 42, 703–710. [PubMed] [Google Scholar]
- 27.Kruszewski M (2003). Labile iron pool: the main determinant of cellular response to oxidative stress. Mutat Res 531, 81–92. 10.1016/j.mrfmmm.2003.08.004. [DOI] [PubMed] [Google Scholar]
- 28.Kakhlon O, and Cabantchik ZI (2002). The labile iron pool: characterization, measurement, and participation in cellular processes(1). Free Radic Biol Med 33, 1037–1046. 10.1016/s0891-5849(02)01006-7. [DOI] [PubMed] [Google Scholar]
- 29.Breuer W, Epsztejn S, and Cabantchik ZI (1995). Iron acquired from transferrin by K562 cells is delivered into a cytoplasmic pool of chelatable iron(II). The Journal of biological chemistry 270, 24209–24215. 10.1074/jbc.270.41.24209. [DOI] [PubMed] [Google Scholar]
- 30.Breuer W, Epsztejn S, and Cabantchik ZI (1996). Dynamics of the cytosolic chelatable iron pool of K562 cells. FEBS Lett 382, 304–308. 10.1016/0014-5793(96)00190-1. [DOI] [PubMed] [Google Scholar]
- 31.Tabei Y, Fukui H, Nishioka A, Hagiwara Y, Sato K, Yoneda T, Koyama T, and Horie M (2019). Effect of iron overload from multi walled carbon nanotubes on neutrophil-like differentiated HL-60 cells. Sci Rep 9, 2224. 10.1038/s41598-019-38598-4. [DOI] [PMC free article] [PubMed] [Google Scholar]
- 32.Homma T, Kobayashi S, and Fujii J (2022). Methionine Deprivation Reveals the Pivotal Roles of Cell Cycle Progression in Ferroptosis That Is Induced by Cysteine Starvation. Cells 11. 10.3390/cells11101603. [DOI] [PMC free article] [PubMed] [Google Scholar]
- 33.Oguro H, Ding L, and Morrison SJ (2013). SLAM family markers resolve functionally distinct subpopulations of hematopoietic stem cells and multipotent progenitors. Cell Stem Cell 13, 102–116. 10.1016/j.stem.2013.05.014. [DOI] [PMC free article] [PubMed] [Google Scholar]
- 34.Kiel MJ, Yilmaz OH, Iwashita T, Yilmaz OH, Terhorst C, and Morrison SJ (2005). SLAM family receptors distinguish hematopoietic stem and progenitor cells and reveal endothelial niches for stem cells. Cell 121, 1109–1121. 10.1016/j.cell.2005.05.026. [DOI] [PubMed] [Google Scholar]
- 35.Simsek T, Kocabas F, Zheng J, Deberardinis RJ, Mahmoud AI, Olson EN, Schneider JW, Zhang CC, and Sadek HA (2010). The distinct metabolic profile of hematopoietic stem cells reflects their location in a hypoxic niche. Cell Stem Cell 7, 380–390. 10.1016/j.stem.2010.07.011. [DOI] [PMC free article] [PubMed] [Google Scholar]
- 36.Takubo K, Goda N, Yamada W, Iriuchishima H, Ikeda E, Kubota Y, Shima H, Johnson RS, Hirao A, Suematsu M, and Suda T (2010). Regulation of the HIF-1alpha level is essential for hematopoietic stem cells. Cell Stem Cell 7, 391–402. 10.1016/j.stem.2010.06.020. [DOI] [PubMed] [Google Scholar]
- 37.Ito K, Carracedo A, Weiss D, Arai F, Ala U, Avigan DE, Schafer ZT, Evans RM, Suda T, Lee CH, and Pandolfi PP (2012). A PML-PPAR-delta pathway for fatty acid oxidation regulates hematopoietic stem cell maintenance. Nat Med 18, 1350–1358. 10.1038/nm.2882. [DOI] [PMC free article] [PubMed] [Google Scholar]
- 38.Takubo K, Nagamatsu G, Kobayashi CI, Nakamura-Ishizu A, Kobayashi H, Ikeda E, Goda N, Rahimi Y, Johnson RS, Soga T, et al. (2013). Regulation of glycolysis by Pdk functions as a metabolic checkpoint for cell cycle quiescence in hematopoietic stem cells. Cell Stem Cell 12, 49–61. 10.1016/j.stem.2012.10.011. [DOI] [PMC free article] [PubMed] [Google Scholar]
- 39.Maryanovich M, Zaltsman Y, Ruggiero A, Goldman A, Shachnai L, Zaidman SL, Porat Z, Golan K, Lapidot T, and Gross A (2015). An MTCH2 pathway repressing mitochondria metabolism regulates haematopoietic stem cell fate. Nature communications 6, 7901. 10.1038/ncomms8901. [DOI] [PubMed] [Google Scholar]
- 40.Beckmann J, Scheitza S, Wernet P, Fischer JC, and Giebel B (2007). Asymmetric cell division within the human hematopoietic stem and progenitor cell compartment: identification of asymmetrically segregating proteins. Blood 109, 5494–5501. 10.1182/blood-2006-11-055921. [DOI] [PubMed] [Google Scholar]
- 41.Loeffler D, Wehling A, Schneiter F, Zhang Y, Muller-Botticher N, Hoppe PS, Hilsenbeck O, Kokkaliaris KD, Endele M, and Schroeder T (2019). Asymmetric lysosome inheritance predicts activation of haematopoietic stem cells. Nature 573, 426–429. 10.1038/s41586-019-1531-6. [DOI] [PubMed] [Google Scholar]
- 42.Garcia-Prat L, Kaufmann KB, Schneiter F, Voisin V, Murison A, Chen J, Chan-Seng-Yue M, Gan OI, McLeod JL, Smith SA, et al. (2021). TFEB-mediated endolysosomal activity controls human hematopoietic stem cell fate. Cell Stem Cell 28, 1838–1850 e1810. 10.1016/j.stem.2021.07.003. [DOI] [PubMed] [Google Scholar]
- 43.Anderson CP, Shen M, Eisenstein RS, and Leibold EA (2012). Mammalian iron metabolism and its control by iron regulatory proteins. Biochim Biophys Acta 1823, 1468–1483. 10.1016/j.bbamcr.2012.05.010. [DOI] [PMC free article] [PubMed] [Google Scholar]
- 44.Rouault TA (2006). The role of iron regulatory proteins in mammalian iron homeostasis and disease. Nat Chem Biol 2, 406–414. 10.1038/nchembio807. [DOI] [PubMed] [Google Scholar]
- 45.Mancias JD, Wang X, Gygi SP, Harper JW, and Kimmelman AC (2014). Quantitative proteomics identifies NCOA4 as the cargo receptor mediating ferritinophagy. Nature 509, 105–109. 10.1038/nature13148. [DOI] [PMC free article] [PubMed] [Google Scholar]
- 46.Pinto do O P, Kolterud A, and Carlsson L (1998). Expression of the LIM-homeobox gene LH2 generates immortalized Steel factor-dependent multipotent hematopoietic precursors. Embo J 17, 5744–5756. DOI 10.1093/emboj/17.19.5744. [DOI] [PMC free article] [PubMed] [Google Scholar]
- 47.Hentze MW, Caughman SW, Rouault TA, Barriocanal JG, Dancis A, Harford JB, and Klausner RD (1987). Identification of the iron-responsive element for the translational regulation of human ferritin mRNA. Science 238, 1570–1573. 10.1126/science.3685996. [DOI] [PubMed] [Google Scholar]
- 48.Wheat JC, Sella Y, Willcockson M, Skoultchi AI, Bergman A, Singer RH, and Steidl U (2020). Single-molecule imaging of transcription dynamics in somatic stem cells. Nature 583, 431–436. 10.1038/s41586-020-2432-4. [DOI] [PMC free article] [PubMed] [Google Scholar]
- 49.Darshan D, Vanoaica L, Richman L, Beermann F, and Kuhn LC (2009). Conditional deletion of ferritin H in mice induces loss of iron storage and liver damage. Hepatology 50, 852–860. 10.1002/hep.23058. [DOI] [PubMed] [Google Scholar]
- 50.Ferreira C, Santambrogio P, Martin ME, Andrieu V, Feldmann G, Henin D, and Beaumont C (2001). H ferritin knockout mice: a model of hyperferritinemia in the absence of iron overload. Blood 98, 525–532. 10.1182/blood.v98.3.525. [DOI] [PubMed] [Google Scholar]
- 51.Hershko C, Konijn AM, Nick HP, Breuer W, Cabantchik ZI, and Link G (2001). ICL670A: a new synthetic oral chelator: evaluation in hypertransfused rats with selective radioiron probes of hepatocellular and reticuloendothelial iron stores and in iron-loaded rat heart cells in culture. Blood 97, 1115–1122. 10.1182/blood.v97.4.1115. [DOI] [PubMed] [Google Scholar]
- 52.Botzenhardt S, Li N, Chan EW, Sing CW, Wong IC, and Neubert A (2017). Safety profiles of iron chelators in young patients with haemoglobinopathies. European journal of haematology 98, 198–217. 10.1111/ejh.12833. [DOI] [PubMed] [Google Scholar]
- 53.Maggio A (2007). Light and shadows in the iron chelation treatment of haematological diseases. Br J Haematol 138, 407–421. 10.1111/j.1365-2141.2007.06666.x. [DOI] [PubMed] [Google Scholar]
- 54.Cheng G, Saleh MN, Marcher C, Vasey S, Mayer B, Aivado M, Arning M, Stone NL, and Bussel JB (2011). Eltrombopag for management of chronic immune thrombocytopenia (RAISE): a 6-month, randomised, phase 3 study. Lancet 377, 393–402. 10.1016/S0140-6736(10)60959-2. [DOI] [PubMed] [Google Scholar]
- 55.Bussel JB, Provan D, Shamsi T, Cheng G, Psaila B, Kovaleva L, Salama A, Jenkins JM, Roychowdhury D, Mayer B, et al. (2009). Effect of eltrombopag on platelet counts and bleeding during treatment of chronic idiopathic thrombocytopenic purpura: a randomised, double-blind, placebo-controlled trial. Lancet 373, 641–648. 10.1016/S0140-6736(09)60402-5. [DOI] [PubMed] [Google Scholar]
- 56.Bussel JB, Cheng G, Saleh MN, Psaila B, Kovaleva L, Meddeb B, Kloczko J, Hassani H, Mayer B, Stone NL, et al. (2007). Eltrombopag for the treatment of chronic idiopathic thrombocytopenic purpura. The New England journal of medicine 357, 2237–2247. 10.1056/NEJMoa073275. [DOI] [PubMed] [Google Scholar]
- 57.Bussel JB, de Miguel PG, Despotovic JM, Grainger JD, Sevilla J, Blanchette VS, Krishnamurti L, Connor P, David M, Boayue KB, et al. (2015). Eltrombopag for the treatment of children with persistent and chronic immune thrombocytopenia (PETIT): a randomised, multicentre, placebo-controlled study. Lancet Haematol 2, e315–325. 10.1016/S2352-3026(15)00114-3. [DOI] [PubMed] [Google Scholar]
- 58.Grainger JD, Locatelli F, Chotsampancharoen T, Donyush E, Pongtanakul B, Komvilaisak P, Sosothikul D, Drelichman G, Sirachainan N, Holzhauer S, et al. (2015). Eltrombopag for children with chronic immune thrombocytopenia (PETIT2): a randomised, multicentre, placebo-controlled trial. Lancet 386, 1649–1658. 10.1016/S0140-6736(15)61107-2. [DOI] [PubMed] [Google Scholar]
- 59.Woolthuis CM, Mariani N, Verkaik-Schakel RN, Brouwers-Vos AZ, Schuringa JJ, Vellenga E, de Wolf JT, and Huls G (2014). Aging impairs long-term hematopoietic regeneration after autologous stem cell transplantation. Biol Blood Marrow Transplant 20, 865–871. 10.1016/j.bbmt.2014.03.001. [DOI] [PubMed] [Google Scholar]
- 60.Kuranda K, Vargaftig J, de la Rochere P, Dosquet C, Charron D, Bardin F, Tonnelle C, Bonnet D, and Goodhardt M (2011). Age-related changes in human hematopoietic stem/progenitor cells. Aging Cell 10, 542–546. 10.1111/j.1474-9726.2011.00675.x. [DOI] [PubMed] [Google Scholar]
- 61.Dykstra B, Olthof S, Schreuder J, Ritsema M, and de Haan G (2011). Clonal analysis reveals multiple functional defects of aged murine hematopoietic stem cells. J Exp Med 208, 2691–2703. 10.1084/jem.20111490. [DOI] [PMC free article] [PubMed] [Google Scholar]
- 62.Beerman I, Bhattacharya D, Zandi S, Sigvardsson M, Weissman IL, Bryder D, and Rossi DJ (2010). Functionally distinct hematopoietic stem cells modulate hematopoietic lineage potential during aging by a mechanism of clonal expansion. Proceedings of the National Academy of Sciences of the United States of America 107, 5465–5470. 10.1073/pnas.1000834107. [DOI] [PMC free article] [PubMed] [Google Scholar]
- 63.Eisenstaedt R, Penninx BW, and Woodman RC (2006). Anemia in the elderly: current understanding and emerging concepts. Blood Rev 20, 213–226. 10.1016/j.blre.2005.12.002. [DOI] [PubMed] [Google Scholar]
- 64.Veatch JR, McMurray MA, Nelson ZW, and Gottschling DE (2009). Mitochondrial dysfunction leads to nuclear genome instability via an iron-sulfur cluster defect. Cell 137, 1247–1258. 10.1016/j.cell.2009.04.014. [DOI] [PMC free article] [PubMed] [Google Scholar]
- 65.Bitar M, and Weiner M (1983). Modification of age-induced changes in heme and hemoproteins by testosterone in male rats. Mech Ageing Dev 23, 285–296. 10.1016/0047-6374(83)90029-5. [DOI] [PubMed] [Google Scholar]
- 66.Atamna H, Liu J, and Ames BN (2001). Heme deficiency selectively interrupts assembly of mitochondrial complex IV in human fibroblasts: revelance to aging. J Biol Chem 276, 48410–48416. 10.1074/jbc.M108362200. [DOI] [PubMed] [Google Scholar]
- 67.Atamna H, Killilea DW, Killilea AN, and Ames BN (2002). Heme deficiency may be a factor in the mitochondrial and neuronal decay of aging. Proc Natl Acad Sci U S A 99, 14807–14812. 10.1073/pnas.192585799. [DOI] [PMC free article] [PubMed] [Google Scholar]
- 68.Hughes CE, Coody TK, Jeong MY, Berg JA, Winge DR, and Hughes AL (2020). Cysteine Toxicity Drives Age-Related Mitochondrial Decline by Altering Iron Homeostasis. Cell 180, 296–310 e218. 10.1016/j.cell.2019.12.035. [DOI] [PMC free article] [PubMed] [Google Scholar]
- 69.Doulias PT, Vlachou C, Boudouri C, Kanavaros P, Siamopoulos KC, and Galaris D (2008). Flow cytometric estimation of ‘labile iron pool’ in human white blood cells reveals a positive association with ageing. Free Radic Res 42, 253–259. 10.1080/10715760801911649. [DOI] [PubMed] [Google Scholar]
- 70.Hahn P, Song Y, Ying GS, He X, Beard J, and Dunaief JL (2009). Age-dependent and gender-specific changes in mouse tissue iron by strain. Exp Gerontol 44, 594–600. 10.1016/j.exger.2009.06.006. [DOI] [PMC free article] [PubMed] [Google Scholar]
- 71.Hallgren B, and Sourander P (1958). The effect of age on the non-haemin iron in the human brain. J Neurochem 3, 41–51. 10.1111/j.1471-4159.1958.tb12607.x. [DOI] [PubMed] [Google Scholar]
- 72.Pankhurst Q, Hautot D, Khan N, and Dobson J (2008). Increased levels of magnetic iron compounds in Alzheimer’s disease. J Alzheimers Dis 13, 49–52. 10.3233/jad-2008-13105. [DOI] [PubMed] [Google Scholar]
- 73.Xu J, Knutson MD, Carter CS, and Leeuwenburgh C (2008). Iron accumulation with age, oxidative stress and functional decline. PLoS One 3, e2865. 10.1371/journal.pone.0002865. [DOI] [PMC free article] [PubMed] [Google Scholar]
- 74.Svendsen AF, Yang D, Kim KM, Lazare SS, Skinder N, Zwart E, Mura-Meszaros A, Ausema A, Eyss BV, de Haan G, and Bystrykh LV (2021). A comprehensive transcriptome signature of murine hematopoietic stem cell aging. Blood. 10.1182/blood.2020009729. [DOI] [PubMed] [Google Scholar]
- 75.Sathyan S, Ayers E, Gao T, Weiss EF, Milman S, Verghese J, and Barzilai N (2020). Plasma proteomic profile of age, health span, and all-cause mortality in older adults. Aging Cell 19, e13250. 10.1111/acel.13250. [DOI] [PMC free article] [PubMed] [Google Scholar]
- 76.Muto Y, Nishiyama M, Nita A, Moroishi T, and Nakayama KI (2017). Essential role of FBXL5-mediated cellular iron homeostasis in maintenance of hematopoietic stem cells. Nature communications 8, 16114. 10.1038/ncomms16114. [DOI] [PMC free article] [PubMed] [Google Scholar]
- 77.Grover A, Sanjuan-Pla A, Thongjuea S, Carrelha J, Giustacchini A, Gambardella A, Macaulay I, Mancini E, Luis TC, Mead A, et al. (2016). Single-cell RNA sequencing reveals molecular and functional platelet bias of aged haematopoietic stem cells. Nat Commun 7, 11075. 10.1038/ncomms11075. [DOI] [PMC free article] [PubMed] [Google Scholar]
- 78.Rodriguez-Fraticelli AE, Wolock SL, Weinreb CS, Panero R, Patel SH, Jankovic M, Sun JL, Calogero RA, Klein AM, and Camargo FD (2018). Clonal analysis of lineage fate in native haematopoiesis. Nature 553, 212–+. 10.1038/nature25168. [DOI] [PMC free article] [PubMed] [Google Scholar]
- 79.Aksöz M, Gafencu G-A, Stoilova B, Buono M, Meng Y, Jakobsen NA, Metzner M, Clark S-A, Beveridge R, Thongjuea S, et al. (2022). Identification and Age-dependent Increase of Platelet Biased Human Hematopoietic Stem Cells. bioRxiv, 2022.2001.2014.475546. 10.1101/2022.01.14.475546. [DOI] [Google Scholar]
- 80.Crichton RR, Wilmet S, Legssyer R, and Ward RJ (2002). Molecular and cellular mechanisms of iron homeostasis and toxicity in mammalian cells. J Inorg Biochem 91, 9–18. 10.1016/s0162-0134(02)00461-0. [DOI] [PubMed] [Google Scholar]
- 81.Zhao J, Jia Y, Mahmut D, Deik AA, Jeanfavre S, Clish CB, and Sankaran VG (2023). Human hematopoietic stem cell vulnerability to ferroptosis. Cell 186, 732–747 e716. 10.1016/j.cell.2023.01.020. [DOI] [PMC free article] [PubMed] [Google Scholar]
- 82.Kuribayashi W, Oshima M, Itokawa N, Koide S, Nakajima-Takagi Y, Yamashita M, Yamazaki S, Rahmutulla B, Miura F, Ito T, et al. (2021). Limited rejuvenation of aged hematopoietic stem cells in young bone marrow niche. J Exp Med 218. 10.1084/jem.20192283. [DOI] [PMC free article] [PubMed] [Google Scholar]
- 83.Passegue E, Wagers AJ, Giuriato S, Anderson WC, and Weissman IL (2005). Global analysis of proliferation and cell cycle gene expression in the regulation of hematopoietic stem and progenitor cell fates. J Exp Med 202, 1599–1611. 10.1084/jem.20050967. [DOI] [PMC free article] [PubMed] [Google Scholar]
- 84.Sanjuan-Pla A, Macaulay IC, Jensen CT, Woll PS, Luis TC, Mead A, Moore S, Carella C, Matsuoka S, Bouriez Jones T, et al. (2013). Platelet-biased stem cells reside at the apex of the haematopoietic stem-cell hierarchy. Nature 502, 232–236. 10.1038/nature12495. [DOI] [PubMed] [Google Scholar]
- 85.Carrelha J, Meng Y, Kettyle LM, Luis TC, Norfo R, Alcolea V, Boukarabila H, Grasso F, Gambardella A, Grover A, et al. (2018). Hierarchically related lineage-restricted fates of multipotent haematopoietic stem cells. Nature 554, 106–111. 10.1038/nature25455. [DOI] [PubMed] [Google Scholar]
- 86.Arosio P, and Levi S (2010). Cytosolic and mitochondrial ferritins in the regulation of cellular iron homeostasis and oxidative damage. Biochim Biophys Acta 1800, 783–792. 10.1016/j.bbagen.2010.02.005. [DOI] [PubMed] [Google Scholar]
- 87.Anderson GJ, and Frazer DM (2017). Current understanding of iron homeostasis. Am J Clin Nutr 106, 1559S–1566S. 10.3945/ajcn.117.155804. [DOI] [PMC free article] [PubMed] [Google Scholar]
- 88.Kusch T, Florens L, Macdonald WH, Swanson SK, Glaser RL, Yates JR 3rd, Abmayr SM, Washburn MP, and Workman JL (2004). Acetylation by Tip60 is required for selective histone variant exchange at DNA lesions. Science 306, 2084–2087. 10.1126/science.1103455. [DOI] [PubMed] [Google Scholar]
- 89.Sivanand S, Viney I, and Wellen KE (2018). Spatiotemporal Control of Acetyl-CoA Metabolism in Chromatin Regulation. Trends Biochem Sci 43, 61–74. 10.1016/j.tibs.2017.11.004. [DOI] [PMC free article] [PubMed] [Google Scholar]
- 90.Galarneau L, Nourani A, Boudreault AA, Zhang Y, Heliot L, Allard S, Savard J, Lane WS, Stillman DJ, and Cote J (2000). Multiple links between the NuA4 histone acetyltransferase complex and epigenetic control of transcription. Mol Cell 5, 927–937. 10.1016/s1097-2765(00)80258-0. [DOI] [PubMed] [Google Scholar]
- 91.Krogan NJ, Baetz K, Keogh MC, Datta N, Sawa C, Kwok TC, Thompson NJ, Davey MG, Pootoolal J, Hughes TR, et al. (2004). Regulation of chromosome stability by the histone H2A variant Htz1, the Swr1 chromatin remodeling complex, and the histone acetyltransferase NuA4. Proceedings of the National Academy of Sciences of the United States of America 101, 13513–13518. 10.1073/pnas.0405753101. [DOI] [PMC free article] [PubMed] [Google Scholar]
- 92.Numata A, Kwok HS, Zhou QL, Li J, Tirado-Magallanes R, Espinosa Angarcia V, Hannah RL, Park J, Wang CQ, Krishnan V, et al. (2020). Lysine acetyltransferase Tip60 is required for hematopoietic stem cell maintenance. Blood. 10.1182/blood.2019001279. [DOI] [PMC free article] [PubMed] [Google Scholar]
- 93.Krogan NJ, Dover J, Wood A, Schneider J, Heidt J, Boateng MA, Dean K, Ryan OW, Golshani A, Johnston M, et al. (2003). The Paf1 complex is required for histone H3 methylation by COMPASS and Dot1p: linking transcriptional elongation to histone methylation. Mol Cell 11, 721–729. 10.1016/s1097-2765(03)00091-1. [DOI] [PubMed] [Google Scholar]
- 94.Sen P, Dang W, Donahue G, Dai J, Dorsey J, Cao X, Liu W, Cao K, Perry R, Lee JY, et al. (2015). H3K36 methylation promotes longevity by enhancing transcriptional fidelity. Genes & development 29, 1362–1376. 10.1101/gad.263707.115. [DOI] [PMC free article] [PubMed] [Google Scholar]
- 95.Allard S, Utley RT, Savard J, Clarke A, Grant P, Brandl CJ, Pillus L, Workman JL, and Cote J (1999). NuA4, an essential transcription adaptor/histone H4 acetyltransferase complex containing Esa1p and the ATM-related cofactor Tra1p. EMBO J 18, 5108–5119. 10.1093/emboj/18.18.5108. [DOI] [PMC free article] [PubMed] [Google Scholar]
- 96.Kim J, Woo AJ, Chu J, Snow JW, Fujiwara Y, Kim CG, Cantor AB, and Orkin SH (2010). A Myc network accounts for similarities between embryonic stem and cancer cell transcription programs. Cell 143, 313–324. 10.1016/j.cell.2010.09.010. [DOI] [PMC free article] [PubMed] [Google Scholar]
- 97.Picaud S, Leonards K, Lambert JP, Dovey O, Wells C, Fedorov O, Monteiro O, Fujisawa T, Wang CY, Lingard H, et al. (2016). Promiscuous targeting of bromodomains by bromosporine identifies BET proteins as master regulators of primary transcription response in leukemia. Sci Adv 2, e1600760. 10.1126/sciadv.1600760. [DOI] [PMC free article] [PubMed] [Google Scholar]
- 98.Laurenti E, Varnum-Finney B, Wilson A, Ferrero I, Blanco-Bose WE, Ehninger A, Knoepfler PS, Cheng PF, MacDonald HR, Eisenman RN, et al. (2008). Hematopoietic stem cell function and survival depend on c-Myc and N-Myc activity. Cell Stem Cell 3, 611–624. 10.1016/j.stem.2008.09.005. [DOI] [PMC free article] [PubMed] [Google Scholar]
- 99.Will B, Vogler TO, Bartholdy B, Garrett-Bakelman F, Mayer J, Barreyro L, Pandolfi A, Todorova TI, Okoye-Okafor UC, Stanley RF, et al. (2013). Satb1 regulates the self-renewal of hematopoietic stem cells by promoting quiescence and repressing differentiation commitment. Nat Immunol 14, 437–445. 10.1038/ni.2572. [DOI] [PMC free article] [PubMed] [Google Scholar]
- 100.Hayashi S, and McMahon AP (2002). Efficient recombination in diverse tissues by a tamoxifen-inducible form of Cre: a tool for temporally regulated gene activation/inactivation in the mouse. Dev Biol 244, 305–318. 10.1006/dbio.2002.0597. [DOI] [PubMed] [Google Scholar]
- 101.Ito K, and Suda T (2014). Metabolic requirements for the maintenance of self-renewing stem cells. Nat Rev Mol Cell Bio 15, 243–256. 10.1038/nrm3772. [DOI] [PMC free article] [PubMed] [Google Scholar]
- 102.Fan J, Krautkramer KA, Feldman JL, and Denu JM (2015). Metabolic regulation of histone post-translational modifications. ACS Chem Biol 10, 95–108. 10.1021/cb500846u. [DOI] [PMC free article] [PubMed] [Google Scholar]
- 103.Olzmann JA, and Carvalho P (2019). Dynamics and functions of lipid droplets. Nat Rev Mol Cell Biol 20, 137–155. 10.1038/s41580-018-0085-z. [DOI] [PMC free article] [PubMed] [Google Scholar]
- 104.Singh R, Kaushik S, Wang Y, Xiang Y, Novak I, Komatsu M, Tanaka K, Cuervo AM, and Czaja MJ (2009). Autophagy regulates lipid metabolism. Nature 458, 1131–1135. 10.1038/nature07976. [DOI] [PMC free article] [PubMed] [Google Scholar]
- 105.Schulze RJ, Sathyanarayan A, and Mashek DG (2017). Breaking fat: The regulation and mechanisms of lipophagy. Biochim Biophys Acta Mol Cell Biol Lipids 1862, 1178–1187. 10.1016/j.bbalip.2017.06.008. [DOI] [PMC free article] [PubMed] [Google Scholar]
- 106.Tatenaka Y, Kato H, Ishiyama M, Sasamoto K, Shiga M, Nishitoh H, and Ueno Y (2019). Monitoring Lipid Droplet Dynamics in Living Cells by Using Fluorescent Probes. Biochemistry 58, 499–503. 10.1021/acs.biochem.8b01071. [DOI] [PubMed] [Google Scholar]
- 107.Cany J, Roeven MWH, Hoogstad-van Evert JS, Hobo W, Maas F, Franco Fernandez R, Blijlevens NMA, van der Velden WJ, Huls G, Jansen JH, et al. (2018). Decitabine enhances targeting of AML cells by CD34(+) progenitor-derived NK cells in NOD/SCID/IL2Rg(null) mice. Blood 131, 202–214. 10.1182/blood-2017-06-790204. [DOI] [PMC free article] [PubMed] [Google Scholar]
- 108.Smirnova E, Goldberg EB, Makarova KS, Lin L, Brown WJ, and Jackson CL (2006). ATGL has a key role in lipid droplet/adiposome degradation in mammalian cells. EMBO Rep 7, 106–113. 10.1038/sj.embor.7400559. [DOI] [PMC free article] [PubMed] [Google Scholar]
- 109.Rambold AS, Cohen S, and Lippincott-Schwartz J (2015). Fatty acid trafficking in starved cells: regulation by lipid droplet lipolysis, autophagy, and mitochondrial fusion dynamics. Dev Cell 32, 678–692. 10.1016/j.devcel.2015.01.029. [DOI] [PMC free article] [PubMed] [Google Scholar]
- 110.Carpenter K, Pollitt RJ, and Middleton B (1992). Human liver long-chain 3-hydroxyacyl-coenzyme A dehydrogenase is a multifunctional membrane-bound beta-oxidation enzyme of mitochondria. Biochem Biophys Res Commun 183, 443–448. 10.1016/0006-291x(92)90501-b. [DOI] [PubMed] [Google Scholar]
- 111.Schlaepfer IR, and Joshi M (2020). CPT1A-mediated Fat Oxidation, Mechanisms, and Therapeutic Potential. Endocrinology 161. 10.1210/endocr/bqz046. [DOI] [PubMed] [Google Scholar]
- 112.Kuwata H, and Hara S (2019). Role of acyl-CoA synthetase ACSL4 in arachidonic acid metabolism. Prostaglandins Other Lipid Mediat 144, 106363. 10.1016/j.prostaglandins.2019.106363. [DOI] [PubMed] [Google Scholar]
- 113.Broxmeyer HE, Cooper S, Levi S, and Arosio P (1991). Mutated recombinant human heavy-chain ferritins and myelosuppression in vitro and in vivo: a link between ferritin ferroxidase activity and biological function. Proceedings of the National Academy of Sciences of the United States of America 88, 770–774. 10.1073/pnas.88.3.770. [DOI] [PMC free article] [PubMed] [Google Scholar]
- 114.Yang C, Wu J, and Zheng YG (2012). Function of the active site lysine autoacetylation in Tip60 catalysis. PLoS One 7, e32886. 10.1371/journal.pone.0032886. [DOI] [PMC free article] [PubMed] [Google Scholar]
- 115.Frank SR, Parisi T, Taubert S, Fernandez P, Fuchs M, Chan HM, Livingston DM, and Amati B (2003). MYC recruits the TIP60 histone acetyltransferase complex to chromatin. EMBO Rep 4, 575–580. 10.1038/sj.embor.embor861. [DOI] [PMC free article] [PubMed] [Google Scholar]
- 116.Moussaieff A, Rouleau M, Kitsberg D, Cohen M, Levy G, Barasch D, Nemirovski A, Shen-Orr S, Laevsky I, Amit M, et al. (2015). Glycolysis-mediated changes in acetyl-CoA and histone acetylation control the early differentiation of embryonic stem cells. Cell Metab 21, 392–402. 10.1016/j.cmet.2015.02.002. [DOI] [PubMed] [Google Scholar]
- 117.Ryall JG, Dell’Orso S, Derfoul A, Juan A, Zare H, Feng X, Clermont D, Koulnis M, Gutierrez-Cruz G, Fulco M, and Sartorelli V (2015). The NAD(+)-dependent SIRT1 deacetylase translates a metabolic switch into regulatory epigenetics in skeletal muscle stem cells. Cell Stem Cell 16, 171–183. 10.1016/j.stem.2014.12.004. [DOI] [PMC free article] [PubMed] [Google Scholar]
- 118.Pollyea DA, Stevens BM, Jones CL, Winters A, Pei S, Minhajuddin M, D’Alessandro A, Culp-Hill R, Riemondy KA, Gillen AE, et al. (2018). Venetoclax with azacitidine disrupts energy metabolism and targets leukemia stem cells in patients with acute myeloid leukemia. Nat Med 24, 1859–1866. 10.1038/s41591-018-0233-1. [DOI] [PMC free article] [PubMed] [Google Scholar]
- 119.Slack JM (2008). Origin of stem cells in organogenesis. Science 322, 1498–1501. 10.1126/science.1162782. [DOI] [PubMed] [Google Scholar]
- 120.Chandel NS (2021). Metabolism of Proliferating Cells. Cold Spring Harb Perspect Biol 13. 10.1101/cshperspect.a040618. [DOI] [PMC free article] [PubMed] [Google Scholar]
- 121.Outten FW, and Theil EC (2009). Iron-based redox switches in biology. Antioxid Redox Signal 11, 1029–1046. 10.1089/ars.2008.2296. [DOI] [PMC free article] [PubMed] [Google Scholar]
- 122.Van Vranken JG, Jeong MY, Wei P, Chen YC, Gygi SP, Winge DR, and Rutter J (2016). The mitochondrial acyl carrier protein (ACP) coordinates mitochondrial fatty acid synthesis with iron sulfur cluster biogenesis. Elife 5. 10.7554/eLife.17828. [DOI] [PMC free article] [PubMed] [Google Scholar]
- 123.Beinert H, and Kennedy MC (1993). Aconitase, a two-faced protein: enzyme and iron regulatory factor. Faseb J 7, 1442–1449. 10.1096/fasebj.7.15.8262329. [DOI] [PubMed] [Google Scholar]
- 124.Stiban J, So M, and Kaguni LS (2016). Iron-Sulfur Clusters in Mitochondrial Metabolism: Multifaceted Roles of a Simple Cofactor. Biochemistry (Mosc) 81, 1066–1080. 10.1134/S0006297916100059. [DOI] [PubMed] [Google Scholar]
- 125.Salonen JT, Tuomainen TP, Salonen R, Lakka TA, and Nyyssonen K (1998). Donation of blood is associated with reduced risk of myocardial infarction. The Kuopio Ischaemic Heart Disease Risk Factor Study. Am J Epidemiol 148, 445–451. 10.1093/oxfordjournals.aje.a009669. [DOI] [PubMed] [Google Scholar]
- 126.Kiss JE, Brambilla D, Glynn SA, Mast AE, Spencer BR, Stone M, Kleinman SH, Cable RG, National Heart L, Blood Institute Recipient E, and Donor Evaluation S III (2015). Oral iron supplementation after blood donation: a randomized clinical trial. JAMA 313, 575–583. 10.1001/jama.2015.119. [DOI] [PMC free article] [PubMed] [Google Scholar]
- 127.Rigas AS, Pedersen OB, Magnussen K, Erikstrup C, and Ullum H (2019). Iron deficiency among blood donors: experience from the Danish Blood Donor Study and from the Copenhagen ferritin monitoring scheme. Transfus Med 29 Suppl 1, 23–27. 10.1111/tme.12477. [DOI] [PubMed] [Google Scholar]
- 128.Karpova D, Encabo HH, Donato E, Kotova I, Calderazzo S, Leppä A, Panten J, Przbylla A, Seifried E, Kopp-Schneider A, et al. (2022). Frequent whole blood donations select for DNMT3A variants mediating enhanced response to erythropoietin. medRxiv, 2022.2007.2024.22277825. 10.1101/2022.07.24.22277825. [DOI] [Google Scholar]
- 129.Zhao J, Dahlen T, Brynolf A, and Edgren G (2020). Risk of hematological malignancy in blood donors: A nationwide cohort study. Transfusion 60, 2591–2596. 10.1111/trf.16020. [DOI] [PMC free article] [PubMed] [Google Scholar]
- 130.Guralnik JM, Eisenstaedt RS, Ferrucci L, Klein HG, and Woodman RC (2004). Prevalence of anemia in persons 65 years and older in the United States: evidence for a high rate of unexplained anemia. Blood 104, 2263–2268. 10.1182/blood-2004-05-1812. [DOI] [PubMed] [Google Scholar]
- 131.Nemeth E, and Ganz T (2014). Anemia of inflammation. Hematol Oncol Clin North Am 28, 671–681, vi. 10.1016/j.hoc.2014.04.005. [DOI] [PMC free article] [PubMed] [Google Scholar]
- 132.Ludwig H, Van Belle S, Barrett-Lee P, Birgegard G, Bokemeyer C, Gascon P, Kosmidis P, Krzakowski M, Nortier J, Olmi P, et al. (2004). The European Cancer Anaemia Survey (ECAS): a large, multinational, prospective survey defining the prevalence, incidence, and treatment of anaemia in cancer patients. Eur J Cancer 40, 2293–2306. 10.1016/j.ejca.2004.06.019. [DOI] [PubMed] [Google Scholar]
- 133.Pinto do OP, Kolterud A, and Carlsson L (1998). Expression of the LIM-homeobox gene LH2 generates immortalized steel factor-dependent multipotent hematopoietic precursors. EMBO J 17, 5744–5756. 10.1093/emboj/17.19.5744. [DOI] [PMC free article] [PubMed] [Google Scholar]
- 134.Palacios R, and Steinmetz M (1985). Il-3-dependent mouse clones that express B-220 surface antigen, contain Ig genes in germ-line configuration, and generate B lymphocytes in vivo. Cell 41, 727–734. 10.1016/s0092-8674(85)80053-2. [DOI] [PubMed] [Google Scholar]
- 135.Hu Y, and Smyth GK (2009). ELDA: extreme limiting dilution analysis for comparing depleted and enriched populations in stem cell and other assays. J Immunol Methods 347, 70–78. 10.1016/j.jim.2009.06.008. [DOI] [PubMed] [Google Scholar]
- 136.Hershberg EA, Close JL, Camplisson CK, Attar S, Chern R, Liu Y, Akilesh S, Nicovich PR, and Beliveau BJ (2020). PaintSHOP enables the interactive design of transcriptome- and genome-scale oligonucleotide FISH experiments. bioRxiv, 2020.2007.2005.188797. 10.1101/2020.07.05.188797. [DOI] [PMC free article] [PubMed] [Google Scholar]
- 137.Maekiniemi A, Singer RH, and Tutucci E (2020). Single molecule mRNA fluorescent in situ hybridization combined with immunofluorescence in S. cerevisiae: Dataset and quantification. Data Brief 30, 105511. 10.1016/j.dib.2020.105511. [DOI] [PMC free article] [PubMed] [Google Scholar]
- 138.Loeffler D, Wang W, Hopf A, Hilsenbeck O, Bourgine PE, Rudolf F, Martin I, and Schroeder T (2018). Mouse and human HSPC immobilization in liquid culture by CD43- or CD44-antibody coating. Blood 131, 1425–1429. 10.1182/blood-2017-07-794131. [DOI] [PubMed] [Google Scholar]
- 139.Leenen PJ, Kroos MJ, Melis M, Slieker WA, van Ewijk W, and van Eijk HG (1990). Differential inhibition of macrophage proliferation by anti-transferrin receptor antibody ER-MP21: correlation to macrophage differentiation stage. Exp Cell Res 189, 55–63. 10.1016/0014-4827(90)90256-a. [DOI] [PubMed] [Google Scholar]
- 140.Goodwin JM, Dowdle WE, DeJesus R, Wang Z, Bergman P, Kobylarz M, Lindeman A, Xavier RJ, McAllister G, Nyfeler B, et al. (2017). Autophagy-Independent Lysosomal Targeting Regulated by ULK1/2-FIP200 and ATG9. Cell Rep 20, 2341–2356. 10.1016/j.celrep.2017.08.034. [DOI] [PMC free article] [PubMed] [Google Scholar]
- 141.Portilla D, Dai G, Peters JM, Gonzalez FJ, Crew MD, and Proia AD (2000). Etomoxir-induced PPARalpha-modulated enzymes protect during acute renal failure. Am J Physiol Renal Physiol 278, F667–675. 10.1152/ajprenal.2000.278.4.F667. [DOI] [PubMed] [Google Scholar]
- 142.Lopaschuk GD, Wall SR, Olley PM, and Davies NJ (1988). Etomoxir, a carnitine palmitoyltransferase I inhibitor, protects hearts from fatty acid-induced ischemic injury independent of changes in long chain acylcarnitine. Circ Res 63, 1036–1043. 10.1161/01.res.63.6.1036. [DOI] [PubMed] [Google Scholar]
- 143.Sola-Garcia A, Caliz-Molina MA, Espadas I, Petr M, Panadero-Moron C, Gonzalez-Moran D, Martin-Vazquez ME, Narbona-Perez AJ, Lopez-Noriega L, Martinez-Corrales G, et al. (2023). Metabolic reprogramming by Acly inhibition using SB-204990 alters glucoregulation and modulates molecular mechanisms associated with aging. Commun Biol 6, 250. 10.1038/s42003-023-04625-4. [DOI] [PMC free article] [PubMed] [Google Scholar]
- 144.Huang MJ, Cheng YC, Liu CR, Lin S, and Liu HE (2006). A small-molecule c-Myc inhibitor, 10058-F4, induces cell-cycle arrest, apoptosis, and myeloid differentiation of human acute myeloid leukemia. Exp Hematol 34, 1480–1489. 10.1016/j.exphem.2006.06.019. [DOI] [PubMed] [Google Scholar]
- 145.Gao C, Bourke E, Scobie M, Famme MA, Koolmeister T, Helleday T, Eriksson LA, Lowndes NF, and Brown JA (2014). Rational design and validation of a Tip60 histone acetyltransferase inhibitor. Sci Rep 4, 5372. 10.1038/srep05372. [DOI] [PMC free article] [PubMed] [Google Scholar]
- 146.Stoeckius M, Hafemeister C, Stephenson W, Houck-Loomis B, Chattopadhyay PK, Swerdlow H, Satija R, and Smibert P (2017). Simultaneous epitope and transcriptome measurement in single cells. Nat Methods 14, 865–868. 10.1038/nmeth.4380. [DOI] [PMC free article] [PubMed] [Google Scholar]
- 147.Zheng GX, Terry JM, Belgrader P, Ryvkin P, Bent ZW, Wilson R, Ziraldo SB, Wheeler TD, McDermott GP, Zhu J, et al. (2017). Massively parallel digital transcriptional profiling of single cells. Nature communications 8, 14049. 10.1038/ncomms14049. [DOI] [PMC free article] [PubMed] [Google Scholar]
- 148.Satija R, Farrell JA, Gennert D, Schier AF, and Regev A (2015). Spatial reconstruction of single-cell gene expression data. Nature biotechnology 33, 495–502. 10.1038/nbt.3192. [DOI] [PMC free article] [PubMed] [Google Scholar]
- 149.Hao Y, Hao S, Andersen-Nissen E, Mauck WM 3rd, Zheng S, Butler A, Lee MJ, Wilk AJ, Darby C, Zager M, et al. (2021). Integrated analysis of multimodal single-cell data. Cell 184, 3573–3587 e3529. 10.1016/j.cell.2021.04.048. [DOI] [PMC free article] [PubMed] [Google Scholar]
- 150.Borcherding N, Vishwakarma A, Voigt AP, Bellizzi A, Kaplan J, Nepple K, Salem AK, Jenkins RW, Zakharia Y, and Zhang W (2021). Mapping the immune environment in clear cell renal carcinoma by single-cell genomics. Commun Biol 4, 122. 10.1038/s42003-020-01625-6. [DOI] [PMC free article] [PubMed] [Google Scholar]
- 151.Bergen V, Lange M, Peidli S, Wolf FA, and Theis FJ (2020). Generalizing RNA velocity to transient cell states through dynamical modeling. Nature biotechnology 38, 1408–1414. 10.1038/s41587-020-0591-3. [DOI] [PubMed] [Google Scholar]
- 152.La Manno G, Soldatov R, Zeisel A, Braun E, Hochgerner H, Petukhov V, idschreiber K, Kastriti ME, Lonnerberg P, Furlan A, et al. (2018). RNA velocity of single cells. Nature 560, 494–498. 10.1038/s41586-018-0414-6. [DOI] [PMC free article] [PubMed] [Google Scholar]
- 153.Wolf FA, Hamey FK, Plass M, Solana J, Dahlin JS, Gottgens B, Rajewsky N, Simon L, and Theis FJ (2019). PAGA: graph abstraction reconciles clustering with trajectory inference through a topology preserving map of single cells. Genome biology 20, 59. 10.1186/s13059-019-1663-x. [DOI] [PMC free article] [PubMed] [Google Scholar]
- 154.Takeishi S, Matsumoto A, Onoyama I, Naka K, Hirao A, and Nakayama KI (2013). Ablation of Fbxw7 eliminates leukemia-initiating cells by preventing quiescence. Cancer Cell 23, 347–361. 10.1016/j.ccr.2013.01.026. [DOI] [PubMed] [Google Scholar]
- 155.Muto T, Guillamot M, Yeung J, Fang J, Bennett J, Nadorp B, Lasry A, Redondo LZ, Choi K, Gong Y, et al. (2022). TRAF6 functions as a tumor suppressor in myeloid malignancies by directly targeting MYC oncogenic activity. Cell Stem Cell 29, 298–314 e299. 10.1016/j.stem.2021.12.007. [DOI] [PMC free article] [PubMed] [Google Scholar]
- 156.Cabezas-Wallscheid N, Buettner F, Sommerkamp P, Klimmeck D, Ladel L, Thalheimer FB, Pastor-Flores D, Roma LP, Renders S, Zeisberger P, et al. (2017). Vitamin A-Retinoic Acid Signaling Regulates Hematopoietic Stem Cell Dormancy. Cell 169, 807–823 e819. 10.1016/j.cell.2017.04.018. [DOI] [PubMed] [Google Scholar]
- 157.Salgado ER, Montesino R, Jimenez SP, Gonzalez M, Hugues F, Cabezas OI, Maura-Perez R, Saavedra P, Lamazares E, Salas-Burgos A, et al. (2015). Post-translational modification of a chimeric EPO-Fc hormone is more important than its molecular size in defining its in vivo hematopoietic activity. Biochim Biophys Acta 1850, 1685–1693. 10.1016/j.bbagen.2015.04.012. [DOI] [PubMed] [Google Scholar]
- 158.Stirling DR, Swain-Bowden MJ, Lucas AM, Carpenter AE, Cimini BA, and Goodman A (2021). CellProfiler 4: improvements in speed, utility and usability. Bmc Bioinformatics 22, 433. 10.1186/s12859-021-04344-9. [DOI] [PMC free article] [PubMed] [Google Scholar]
- 159.Sero JE, and Bakal C (2017). Multiparametric Analysis of Cell Shape Demonstrates that beta-PIX Directly Couples YAP Activation to Extracellular Matrix Adhesion. Cell Syst 4, 84–96 e86. 10.1016/j.cels.2016.11.015. [DOI] [PMC free article] [PubMed] [Google Scholar]
- 160.Reisz JA, Zheng C, D’Alessandro A, and Nemkov T (2019). Untargeted and Semi-targeted Lipid Analysis of Biological Samples Using Mass Spectrometry-Based Metabolomics. Methods Mol Biol 1978, 121–135. 10.1007/978-1-4939-9236-2_8. [DOI] [PubMed] [Google Scholar]
- 161.Nemkov T, Reisz JA, Gehrke S, Hansen KC, and D’Alessandro A (2019). High-Throughput Metabolomics: Isocratic and Gradient Mass Spectrometry-Based Methods. Methods Mol Biol 1978, 13–26. 10.1007/978-1-4939-9236-2_2. [DOI] [PubMed] [Google Scholar]
- 162.Ritchie ME, Phipson B, Wu D, Hu Y, Law CW, Shi W, and Smyth GK (2015). limma powers differential expression analyses for RNA-sequencing and microarray studies. Nucleic Acids Res 43, e47. 10.1093/nar/gkv007. [DOI] [PMC free article] [PubMed] [Google Scholar]
- 163.Patro R, Duggal G, Love MI, Irizarry RA, and Kingsford C (2017). Salmon provides fast and bias-aware quantification of transcript expression. Nat Methods 14, 417–419. 10.1038/nmeth.4197. [DOI] [PMC free article] [PubMed] [Google Scholar]
- 164.Love MI, Soneson C, Hickey PF, Johnson LK, Pierce NT, Shepherd L, Morgan M, and Patro R (2020). Tximeta: Reference sequence checksums for provenance identification in RNA-seq. PLoS Comput Biol 16, e1007664. 10.1371/journal.pcbi.1007664. [DOI] [PMC free article] [PubMed] [Google Scholar]
- 165.Love MI, Huber W, and Anders S (2014). Moderated estimation of fold change and dispersion for RNA-seq data with DESeq2. Genome Biol 15, 550. 10.1186/s13059-014-0550-8. [DOI] [PMC free article] [PubMed] [Google Scholar]
- 166.Gulati GS, Sikandar SS, Wesche DJ, Manjunath A, Bharadwaj A, Berger MJ, Ilagan F, Kuo AH, Hsieh RW, Cai S, et al. (2020). Single-cell transcriptional diversity is a hallmark of developmental potential. Science 367, 405–411. 10.1126/science.aax0249. [DOI] [PMC free article] [PubMed] [Google Scholar]
- 167.Zhou G, Soufan O, Ewald J, Hancock REW, Basu N, and Xia J (2019). NetworkAnalyst 3.0: a visual analytics platform for comprehensive gene expression profiling and meta-analysis. Nucleic Acids Res 47, W234–W241. 10.1093/nar/gkz240. [DOI] [PMC free article] [PubMed] [Google Scholar]
- 168.Kanehisa M, and Goto S (2000). KEGG: kyoto encyclopedia of genes and genomes. Nucleic acids research 28, 27–30. 10.1093/nar/28.1.27. [DOI] [PMC free article] [PubMed] [Google Scholar]
- 169.Hu YF, and Smyth GK (2009). ELDA: Extreme limiting dilution analysis for comparing depleted and enriched populations in stem cell and other assays. J Immunol Methods 347, 70–78. 10.1016/j.jim.2009.06.008. [DOI] [PubMed] [Google Scholar]
Associated Data
This section collects any data citations, data availability statements, or supplementary materials included in this article.
Supplementary Materials
Table S2. Frequency of hematopoietic cell populations cells after completion of iron limitation protocol, related to Figure 2–3
Table S3. Differentially expressed genes in iron chelator (IC)-treated HSC (48hrs) by scRNA-seq, related to Figure 2, 5
Table S4. Marker genes for HSC clusters C2, C3, and C6 by CITE-seq, related to Figure 3
Table S5. Altered metabolites after iron chelator treatment, related to Figure 5
Table S6. List of antibodies and oligos used in this study, related to the Key Resources Table
Data Availability Statement
NGS data generated during this study have been deposited at GEO and are publicly available as of the date of publication. Accession numbers are listed in the key resources table.
This paper analyzes existing, publicly available data. These accession numbers for the datasets are listed in the key resources table.
This paper does not report original code.
Any additional information required to reanalyze the data reported in this paper is available from the lead contact upon request.
Key Resources Table.
| REAGENT or RESOURCE | SOURCE | IDENTIFIER |
|---|---|---|
| Antibodies | ||
| Hadha Unconjugated; Anti-mouse [Clone: EPR17940] | Abcam | Cat#ab203114; RRID:AB_3083611 |
| Alexa Fluor 647 goat anti-rabbit IgG (H+L) | Invitrogen | Cat#A21245; RRID:AB_2535813 |
| biotinylated anti-CD44 | Invitrogen | Cat#13-0441-82; RRID:AB_466442 |
| Alexa Fluor 594 donkey anti-goat IgG (H+L) | Invitrogen | Cat#A-11037; RRID:AB_2534095 |
| Alexa Fluor 488 goat anti-rabbit IgG (H+L) | Invitrogen | Cat#A-11008; RRID:AB_143165 |
| CD3e eFluor 450; Anti-mouse [Clone: 145-2C11] | eBioscience | Cat#48-0031-82; RRID:AB_10735092 |
| CD4 eFluor 450; Anti-mouse [Clone: GK1.5] | eBioscience | Cat#48-0041-82; RRID:AB_10718983 |
| CD8a eFluor 450; Anti-mouse [Clone: 53-6.7] | eBioscience | Cat#48-0081-82; RRID:AB_1272198 |
| CD19 eFluor 450; Anti-mouse [Clone: eBio1D3(1D3)] | eBioscience | Cat#48-0193-82; RRID:AB_2734905 |
| B220 eFluor 450; Anti-mouse [Clone: RA3-6B2] | eBioscience | Cat#48-0452-82; RRID:AB_1548761 |
| Ter119 eFluor 450; Anti-mouse [Clone: TER-119] | eBioscience | Cat#48-5921-82; RRID:AB_1518808 |
| Gr1 eFluor 450; Anti-mouse [Clone: RB6-8C5] | eBioscience | Cat#48-5931-82; RRID:AB_1548788 |
| Sca-1 APC; Anti-mouse [Clone: D7] | eBioscience | Cat#17-5981-82; RRID:AB_469487 |
| c-Kit APC-Cy7; Anti-mouse [Clone: 2B8] | eBioscience | Cat#A15423; RRID:AB_2534436 |
| CD150 PE; Anti-mouse [Clone: TC15-12F12.2] | Biolegend | Cat#115904; RRID:AB_313683 |
| CD48 PE-Cy7; Anti-mouse [Clone: HM48-1] | Biolegend | Cat#103424; RRID:AB_2075049 |
| CD34 FITC; Anti-mouse [Clone: RAM34] | eBioscience | Cat#11-0341-82; RRID:AB_465021 |
| CD41 eFluor 450; Anti-mouse [Clone: eBioMWReg30 ] | eBioscience | Cat#48-0411-82; RRID:AB_1582238 |
| CD3e PE-Cy5; Anti-mouse [Clone: 145-2C11] | eBioscience | Cat#15-0031-82; RRID:AB_468690 |
| CD4 PE-Cy5; Anti-mouse [Clone: GK1.5] | eBioscience | Cat#15-0041-82; RRID:AB_468695 |
| CD8a PE-Cy5; Anti-mouse [Clone: 53-6.7] | eBioscience | Cat#15-0081-82; RRID:AB_468706 |
| CD19 PE-Cy5; Anti-mouse [Clone: eBio1D3(1D3)] | eBioscience | Cat#15-0193-82; RRID:AB_657672 |
| B220 PE-Cy5; Anti-mouse [Clone: RA3-6B2] | eBioscience | Cat#15-0452-82; RRID:AB_468755 |
| Ter119 PE-Cy5; Anti-mouse [Clone: TER-119] | eBioscience | Cat#15-5921-82; RRID:AB_468810 |
| Gr1 PE-Cy5; Anti-mouse [Clone: RB6-8C5] | eBioscience | Cat#15-5931-82; RRID:AB_468813 |
| CD3e Biotin; Anti-mouse [Clone: 145-2C11] | eBioscience | Cat#13-0031-82; RRID:AB_466319 |
| CD4 Biotin; Anti-mouse [Clone: GK1.5] | eBioscience | Cat#13-0041-82; RRID:AB_466325 |
| CD8a Biotin; Anti-mouse [Clone: 53-6.7] | eBioscience | Cat#13-0081-82; RRID:AB_466346 |
| CD19 Biotin; Anti-mouse [Clone: eBio1D3(1D3)] | eBioscience | Cat#13-0193-82; RRID:AB_657656 |
| B220 Biotin; Anti-mouse [Clone: RA3-6B2] | eBioscience | Cat#13-0452-82; RRID:AB_466449 |
| Ter119 Biotin; Anti-mouse [Clone: TER-119] | eBioscience | Cat#13-5921-82; RRID:AB_466797 |
| Gr1 Biotin; Anti-mouse [Clone: RB6-8C5] | eBioscience | Cat#13-5931-82; RRID:AB_466800 |
| Sca-1 Brilliant Violet 421; Anti-mouse [Clone: D7] | eBioscience | Cat#404-5981-82; RRID:AB_2929076 |
| c-Kit Brilliant Violet 605; Anti-mouse [Clone: 2B8] | Biolegend | Cat#105847; RRID:AB_2783047 |
| CD150 PE-Cy7; Anti-mouse [Clone: TC15-12F12.2] | Biolegend | Cat#115914; RRID:AB_439797 |
| CD48 APC-Cy7; Anti-mouse [Clone: HM48-1] | Biolegend | Cat#103432; RRID:AB_2561463 |
| CD41 FITC; Anti-mouse [Clone: eBioMWReg30 ] | eBioscience | Cat#11-0411-82; RRID:AB_763481 |
| CD45.1 PerCP-Cy5.5; Anti-mouse [Clone: A20] | eBioscience | Cat#A14794; RRID:AB_2534309 |
| CD45.2 BV510; Anti-mouse [Clone: 104] | BD Biosciences | Cat#740131; RRID:AB_2739888 |
| cKit PE; Anti-mouse [Clone: 104D2] | BioLegend | Cat#105807; RRID:AB_313216 |
| CD48 APC-eFluor 780; Anti-mouse [Clone: HM48-1] | eBioscience | Cat#47-0481-82; RRID:AB_2573962 |
| CD3e PE-Cy7; Anti-mouse [Clone: 145-2C11] | eBioscience | Cat#25-0031-82; RRID:AB_469572 |
| CD4 PE-Cy7; Anti-mouse [Clone: GK1.5] | eBioscience | Cat#25-0041-82; RRID:AB_469576 |
| CD8 PE-Cy7; Anti-mouse [Clone: 53-6.7] | eBioscience | Cat#A15385; RRID:AB_2534399 |
| B220 APC-eFluor 780; Anti-mouse [Clone: RA3-6B2] | eBioscience | Cat#47-0452-82; RRID:AB_1518810 |
| CD11b Alexa Fluor 488; Anti-mouse [Clone: M1/70] | eBioscience | Cat#53-0112-82; RRID:AB_469901 |
| CD41 PE; Anti-mouse [Clone: eBioMWReg30 ] | eBioscience | Cat#12-0411-82; RRID:AB_763485 |
| CD71 APC; Anti-mouse [Clone: R17217] | eBioscience | Cat#17-0711-82; RRID:AB_1834355 |
| CD45.2 APC-Cy7; Anti-mouse [Clone: 104] | eBioscience | Cat#47-0454-82; RRID:AB_1272175 |
| CD61 APC; Anti-mouse [Clone: 2C9.G3] | eBioscience | Cat#17-0611-82; RRID:AB_2848288 |
| B220 BV510; Anti-mouse [Clone: RA3-6B2] | BD Horizon | Cat#563103; RRID:AB_2738007 |
| CD11b PE-Cy7; Anti-mouse [Clone: M1/70] | eBioscience | Cat#25-0112-82; RRID:AB_469588 |
| CD11b eFluor 450; Anti-mouse [Clone: M1/70] | eBioscience | Cat#48-0112-82; RRID:AB_1582236 |
| Sca1 APC; Anti-mouse [Clone: E13-161.7] | BioLegend | Cat#122512; RRID:AB_756197 |
| c-kit APC-Cy7; Anti-mouse [Clone: ACK2] | BioLegend | Cat#135136; RRID:AB_2632809 |
| TotalSeq™-C Mouse Universal Cocktail, V1.0 | BioLegend | Cat#199903; RRID:AB_2924498 |
| TotalSeq™-C0098 anti-mouse CD135 [Clone: A2F10] | BioLegend | Cat#135321; RRID:AB_2832480 |
| TotalSeq™-C0857 anti-mouse CD34 [Clone: HM34] | BioLegend | Cat#128623; RRID:AB_2888791 |
| TotalSeq™-C0229 anti-mouse/rat CD62P [Clone: RMP-1] | BioLegend | Cat#148313; RRID:AB_2892302 |
| TotalSeq™-C0301 anti-mouse Hashtag 1 (Control) [Clone: M1/42; 30-F11] | BioLegend | Cat#155861; RRID:AB_155861 |
| TotalSeq™-C0302 anti-mouse Hashtag 2 (IC) [Clone: M1/42; 30-F11] | BioLegend | Cat#155863; RRID:AB_2800694 |
| Anti-ACSL4 | Santa Cruz Biotechnology | Cat#sc-365230; RRID:AB_10843105 |
| Anti ferritin light chain (FTL) | abcam | Cat#ab109373; RRID:AB_10862715 |
| Anti ferritin heavy chain (FTH1) | abcam | Cat#ab65080; RRID:AB_10564857 |
| Anti actin | abcam | Cat#ab3280; RRID:AB_303668 |
| Anti Tip60 for CUT&RUN | Cell Signaling Technology | Cat#12058S; RRID:AB_2797811 |
| IgG control for CUT&RUN | Cell Signaling Technology | Cat#2729S; RRID:AB_1031062 |
| Anti-Ncoa4 | Santa Cruz Biotechnology | Cat#sc-15984; RRID:AB_2151209 |
| Anti-Tip60 | Thermo Fisher | Cat#10827-1-AP; RRID:AB_2128431 |
| Chemicals, peptides, and recombinant proteins | ||
| Deferoxamine mesylate salt | Sigma | Cat#D9533-1G |
| Deferoxamine Mesylate | Calbiochem | Cat#25275 |
| Eltrombopag | Novartis | N/A |
| 10058-F4 | Selleck Chemicals | Cat#S7153 |
| TH1834 | Axon | Cat#2339 |
| SB 204990, ACLY inhibitor | Tocris | Cat#49-621-0R |
| Etomoxir | Sigma | Cat#E1905 |
| VPS34 | Reagency | Cat#RGNCY-0041/0042 |
| BODIPY 493/503 | Invitrogen | Cat#D3922 |
| BSA-arachidonate polyunsaturated fatty acid complex | Cayman Chemical | Cat#34931 |
| Diethylumbelliferyl phosphate | Sigma | Cat#D7692 |
| CD71-blocking antibody | Bio-Rad | Cat#MCA2396EL |
| Recombinant mouse SCF | R&D Systems | Cat#455-MC-050/CF; 455-MC-050 |
| Recombinant mouse TPO | R&D Systems | Cat#488-TO-025/CF; 488-TO-025 |
| Recombinant mouse IL-3 | R&D Systems | Cat#403-ML-050 |
| Recombinant mouse Flt3 Ligand | R&D Systems | Cat#427-FL-025 |
| Critical commercial assays | ||
| HSC007 methylcellulose media | R&D Systems | Cat#HSC007 |
| Trucount™ tubes | Becton Dickinson | Cat#663028 |
| Cytofix/Cytoperm buffer | Becton Dickinson | Cat#554714 |
| Lipi-Green | Dojindo | Cat#LD-02 |
| FeRhoNox-1 | Goryo Chemical | Cat#GC901 |
| MegaCult®-C medium | STEMCELL Technologies | Cat#4960 |
| Chromium Single Cell 3′ Reagent Kits | 10x Genomics | Cat#PN-1000268 |
| Chromium Next GEM Single Cell 5’ Reagent Kit v2 | 10x Genomics | Cat#PN-1000265 |
| Mouse Transferrin ELISA kit | Abcam | Cat#ab157724 |
| Mouse Ferritin (FTL) ELISA kit | Abcam | Cat#ab157713 |
| CUT&RUN Assay Kit | Cell Signaling Technology | Cat#86652 |
| Deposited data | ||
| scRNAseq of HSC with 48hours treatment with IC | This study | GSE157821 |
| CITE-seq of LSK cells from long-term intermittent treatment study | This study | GSE232022 |
| Single cell RNA-seq of HSPC isolated from young and old mice | Kowalczyk et al.153 | GEO: GSE59114 |
| Single cell RNA-seq of HSC isolated from young and old mice | Grover et al.91 | GEO: GSE70657 |
| Single cell RNA-seq of mouse bone marrow cells | Tabula Muris Consortium154 | GEO: GSE109774 |
| Single cell RNA-seq of human HSC isolated from young and old donors | Ainciburu et al.155 | GEO: GSE180298 |
| Single cell RNA-seq of activated versus quiescent mouse HSC | Fast et al.156 | GEO: GSE165844 |
| Single cell RNA-seq of activated versus label-retaining dormant mouse HSC | Cabezas-Wallscheid et al.157 | ArrayExpress: E-MTAB-4547 |
| Microarrays of mRNA composition from IRP1 and IRP2 immunoprecipitation | Sanchez et al.158 | GEO: GSE17096; GSE17097 |
| Expression profiling of Fbxl5-KO vs WT mouse HSC | Muto et al.66 | GEO: GSE93649 |
| ChIP-seq of Tip60 in mouse ESC | Ravens et al.159 | GEO: GSE69671 |
| Expression profiling of Tip60 KO vs WT mouse LSK | Numata et al.109 | GEO: GSE120705 |
| Expression profiling of c-Myc/N-Myc DKO vs WT mouse HSC | Laurenti et al.115 | GEO: GSE12538 |
| ChIP-seq of H2AZac in ESC | Hu et al.160 | GEO: GSE34483 |
| ChIP-seq of H2AZac in ESC | Ku et al.161 | GEO: GSE39237 |
| ChIP-seq of H4K5ac in ESC | Roadmap162 | GEO: GSE16256 |
| ChIP-seq of H4K8ac in ESC | Roadmap162 | GEO: GSE16256 |
| ChIP-seq of H4K12ac in ESC | Roadmap162 | GEO: GSE16256 |
| ChIP-seq of H4K16ac in ESC | Taylor et al.163 | GEO: GSE43103 |
| ChIP-seq of H3K4me1 in HSC | Lara-Astiaso et al.164 | GEO: GSE59636 |
| ChIP-seq of H3K4me1 in HPC7 cells | Org et al.165 | GEO: GSE47082 |
| ChIP-seq of H3K4me3 in HSC | Lara-Astiaso et al.164 | GEO: GSE59636 |
| ChIP-seq of H3K4me3 in LSK cells | Hasemann et al.166 | GEO: GSE43007 |
| ChIP-seq of H3K4me3 in HSC | Sun et al.167 | GEO: GSE47765 |
| ChIP-seq of H3K4me3 in LSK cells | Aranda-Orgilles et al.168 | GEO: GSE76055 |
| ChIP-seq of H3K36me3 in LSK cells | Adli et al.169 | GEO: GSE22075 |
| Experimental models: Cell lines | ||
| HPC-7 | Dr. Omar Abdel-Wahab, Memorial Sloan Kettering Cancer Center61 | RRID:CVCL_RB19 |
| Experimental models: Organisms/strains | ||
| C57/BL6 mouse | Jackson Laboratories | stock number: 000664 |
| Pepc/BoyJ mouse | Jackson Laboratories | stock number: 002014 |
| beta-actin-GFP mouse | Jackson Laboratories | strain number: 006567 |
| CAGGCre-ER™ mouse | Jackson Laboratories | stock number: 004682 |
| Tip60LoxP mouse | Drs. Susumu Kobayashi and Daniel Tenen (Harvard Medical School)109 | N/A |
| Vav-iCre mouse | Jackson Laboratories | Stock No. 008610 |
| Fth1 mouse | Jackson Laboratories | Stock number: 018063 |
| Acsl4 mouse | Dr. Andrew Greenberg(Tufts University)170 | N/A |
| Oligonucleotides | ||
| Primers | This study | Table S6 |
| TaqMan assays | This study | Table S6 |
| Tfrc smFISH probe | This study | Table S6 |
| pGFP-C-shLenti vector | OriGene | Cat#TR30021 |
| Short hairpin RNA targeting Acsl4 #3 | OriGene | Cat#TL502838C |
| Short hairpin RNA targeting Acsl4 #4 | OriGene | Cat#TL502838D |
| Software and algorithms | ||
| FlowJo V10.2 | Becton Dickinson | https://www.flowjo.com/; RRID:SCR_008520 |
| FISHquant v2 | Imbert et al.171 | https://fish-quant.github.io/ |
| MATLAB R2020b | MathWorks | RRID:SCR_001622 |
| ELDA: Extreme Limiting Dilution Analysis | Hu et al. 172 | https://bioinf.wehi.edu.au/software/elda/; RRID:SCR_018933 |
| Transcriptome Analysis Console 3.0 | Affymetrix | RRID:SCR_016519 |
| limma v3.54.0 | Ritchie et al.173 | DOI: 10.18129/B9.bioc.limma; RRID:SCR_010943 |
| NetworkAnalyst 3.0 | Zhou et al.174 | https://www.networkanalyst.ca/; RRID:SCR_016909 |
| Ingenuity Pathway Analysis | Qiagen | RRID:SCR_008653 |
| Cell Ranger v7.0.1 | 10x Genomics | RRID:SCR_017344 |
| Loupe Browser v6.4.0 | 10x Genomics | RRID:SCR_018555 |
| R v4.2.2 | R Core Team | https://www.R-project.org/; RRID:SCR_001905 |
| Seurat v4.3.0 | Satija et al.175 | https://satijalab.org/seurat/; RRID:SCR_007322 |
| escape v1.4.0 | Borcherding et al.176 | DOI: 10.18129/B9.bioc.escape |
| scVelo v0.2.5 | Bergen et al.177 | https://scvelo.readthedocs.io; RRID:SCR_018168 |
| velocyto.py v0.17.17 | La Manno et al.178 | https://velocyto.org/velocyto.py/; RRID:SCR_018167 |
| ImageJ 1.52r | Schneider et al.179 | https://imagej.nih.gov/ij/; RRID:SCR_003070 |
| CellProfiler v4.2.1 | Stirling et al.180 | https://cellprofiler.org/; RRID:SCR_007358 |
| Wave v2.6.0.31 | Agilent | RRID:SCR_014526 |
| SRA Toolkit 2.10.7 | The NCBI | https://hpc.nih.gov/apps/sratoolkit.html; RRID:SCR_024350 |
| Salmon 1.2.1 | Patro et al.181 | https://combine-lab.github.io/salmon/; RRID:SCR_017036 |
| DESeq2 1.28.0 | Love et al.182 | https://github.com/mikelove/DESeq2; RRID:SCR_015687 |
| tximeta 1.6.2 | Love et al.183 | https://github.com/mikelove/tximeta |
| BioRender | BioRender.com | RRID:SCR_018361 |