

Abstract
Endogenous electrophiles, ionizing and non-ionizing radiation, and hazardous chemicals present in the environment and diet can damage DNA by forming covalent adducts. DNA adducts can form in critical cancer driver genes, and if not repaired, may induce mutations during cell division potentially leading to the onset of cancer. The detection and quantification of specific DNA adducts is one of the first steps in studying their role in carcinogenesis, the physiological conditions that lead to their production, and the risk assessment of exposure to specific genotoxic chemicals. Hundreds of different DNA adducts have been reported in the literature and there is a critical need to establish a DNA adduct mass spectral database to facilitate the detection of previously observed DNA adducts and characterize newly discovered DNA adducts. We have collected synthetic DNA adduct standards from the research community, acquired MSn (n=2,3) fragmentation spectra using Orbitrap and Quadrupole-Time-of-Flight (Q-TOF) MS instrumentation, processed the spectral data and incorporated it into the MassBank of North America (MoNA) database, and created a DNA adduct portal website (https://sites.google.com/umn.edu/dnaadductportal) to serve as a central location for the DNA adduct mass spectra and metadata, including the spectral database downloadable in different formats. This spectral library should prove to be a valuable resource for the DNA adductomics community, accelerating research, and improving our understanding of the role of DNA adducts in disease.
Graphical Abstract

INTRODUCTION
DNA damage in the form of covalent DNA modifications occurs through exposure to environmental and dietary genotoxicants, ionizing and non-ionizing radiation (i.e., exogenously-derived DNA adducts), and from endogenous electrophiles (i.e., endogenously-derived DNA adducts) such as those produced by oxidative stress.1–4 The investigation of this DNA damage is typically done through the analysis of hydrolyzed DNA with the detection and characterization of modified 2’-deoxyribonucleosides or, less commonly, nucleobases and 2’-deoxyribonucleotides, which are commonly referred to as DNA adducts.5 Exogenous DNA adducts usually occur at very low levels, ranging from ~1 adduct per 108 to 1 per 1010 unmodified 2’-deoxyribonucleotides. Identifying DNA adducts is among the first steps in the risk assessment of harmful chemicals and they can serve as dosimeters of exposure to these genotoxicants. For example, DNA adducts of aflatoxin B1 (AFB 1) and aristolochic acid I (AA-I) and their characteristic mutational signatures have been used to firmly establish their causative roles in liver and renal cancer, respectively.6, 7 DNA adducts can also serve as biomarkers to associate gene polymorphisms with susceptibility to cancer risk,8, 9 to measure levels of environmental exposures of humans10, 11 and marine species,12 and to assess the efficacy of chemoprevention protocols and chemotherapeutic agents in precision medicine.13–15
Liquid chromatography-electrospray ionization tandem mass spectrometry (LC-ESI-MS2) analysis has become the primary analytical tool for studying DNA adducts, and targeted methods have successfully measured different types of DNA adducts formed from a wide range of chemicals present in the environment, including tobacco smoke (e.g. 4-(methylnitrosamino)-1-(3-pyridyl)-1-butanone, NNK),16 well-done cooked meats (e.g. 2-amino-1-methyl-6-phenylimidazo[4,5-b]pyridine, PhIP),17 and alcohol consumption (acetaldehyde),18 or from endogenously produced electrophiles (e.g. malondialdehyde).5 Recently, advancements in high-resolution mass spectrometry (HRMS) instrumentation has empowered the untargeted analysis of DNA damage, commonly referred to as “DNA adductomics”, for the simultaneous detection of expected and unexpected or unknown DNA adducts of exogenous genotoxicants, endogenous electrophiles, and chemotherapeutic drugs.19, 20 Both data-dependent acquisition (DDA)21 and data-independent acquisition (DIA)22 methodologies have been employed;23–26 however, their analytical power has been limited by the lack of a mass spectral database for the characterization and identification of DNA adducts.27
Spectral libraries are commonly used in LC-MS/MS analyses to identify metabolites, natural products, and other small molecules28–30 by matching experimental data with library spectra, typically allowing for the identification of large numbers of compounds. Molecular identification by LC-MS analysis in increasing order of confidence is: a) molecular formula determination by precursor mass measurement, b) molecular formula determination by precursor mass and isotopic peak measurement, c) matching of precursor mass and fragmentation spectra using a reference mass spectral library, and d) direct comparison to a reference standard’s chromatographic retention time and MS2 fragmentation pattern.31, 32 Methods (a) and (b) produce low confidence identification because the mass and isotopic profile of a particular chemical compound (and therefore the computed molecular formula) can be shared by many other compounds. For example, glucose (C6H12O6, 180.06338 Da) shares a chemical formula with 22 structural analogues found in the Human Metabolome Database (HMDB)33 and deoxyguanosine (C10H13N5O4, 267.09755) shares an exact mass (± 5 ppm) with 1400 compounds in the ChemSpider database (https://www.chemspider.com/), illustrating the need for synthetic standards and a spectral library for confident analyte identification. Method (d) produces the highest confidence identification but can be very expensive and impractical for identifying many analytes. Therefore, using a spectral library (method c) is a powerful and practical approach for the high confidence identification of large numbers of analytes when a suitable high quality mass spectral database of the analytes is available. For example, well-known mass spectral reference libraries which have been used for small molecule and metabolomics analysis for several years with great success include the National Institutes of Standards (NIST) 2020 database (https://chemdata.nist.gov/), MassBank,34 MassBank of North America (MoNA) (https://mona.fiehnlab.ucdavis.edu), mzCloud (Thermo Scientific, https://www.mzcloud.org) and the HMDB33 (https://www.hmdb.ca).
DNA adducts as a class of compounds are not included in metabolomics, natural products, or exogenous compound exposure databases.35 HMDB contains references to a small number of DNA adducts, but their tandem mass spectra are mostly theoretical.33 Also, La Barbera and coworkers have assembled an extensive database of reported DNA adducts through an exhaustive literature search and accessible at https://gitlab.com/nexs-metabolomics/projects/dna_adductomics_database.24, 36 Included in the database are structures (.mol and .cdxml), molecular formulas, masses, origin sources, references, IUPAC names, SMILES (Simplified Molecular Input Line Entry System), InChI, and InChIKey structural designations. Also, included is mass spectral fragmentation data of 15 DNA adducts derived from reference standards and a discussion of the use of CFM-ID37 for in silico fragmentation spectra prediction.
A comprehensive high-quality reference spectral library of DNA adducts is needed for the confident detection of known DNA adducts and to assist in the characterization of unknown adducts. Therefore, we have assembled a DNA adduct reference spectral library27 with 318 entries containing comprehensive sets of MS2 and MS3 spectra for 280 analytes. We are making it publicly available at a central location at https://sites.google.com/umn.edu/dnaadductportal website is dynamically expandable as more spectra of the ~500 known DNA adducts are collected,24, 36 and represents the most comprehensive collection of DNA adduct fragmentation spectra available to date. To build this reference spectral library, DNA adduct standards were kindly provided by 36 collaborators from seven countries and 22 institutions (Table 1). We collected high-resolution accurate mass MSn (n=2, 3) fragmentation spectra using two common high-resolution instrumentation platforms (Orbitrap and Q-TOF) at multiple collision energies and different collision-induced dissociation (CID) types; beam-type on the Orbitrap (HCD) and Q-TOF instruments and ion-trap type on the Orbitrap instrument. MS3 fragment spectra were collected on the Orbitrap instrument for abundant MS2 product ions at multiple collision energies, while MS3 data collection was not possible with the Q-TOF instrument. Ionization of modified 2’-deoxyribonucleoside adducts produces abundant levels of the corresponding aglycone DNA adducts through loss of 2’-deoxyribose (2’-dR) by in-source fragmentation and was used to acquire mass spectra for 135 modified nucleobases to expand the database beyond the modified nucleosides contributed as synthetic standards. The use of the fragmentation spectra of in-source-produced protonated modified nucleobases as surrogates for synthetically-produced protonated modified nucleobases is discussed in the In-source Fragmentation and Modified Nucleobase Spectra portion of the Results and Discussion section. All the mass spectra were processed as discussed in the Library Creation section using a custom-made R workflow which is available at https://github.com/scottwalmsley/DNADB-Builder. The resulting data were uploaded to the MoNA on-line database. The spectra are also available in the .MSP and .db (Thermo Scientific, mzVault) formats at: https://sites.google.com/umn.edu/dnaadductportal.
Table 1. List of Contributors.
Name of the contributor, their residing institution and country of the institution.
| Contributor | Institute | Country |
|---|---|---|
| Roberta Andreoli | University of Parma | Italy |
| Silvia Balbo | University of Minnesota | USA |
| Peter Dedon | Massachusetts Institute of Technology | USA |
| Yong-Lai Feng | Health Canada | Canada |
| Stephen Hecht | University of Minnesota | USA |
| Kristin Herrmann | German Federal Institute for Risk Assessment | Germany |
| Bernhard Monien | German Federal Institute for Risk Assessment | Germany |
| Uta Herfurth | German Federal Institute for Risk Assessment | Germany |
| Fabian Schumacher | German Institute of Human Nutrition | Germany |
| Robert Kanaly | Yokohama City University | Japan |
| Hiroshi Kasai | University of Occupational and Environmental Health | Japan |
| Kazuaki Kawai | University of Occupational and Environmental Health | Japan |
| Lawrence Marnett | Vanderbilt University | USA |
| Marcus Cooke | University of South Florida | USA |
| Daniel Gackowski | Nicolaus Copernicus University | Poland |
| Ryszard Olinski | Nicolaus Copernicus University | Poland |
| Eleanor Rogan | University of Nebraska | USA |
| Gabriele Sabbioni | University of Munich | Germany |
| Yuji Iwashita | Hamamatsu University | Japan |
| Haruhiko Sugimura | Hamamatsu University | Japan |
| Michael Stone | Vanderbilt University | USA |
| Carmello Rizzo | Vanderbilt University | USA |
| John Termini | City of Hope Cancer Center | USA |
| Yukari Totsuka | National Cancer Center | Japan |
| Natalia Tretyakova | University of Minnesota | USA |
| Jingshu Guo. | University of Minnesota | USA |
| Robert Turesky | University of Minnesota | USA |
| Lynn Vanhaecke | Ghent University, Belgium | Belgium |
| Jean Cadet | Universite de Sherbrooke | Canada |
| J. Richard Wagner | Universite de Sherbrooke | Canada |
| Yinsheng Wang | University of California, Riverside | USA |
| Miral Dizdaroglu | National Institute of Standards and Technology | USA |
| Arthur Grollman | Stony Brook University | USA |
| Francis Johnson | Stony Brook University | USA |
| Radha Bonala | Stony Brook University | USA |
| Ian Blair | University of Pennsylvania | USA |
EXPERIMENTAL SECTION
Synthetic Standards
Adduct standards (1–10 μg), prepared by synthetic or biomimetic reactions, were dissolved in 50% water and 50% acetonitrile (LC-MS grade) (see below for concentrations). Each adduct is listed in Table S1 with their common name, common acronym, structure, data file name (for internal use), source, contributor(s), contributor institution, IUPAC name, chemical formula, mass (Da), M+H+ m/z, SMILES, origin (endogenous electrophile, exogenous genotoxicant, etc.), type (deoxynucleoside, nucleobase, etc.), and corresponding literature reference when provided. The purity of the synthetic standards was reported by a subset of contributors, and that information is included in Table S1. The names, simple names, and DNA adduct numbers from the database of La Barbera et al.36 have been included to allow for easy cross referencing.
High-Resolution Mass Spectrometry
Orbitrap MSn spectra were acquired at the University of Minnesota using Orbitrap Fusion and Lumos instruments and a Nanoflex nanoESI source with a Dionex RSLCnano UPLC system (Thermo Scientific, Waltham, MA). The data acquisition was achieved using Xcalibur Data Acquisition Software (v. 4.3) with flow injection analysis (FIA) by injecting 1 μL of solution (typically at 0.1 ng/μL – a concentration that is >50-fold above background noise signals) into a 0.5 μL/min flow of 0.1% (v/v) formic acid in 50% water, 50% acetonitrile with positive ion electrospray ionization at 2.2 kV and an ion transfer tube temperature of 300 °C using a fused silica emitter (20 μL ID, 10.5 cm, 10 μm orifice) (New Objective, Littleton, MA). MS, MS2, and MS3 spectra were acquired at multiple collision energies by both CID (i.e., ion trap fragmentation) and HCD (i.e., multipole fragmentation) for each sample injection. Spectra were acquired with selected ion monitoring (SIM, 5 m/z quadrupole isolation) to confirm the parent mass of the analyte and to control for the presence of co-isolated ions in the fragmentation events to avoid “contamination” of the MS2 fragmentation spectra. The HCD-MS2 and CID-MS2 spectra were acquired under collision energies of 0–100% and 0–50 % in 10% increments, respectively. The MS3 HCD spectra were collected at CEs of 20, 40, 60, 80 % of the product ions that had abundances ≥ 50% upon MS2 HCD fragmentation at CEs of 30 and 60 %. The MS3 CID spectra were collected at CEs of 15, 25, 35, 45 % for the product ions that had abundances ≥50 % abundance with MS2 CID fragmentation of 30%. All the spectra were acquired with a resolution setting of 120000 and isolation windows of 1.6 m/z for the MS2 data and 1.6 (MS2) and 2.0 m/z (MS3) for the MS3 data. 2’-Deoxynucleoside adducts were injected a second time to acquire fragmentation spectra for their corresponding base adducts by targeting for fragmentation their aglycone ion signals which results from in-source fragmentation.
Q-TOF MS and MS2 spectra were acquired in the Forensic and Analytical Toxicology Facility (FATF) at Florida International University using a Liquid Chromatography (LC) system with a 1290 Infinity autosampler and binary pump coupled to a 6530 Accurate-Mass Quadrupole Time-of-Flight (Q-TOF) mass spectrometer with dual spray JetStream electrospray ionization (ESI) source (Agilent Technologies, Santa Clara, CA). The data was acquired by FIA using 5 μL of the sample with concentrations in the range of 1–40 ng/μL, to obtain a useful signal of 1000 counts or higher. The binary pump flow was 50% acetonitrile in water with 0.1% formic acid at a 200 μL/min flow rate. Three replicates were performed for the samples in positive ionization mode. The Q-TOF was maintained at a gas (nitrogen) temperature of 325 °C, drying gas flow at 11 L min−1, the nebulizer was 40 psi, sheath gas temperature at 325 °C and sheath gas flow at 10 L min−1, the capillary voltage was 3500 V, nozzle voltage at 500 V, fragmentor voltage of 80 V, skimmer voltage 65 V, octopole RF at 750 V and a full scan mass range of 100–1000 amu. Mass calibration was performed using the autotune method in both positive and negative mode before analyses were conducted. To account for mass accuracy correction a reference ion solution (121.0509 m/z and 922.0098 m/z) was used during the entire run. In addition, a reference standard of 8-PhIP-dG with a concentration of 1 ng/μL was injected prior to analyses of each batch to check for instrument conditions and mass accuracy. The MS/MS spectra were obtained at CE 0, 10, 20, 40, and 60 V. Data acquisition was achieved using MassHunter Data Acquisition Software v B.09.00 and data analysis was performed using MassHunter Software Qualitative Analysis (v B.07.00). The Q-TOF-MS data was acquired using a data-dependent approach where the precursor ion of interest was targeted for MS2 fragmentation at multiple CEs when its abundance was greater than 200 counts. This abundance threshold was selected to ensure accurate and useful spectra acquisition for building the spectral library. The criteria used to validate the data was that the precursor ion and product ions must be within a mass accuracy of ± 5 ppm, and the abundance of the base peak must be 1000 counts or greater.
Library Creation and Dissemination
The data collected for each collision type and energy consists of multiple nearly identical spectra and needs to be consolidated into a single “consensus” spectrum. A custom R package called DNADB-Builder was created and used to generate consensus spectra for the Orbitrap and Q-TOF MSn data following the general processing workflow shown in Figure S1. A description of the workflow for the library creation is given in the supplementary materials. Assembled consensus MS2 and MS3 spectra were written into the MassBank data format, saved as an ‘.MSP’ file,34 and uploaded to the Mass Bank of North America (MoNA) mass spectra repository. This data format is available for download from MoNA or from our DNA Adduct Portal website (https://sites.google.com/umn.edu/dnaadductportal). Information from the data submitted to MoNA was automatically propagated to various on-line repositories including the Human Metabolomics Database33 and PubChem.41
RESULTS AND DISCUSSION
Spectral library assembly
A total of 198 DNA adducts were contributed by project participants, and HR MS2 and MS3 spectra were acquired for 180 precursor and 135 corresponding aglycone molecules (see Table S1). Spectra for several contributed DNA adducts were not included due to lack of purity or other difficulties in acquiring high quality data. The spectral library contains Q-TOF MS2 and Orbitrap MS2 and MS3 HCD and CID consensus spectra, all done with a wide range of collision energies. The Orbitrap HCD collision energy parameter is in units of percentages. The HCD fragmentation is beam-type collision induced dissociation analogous to that of triple quadrupole and Q-TOF instrumentation, and therefore has an acceleration potential (eV) associated with it which could be directly compared to the Q-TOF data. Unfortunately, setting the HCD fragmentation using eV units was not possible at the time data collection, although it is possible using the more recent data collection software (Xcalibur 4.5 and later). The authors believe the reason the vendor used a percentage value for HCD was an attempt to relate it to CID fragmentation for historical reasons, and we do not know how the eV value is converted to a percentage value. Figure 1A has both the percentage and the corresponding eV units for the 8-(4-ABP)-dG data collection.
Figure 1. Comparison of Orbitrap HCD, Orbitrap CID and Q-TOF MS2 spectra.

The Orbitrap HCD collision energies are typically reported in units of percentages to relate the CID and HCD collision energies to each other for Thermo Scientific Orbitrap instrumentation. The collision energies in electron-volt (eV) units are listed in parentheses for the HCD MS2 spectra for comparison with the Q-TOF MS2 spectra.
Consensus spectra was generated using the DNADB-Builder package by averaging multiple individual spectra product ions and intensities, with m/z value alignment to remove non-reproducible noise and artifact peaks.40 The purity of the acquired product ion spectra was assessed by manual visual inspection of the precursor signal within the 1.6 Da fragmentation isolation window of the selected ion monitoring spectra to ensure the dominant signal was within a ±3 ppm m/z window. Each consensus spectrum for a given chemical structure was annotated using the MS-FINDER algorithm with the hydrogen rearrangement rules. These assignments are theoretical, but manual evaluations of several product ion annotations indicated they are reasonable. 761 unique fragment ions were annotated across all CE and collision types (CID, HCD, and Q-TOF) and a total of 6385 fragment ions were assigned across 3306 curated consensus spectra. Figure 1 contains representative CID, HCD and Q-TOF spectra collected and annotated for N-(2′-deoxyguanosin-8-yl)-4-aminobiphenyl (8–4-ABP-dG, [C22H22N6O4]H+, 435.1775 m/z). The spectra contain a product ion (8–4-ABP-dG, [C17H15N6O]H+, 319.1302 m/z) corresponding to a neutral loss of 2’-dR (−116.0473 Da, [M+H2-dR]+), the dominant mass loss for nearly all 2’-deoxyribonucleoside DNA adducts, with a relative intensity which is highly variable with collision energy. Figure 1A illustrates how the variability of the spectra as the Orbitrap HCD fragmentation increases. The 10% (13.9eV) HCD spectrum has significant residual precursor ion (435.1773 m/z) with the 2’-dR neutral loss ion (319.130 m/z) dominating the spectrum. The 20% (21.7eV) HCD spectrum has no residual precursor mass and consists almost exclusively of the m/z 319.1301 product ion and the same for the 50% (41.5 eV) HCD spectrum with a small amount of lower mass product ions being formed. In contrast, as shown in Figure 1B the 10% CID spectrum is dominated by residual precursor mass (435.1773 m/z) with very little 319.1301 m/z ion formed. The 20% CID spectrum has significant residual precursor ion signal with a nearly equal amount of 319.1301 m/z ion formed, whereas at 50% CID the spectrum is entirely the 319.1301 m/z ion. Figure 1C illustrates how the product ion evolves as the collision energy increases using the Q-TOF instrument. The 10eV spectrum is dominated by neutral loss of 2’-dR (319.1301 m/z) with a small amount of residual precursor ion (435.1773 m/z), whereas the 20eV spectrum is entirely 319.1301 m/z. The 60eV spectrum is very complex with significant fragmentation to multiple product ions.
In-source Fragmentation and Modified Nucleobase Spectra
Highly variable amounts of “in-source” neutral loss of 2’-dR occurs after ionization of modified 2’-deoxyribonucleosides and prior to mass analysis. This phenomenon was used to generate fragmentation spectra for the corresponding modified nucleobase adducts which were not available as synthetic standards. The MS2 spectra acquired for “in-source-produced” modified nucleobases is anticipated to be similar to that produced from their direct injection as synthetic standards. Additionally, it is expected that their MS2 spectra will be similar to the MS3 spectra produced from the [M+H2-dR]+ (aglycone) ion resulting from the MS2 fragmentation of the corresponding modified 2’-deoxyribonucleosides. Figure 2 shows this comparison for 1,N6-benzoquinone-adenine (A) and 1,N6-benzoquinone-deoxyadenosine (B, C) and is an example where the three spectra are essentially interchangeable.
Figure 2. Comparison of product ion spectra under different formation mechanisms.
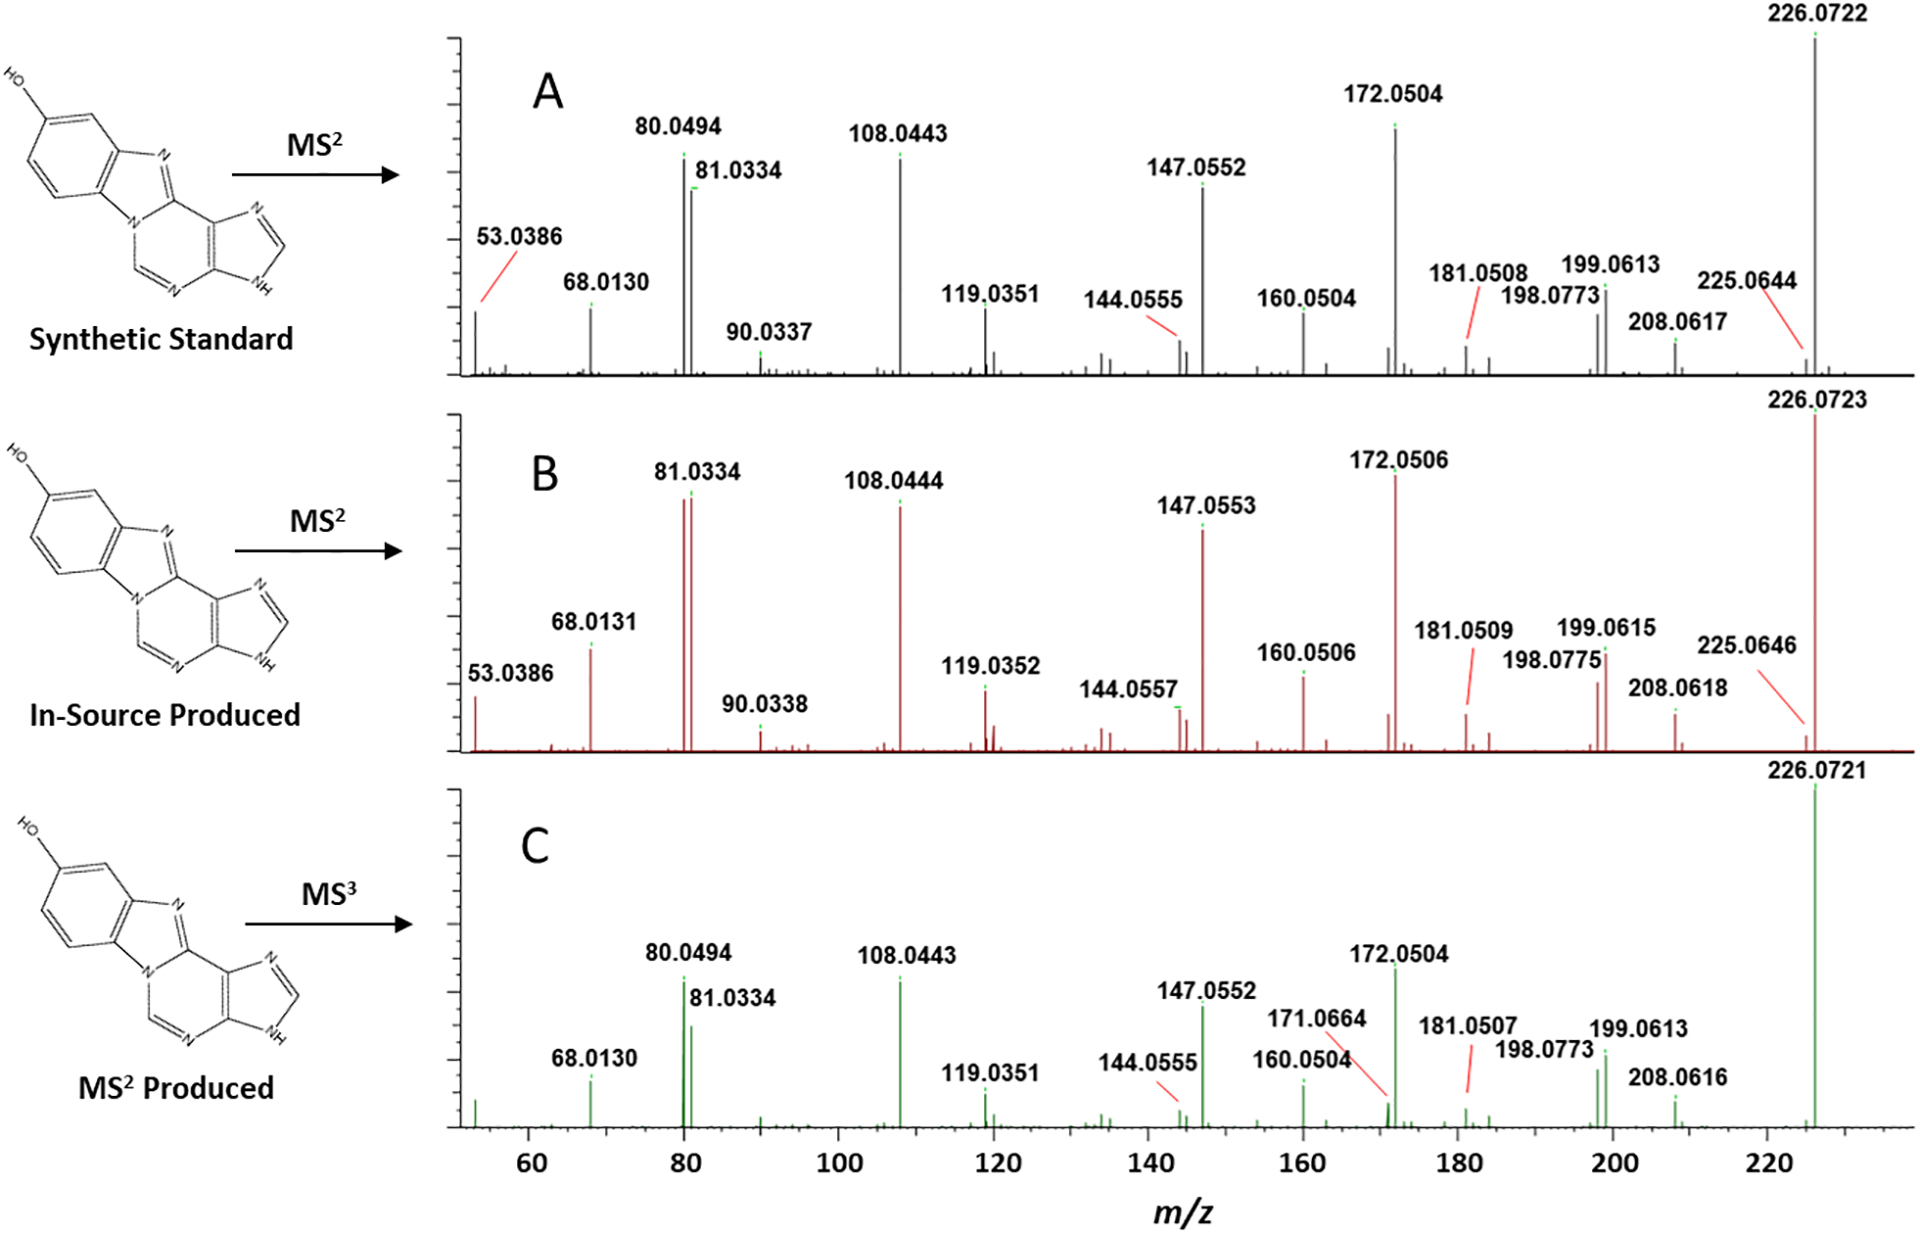
(A) MS2 spectrum of the protonated 1,N6-benzoquinone-adenine ion using the synthetic standard. (B) MS2 spectrum of protonated 1,N6-benzoquinone-adenine ion produced upon in-source fragmentation of the protonated 1,N6-benzoquinone-deoxyadenosine ion. (C) Spectrum of protonated 1,N6-benzoquinone-adenine ion (MS3) produced upon MS2 fragmentation of the protonated 1,N6-benzoquinone-deoxyadenosine ion.
Detection/Characterization of Unknown DNA Adducts
DNA adducts are a diverse set of small molecules each containing 2’-dR and/or nucleobase structures, with a wide range of nucleobase modifications, including hetero-bonds, ring structures, and numbers of degrees of unsaturation, with sizes ranging from simple oxidations to the non-ribosomal peptide polyketide colibactin-crosslinking of two adenines.42 Common fragmentation features of DNA adducts include the neutral losses of 2’-dR, which is nearly universal for modified 2’-deoxyribonucleosides, and neutral losses of nucleobases and formation of protonated nucleobases which are common for MS2 fragmentations of modified nucleobases and MS3 and higher energy MS2 fragmentations of modified nucleosides. These DNA fragmentation characteristics, especially the neutral loss of 2’-dR, have been used to detect previously unknown adducts using “discovery” DNA adductomic analysis.20, 25, 26, 43 The observation of these characteristic features can identify putative DNA adducts and determine their forms (modified nucleoside or modified nucleobase), often the identities of the modified base (A,G,T, or C) if the neutral loss of the base or appearance of the base is observed, and the molecular formula (especially for smaller adducts) of the modification. However, the structure of the modifications and their positions on the base typically cannot be determined as structural determination using mass spectral data for any small molecule is very challenging.38, 44, 45 For example, treating 1,N2-8-hydroxypropano-deoxyguanosine (1,N2-8-OH-PdG, entry 220 in Table S1) mass spectra (MS1, MS2 and MS3) as collected ion signal in a DNA screening assay, the spectra would indicate it is a DNA adduct (neutral loss of dR in MS2 spectrum) of 2’-deoxyguanosine (appearance of guanine in the MS3 spectrum) with the molecular formula of the modification (parent mass from MS1 - mass of deoxyguanosine) of C3H4O, but the structure of the modification or its position on the nucleobase would be unknown.
The database spectra can be used as a DNA adduct “training set” for spectra-interpreting machine learning tools used to structurally characterize analytes through their mass spectra.37, 46, 47 Additionally, a search of the spectral database for common fragment ions (in addition to the relatively common protonated nucleobase ions) and neutral losses (beyond the near-universal 2’-dR and common nucleobase losses) can be used to add additional criteria for DNA adduct discovery and structural identification. The database can also be used in concert with molecular networking analyses48 as has been done recently for modified RNA nucleoside analysis.49
DNA adduct portal website
A website (https://sites.google.com/umn.edu/dnaadductportal) was created to serve as a convenient location for the mass spectral database where updated versions can be easily accessed as more DNA adducts spectra are added. It contains the downloadable version of the mass spectral library in the .MSP format which provides the greatest amount of flexibility in usage across a number of different search tools (Figure 3), and can be directly used with a number of open source tools and commercial software packages including NIST MS Search and MS-DIAL.45, 50 This .MSP file can be converted to the NIST proprietary format with the free NIST Lib2NIST program (https://chemdata.nist.gov/mass-spc/ms-search/Library_conversion_tool.html) for use in Thermo Scientific mzVault database, and can be converted to the MassBank library format with submitted data propagated forward to HMDB and PubChem. The library is also available in the “.db” format of mzVault and allows manual inspection of the spectral library within the mzVault application or for use with CD or FreeStyle with Thermo Scientific data.
Figure 3.

(A) Library formats, (B) Library usages
Use of DNA adduct spectral library
The DNA adduct spectral library provided in the .MSP and .db formats serves as a flexible format for a wide variety of both commercial and free spectral library search tools, including molecular spectrum networking with GNPS51 to aid in unknown identification. Examples of how it can be used include:
searching the library directly with the NIST MS Search algorithm using the following steps: a) download the .MSP file, b) using Lib2NIST, convert the file to the NIST proprietary format, c) select the library in the MS-Search parameters window, d) import a sample .MGF spectra file, e) perform the search and manually review the results, as illustrated in Figure 4 for DNA isolated from human bladder cancer cells analyzed by Orbitrap MS.
automated library searching with commercially available CD using the following steps, a) download the Thermo Scientific mzVault formatted database (.db) file, b) within CD import the library into “Spectral Libraries” within “List & Libraries”, c) add the “Search mzVault” node into the workflow, d) select the .db file within the node parameters.
automated library searching with freeware MS-DIAL using the following procedure a) download the .MSP formatted database, b) select the library for use in the “Search Library” tab during the experiment setup. Additionally, all library entries can be viewed directly in the Mass Bank of North America’s (MoNA) website at https://mona.fiehnlab.ucdavis.edu .
automated searching using Agilent’s MassHunter software using the following steps: a) create an Agilent library using the Personal Compound Database and Library (PCDL) Manager by converting structures to .mol files, incorporate database entries into the Agilent library using the .mol structures, chemical formulas, monoisotopic masses, IUPAC names, CAS registry numbers and retention times (min), and add the spectra for each compounds acquired at the different collision energies, b) upload Agilent database to the Agilent qualitative software, c) search using the “Search Database” function.52
Figure 4. Representative search of spectra from the LC-MS3 Orbitrap analysis of hydrolyzed DNA from human bladder cancer cells against the DNA adduct database using the NIST MS Search algorithm with manual review.

(Top spectrum, red) DNA sample from human bladder cancer cells (Bottom spectrum, blue) 8-(4-ABP)-dG library entry.
CONCLUSION
Here we describe the creation of the most comprehensive DNA adduct mass spectrometry spectral library to date, for use by the research community. Data were collected from high-resolution Orbitrap and Q-TOF instruments. Mass spectra from 156 DNA adducts were curated and submitted to the Mass Bank of North America (MoNA), with future efforts to incorporate the Orbitrap data into the mzCloud database with the assistance of Thermo Fisher Scientific Inc. Our custom R package called DNADB-Builder was used to create consensus fragmentation spectra, and is available in the https://github.com/scottwalmsley/DNADB-Builder online repository, along with an explanation of the parameter used to generate the spectral library. The mass spectral and DNA adduct information described here is summarized in the DNA adduct portal website (https://sites.google.com/umn.edu/dnaadductportal), which acts as a central location for the mass spectral data and accompanying metadata. This website will be maintained with additional features enabling the study of the DNA adductome being added as the field evolves. We encourage researchers to actively support the expansion of the library and will provide a mechanism for submission of new standards for adding new DNA adducts into the spectral library. We will consider including submitted spectra into the library through consultation with submitters. This library includes spectra for 2’-deoxynucleoside and nucleobase DNA adducts, the latter as both submitted synthetic standards and indirectly through the acquisition of “in-source” fragmentation spectra and MS3 fragmentation spectra of 2’-deoxynucleoside adducts, and a limited number of RNA adducts. This assures the spectral library is very versatile allowing for its use in analyses which focus both on DNA adducts as modified 2’-deoxynucleosides19, 20 and as modified nucleobases,53 and can be used in the analysis of RNA adducts.54
Supplementary Material
ACKNOWLEDGEMENTS
The authors thank all the contributors listed in Table 1 for their kind contributions to this project. Orbitrap mass spectrometry data were acquired in the Analytical Biochemistry Shared Resource of the Masonic Cancer Center, University of Minnesota. Q-TOF mass spectrometry data were acquired at the Forensic and Analytical Toxicology Facility in the Global Forensic and Justice Center at Florida International University.
FUNDING
This project was funded by NIH National institute of Environmental Health Sciences grants R03ES031188 and R01ES030765. The Analytical Biochemistry Shared Resource of the Masonic Cancer Center is funded in part by the Cancer Center Support Grant P30CA077598. Support for PWV was provided by R50CA211256. MSC acknowledges support from the National Institute of Environmental Health Sciences of the National Institutes of Health under award number R01ES030557.
Footnotes
SUPPORTING INFORMATION.
Table listing all the analytes included in the mass spectral database and associated information.
Detailed description of how the mass spectral library was created.
REFERENCES
- (1).Dipple A DNA adducts of chemical carcinogens. Carcinogenesis 1995, 16, 437–441. [DOI] [PubMed] [Google Scholar]
- (2).Wiencke JK DNA adduct burden and tobacco carcinogenesis. Oncogene 2002, 21 (48), 7376–7391. [DOI] [PubMed] [Google Scholar]
- (3).Poirier MC Linking DNA adduct formation and human cancer risk in chemical carcinogenesis. Environ Mol Mutagen 2016, 57 (7), 499–507. DOI: 10.1002/em.22030. [DOI] [PubMed] [Google Scholar]
- (4).Cooke MS; Evans MD; Dizdaroglu M; Lunec J Oxidative DNA damage: mechanisms, mutation, and disease. FASEB J 2003, 17 (10), 1195–1214. DOI: 10.1096/fj.02-0752rev. [DOI] [PubMed] [Google Scholar]
- (5).Tretyakova N; Villalta PW; Kotapati S Mass spectrometry of structurally modified DNA. Chem Rev 2013, 113 (4), 2395–2436. DOI: 10.1021/cr300391r. [DOI] [PMC free article] [PubMed] [Google Scholar]
- (6).Kensler TW; Roebuck BD; Wogan GN; Groopman JD Aflatoxin: a 50-year odyssey of mechanistic and translational toxicology. Toxicol Sci 2011, 120 Suppl 1 (Suppl 1), S28–48. DOI: 10.1093/toxsci/kfq283. [DOI] [PMC free article] [PubMed] [Google Scholar]
- (7).Grollman AP Aristolochic acid nephropathy: Harbinger of a global iatrogenic disease. Environ Mol Mutagen 2013, 54 (1), 1–7. DOI: 10.1002/em.21756. [DOI] [PubMed] [Google Scholar]
- (8).Simonds NI; Ghazarian AA; Pimentel CB; Schully SD; Ellison GL; Gillanders EM; Mechanic LE Review of the Gene-Environment Interaction Literature in Cancer: What Do We Know? Genet Epidemiol 2016, 40 (5), 356–365. DOI: 10.1002/gepi.21967. [DOI] [PMC free article] [PubMed] [Google Scholar]
- (9).Gamboa-Loira B; Lopez-Carrillo L; Mar-Sanchez Y; Stern D; Cebrian ME Epidemiologic evidence of exposure to polycyclic aromatic hydrocarbons and breast cancer: A systematic review and meta-analysis. Chemosphere 2022, 290, 133237. DOI: 10.1016/j.chemosphere.2021.133237. [DOI] [PubMed] [Google Scholar]
- (10).Hwa Yun B; Guo J; Bellamri M; Turesky RJ DNA adducts: Formation, biological effects, and new biospecimens for mass spectrometric measurements in humans. Mass Spectrom Rev 2020, 39 (1–2), 55–82. DOI: 10.1002/mas.21570. [DOI] [PMC free article] [PubMed] [Google Scholar]
- (11).Phillips DH DNA adducts as markers of exposure and risk. Mutat Res 2005, 577 (1–2), 284–292. DOI: 10.1016/j.mrfmmm.2005.03.008. [DOI] [PubMed] [Google Scholar]
- (12).Martella G; Gorokhova E; Sousa PFM; Tretyakova NY; Sundelin B; Motwani HV DNA Adductomics for the Biological Effect Assessment of Contaminant Exposure in Marine Sediments. Environ Sci Technol 2023, 57 (29), 10591–10603. DOI: 10.1021/acs.est.3c00499. [DOI] [PMC free article] [PubMed] [Google Scholar]
- (13).Guidolin V; Li Y; Jacobs FC; MacMillan ML; Villalta PW; Hecht SS; Balbo S Characterization and quantitation of busulfan DNA adducts in the blood of patients receiving busulfan therapy. Mol Ther Oncolytics 2023, 28, 197–210. DOI: 10.1016/j.omto.2023.01.005. [DOI] [PMC free article] [PubMed] [Google Scholar]
- (14).Stornetta A; Zimmermann M; Cimino GD; Henderson PT; Sturla SJ DNA Adducts from Anticancer Drugs as Candidate Predictive Markers for Precision Medicine. Chem Res Toxicol 2017, 30 (1), 388–409. DOI: 10.1021/acs.chemrestox.6b00380. [DOI] [PMC free article] [PubMed] [Google Scholar]
- (15).Hernandez-Castillo C; Termini J; Shuck S DNA Adducts as Biomarkers To Predict, Prevent, and Diagnose Disease-Application of Analytical Chemistry to Clinical Investigations. Chem Res Toxicol 2020, 33 (2), 286–307. DOI: 10.1021/acs.chemrestox.9b00295. [DOI] [PubMed] [Google Scholar]
- (16).Li Y; Hecht SS Metabolism and DNA Adduct Formation of Tobacco-Specific N-Nitrosamines. Int J Mol Sci 2022, 23 (9). DOI: 10.3390/ijms23095109. [DOI] [PMC free article] [PubMed] [Google Scholar]
- (17).Bellamri M; Brandt K; Cammerrer K; Syeda T; Turesky RJ; Cannon JR Nuclear DNA and Mitochondrial Damage of the Cooked Meat Carcinogen 2-Amino-1-methyl-6-phenylimidazo[4,5-b]pyridine in Human Neuroblastoma Cells. Chem Res Toxicol 2023. DOI: 10.1021/acs.chemrestox.3c00109. [DOI] [PMC free article] [PubMed] [Google Scholar]
- (18).Guidolin V; Carlson ES; Carra A; Villalta PW; Maertens LA; Hecht SS; Balbo S Identification of New Markers of Alcohol-Derived DNA Damage in Humans. Biomolecules 2021, 11 (3). DOI: 10.3390/biom11030366. [DOI] [PMC free article] [PubMed] [Google Scholar]
- (19).Balbo S; Turesky RJ; Villalta PW DNA adductomics. Chem Res Toxicol 2014, 27 (3), 356–366. DOI: 10.1021/tx4004352. [DOI] [PMC free article] [PubMed] [Google Scholar]
- (20).Guo J; Turesky RJ Emerging Technologies in Mass Spectrometry-Based DNA Adductomics. High Throughput 2019, 8 (2). DOI: 10.3390/ht8020013. [DOI] [PMC free article] [PubMed] [Google Scholar]
- (21).Defossez E; Bourquin J; von Reuss S; Rasmann S; Glauser G Eight key rules for successful data-dependent acquisition in mass spectrometry-based metabolomics. Mass Spectrom Rev 2023, 42 (1), 131–143. DOI: 10.1002/mas.21715. [DOI] [PMC free article] [PubMed] [Google Scholar]
- (22).Zhang F; Ge W; Ruan G; Cai X; Guo T Data-Independent Acquisition Mass Spectrometry-Based Proteomics and Software Tools: A Glimpse in 2020. Proteomics 2020, 20 (17–18), e1900276. DOI: 10.1002/pmic.201900276. [DOI] [PubMed] [Google Scholar]
- (23).Guo J; Villalta PW; Turesky RJ Data-Independent Mass Spectrometry Approach for Screening and Identification of DNA Adducts. Anal Chem 2017, 89 (21), 11728–11736. DOI: 10.1021/acs.analchem.7b03208. [DOI] [PMC free article] [PubMed] [Google Scholar]
- (24).Walmsley SJ; Guo J; Murugan P; Weight CJ; Wang J; Villalta PW; Turesky RJ Comprehensive Analysis of DNA Adducts Using Data-Independent wSIM/MS(2) Acquisition and wSIM-City. Anal Chem 2021, 93 (16), 6491–6500. DOI: 10.1021/acs.analchem.1c00362. [DOI] [PMC free article] [PubMed] [Google Scholar]
- (25).Dator RP; Murray KJ; Luedtke MW; Jacobs FC; Kassie F; Nguyen HD; Villalta PW; Balbo S Identification of Formaldehyde-Induced DNA-RNA Cross-Links in the A/J Mouse Lung Tumorigenesis Model. Chem Res Toxicol 2022, 35 (11), 2025–2036. DOI: 10.1021/acs.chemrestox.2c00206. [DOI] [PMC free article] [PubMed] [Google Scholar]
- (26).Wilson MR; Jiang Y; Villalta PW; Stornetta A; Boudreau PD; Carra A; Brennan CA; Chun E; Ngo L; Samson LD; et al. The human gut bacterial genotoxin colibactin alkylates DNA. Science 2019, 363 (6428). DOI: 10.1126/science.aar7785. [DOI] [PMC free article] [PubMed] [Google Scholar]
- (27).Guo J; Turesky RJ; Tarifa A; DeCaprio AP; Cooke MS; Walmsley SJ; Villalta PW Development of a DNA Adductome Mass Spectral Database. Chem Res Toxicol 2020, 33 (4), 852–854. DOI: 10.1021/acs.chemrestox.0c00031. [DOI] [PMC free article] [PubMed] [Google Scholar]
- (28).Shao W; Lam H Tandem mass spectral libraries of peptides and their roles in proteomics research. Mass Spectrom Rev 2017, 36 (5), 634–648. DOI: 10.1002/mas.21512. [DOI] [PubMed] [Google Scholar]
- (29).Bittremieux W; Wang M; Dorrestein PC The critical role that spectral libraries play in capturing the metabolomics community knowledge. Metabolomics 2022, 18 (12), 94. DOI: 10.1007/s11306-022-01947-y. [DOI] [PMC free article] [PubMed] [Google Scholar]
- (30).Wang M; Jarmusch AK; Vargas F; Aksenov AA; Gauglitz JM; Weldon K; Petras D; da Silva R; Quinn R; Melnik AV; et al. Mass spectrometry searches using MASST. Nat Biotechnol 2020, 38 (1), 23–26. DOI: 10.1038/s41587-019-0375-9. [DOI] [PMC free article] [PubMed] [Google Scholar]
- (31).Sumner LW; Amberg A; Barrett D; Beale MH; Beger R; Daykin CA; Fan TW; Fiehn O; Goodacre R; Griffin JL; et al. Proposed minimum reporting standards for chemical analysis Chemical Analysis Working Group (CAWG) Metabolomics Standards Initiative (MSI). Metabolomics 2007, 3 (3), 211–221. DOI: 10.1007/s11306-007-0082-2. [DOI] [PMC free article] [PubMed] [Google Scholar]
- (32).Chaleckis R; Meister I; Zhang P; Wheelock CE Challenges, progress and promises of metabolite annotation for LC-MS-based metabolomics. Curr Opin Biotechnol 2019, 55, 44–50. DOI: 10.1016/j.copbio.2018.07.010. [DOI] [PubMed] [Google Scholar]
- (33).Wishart DS; Guo A; Oler E; Wang F; Anjum A; Peters H; Dizon R; Sayeeda Z; Tian S; Lee BL; et al. HMDB 5.0: the Human Metabolome Database for 2022. Nucleic Acids Res 2022, 50 (D1), D622–D631. DOI: 10.1093/nar/gkab1062. [DOI] [PMC free article] [PubMed] [Google Scholar]
- (34).Horai H; Arita M; Kanaya S; Nihei Y; Ikeda T; Suwa K; Ojima Y; Tanaka K; Tanaka S; Aoshima K; et al. MassBank: a public repository for sharing mass spectral data for life sciences. J Mass Spectrom 2010, 45 (7), 703–714. DOI: 10.1002/jms.1777. [DOI] [PubMed] [Google Scholar]
- (35).Walmsley SJ; Guo J; Wang J; Villalta PW; Turesky RJ Methods and Challenges for Computational Data Analysis for DNA Adductomics. Chem Res Toxicol 2019, 32 (11), 2156–2168. DOI: 10.1021/acs.chemrestox.9b00196. [DOI] [PMC free article] [PubMed] [Google Scholar]
- (36).La Barbera G; Nommesen KD; Cuparencu C; Stanstrup J; Dragsted LO A Comprehensive Database for DNA Adductomics. Front Chem 2022, 10, 908572. DOI: 10.3389/fchem.2022.908572. [DOI] [PMC free article] [PubMed] [Google Scholar]
- (37).Wang F; Liigand J; Tian S; Arndt D; Greiner R; Wishart DS CFM-ID 4.0: More Accurate ESI-MS/MS Spectral Prediction and Compound Identification. Anal Chem 2021, 93 (34), 11692–11700. DOI: 10.1021/acs.analchem.1c01465. [DOI] [PMC free article] [PubMed] [Google Scholar]
- (38).Tsugawa H; Kind T; Nakabayashi R; Yukihira D; Tanaka W; Cajka T; Saito K; Fiehn O; Arita M Hydrogen Rearrangement Rules: Computational MS/MS Fragmentation and Structure Elucidation Using MS-FINDER Software. Anal Chem 2016, 88 (16), 7946–7958. DOI: 10.1021/acs.analchem.6b00770. [DOI] [PMC free article] [PubMed] [Google Scholar]
- (39).Adusumilli R; Mallick P Data Conversion with ProteoWizard msConvert. Methods Mol Biol 2017, 1550, 339–368. DOI: 10.1007/978-1-4939-6747-6_23. [DOI] [PubMed] [Google Scholar]
- (40).Chen G; Walmsley S; Cheung GCM; Chen L; Cheng CY; Beuerman RW; Wong TY; Zhou L; Choi H Customized Consensus Spectral Library Building for Untargeted Quantitative Metabolomics Analysis with Data Independent Acquisition Mass Spectrometry and MetaboDIA Workflow. Anal Chem 2017, 89 (9), 4897–4906. DOI: 10.1021/acs.analchem.6b05006. [DOI] [PubMed] [Google Scholar]
- (41).Kim S; Chen J; Cheng T; Gindulyte A; He J; He S; Li Q; Shoemaker BA; Thiessen PA; Yu B; et al. PubChem in 2021: new data content and improved web interfaces. Nucleic Acids Res 2021, 49 (D1), D1388–D1395. DOI: 10.1093/nar/gkaa971. [DOI] [PMC free article] [PubMed] [Google Scholar]
- (42).Jiang Y; Stornetta A; Villalta PW; Wilson MR; Boudreau PD; Zha L; Balbo S; Balskus EP Reactivity of an Unusual Amidase May Explain Colibactin’s DNA Cross-Linking Activity. J Am Chem Soc 2019, 141 (29), 11489–11496. DOI: 10.1021/jacs.9b02453. [DOI] [PMC free article] [PubMed] [Google Scholar]
- (43).Sousa PFM; Martella G; Aberg KM; Esfahani B; Motwani HV nLossFinder-A Graphical User Interface Program for the Nontargeted Detection of DNA Adducts. Toxics 2021, 9 (4). DOI: 10.3390/toxics9040078. [DOI] [PMC free article] [PubMed] [Google Scholar]
- (44).Li S; Arnold RJ; Tang H; Radivojac P On the accuracy and limits of peptide fragmentation spectrum prediction. Anal Chem 2011, 83 (3), 790–796. DOI: 10.1021/ac102272r. [DOI] [PMC free article] [PubMed] [Google Scholar]
- (45).Kind T; Tsugawa H; Cajka T; Ma Y; Lai Z; Mehta SS; Wohlgemuth G; Barupal DK; Showalter MR; Arita M; et al. Identification of small molecules using accurate mass MS/MS search. Mass Spectrom Rev 2018, 37 (4), 513–532. DOI: 10.1002/mas.21535. [DOI] [PMC free article] [PubMed] [Google Scholar]
- (46).Duhrkop K; Fleischauer M; Ludwig M; Aksenov AA; Melnik AV; Meusel M; Dorrestein PC; Rousu J; Bocker S SIRIUS 4: a rapid tool for turning tandem mass spectra into metabolite structure information. Nat Methods 2019, 16 (4), 299–302. DOI: 10.1038/s41592-019-0344-8. [DOI] [PubMed] [Google Scholar]
- (47).Duhrkop K; Shen H; Meusel M; Rousu J; Bocker S Searching molecular structure databases with tandem mass spectra using CSI:FingerID. Proc Natl Acad Sci U S A 2015, 112 (41), 12580–12585. DOI: 10.1073/pnas.1509788112. [DOI] [PMC free article] [PubMed] [Google Scholar]
- (48).Wang M; Carver JJ; Phelan VV; Sanchez LM; Garg N; Peng Y; Nguyen DD; Watrous J; Kapono CA; Luzzatto-Knaan T; et al. Sharing and community curation of mass spectrometry data with Global Natural Products Social Molecular Networking. Nat Biotechnol 2016, 34 (8), 828–837. DOI: 10.1038/nbt.3597. [DOI] [PMC free article] [PubMed] [Google Scholar]
- (49).Jora M; Corcoran D; Parungao GG; Lobue PA; Oliveira LFL; Stan G; Addepalli B; Limbach PA Higher-Energy Collisional Dissociation Mass Spectral Networks for the Rapid, Semi-automated Characterization of Known and Unknown Ribonucleoside Modifications. Anal Chem 2022, 94 (40), 13958–13967. DOI: 10.1021/acs.analchem.2c03172. [DOI] [PubMed] [Google Scholar]
- (50).Tsugawa H; Cajka T; Kind T; Ma Y; Higgins B; Ikeda K; Kanazawa M; VanderGheynst J; Fiehn O; Arita M MS-DIAL: data-independent MS/MS deconvolution for comprehensive metabolome analysis. Nat Methods 2015, 12 (6), 523–526. DOI: 10.1038/nmeth.3393. [DOI] [PMC free article] [PubMed] [Google Scholar]
- (51).Aron AT; Gentry EC; McPhail KL; Nothias LF; Nothias-Esposito M; Bouslimani A; Petras D; Gauglitz JM; Sikora N; Vargas F; et al. Reproducible molecular networking of untargeted mass spectrometry data using GNPS. Nat Protoc 2020, 15 (6), 1954–1991. DOI: 10.1038/s41596-020-0317-5. [DOI] [PubMed] [Google Scholar]
- (52).Seither JZ; Hindle R; Arroyo-Mora LE; DeCaprio AP Systematic analysis of novel psychoactive substances. I. Development of a compound database and HRMS spectral library. Forensic Chem 2018, 9, 12–20. DOI: 10.1016/j.forc.2018.03.003. [DOI] [Google Scholar]
- (53).Cooke MS; Chang YJ; Chen YR; Hu CW; Chao MR Nucleic acid adductomics - The next generation of adductomics towards assessing environmental health risks. Sci Total Environ 2023, 856 (Pt 2), 159192. DOI: 10.1016/j.scitotenv.2022.159192. [DOI] [PMC free article] [PubMed] [Google Scholar]
- (54).Takeshita T; Kanaly RA In vitro DNA/RNA Adductomics to Confirm DNA Damage Caused by Benzo[a]pyrene in the Hep G2 Cell Line. Front Chem 2019, 7, 491. DOI: 10.3389/fchem.2019.00491. [DOI] [PMC free article] [PubMed] [Google Scholar]
Associated Data
This section collects any data citations, data availability statements, or supplementary materials included in this article.