

Summary:
Natural behaviors are a coordinated symphony of motor acts which drive reafferent (self-induced) sensory activation. Individual sensors cannot disambiguate exafferent (externally-induced) from reafferent sources. Nevertheless, animals readily differentiate between these sources of sensory signals to carry out adaptive behaviors through corollary discharge circuits (CDCs), which provide predictive motor signals from motor pathways to sensory processing and other motor pathways. Yet, how CDCs comprehensively integrate into the nervous system remains unexplored. Here, we use connectomics, neuroanatomical, physiological and behavioral approaches to resolve the network architecture of two pairs of ascending histaminergic neurons (AHNs) in Drosophila, which function as a predictive CDC in other insects. Both AHN pairs receive input primarily from a partially overlapping population of descending neurons, especially from DNg02 which controls wing motor output. Using Ca2+ imaging and behavioral recordings, we show that AHN activation is correlated to flight behavior and precedes wing motion. Optogenetic activation of DNg02 is sufficient to activate AHNs, indicating that AHNs are activated by descending commands in advance of behavior and not as a consequence of sensory input. Downstream, each AHN pair targets predominantly non-overlapping networks including those that process visual, auditory and mechanosensory information as well as networks controlling wing, haltere, and leg sensorimotor control. These results support the conclusion that the AHNs provide a predictive motor signal about wing motor state to mostly non-overlapping sensory and motor networks. Future work will determine how AHN signaling is driven by other descending neurons and interpreted by AHN downstream targets to maintain adaptive sensorimotor performance.
Keywords: corollary discharge circuit, efference copy, ascending neuron, connectomics, ventral nerve cord
eTOC blurb
Cheong et al. dissect the circuit organization of an ascending corollary discharge circuit using connectomics, neuroanatomical, physiological and behavioral approaches. They show that this circuit integrates signals from many descending neurons and relays flight motor information to brain and nerve cord sensorimotor networks.
Introduction:
Animals exploit a multisensory strategy to navigate their environment. In doing so, the animal’s own movements can activate one or more sensory modes by the process of reafference, which must be reliably distinguished from sensory activation from outside stimuli (exafference), to properly coordinate behavior1. However, individual sensory organs or structures only signal the presence and magnitude of sensory cues, but cannot provide source information. For instance, a mechanosensory hair will activate when bent by an external object, such as a predator, or by the animal’s own movement, such as when brushing up against a stationary object. To distinguish reafference from exafference, the central nervous system implements a broad class of feedforward circuits, commonly referred to as corollary discharge circuits (CDCs), which provide predictive motor information to sensory and motor pathways2. CDCs impact sensorimotor integration via diverse means including modulation of network processing3,4, blanket suppression, or temporally precise inhibitory gating of sensory processing5–8, and modulating efferent pathways that tune sensory sensitivity9,10. Importantly, CDCs are often modulatory in nature and can up or downregulate responsiveness of a sensory neuropil to reafferent signals4,10. Throughout the animal kingdom, CDCs convey information from a variety of motor control centers to most, if not all, sensory modalities. The fundamental importance of these predictive motor signals is highlighted by their failure, which results in attributional errors associated with nearly every form of sensory hallucination whether fatigue-11,12 or disease-induced13,14. Thus, predictive motor signals from CDCs are essential for the animal to effectively use sensory information to make adaptive choices that optimize behavioral performance.
Despite being studied across diverse species and sensory modalities, there remain many open questions about their synaptic integration into the nervous systems. That is, how are upstream circuits organized to drive CDCs, and in turn, how are CDCs integrated into downstream circuits? We recently described two pairs of histaminergic neurons, which originate within the ventral nerve cord (VNC) and project to the brain of the moth Manduca sexta15. These ascending histaminergic neurons (AHNs) have somas in the mesothoracic (MsAHNs) and metathoracic (MtAHNs) neuromeres. The AHNs bilaterally ramify the subesophageal zone (SEZ) and the antennal mechanosensory and motor center (AMMC). In night-flying plume tracking insects, the MsAHNs also project into the antennal lobe and have been co-opted to serve a function there16. In Manduca, only ~16 GABAergic local interneurons within the antennal lobe express the inhibitory histamine B receptor suggesting that the AHNs affect local processing of odor information through a disinhibitory network mechanism15. Paired recordings of the MsAHNs and a primary wing motor fiber in Manduca indicates that MsAHN firing rate increases ~200 ms prior to wing motor output from the VNC. Thus, their activation is thought to be the consequence of receiving direct descending wing motor command signals. AHN activation therefore results in disinhibition within the antennal lobe just in advance of flight, resulting in an upregulation of temporal precision with which antennal lobe projection neurons entrain to the stimulus temporal structure4, such as those induced by the beating wings17,18. The consequence of this increased temporal fidelity is associated with enhanced sensory acuity4. Thus, in Manduca the MsAHNs represent a CDC that informs the antennal lobe of wing motor action, allowing it to upregulate olfactory processing and performance during flight. However, as with other CDC’s, how they are synaptically integrated into the nervous system remains unexplored.
Our prior work established that homologs to the Manduca AHNs are present across insects, including Drosophila16. Therefore, to resolve the broader network architecture within which the AHNs are synaptically integrated into the central nervous system, we turned to the wealth of circuit-cracking approaches afforded by Drosophila melanogaster. We asked to what extent are the two AHN pairs anatomically integrated within the same sensory and motor networks? More specifically, do the two AHN pairs follow the same organizational principles with respect to their synaptic connectivity and mechanisms of communication, or do they represent operationally different circuits despite their similarities in basic morphology and neurotransmitter content? Furthermore, does the activity of the AHNs correlate to or otherwise represent motor information? If so, are the AHNs activated in advance of the initiation of wing movement and hence provide predictive information to their downstream targets? To address these questions, we exploited connectomics, molecular, anatomical, and physiological approaches to comprehensively map synaptic connectivity and explore what drives their activation.
Results:
AHN Anatomical Characterization Throughout the CNS
A relatively small number of histaminergic neurons project throughout the central brain and VNC of Drosophila19–23 (Figure 1A) and innervate several neuropils. Similar to Manduca and many other insect species16, Drosophila has two pairs of AHNs with somas located within the mesothoracic (the MsAHNs) and metathoracic (the MtAHNs) neuromeres. The remaining histaminergic soma in the VNC reside in the abdominal segment and do not ascend (Figure 1A). We therefore first aimed to determine the contribution of the AHNs to the total histaminergic projections observed within the central nervous system. To this end, we identified several driver lines that include the AHNs, but not other histaminergic neurons (Figure S1A–E, Table S1). Using one such line, we drove the expression of diphtheria toxin A24 to ablate the AHNs. This approach eliminated histamine labeling in the thoracic neuromeres (Figure 1B) as well as in several brain neuropils, including most of the sub-esophageal zone (SEZ), antennal mechanosensory and motor center (AMMC) (Figure 1B’), saddle and posterior slope (Figure 1B”). To resolve the independent projections of each AHN type, we used the Multicolor FLP Out approach25 (MCFO) to stochastically label single AHNs (Figure 1C & D). This established that individual MsAHNs arborize within both the ipsilateral and contralateral meso- and prothoracic neuromeres before ascending to the brain to innervate the SEZ, saddle and posterior slope (Figure 1C’–C”), whereas single MtAHNs unilaterally arborize in the gnathal ganglia, AMMC (Figure 1D) and all leg neuropils contralateral to the soma (Figure 1D’).
Figure 1. General AHN morphology and histamine expression in the CNS.

A) Histamine immunolabeling in the intact CNS of Drosophila melanogaster. ProNm; prothoracic neuromere, MsNm; Mesothoracic neuromere, MtNm; Metathoracic neuromere, ANm; Abdominal neuromere. B) Histamine immunolabeling in R48H10-Gal4 flies driving expression of diptheria toxin-A in B) the VNC as well as B’) anterior and B”) posterior depths in the brain. C) Single MsAHN clone within the C) VNC and at C’) medium and C”) posterior depths of the brain. D) Single MtAHN clone within the D) VNC and at D’) anterior depths of the brain. E, F) Manual reconstruction of a E) MsAHN and F) MtAHN within the Female Adult Fly Brain (FAFB) EM volume. Gnathal ganglia (GNG; yellow), saddle (green), antennal mechanosensory motor center (AMMC; blue), inferior posterior slope (IPS; magenta), superior posterior slope (SPS; orange). G) Reconstruction of a MtAHN (lavender) and MsAHN (green) in the FAFB (FlyWire) and Female Adult Nerve Cord EM volumes. Scale bars = 20μm. H) Cartoon schematics of the MtAHN (lavender) and MsAHN (green). See also Figure S1 and Table S1.
Using their unique morphology, we then located candidate MsAHNs and MtAHNs within three large CNS electron microscopy volumes, the Full Adult Fly Brain26 (FAFB), the Female Adult Nerve Cord27,28 (FANC) and the Male Adult Nerve Cord29,30 (MANC) datasets (Figure 1E–G). In the brain, we identified the MsAHNs based on their expected bilateral arborization patterns in the SEZ, saddle and posterior slope (Figure 1E) and the MtAHNs based on their unilateral innervation of the AMMC and dorsal gnathal ganglia (Figure 1F). Furthermore, we reconstructed and identified the MsAHNs and MtAHNs within the male and female VNC datasets based on soma position and morphology (Figure 1G). The general morphology of the AHNs was similar between male and female datasets (Figure S1F–I and K), except for additional processes from the MsAHNs projecting laterally and ventrally within the prothoracic and mesothoracic neuromeres in FANC that were absent in MANC (Figure S1H & I). However, we observed variability for the ventrolaterally projecting prothoracic and mesothoracic branches among single MCFO clones of MsAHNs from male flies, suggesting that these morphological differences represent individual, rather than sex-specific differences (Figure S1J). There were no obvious differences in the morphology of the MtAHNs between the FANC and MANC datasets (Figure S1K). Thus, MCFO-derived single AHNs (Figure 1C–D) and EM-based reconstructions indicate that the projections of the AHNs pairs partially overlap within the VNC but are non-overlapping in the brain (Figure 1H). To determine whether other neurons represented good AHN candidates, we took two approaches. First, we manually traced the major processes of all neurons within the same ventral-to-dorsal tracts through which the MsAHNs and MtAHNs soma project within the FANC dataset and found no neurons whose coarse morphology were consistent with the morphology of the AHNs, as revealed by MCFO (Figure 1C–D). Second, we used NBLAST31 with our AHN candidates to search for cells with similar morphologies within the MANC volume (Figure S1L–M), but again none of the top hits were similar to the single AHN neurons observed with light microscopy (Figure 1C–D). Thus, both methods suggest that the AHN candidate cells found in MANC and FANC are high confidence matches to AHNs.
Next, to further validate our candidate AHNs from the EM volumes, we characterized primary input and output regions of the AHNs using driver lines that restricted Gal4 expression exclusively to either the MsAHNs or MtAHNs. Using the somatic/dendritic marker DenMark (ICAM5-RFP) and the presynaptic marker synaptotagmin tagged with GFP (syteGFP)32, we labeled the primary input and output regions of the AHNs, and compared these immunohistochemical results with EM volume reconstructions where we annotated pre- and postsynaptic sites (Figure 2). Within the VNC, the MsAHNs had sparse expression of syteGFP throughout the prothoracic and mesothoracic neuromeres (Figure 2A) and prominent ICAM5-RFP labeling primarily localized in the wing and intermediate tectulum33,34 (Figure 2A & B). Within the brain, only syteGFP was present in the SEZ, saddle and posterior slope (Figure 2C & D), consistent with FAFB synapse annotations which are predominantly presynaptic within the brain (Table 1). The distribution of manually annotated postsynaptic sites of the MsAHN EM reconstructions were highly consistent with the transgenic expression of ICAM5-RFP by the MsAHN splitGal4 line, although we observed relatively more presynaptic sites within leg neuropil in the MsAHNs within the FANC EM volume (Figure 2E). In general, there was more ICAM5-RFP signal relative to postsynaptic sites in the EM datasets, likely due to ICAM5-RFP being additionally expressed in cell bodies and primary neurites. The MtAHNs on the other hand had syteGFP expression in all three thoracic neuromeres (Figure 2F & G), as well as the AMMC (Figure 2H) and dorsal gnathal ganglia (Figure 2I). MtAHN expression of ICAM5-RFP was distributed throughout the posterior intermediate tectulum of the metathoracic neuromere, and extended into the mesothoracic neuromere collectively spanning neuropils involved in leg and wing coordination33,34 (Figure 2F & G). As with the MsAHNs, the MtAHN transgenic labeling of pre- and postsynaptic zones was consistent with EM volume reconstruction’s distribution of pre- and postsynaptic sites (Figure 2E & J). Taken together, these results provide strong confirmation that we have identified the AHNs in the FANC and FAFB connectomic volumes. Importantly, the AHNs receive the bulk of their input within the medial regions of the VNC associated with wing and haltere locomotor control and leg-wing coordination, and project local output extensively within the leg and wing sensory-motor neuropils and multiple sensory processing regions in the brain.
Figure 2. Distribution of AHN input and output regions.

A-D) Input and output regions of the MsAHNs. R17F12 ∩ VT049652 splitGal4 driving expression of the axon terminal marker synaptotagmin-eGFP (“syteGFP”; cyan) and the dendrite/soma marker ICAM5-mCherry (“DenMark”; yellow). NCAD serves as a neuropil marker (magenta). A) Horizontal view of MsAHN syteGFP and DenMark expression within the VNC. Dashed line indicates the border of the sagittal view in B. B) Sagittal view of image stack in A). C) Frontal view of MsAHN syteGFP and DenMark expression within the saddle. D) Frontal view of MsAHN syteGFP and DenMark expression within the posterior slope. E) Reconstruction of the MsAHN from the FANC EM volume with presynaptic (cyan) and postsynaptic (yellow) marked. F-I) Input and output regions of the MtAHNs. R84G04-Gal4 driving expression of the axon terminal marker synaptotagmin-eGFP (“syteGFP”; cyan) and the dendrite/soma marker ICAM5-mCherry (“DenMark”; yellow). NCAD serves as a neuropil marker (magenta). F) Horizontal view of MtAHN syteGFP and DenMark expression within the VNC. Dashed line indicates the border of the sagittal view in G. G) Sagittal view of image stack in F). H) Frontal view of MtAHN syteGFP and DenMark expression within the AMMC. I) Frontal view of MtAHN syteGFP and DenMark expression within the GNG. J) Reconstruction of the MtAHN from the FANC EM volume with presynaptic (cyan) and postsynaptic (yellow) marked. Scale bars = 20μm. See also Table S1.
Table 1: FANC, MANC and FAFB AHN tracing and connectivity summary.
Presynaptic site counts of AHNs in FAFB (FlyWire) are undetermined as automated synapse predictions in this connectome are carried out as pairs of post-to-pre connections rather than single presynaptic sites.
| EM volume | Cell | Postsynaptic sites/upstream connections (to valid neurons) | Presynaptic sites | Downstream connections (to valid neurons/orphans/undetermined) |
|---|---|---|---|---|
| FANC | MsAHN-L | 1040 (992) | 1664 | 4604 (995/93/3516) |
| MsAHN-R | 962 (899) | 1170 | 3183 (740/60/2383) | |
| MtAHN-L | 1430 (1288) | 2586 | 7580 (1317/505/5758) | |
| MtAHN-R | 1024 (935) | 1952 | 4901 (891/292/3718) | |
| MANC | MsAHN-L | 2941 (2825) | 1782 | 5090 |
| MsAHN-R | 3116 (2984) | 1722 | 5001 | |
| MtAHN-L | 4039 (3499) | 2102 | 4946 | |
| MtAHN-R | 4895 (4173) | 2549 | 6032 | |
| FAFB (CATMAID) | MsAHN-L | 92 | 1115 | 3427 (1649/407/1371) |
| MtAHN-L | 70 | 556 | 1440 (812/215/413) | |
| FAFB (FlyWire) | MsAHN-L | 630(149) | - | 2091(312/-/1779) |
| MsAHN-R | 704(173) | - | 2295(386/-/1909) | |
| MtAHN-L | 441(74) | - | 1043(212-/831) | |
| MtAHN-R | 356(57) | - | 754(117/-/637) |
Organization of AHN Upstream Circuits
Next, we used the FANC and MANC EM datasets to retrieve or reconstruct the upstream synaptic partners of the AHNs to determine the possible information sources integrated by the AHNs. As upstream synapse counts differed notably between AHNs of FANC and MANC (MANC AHNs had ~3x more upstream synapses), likely due to differences in EM methods used in generating these volumes, we thresholded per-cell connectivity in FANC and MANC by a ‘proportionally equivalent’ threshold before further analysis (see STAR Methods). We first classified synaptic partners into one of 6 broad neuronal classes; sensory (SNs), ascending sensory (SAs), ascending (AN), descending (DNs), interneurons restricted to the VNC (INs), or motor neurons (MNs). All four AHNs had relatively similar proportional demographics (across FANC and MANC), with DNs representing the majority of input to all AHNs (50-68%) followed by INs (17-37%), with relatively small contributions from the other cell classes (Figure 3A & B). Depending upon the degree of convergence of the upstream partners on all four AHNs, the AHNs could convey common information or information unique to single cells or pairs of AHNs. To determine the degree to which individual AHNs receive common versus distinctive input, we generated graph plots for the FANC (Figure 3C) and MANC (Figure 3D) datasets to depict the input to AHNs based upon the combinations of AHNs to which groups of neurons contribute. Most noticeably, class demographics differed between unique upstream inputs to each individual AHN relative to upstream inputs that converged upon two or more AHNs. While unique input to individual AHNs derived mostly from INs and ANs, the primary common input to all four AHNs derived almost exclusively from DNs (Figure 3C & D).
Figure 3. Connectivity of upstream inputs to the AHNs.
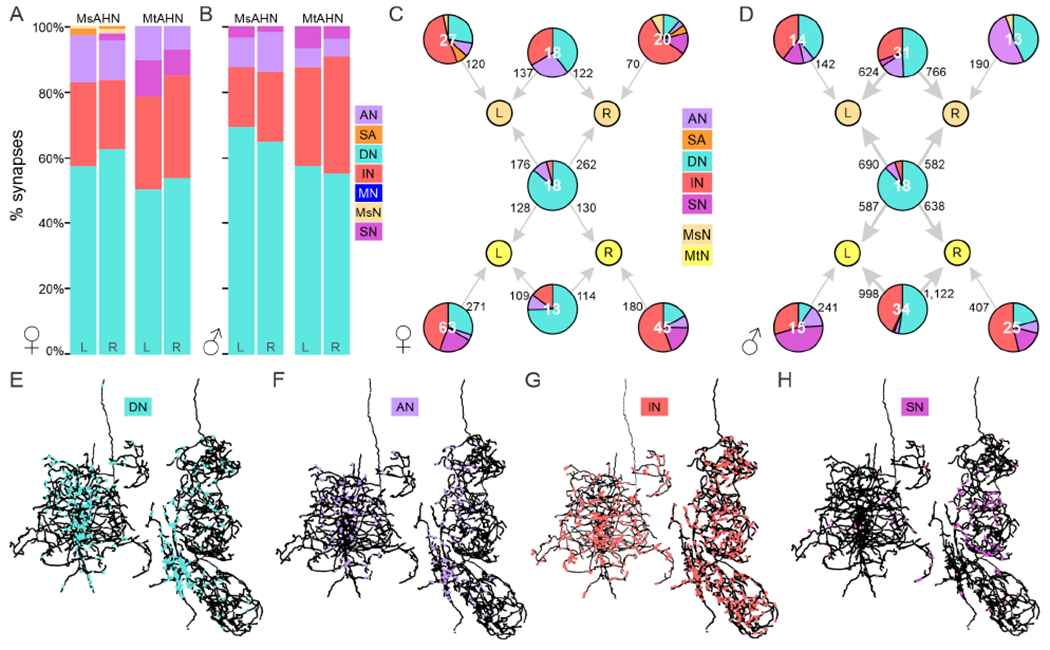
A-B) Input synapse fractions to AHNs expressed as percent among identified upstream partners by neuron class in A) FANC and B) MANC. C-D) Graph plot of upstream partners to the AHNs in the C) FANC and D) MANC dataset. Number on node label indicates number of neurons. Edge number indicates total number of synapses. Pie chart within nodes indicates fraction of synaptic input to AHNs by neuron class. As total upstream synapse count differed between FANC and MANC, the sum of total upstream synapses to AHNs in FANC vs MANC was used to define a ‘proportionally equivalent’ synapse threshold of 3 for FANC and 10 for MANC to threshold individual neuron connectivity in A-D. E-H) Horizontal views of the postsynaptic site distributions for one MsAHN (left) and one MtAHN (right) in FANC from E) descending neurons (cyan), F) ascending neurons (lavender), G) interneurons (red), and H) sensory neurons (pink). Abbreviations: ascending neuron (AN), ascending sensory neuron (SA), descending neuron (DN), interneuron (IN), motor neuron (MN), MsAHN (MsN), MtAHN (MtN), sensory neuron (SN). See also Figure S2 and Table S1.
The spatial distribution of synaptic input onto a neuron is thought to play a variety of roles–dendritic synaptic input are integrated via several mechanisms to drive neuron activity35, while axonal synaptic input is thought to play roles in localized control of membrane voltage or neurotransmitter release in axonal branches36. To determine if different neuron classes synapse upon distinct regions of the AHNs, we plotted the location of input sites by class on the AHNs (Figure 3E–H, S2). While INs synapse uniformly across the AHN skeletons, DNs and ANs primarily synapse upon medial dendritic regions of the AHNs near the midline, within the tectular neuropils (Figure 3E–G, S2A–C). In contrast, the relatively low number of SN synapses were distributed sparsely over the MsAHNs and were localized almost exclusively to axonal regions in the mesothoracic leg neuropil on the MtAHNs (Figure 3H, S2D). Thus, DN and AN inputs are suited to driving AHN activity, while IN and SN inputs likely play more local modulatory roles on AHN axonal branches. Overall, as the inputs that are common to individual AHN pairs or both pairs are primarily DNs, this implies that activity across AHNs are strongly driven by these shared sources of information. Unique inputs to individual AHN cells are more weighted towards other neuron classes, and may thus mainly play roles in modulating AHN output, perhaps from other ongoing network activity within the VNC.
AHNs Convey a Predictive Motor Signal from Descending Neurons
A large catalog of DNs in Drosophila have been classified at the light-level by morphology and functional organization in the CNS33,37, and most of these DNs are now further identified in the MANC EM volume38. Guided by these works, we identified in both FANC and MANC specific DN types that provide substantial input to single, pairs, or all four AHNs (Figure 4A–D). Although there are some DN pairs that provide input exclusively to either AHN pair, a large proportion of DN input converges onto both pairs (Figure 4E & F), in particular from the DNg02s (Figure 4G & H) and DNp54s. DN input to AHNs is generally highly bilateral or weakly lateralized (Figure S3H). While little is known about the DNp54s, the DNg02s represent flight steering control neurons that are responsive to visual motion during flight and whose activation increases wing stroke amplitude37, to aid in adjusting flight path during the optomotor response39. Using a reporter of choline acetyltransferase translation40, we determined that the majority of DNg02s are cholinergic (Figure 4I), but express neither the vesicular glutamate transporter nor GABA (Figure S3A & B) and thus likely provide excitatory input to the AHNs. The DNp54s did not co-express reporters for any small classical transmitters (Figure S3C–G).
Figure 4. Connectivity of DNs upstream of the AHNs.

A-B) Reconstruction of DNs representing 5% or more of synaptic input from DNs to the A) MsAHNs and B) MtAHNs in both the FANC and MANC EM datasets. C-D) Input synapse fractions of DNs upstream to the MsAHNs and MtAHNs in the C) FANC and D) MANC EM datasets. DNs are placed in their own category if the DN type has ≥5% connectivity with any AHN type, otherwise they are grouped as “DNsum”. The color scheme of DN types is matched to that of the neuron reconstructions in A and B. E-F) Graph plot of DNs upstream to the MsAHNs and MtAHNs by DN type in the E) FANC and F) MANC datasets. Node number indicates number of neurons within a DN type. Edge number indicates total number of synaptic connections. Only connectivity from DNs to the AHNs is depicted. As total upstream synapse count differed between FANC and MANC, a proportionally equivalent synapse threshold of 3 for FANC and 10 for MANC was used to threshold individual neuron connectivity in C-F. Color code: MsAHNs (light orange), MtAHNs (yellow); DN types colored as in A-D. G) Reconstruction of the DNg02s (the largest source of synaptic input to the AHNs) in the FANC EM data set. H) VT039465-p65ADZ; VT023750-ZpGdbd (SS02625) splitGal4 line expressed in DNg02s (white). Brp (nc82 antibody) used to delineate neuropil. Image courtesy of Shigehiro Namiki33,37. I) Intersection between the DNg02 splitGal4 (yellow) and a ChAT-T2A-LexA (cyan) driver lines reveals that the DNg02s are cholinergic. NCAD (magenta) delineates neuropil and scale bar = 20μm. J-L) Flight-induced changes in Ca2+ levels measured via epifluorescence imaging of jGCaMP7 in J) the DNg02s (6 flies, 3 trials), K) the MsAHNs (6 flies, 6 soma, 3 trials) and L) the MtAHNs (9 flies, 13 soma, 3 trials). Cartoons depict orientation of flies during each recording and green line indicates timing of flight initiation following an airpuff. Gray traces represent recordings from individual replicates from dendrites (DNg02) or soma (AHNs) and black trace represents the average Ca2+ transient across all animals. M) Ca2+ activity in the 1 s period around flight initiation in high speed Ca2+ imaging (100 Hz calcium and behavioral imaging, 9 flies, 3 trials, 12 soma; box in S3M). Green line at t = 0 s indicates flight initiation timing. Black line is the mean across all animals and replicates. N) Mean per-fly difference between Ca2+ rise timing to flight initiation for MsAHNs as determined by synchronized behavioral capture and high speed Ca2+ imaging (9 flies, 3 trials, 12 soma). Difference is significantly lower than zero by one-tailed Wilcoxon signed rank test (p = 0.023, α = 0.05). O) Ca2+ transients evoked measured via two-photon imaging of jGCaMP7 in the MtAHNs in response to CsChrimson activation of the DNg02s. Gray traces represent recordings from individual AHN soma and black trace represents the mean fluorescence transient across all animals. See also Figure S3, Videos S1 & S2, and Table S1.
To test if the AHNs are activated by wing motor output, we carried out Ca2+ imaging of the DNg02 population and each AHN pair using genetically-encoded Ca2+ indicators41 during the induction of flight. Flies were dissected and imaged from the posterior side of the head for DNg02 dendrites or from the ventral side of the thorax for AHN soma. An air puff was manually delivered to the head via a syringe to induce flight. Consistent with prior work37, the DNg02s became active with the induction of flight (Figure 4J). Likewise, both the MsAHNs (Figure 4K) and MtAHNs (Figure 4L) each became active with the induction of flight (further see Videos S1 & S2), while no change in fluorescence was observed when GFP was expressed in either AHN pair (Figure S3I & J), indicating that flight-induced changes in GCaMP signal were not movement artifacts. Flight-induced activation of AHNs suggests that they receive input correlated to wing movement, consistent with a predictive motor circuit. However, if AHNs were indeed transmitting a predictive motor signal, their activity might be expected to rise prior to the actual motor action. To examine this possibility, we carried out Ca2+ imaging in MsAHNs at a higher speed (100 Hz) with framewise synchronized behavioral recordings, and induced flight. As before, Ca2+ activity in MsAHNs rises with flight motor activity (Figure 4M & S3M). The timing of flight initiation was annotated as the first frame of observable wing spreading (Figure S3L), and the timing of Ca2+ rise was algorithmically determined as the inflection point of the slope of the low-pass filtered Ca2+ trace (Figure S3N). Some Ca2+ traces show a brief dip due to Z-motion from the air puff; if the inflection point was within this region, the timing of first positive dF/F following it was taken as the rise timing (Figure S3O). Using this method, we find that MsAHN Ca2+ rise does indeed precede flight initiation with a per-fly median latency of 37 ms (Figure 4N). Thus, activity in the MsAHNs is well positioned to inform downstream circuits of impending flight motor activity. Next, to test if the DNg02s provide excitatory, cholinergic drive to the AHNs, we expressed the light-activated ion channel CsChrimson 42 in the DNg02s while imaging from the MtAHN somata using jGCaMP7f (only MtAHNs targeted as we lack a clean MsAHN-LexA). Red-light activation of the DNg02s reliably resulted in a strong Ca2+ transient from the MtAHNs (Figure 4O), while red-light did not induce MtAHN Ca2+ transients in control animals with an “empty-Gal4” (no expression in the central nervous system; Figure S3K) and lacking the CsChrimson transgene. Thus, the MtAHNs are activated during flight at least in part via excitatory input from the DNg02s. As the MsAHNs receive ~2-3x more synapses from DNg02s compared to the MtAHNs, we also expect that they are driven by DNg02s during flight. Interestingly, flies do not take off nor flap their wings upon activation of the DNg02s, suggesting that although they are active during flight, DNg02s are not themselves command neurons for flight initiation. As detailed further below, DNg02s form a circuit with the AHNs, INs and wing power MNs that may play a role in controlling wing power output during flight. However, as other DNs that provide input to AHNs have not been behaviorally characterized, it remains possible that AHNs may be activated by other motor activities besides flight steering control alone.
AHN Pairs Each Target Distinct Sensorimotor Networks
Although there is little physical overlap in the neuropils innervated by both AHN types, the degree to which the AHN pairs converge upon common targets and the demographics of their downstream partners remains unclear. To examine the downstream connectivity of AHNs in the brain, we initially traced 50% of downstream connections for a single MsAHN and MtAHN in the FAFB EM volume via CATMAID43, and further retrieved connectivity for the AHNs from a later public release of the FlyWire dataset, an autosegmented, proofread connectome of the FAFB volume44–46. While synapse counts from the automated synapse predictions in FlyWire were overall lower than our manual annotations, the dense reconstruction of this connectome allowed further analyses of AHN connectivity beyond the direct downstream partners of AHNs. Cell class demographics of AHN downstream connectivity in FlyWire (Figure 5A) indicated that the majority of output for both AHN pairs is directed to INs (59-78%), followed by DNs (17-26%) and other neuron classes. Even without applying a synapse count threshold for inclusion, we observed virtually no common downstream synaptic partners of the AHN pairs for both FlyWire and manual tracings within the brain (Figure 5B, S4A), indicating that the different AHN pairs largely tile their output within the brain. Similarly, the top neuron types downstream of the AHNs in FlyWire show a distinct profile of neuropil ramification between the AHN pairs–the downstream neuron types of the MsAHNs (Figure 5D & F) largely have input and output in the posterior slope, an area implicated in wide-field motion responses47,48, while the downstream types of the MtAHNs (Figure 5E & G) largely have input and output in the gnathal ganglia (gustatory and leg sensorimotor processing33,49) and ventrolateral neuropils (sensorimotor processing related to salient visual stimuli50,51). Some partners of both AHN pairs also have input and output in the saddle and AMMC, which are neuropils related to processing of antennal mechanosensory stimuli. In addition, some MsAHN partners also have partial input or output in the gnathal ganglia. Thus, each AHN pair likely targets largely distinct sensorimotor processes, with potential overlap in antennal mechanosensory- and gnathal ganglia-related pathways.
Figure 5. Downstream connectivity of the AHNs in the brain.
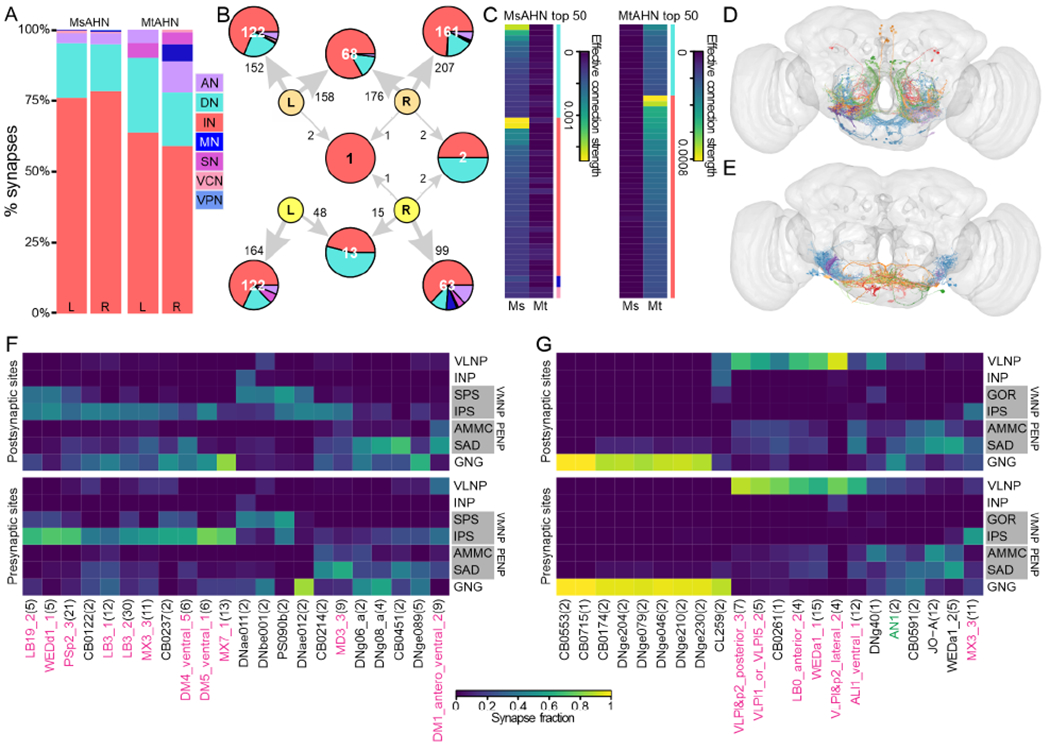
A) Synapse fractions of downstream partners of AHNs by neuron class in the brain in the FAFB (FlyWire) dataset. B) Graph plot of the downstream targets of the AHNs in the FAFB (FlyWire) dataset by cell class. This connectivity reveals virtually no overlap in downstream targets between MsAHNs and MtAHNs, with no synapse threshold applied. Node number indicates number of neurons. Pie chart within nodes indicates fraction of output from AHNs by cell class. Edge number indicates total number of synaptic connections. Abbreviations: ascending neurons (AN; lavender), descending neurons (DN; cyan), interneurons (IN; red), motor neurons (MN; blue), sensory neurons (pink), visual centrifugal neurons (VCN; salmon), visual projection neurons (VPN; light blue). Cell class derived from ‘superclass’ annotations in FlyWire. MsAHNs colored light orange, and MtAHNs colored yellow. C) Matrices of effective connection strength (see Figure S4C) for connectivity between each AHN pair to indirect downstream neuron types at a path length of 2 in FAFB (FlyWire). Left, top 50 indirect downstream neuron types for the MsAHNs; right, top 50 for the MtAHNs. Neuron types with high effective connectivity with one AHN pair generally have no or weak effective connectivity with the other. Colored side bars indicate cell class using the same colors in A. Neuron types with per-type input <100 were excluded from the final matrix as they were typically poorly segmented. D-E) Top 5 neuron types receiving the largest synapse count per type from D) MsAHNs and E) MtAHNs in FAFB (FlyWire). Neuron types shown are LB3_2, PSp2_3, CB0214, WEDd1_1, DM1_antero_ventral_2 for MsAHNs and CB0174, WEDa1_1, JOA, DNge079, DNge230 for MtAHNs. Type names are assigned neuron types, or morphological groups if not assigned, as defined previously 46. Neurons of the same type are colored different shades of similar colors. F-G) Neuropil arborization of top direct downstream neuron types for F) MsAHNs and G) MtAHNs. Only neuropil categories with ≥10% input or output from each neuron type are shown. Only downstream types above an outlier threshold of synapse counts with AHNs (above the 3rd quartile plus 1.5 x interquartile range) are included. Type names are assigned neuron types (black labels), or morphological groups (magenta labels) if not assigned, as defined previously46. Green labels are manually assigned neuron types in this work (further see STAR Methods, Table S2). Neuropil supercategory abbreviations: ventrolateral neuropils (VLNP), ventromedial neuropils (VMNP), inferior neuropils (INP), periesophageal neuropils (PENP), gnathal ganglia (GNG). Single neuropil abbreviations: gorget (GOR), superior posterior slope (SPS), inferior posterior slope (IPS), antennal mechanosensory and motor center (AMMC), saddle (SAD). Left and right neuropils are combined, and neuropils besides those of the VMNP and PENP are further combined into supercategories. Only neuropil categories with ≥10% input or output from each neuron type are shown. See also Figure S4, Table S2.
To determine if the populations of neurons targeted by each AHN pair converge upon common 2nd order targets in the brain, we calculated the effective connection strength52 between the AHNs and all brain neurons in FlyWire. Effective connection strength is a metric that serves as a proxy for indirect connectivity from a source neuron to a target neuron through other intermediary cells (here calculated for a path length of 2). For AHN downstream connectivity, effective connection strength takes into account 1) the proportion of input synapses from AHNs onto each intermediary neuron that subsequently synapses upon a target neuron of interest, and 2) the proportion of input synapses from each intermediary neuron to the target neuron (Figure S4C). To determine effective connection strength at the level of neuron type, synapse counts for the entire connectome were first summed by type before applying the same calculations. These calculations for AHNs yielded a long-tailed distribution of effective connection strength values across cell types of the brain (Figure S4D). Similar to direct connectivity, the top indirect neuron targets for each AHN pair consisted mainly of INs followed by DNs, and the top targets for each individual AHN pair tended to have weak effective connection strength with the other AHN pair (Figure 5C). The neuropil ramification of these cells likewise show that MsAHN downstream targets largely ramify the posterior slope (Figure S4E & G) while MtAHN downstream targets largely ramify the gnathal ganglia (Figure S4F & H). Thus, these results further support the inference that each AHN pair largely targets divergent downstream pathways.
Roughly 5% of MtAHN output in FlyWire (~10% in manual tracings) target SNs, which consist entirely of Johnston’s organ neurons (JONs). These sensory cells project into the AMMC from the Johnston’s organ at the base of the antennal aristae, which are tuned to different frequencies of acoustic and mechanosensory vibrations, as well as static deflections induced by forces such as gravity and wind53–57. Information transduced by the JONs is then distributed throughout diverse sensory and motor control networks found in regions such as the saddle, vest, wedge, and AMMC58–63. The JONs targeted by the MtAHNs were either JO-A or -B subtype neurons64 which are sensitive to acoustic stimuli, suggesting that MtAHNs play a role in modulating acoustic responses. To further investigate this hypothesis, we examined whether the other downstream partners of an MtAHN receive JON input (i.e. are secondary auditory neurons). This was carried out using manually annotated synapses in CATMAID, as many JONs show signs of degradation (dark cytoplasm and irregular neurites) which may interfere with automated synapse predictions in FlyWire. Using JON connectivity that was annotated during our tracing process, or were annotated by other lab groups, we classified downstream targets of the MtAHNs by whether they were synaptically connected to the JO-A or B sensory afferents. Indeed, roughly half of MtAHN downstream connectivity originates from neurons that are connected to JONs, and the largest set (~37% of MtAHN downstream synapses) is downstream of JONs (Figure S4B). As connectivity of JONs are only sparsely traced, it is likely these numbers are underestimated. However, they imply that the MtAHNs specifically play a role in modulating or suppressing acoustic processing in both primary afferents and their downstream cells.
AHNs also have significant output in the VNC. By spanning the brain and VNC, the AHNs innervate CNS structures that fundamentally differ in their functional architecture–brain circuits may be largely constituted of higher order sensorimotor pathways, while VNC circuits constitute lower order pathways. Thus, the relative demographics targeted by AHN compartments may also differ between the brain and VNC. To investigate downstream connectivity in the VNC, we reconstructed downstream partners of AHNs in FANC, and retrieved downstream connectivity of AHNs in MANC. Similar to the brain, both AHN pairs predominantly target INs within the VNC (62-78%), yet there were more glaring differences in the remaining neuron classes targeted by each pair in the both VNC datasets (Figure 6A & B). A greater proportion of MsAHN output (10-26%) was directed towards MNs relative to the MtAHNs, whereas the MtAHNs had relatively greater downstream connectivity with SNs. Similar to brain connectivity, there was virtually no convergence in the downstream targets between the different AHN pairs (Figure 6C & D). In addition, while the output of both cells of the MsAHN pair converged upon a large number of targets, the output of the individual MtAHNs was more highly segregated from each other. Finally, there was only moderate overlap in the neuropil ramification of the top downstream neuron types of either of the MsAHNs and MtAHNs; the MsAHN partners largely occupied the wing and haltere neuropils, while the MtAHN partners largely occupied the leg neuropils, with a smaller subset occupying the wing and haltere neuropils (Figure 6G & H). This implies that within the VNC, each of the two AHN pairs mostly target separate populations of neurons and affect different sensorimotor processes, where the MsAHNs likely target wing and haltere-related networks, while the MtAHNs likely target leg-related networks.
Figure 6. Downstream connectivity of the AHNs in the VNC, and association of MsAHNs in a wing feedforward network with DNg02.
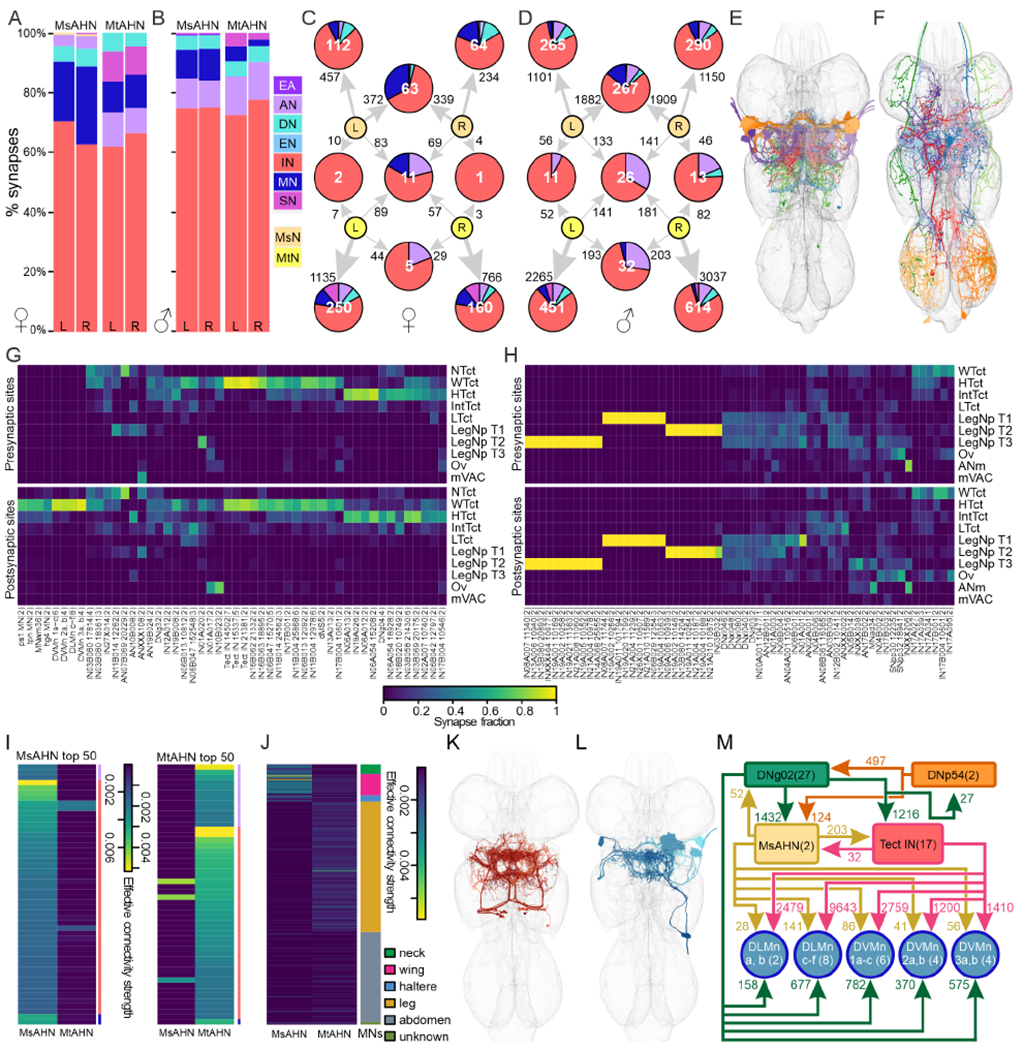
A-B) Synapse fractions of downstream partners of AHNs by neuron class in the brain in the A) FANC and B) MANC dataset. C-D) Graph plot of downstream partners of the AHNs in the C) FANC and D) MANC dataset. Node number indicates number of neurons within a neuronal category. Edge number indicates total number of synaptic connections. Pie chart within nodes indicates fraction of synaptic output from AHNs by cell class. A proportionally equivalent synapse threshold of 3 for both FANC and MANC was used to threshold individual neuron connectivity in A-D. E-F) Top 5 neuron groups receiving the largest synapse count per group from E) MsAHNs and F) MtAHNs in MANC. Neuron types shown are IN19B043 (group 14502), IN03B058 (group 21430), IN11B004 (group 25868), DVMn 1a-c, DLMn c-f for MsAHNs and AN02A001, DNxl080, IN17B003, IN21A004 (group 10978), IN04B002 for MtAHNs. G-H) Neuropil arborization of top direct downstream neuron types for G) MsAHNs and H) MtAHNs in MANC. Only downstream neuron groups above an outlier threshold of synapse counts with AHNs (above the 3rd quartile plus 1.5 x interquartile range) were included. Neuropil abbreviations: neck tectulum (NTct), wing tectulum (WTct), haltere tectulum (HTct), intermediate tectulum (IntTct), lower tectulum (LTct), prothoracic leg neuropil (LegNp T1), mesothoracic leg neuropil (LegNp T2), metathoracic leg neuropil (LegNp T3), ovoid/accessory mesothoracic neuropil (Ov), medial ventral association center (mVAC), abdominal neuromeres (ANm). Left and right neuropils are combined, and the mVACs are further combined across all thoracic segments. Only neuropil categories with ≥10% input or output from each neuron type are shown. Neuron type names are MANC annotated ‘type’, appended with morphological ‘group’ (5-6 digit number) if each type contains more than one group. Wing-tectular INs identified in panels K-M are named ‘Tect IN’ in lieu of MANC type. Number in parenthesis indicates cell count. I) Matrices of effective connection strength (see Figure S4C) for connectivity between each AHN pair to indirect downstream neuron types at a path length of 2 in FAFB (FlyWire). Left, top 50 indirect downstream neuron types for the MsAHNs; right, top 50 for the MtAHNs. Neuron types with high effective connectivity with one AHN pair generally have no or weak effective connectivity with the other. Colored side bars indicate cell class using the same colors in A. J) Matrix of effective connection strength for connectivity between each AHN pair to all MN groups in MANC at a path length of 2. MN target muscle categories: wing (pink), leg (gold), neck (green), haltere (blue) or abdominal (grey). K-L) The cell classes receiving the greatest amount of synaptic input from the MsAHNs were K) a population of wing-tectular INs (shades of red) and L) wing power MNs (shades of blue); only a subset of wing-tectular INs and one of each wing MN type are shown for clarity. M) Circuit motif depicting the relationship between the DNg02s (green), DNp54s (orange), MsAHNs (light orange), wing-tectular INs (red) and wing MNs (blue). The DNg02s and DNp54s are reciprocally connected and synapse upon the MsAHNs. The DNg02s and MsAHNs further synapse upon the wing-tectular INs and wing MNs (MNs of the dorsal longitudinal muscles; DLMn a, b and DLMn c-f, and of the dorsal ventral muscles; DVMn 1a-c, DVMn 2a, b and DVMn 3a, b). See also Figure S5.
As with the brain, we further calculated effective connection strength of AHNs to determine their second order targets in the VNC. The top indirect downstream targets of AHNs in the VNC mainly consisted of INs, with smaller numbers of other cell classes (Figure 6I). Most neuron types with strong effective connection strength with one AHN pair had weak connectivity with the other AHN pair (Figure 6I, S5D–F). As with top direct targets, most top indirect targets of MsAHNs ramify the wing and haltere neuropils (Figure S5G), while most top indirect targets of MtAHNs ramify the leg neuropils (Figure S5H). As circuits in the VNC are likely more directly associated with motor output compared to the brain, we further calculated effective connection strength from AHNs specifically to all VNC MNs. Indeed, the AHN pairs do not converge upon the same downstream 2nd order MN targets (Figure 6J). While MsAHNs predominantly target the wing MNs and have lesser connectivity with the haltere and neck MNs, the MtAHNs’ downstream IN population predominantly targets putative leg MNs (Figure 6J). Thus overall, the 1st and 2nd order downstream targets of the AHN pairs remain largely segregated within the VNC, implying that each AHN pair is involved in distinct pre-motor circuits.
MsAHNs and DNg02 Integrate Into a Wing Control Circuit
Having established that the two AHN pairs integrate considerable common input, but target separate downstream networks, we next sought to characterize the structure of these networks. We began by identifying the individual neuron types that receive the largest number of synapses from each AHN pair within MANC (Figure 6E, S5C). From the MsAHN, two sets of neurons received the greatest synaptic input; a population of wing-tectular INs (Figure 6K) and wing power MNs which innervate the dorsal longitudinal wing depressor muscles as well as the dorsal ventral wing levator muscles (Figure 6L). Interestingly, the wing-tectular INs and wing MNs formed a compact network that includes the DNg02s, DNp54s, and MsAHNs (Figure 6M). In addition to providing common input to all AHNs, the DNg02s and DNp54s synapse upon each other. Furthermore, the DNg02s synapse heavily upon the wing-tectular INs, as well as the same wing MNs targeted by the MsAHNs. Finally, the wing-tectular INs synapse heavily upon the same wing MNs targeted by the MsAHNs, thereby creating a feedforward network originating with DNg02s which are known to regulate wing motor control37,39. While the role of this network has yet to be investigated, it likely implicates the MsAHNs in a feedforward role in modulating flight power output in the DNg02 circuit. In contrast to the MsAHNs, the top downstream partners of the MtAHNs had very little interconnectivity (Figure S5A & B) and collectively consisted of a diverse set of ANs, DNs and INs (Figure 6E & F). As the MtAHNs target leg neuropils, each of which contains local circuits dedicated to control of single legs38,65–67, it is likely that the lower interconnectivity between MtAHN downstream cells at least partially reflects targeting of these semi-independent local leg circuits. Overall, these two AN pairs integrate extensively throughout non-overlapping sensory and motor neuropils in the VNC, targeting distinct downstream partners, implying that they provide information about an ongoing wing behavioral state to separate combinations of networks.
Discussion:
Coordination between motor output and sensory processing is an essential feature of locomotion, at times requiring precise interactions between neuronal classes that each serve different roles and perform different computations. Despite studies in diverse species and sensory modalities, there remain many open questions about the cellular and synaptic mechanisms underlying CDC function. For example, a precise efference copy of motor commands can be physiologically observed during visual processing in Drosophila8,68, but the cellular basis of this signal has not yet been established. Furthermore, CDCs representing different motor information can converge onto a given sensory pathway6,9,68–71, yet the combined impact of this convergence remains unknown. Finally, a single CDC can also distribute information to multiple sensory and/or motor neuropils4,7, yet functional consequences of this distribution to the coordination of multiple sensorimotor processes remain unknown. The goals of this study were to comprehensively explore the synapse-level integration of the AHNs throughout the VNC and the brain, and determine the contexts under which they are activated. The AHNs appear to be a common feature of insect nervous systems16, and the putative homologs of the MsAHNs in Manduca sexta provide a corollary discharge to the olfactory system4, a function not conserved in Drosophila16. Furthermore, as ascending CD neurons are commonly found across the animal kingdom2,72–74, this study provides the opportunity to shed light on how ascending CDCs integrate into multiple networks to help coordinate sensory and motor function.
Here, we reconstructed the AHNs and their upstream and downstream partners in EM volumes, revealing the comprehensive connectivity of the AHNs at the synapse level. However, is the connectivity of the AHNs consistent with a CDC role or the closely-related concept of efference copy? By past definitions2,75,76, corollary discharge generally refers to motor-related signals, which are relayed to other motor or sensory circuits to modulate sensorimotor processing, planning an execution, or learning. Efference copy on the other hand is a specific form of CDC, in which a circuit provides a facsimile of motor signals, that is relayed to early sensory processing networks, often to subtract reafferent sensory input. Circuit connectivity suggests that the MsAHNs relay wing motor signals to visual motion processing circuits in the brain in a corollary discharge role, while they function in the VNC as a feedforward element in a flight circuit. By comparison, the MtAHNs integrate descending wing motor commands and relay them to putative leg sensorimotor networks within the VNC suggesting a corollary discharge function, and to auditory efferents and second order auditory interneurons in the brain suggesting an efference copy function. However, since Ca2+ imaging is unable to resolve the temporal structure of AHN spiking activity, we were unable to determine if this CDC provides an exact efference copy of motor commands.
In contributing to CDC-related roles, the two AHN pairs likely represent information about ongoing wing movement plans as they receive shared excitatory input from DNs involved in flight control, and we demonstrate that AHNs become active in advance of and during flight, similar to Manduca4. Flight motor state is conveyed to several visual and visuomotor circuits in the brain77–81, likely by multiple parallel pathways through neurons that have not been identified; this study is the first to comprehensively document the connectivity of two related ascending pathways that convey flight motor information from the VNC to the brain. Indeed, the largest proportion of DN inputs to the AHNs derive from the DNg02s, which modulate wingbeat amplitude in response to widefield motion during flight37,39. In addition to the DNg02s, the DNp54s also provide shared input to both AHN pairs, and other DNs including DNg32, DNp08, and DNp38, with as-yet-unknown functions provide distinct inputs to each AHN pair, suggesting that each AHN pair integrates distinct sets of other motor-related signals converging from multiple brain neuropils. These other motor signals are likely related to neck, wing and haltere motor control, or wing-leg coordination, as the axonal processes of these DNs largely target the upper, intermediate and lower tectula of the VNC, which are associated with control of such behaviors33,34,37. Furthermore, DNs ramifying the upper tectulum tend to receive input in the posterior slope of the brain, a neuropil implicated in visual processing and navigation, while DNs ramifying the intermediate and lower tectulum are more diversely associated with several brain visuomotor processing centers and the AMMC33, suggesting that AHNs convey information related to visual and mechanosensory motor responses.
In contrast to their shared upstream connectivity, each AHN pair appears to be specialized in targeting distinct downstream networks, as their axonal processes tile largely non-overlapping regions in the VNC and brain, and each AHN pair contributes input to almost completely non-overlapping sets of neurons at the synapse level. In both the VNC and brain, interneurons comprise the bulk of downstream targets for both AHN pairs, while the remaining downstream connections (20-40%) show notable differences in cell class distribution. While DNs are a smaller proportion of AHN downstream targets, each AHNs pair targets distinct sets of DNs either directly or indirectly across the brain and VNC. These DNs themselves provide minor or no input to the AHNs. Thus, AHN connectivity forms a “zig-zag” motif where descending input to the VNC is relayed back to the brain via AHNs to modulate other descending pathways. This connectivity may allow AHNs to modulate motor-related signals delivered through these descending pathways in a CDC function. The function of these AHN downstream DNs remains to be investigated. Interestingly, the MsAHNs synapse onto circuits that are largely localized to the posterior slope, which is implicated in sensorimotor processing of wide-field visual motion responses47,48. A role in modulating wide-field motion processing is particularly compatible with a role in conveying flight motor information, as the velocity of wide-field motion perceived by the fly is expected to be far greater in flight compared to walking. Indeed, brain-wide circuits that carry out self-motion estimation are thought to integrate multisensory information and motor signals transmitted through CDCs82. The high-level organization of this system may incorporate CDCs in both higher and lower order circuits with interplay between descending and ascending pathways between the brain and nerve cord82, of which AHNs (in particular MsAHNs) may plausibly play a part in. While much of the circuit architecture of circuits that process self-motion remain to be explored, the velocity tuning of the lobula plate tangential cells which convey wide-field motion information to the posterior slope is known to be modulated by octopamine release during flight, although the exact octopaminergic cells responsible have not been identified79,83,84. MsAHNs may thus represent a parallel channel conveying flight motor information to the posterior slope or may be a component of the pathway controlling octopamine release.
In addition, the MsAHNs more frequently synapse onto wing MNs in the VNC, while the MtAHNs more frequently synapse onto sensory afferents in the brain and VNC. This implies that the MtAHNs may play a role in impacting lower order sensory processing, whereas the MsAHNs may in part impact motor output. From a network perspective, the MsAHNs are integrated into local flight circuits downstream of DNg02 and DNp54 and upstream of power MNs in the VNC, pointing towards a non-CDC feedforward role in VNC wing circuits. In comparison, MtAHN downstream circuits in the VNC have much less overlap with their upstream circuits and are largely located in the leg neuropils, suggesting a role in modulating VNC leg motor output, although more work is required to dissect the circuit details and function of these leg neuropil circuits in general. In the brain, the MtAHNs target primary sensory afferents, notably the auditory JO-A and -B afferents of the Johnston’s organ (5-10% of synapses). Interestingly, at least half of all other MtAHN synapses in the brain are directed to neurons upstream or downstream of auditory afferents, overall suggesting that MtAHNs play a role in tuning or filtration of auditory signals, perhaps from selfgenerated acoustic signals related to wing movements. This arrangement has parallels to the sound-suppressing CDC of the cricket Gryllus bimaculatus, where a single pair of ANs relays singing motor information from the VNC mesothoracic segment to auditory circuits in the prothoracic segment to suppress the auditory responses of sensory afferents and second order auditory neurons to self-generated courtship song7,85,86. While the arrangement of auditory organs fundamentally differs between flies and crickets, the common need for addressing auditory reafference has resulted in the evolution of at least superficially similar CDCs.
In summary, we identified two pairs of corollary discharge neurons that span the brain and ventral nerve cord of Drosophila and provide insights into their circuit organization as well as their possible contributions to multiple sensorimotor functions. This lays the groundwork for future behavioral analyses of how AHNs contribute to shaping and tuning these sensorimotor functions including acoustic and visuomotor responses. From a wider perspective, the AHNs are but two pairs among roughly 1,860 ANs (as surveyed in MANC), which likely function in relaying a wealth of information back to the brain including sensory, motor/behavioral, and other internal states. Significant headway has been made in understanding a handful of ANs, which play a range of roles from sensory detection to adaptive motor control68,87–96. Crucially, a broad behavioral survey and analysis of the activity of ~250 AN types suggest that most function in encoding and relaying information to the brain about high-level behavioral states such as walking and grooming, rather than low-level states such as individual limb movement96. These functions may be carried out by integration and processing of multiple sources of proprioceptive or other sensory input, or by corollary discharge from VNC motor circuits as demonstrated by the AHNs. If the results of this survey are representative of AN function at large in Drosophila, corollary discharge functions may be widespread among ANs and constitute an open field for further study.
STAR Methods:
Resource availability
Lead contact:
Further information and requests for resources and reagents should be directed to and will be fulfilled by the lead contact, Andrew M. Dacks (Andrew.Dacks@mail.wvu.edu).
Materials availability:
SplitGal4, Gal4 and LexA Drosophila stocks generated in this paper are available from the lead contact without restriction upon request.
Data and code availability:
All data is available on request from the lead contact.
All original code used for connectomics and calcium imaging analysis has been deposited at Zenodo and is publicly available as of the date of publication. The associated DOI is listed in the key resources table.
Any additional information required to reanalyze the data reported in this paper is available from the lead contact upon request.
| REAGENT or RESOURCE | SOURCE | IDENTIFIER |
|---|---|---|
| Antibodies | ||
| Rabbit anti-RFP | Rockland | Cat#600-401-379; RRID:AB_2209751 |
| Chicken anti-GFP | abcam | Cat# ab13970; RRID:AB_300798 |
| Rat anti-NCAD | Developmental Studies Hybridoma Bank | Cat#DN-Ex #8; RRID:AB_528121 |
| Rabbit anti-histamine | Immunostar | Cat#22939; RRID:AB_572245 |
| Rabbit anti-hemaglutinin | Cell Signaling Technology | Cat#3724; RRID:AB_1549585 |
| Mouse anti-V5-Alexa 555 | Bio-Rad | Cat# MCA1360D550GA; RRID:AB_2687576 |
| Rabbit anti-GABA | Sigma | Cat#A2052; RRID:AB_477652 |
| Rabbit anti-serotonin | Immunostar | Cat#20080; RRID:AB_572263 |
| Rabbit anti-tyrosine hydroxylase | Immunostar | Cat#22941; RRID:AB_572268 |
| Mouse anti-Bruchpilot (nc82) | Developmental Studies Hybridoma Bank | Cat#nc82; RRID:AB_2314866 |
| Donkey anti-chicken AlexaFluor 488 | Jackson ImmunoResearch Laboratories | Cat#703-545-155; RRID:AB_2340375 |
| Donkey anti-rabbit AlexaFluor 546 | Invitrogen | Cat#A-10040; RRID:AB_2534016 |
| Donkey anti-rat AlexaFluor 647 | Abcam | Cat#ab150155; RRID:AB_2813835 |
| Donkey anti-mouse Dylight 649 | Jackson ImmunoResearch Laboratories | Cat#715-495-150 |
| Experimental models: Organisms/strains | ||
| D. melanogaster: R48H10-GAL4 | Jenett et al.109 | BDSC #50395; RRID:BDSC_50395 |
| D. melanogaster: UAS-Cbeta\DT.I | Han et al.24 | BDSC #25039; RRID:BDSC_25039 |
| D. melanogaster: hsFlp;;MCFO | Nern et al.25 | BDSC #64085; RRID:BDSC_64085 |
| D. melanogaster: 40XUAS-IVS-mCD8::GFP | Pfeiffer et al.110 | BDSC #32195; RRID:BDSC_32195 |
| D. melanogaster: pJFRC59-13XLexAop2-IVS-myr::GFP | Pfeiffer et al.111 | Janelia Fly store; 1117286 |
| D. melanogaster: R84G04-Gal4 | Jenett et al.109 | BDSC #40403; RRID:BDSC_40403 |
| D. melanogaster: R84G04-LexA (Chr. 3) | Pfeiffer et al.110; Mobilized derivative of RRID:BDSC_54987 | BDSC #54987; RRID:BDSC_54987 |
| D. melanogaster: R17F12-p65AD | Dionne et al.112 | BDSC #68845; RRID:BDSC_68845 |
| D. melanogaster: VT049652-Gal4.DBD | Tirian et al.113 | BDSC #74970; RRID:BDSC_74970 |
| D. melanogaster: VT025938-p65AD | Tirian et al.113 | BDSC #71314; RRID:BDSC_71314 |
| D. melanogaster: VT040583-GAL4.DBD | Tirian et al.113 | BDSC #71800; RRID:BDSC_71800 |
| D. melanogaster: UAS-DenMark, UAS-syt.eGFP | Nicolaï et al.32 | BDSC #33065; RRID:BDSC_33065 |
| D. melanogaster: VT039465-p65AD;VT023750-Gal4.DBD | Namiki et al.33 | Janelia line SS02625; BDSC #75974; RRID:BDSC_75974 |
| D. melanogaster: R24A03-p65AD; R74C01-Gal4.DBD | Namiki et al.33 | Janelia line SS01062; BDSC #86738; RRID:BDSC_86738 |
| D. melanogaster: VT056359-p65AD; VT002021-Gal4.DBD | This paper | Janelia line SS96091; BDSC #87313; RRID:BDSC_87313 |
| D. melanogaster: 10XUAS-IVS-mCD8::RFP}attP18,P{y[+t7.7]w[+mC]=13XLexAop2-mCD8::GFP}su(Hw)attP8 | Pfeiffer et al.110 | BDSC #32229; RRID:BDSC_32229 |
| D. melanogaster: pJFRC28-10XUAS-IVS-GFP-p10 in attP2 | Pfeiffer et al.111 | Janelia Fly store #1116592 |
| D. melanogaster: ChAT-Trojan-LexA | Diao et al.40 | BDSC #60317; RRID:BDSC_60317 |
| D. melanogaster: vGlut-Trojan-LexA | Diao et al.40 | BDSC #60314; RRID:BDSC_60314 |
| D. melanogaster: GAD1-Trojan-LexA | Diao et al.40 | BDSC #60324; RRID:BDSC_60314 |
| D. melanogaster: 20XUAS-IVS-Syn21-jGCaMP7f-p10 in su(Hw)attP5 | Dana et al.41 | BDSC #80906; RRID:BDSC_80906 |
| D. melanogaster: 20XUAS-IVS-Syn21-jGCaMP7f-p10 in VK00005 | Dana et al.41 | BDSC #79031; RRID:BDSC_79031 |
| D. melanogaster: 20XUAS-IVS-Syn21-jGCaMP7b-p10 in su(Hw)attP5 | Dana et al.41 | BDSC #80907; RRID:BDSC_80907 |
| D. melanogaster: 20XUAS-IVS-Syn21-jGCaMP7b-p10 in VK00005 | Dana et al.41 | BDSC #79029; RRID:BDSC_79029 |
| D. melanogaster: 13XLexAop2-IVS-Syn21-jGCaMP7f in VK00005 | Dana et al.41 | BDSC #80914; RRID:BDSC_80914 |
| D. melanogaster: 13xLexAop2-IVS-Syn21-jGCaMP7f in su(Hw)attP5 | Dana et al.41 | Janelia Fly Store #3032633 |
| D. melanogaster: 20xUAS-CsChrimson-tdTomato-trafficked in su(Hw)attP1 | Klapoetke et al.42 | Janelia Fly Store #3015695 |
| Software and algorithms | ||
| R version 4.1.1 | The R Foundation | https://www.r-project.org/ |
| Fiji ver 2.3.0/1.53f51 | Schindelin et al.107 | https://fiji.sc/ |
| Scanimage version 2016 | Pologruto et al.106 | https://www.mbfbioscience.com/products/scanimage/ |
| μManager | Edelstein et al.105 | https://micro-manager.org/ |
| Code for connectomics and calcium imaging analyses | This paper; GitHub; Zenodo | https://doi.org/10.5281/zenodo.10557545 |
Experimental model and study participant details
Animals used in this study.
All fly stocks were raised on a standard cornmeal/agar/yeast medium at 24 or 25°C on a 12:12 light/dark cycle at ~60% humidity. Flies used for calcium imaging experiments during flight were housed in mixed cultures and aged to 3-5 days old before imaging. For optogenetic stimulation of DNg02 by CsChrimson with 2-photon Ca2+ imaging of MtAHNs, parental flies were allowed to lay eggs on standard cornmeal media containing 0.2 mM all-trans retinal. Newly-eclosed offspring (≤1 day post-eclosion) were transferred to cornmeal media containing 0.4 mM all-trans retinal and aged for 3-4 days before use in experiments. All fly cultures containing all-trans retinal were shielded from light. Flies used for calcium imaging and optogenetic stimulation experiments were of mixed sex in roughly equal numbers. The fly stocks used in this study are summarized in the Key Resources Table and Table S1.
Method details
Immunohistochemistry
Intact brain and ventral nerve cords were dissected in Drosophila saline97 and fixed in 4% paraformaldehyde (PFA) at 4°C for 30 minutes, unless immunostaining for histamine in which samples were fixed in 4% 1-Ethyl-3-(3-Dimethylaminopropyl) carbodiimide in PBS at 4°C for 2 hours before post-fixing in 4% PFA at 4°C for 30 minutes. Samples were then washed 4X in PBST (PBS with 0.5% Triton X-100) and blocked for 1 hour in 2% BSA (in PBST and 50mM sodium azide), except when labeling for histamine in which 3% normal goat serum (in PBST and 50mM sodium azide) was used as the blocking agent. Primary antibodies (see Key Resources Table for antibody details) were applied for 48 hours at 4°C with agitation. After, samples were washed 4X in PBST and blocked as described above. Secondary antibodies were applied and incubated for 48 hours in 4°C with agitation. Samples were then washed 2X in PBST and 2X in PBS before being run through an ascending glycerol series (40%, 60% and 80%) for 10 minutes each. Samples were mounted in VectaShield. Images were analyzed with an Olympus FV1000 BX61 (Shinjuku, Tokyo, Japan) confocal, using Fluoview FV1000 software with a 20X UPlanSApo, 40x UPlanFL-N or 60x PlanApo-N oil-immersion objective.
Circuit reconstruction and connectomic analyses:
The AHNs were reconstructed and their pre- and postsynaptic sites annotated in the Female Adult Nerve Cord (“FANC”) dataset27,28 and the Full Adult Fly Brain (“FAFB”) datasets26 using CATMAID (Collaborative Annotation Toolkit for Massive Amounts of Image Data)43,98. We further identified the AHNs in the Male Adult Nerve Cord (“MANC”) by their morphology and connectivity29,30. We identified the following cells as the top AHN candidates in VNC and brain EM volumes: For MsAHNs, skeleton IDs 237078 and 402598 in FANC CATMAID (segment IDs 648518346499994886 and 648518346489573207 in FANC autosegmentation), bodyIDs 13926 and 12536 in MANC, and skeleton IDs 2455455 and 2455571 in FAFB CATMAID (segment IDs 720575940626130469 and 720575940630175276 in FlyWire); for MtAHNs, skeleton IDs 313368 and 250373 in FANC CATMAID (segment IDs 648518346488561230 and 648518346475813602 in FANC autosegmentation), bodyIDs 42819 and 11003 in MANC, and skeleton IDs 3385431 and 17138817 in FAFB CATMAID (segment IDs 720575940614269393 and 720575940622346876 in FlyWire). Pre- and postsynaptic partners were reconstructed either manually or using autosegmentation AI developed for FAFB99 and FANC27. For FANC, we reconstructed all presynaptic partners of the AHNs, while postsynaptic partners were reconstructed in the autosegmentation volume only for bodies with an initial synapse count of ≥3 with any AHN. For FAFB, we reconstructed postsynaptic partners for ~50% of downstream connections of MsAHN-L and MtAHN-L, not counting orphan fragments. Reconstruction was carried out by first connecting synapses from AHNs to prior traced neurons (by other labs), then tracing remainder downstream partners by random sampling of postsynaptic sites connected to AHNs, until 50% of downstream connections have been traced. We further retrieved upstream and downstream connectivity from the FlyWire public release dataset (v630) via custom R scripts. For MANC, we retrieved upstream and downstream connectivity of AHNs from neuprint (https://neuprint.janelia.org/?dataset=manc) for the MANC dataset (v1.2) via custom R scripts, and further filtered connectivity only with ‘valid’ neurons (has a neuron class entry in the neuprint ‘class’ field). Traced or annotated upstream and downstream connection counts of AHNs in all 3 EM volumes are summarized in Table 1. The automated synapse predictions in MANC yielded larger upstream and downstream synapse counts for AHNs compared to manual synapse annotations in FANC, possibly due to differences in EM volume preparation and imaging, most notably lower T-bar staining intensity in FANC as well as higher voxel resolution in the Z-plane for MANC (8x8x8 nm3) compared to FANC (4.3x4.3x45 nm3).
Data analysis and visualization was carried out with R version 4.1.1 with the following packages: fancr (https://github.com/flyconnectome/fancr), fafbseg100 (https://github.com/natverse/fafbseg), reticulate (https://github.com/rstudio/reticulate), googlesheets4 (https://github.com/tidyverse/googlesheets4), neuprintr100 (https://natverse.org/neuprintr/), malevnc (https://github.com/natverse/malevnc), nat100 and nat-nblast31, catmaid (https://github.com/natverse/rcatmaid), igraph (https://github.com/igraph/igraph), ggplot2 (https://github.com/tidyverse/ggplot2), plyr (https://github.com/hadley/plyr), gplots (https://github.com/cran/gplots), viridis (https://github.com/sjmgarnier/viridis), dplyr (https://github.com/tidyverse/dplyr), tidyr (https://github.com/tidyverse/tidyr), dendsort101, RColorBrewer (https://cran.r-project.org/package=RColorBrewer), svglite (https://svglite.r-lib.org), elmr100 (https://github.com/natverse/elmr).
We used NBLAST31 in two ways, first as a method to determine if neurons with similar morphologies to the 2 pairs of AHNs were present in the FANC and MANC volumes, and second to match DN types connected to the AHNs in FANC to DNs in MANC. To find cells with similar morphology to the AHNs in MANC, we retrieved skeletons for our top pair of MsAHN and MtAHN candidates, as well as skeletons for all MANC neurons with soma in T2 or T3. Skeletons were rescaled to micron dimensions, small neurites less than 10 μm long were pruned to reduce spurious short-length projections resulting from skeletonization methods, and skeletons were then registered to a symmetrized MANC template provided via the malevnc package. We carried out NBLAST via the R nat-nblast package31 using the version 2 algorithm optimized for Drosophila neurons, for each of the two MsAHN and MtAHN candidates against the set of MANC neurons with soma in T2 or T3, respectively. To determine the top 5 matches against the MsAHN and MtAHN cell types, we pooled the top hits for each pair of cells, removed redundant matches between the cell pairs and self-matches, then took the top 5 cells rank-ordered by NBLAST score.
To determine FANC DN types, we skeletonized neuron meshes (wavefront method) for DNs upstream and downstream of AHNs from the FANC autosegmentation volume via the skeletor python package (https://github.com/navis-orq/skeletor). FANC skeletons were registered to MANC space via a FANC-to-MANC registration provided in the R malevnc package. For MANC DNs, we retrieved skeletons for all DNs from the MANC neuprint server (https://neuprint.janelia.org/). All skeletons were rescaled to micron dimensions, and small neurites less than 10 μm long were pruned. NBLAST between each FANC DN and the entire set of MANC DNs (plus the FANC DN itself for normalization of NBLAST scores) was carried out with the version 2 NBLAST algorithm. The top 10 hits from MANC were then manually compared with the reference neuron from FANC to verify matches.
We used CATMAID or custom R code to generate synapse fraction and connectivity graph plots. To summarize connectivity by neuron classes for all EM volumes, classes were manually annotated in FANC and FAFB (CATMAID), and were adapted from MANC ‘class’ annotations in MANC and ‘superclass’ annotations in FAFB (FlyWire)46. For FANC, we used a synapse count threshold of 3 as a minimum threshold for defining significant synaptic partners of AHNs. Upstream and downstream synapse count thresholds are higher in MANC compared to FANC. Thus, to establish an equivalent threshold, we used the ratio of upstream connections provided by ‘valid’ neurons (not counting orphan fragments) for all AHNs in MANC to that of FANC, multiplied by the FANC synapse threshold and rounded, as the MANC upstream threshold. For the MANC downstream threshold, we used the sum of AHN downstream synapses in FANC provided by both valid neurons and undetermined bodies for calculating this ratio, as we had selectively reconstructed and proofread only bodies that had an initial downstream synapse count of 3 or more with AHNs. These calculations yielded an upstream synapse count threshold of 10 and downstream synapse count threshold of 3 for MANC AHNs. To generate the synapse distribution figures, we plotted the xy and xz coordinates of the locations of the skeleton nodes and of the input synapses of the left AHNs from FANC (CATMAID). For further analysis, neuron types in MANC were derived from MANC ‘type’ annotations, appended with morphological ‘group’ annotations if more than one ‘group’ was within a ‘type’. For FlyWire, neuron types were considered to be assigned neuron types in FlyWire metadata, or morphological groups if not assigned, as defined previously46. In addition, a minority of neurons upstream or downstream of AHNs in FlyWire were further manually annotated with a type in this work (Table S2). FANC neurons were not assigned types except for DNs (see next paragraph).
To summarize AHN upstream connectivity with DNs, we categorized upstream DNs above the established synapse thresholds by their cell type, as determined by curation in MANC by the Jefferis group38 and our NBLAST of FANC DNs to MANC DNs. FANC DN identities were further corroborated with the Jefferis group (personal communication). We defined the most significant DN inputs to the AHNs as contributing ≥5% of DN input by type-to-type connectivity (that is, by sum of connectivity for all DNs of the same type to all AHNs of the same type). DNs below this threshold were placed into the “DN (summed)” category for plotting of DN synapse fractions and graphs.
To calculate the effective connection strength52 from the AHNs to indirect downstream targets in MANC and FlyWire, we retrieved synapse connectivity between all valid neurons in each volume, collapsed connectivity by cell type or ‘synonym’ annotations in MANC (grouping by anatomical origin and cell morphology for SNs), and converted synapse weights to input fractions. For each neuron type, we calculated effective connection strength for a path length of 2 (one synaptic hop) downstream of AHNs. That is, for each possible intermediary neuron, the input fraction contributed by AHNs to this neuron is multiplied by the input fraction contributed by the neuron to the indirect downstream target; the effective connection strength of an AHN to the indirect downstream target is the sum of these multiplied numbers for all intermediary neurons. These calculations were carried out by matrix multiplication of adjacency matrices of input fractions. For the VNC, paths through DNs or SNs were not considered, as they either receive input outside the VNC or are driven by non-neuronal inputs. Similarly, for the brain, paths through ANs and SNs were not considered.
For ROI input and output of AHN downstream partners in MANC and FlyWire, we retrieved ROI presynaptic and postsynaptic site counts for these partners, combined counts for left and right neuropils and normalized them by their totals for each neuron type. For FlyWire, neuropils were further combined into supercategories as defined previously102. For MNs, we set their presynaptic site count to zero, as manual examination in the EM volume suggested that most predicted sites for these MNs are false positives.
Ca2+ Imaging:
Imaging of flies was carried out on a custom-built two-photon/epifluorescence microscope. No methods of sample size estimation were used prior to carrying out these calcium imaging experiments. To image AHN somas during flight, we cold anesthetized flies, removed legs and mounted flies ventral side up on custom-made fly holders103 with Loctite AA 3972 (Part# 36294) light-activated glue. We dissected through the ventral side of the thorax in external saline (103 mM NaCl, 3 mM KCl, 5 mM TES, 8 mM trehalose-2H2O, 10 mM glucose, 26 mM NaHCO3, 1 mM NaH2PO4, 1.5 mM CaCl2-2H2O, 4 mM MgCl2, 270-275 mOsm)104 saturated with carbogen (95% O2/5% CO2). We used epifluorescence imaging to measure Ca2+ activity of AHNs during flight, as thoracic vibrations caused by flight affected capture of the optically-sectioned 2-photon image stacks. Epifluorescence imaging of AHN somata was carried out through a Nikon CFI75 LWD 16X W objective with a pco.edge 5.5 monochrome camera (pco.) at 20 Hz using μManager software105, with excitation by a 470 nm LED source, and a filter set consisting of a 495 nm dichroic beamsplitter (Semrock), 447/60 nm excitation (Semrock) and 525/80 nm emission filter (MidOpt). The behavior of the fly was simultaneously monitored with a Blackfly S BFS-U3-04S2M-CS monochrome camera (FLIR) imaging a lateral view of the fly at 100 Hz with a 845/60 nm bandpass filter (MidOpt) under near-IR illumination. Imaging was initiated in both the Ca2+ and behavioral cameras using a simultaneous start signal. To induce flight, an airpuff was delivered to the head ~10 seconds into the imaging period, and flies were imaged for an additional 20 seconds. Flight trials were carried out 3 times per fly. Six to nine flies which flew robustly for all 3 trials were used for further analysis.
To carry out high-speed Ca2+ imaging in MsAHNs to determine timing of Ca2+ rise relative to flight initiation, epifluorescence was carried out using the same method outlined in the prior paragraph, except with the Ca2+ imaging camera carrying out imaging at 100 Hz, and frame-wise synchronization with the behavioral imaging camera was carried out by triggering frame capture in the behavioral imaging camera using the Ca2+ imaging camera’s GPIO strobe output. Nine flies which flew robustly for all 3 trials were used for further analysis.
For imaging of DNg02 dendrites during flight, we head-fixed flies and dissected through the posterior surface of the head. Two-photon imaging was carried out with a 920 nm Insight DS+ pulsed laser (MKS Instruments) at 7-8.5 mW power, with emission detected through a Nikon CFI75 LWD 16X W objective by a photomultiplier tube (Hamamatsu H10770PB-40-SEL) through a 503/40 nm dichroic filter (Semrock). Volume imaging was carried out at a rate of 14.14 Hz (10 z-slices with 5 μm increments). Microscope control and image capture was controlled through Scanimage software version 2016106. Induction of flight and monitoring of fly behavior was carried out as for imaging of AHN somata. Flight trials were carried out 3 times per fly. Six flies which flew robustly for all 3 trials were used for further analysis.
For imaging of MtAHNs with optogenetic stimulation of DNg02s, flies were mounted ventral side up and dissected through the ventral thorax as for imaging of AHN soma. Two-photon imaging was carried out for MtAHN soma as for imaging of DNg02 dendrites above. To carry out optogenetic stimulation of DNg02s, red light from a 660 nm LED source filtered through a 661/20 nm dichroic filter (Semrock) was presented for one second through the objective. Optogenetic stimulation was carried out 3 times per fly. Six flies per experimental condition were tested.
Quantification and statistical analysis
Image analysis for AHNs and DNg02s was carried out in Fiji ver 2.3.0/1.53f51107. Image stacks acquired using 2-photon microscopy were first flattened via sum slices projection. For AHN flight experiments, motion in the VNC was observed during flight, which we corrected using a rigid motion correction method implemented in the moco ImageJ plugin108. This method could correct for motion artifacts within the plane of focus but not for those in the Z-axis. ROIs were then manually drawn around the AHN somas or DNg02 dendrites, as well as in an empty area of the neuropil around the soma for background subtraction, and the signal intensity within these ROIs were measured across time. Flight initiation was manually annotated in behavioral capture videos as the first frame of visible wing spreading. Further data processing and figure generation was carried out in MATLAB ver 2019b. Baseline fluorescence was measured in the 5-second period before flight induction and used to normalize fluorescence intensity changes across each Ca2+ trace. If more than one soma was observable per fly, quantification and plotting was carried out separately for each soma.
To analyze timing of Ca2+ rise relative to timing of flight initiation in high-speed Ca2+ imaging of MsAHNs, processing of image stacks and flight initiation annotation was carried out as above. Further analyses were carried out in R with the ggplot2, signal (https://r-forge.r-project.org/projects/signal) and exactRankTests (https://cran.r-project.org/package=exactRankTests) packages. Fluorescence was normalized by the baseline in the period 0.5 to 5 seconds before flight initiation. To determine the Ca2+ rise timing, Ca2+ traces were low-pass filtered with a Butterworth filter (4th order, 5 Hz cutoff), and a 1s window around the flight initiation timing was searched to find all inflection points in the slope of the Ca2+ trace (sign change in the third differential). The inflection point that had the largest value of the second differential of the Ca2+ trace was considered to be the Ca2+ rise timing. However, some Ca2+ traces show momentary Z-motion artifacts from airpuff delivery. If the inflection point was within a region with negative dF/F, the first point of positive dF/F in the low-pass filtered trace following the inflection point was considered the start of the Ca2+ rise. The per-fly mean of the difference of Ca2+ rise timing and flight initiation timing was calculated, and the one-sample Wilcoxon signed rank test was used to determine if per-fly means were significantly below zero (α = 0.05). This nonparametric test was used as normality could not clearly be determined for the given sample size (9 flies).
Information about sample sizes are found within the figure legends for calcium imaging quantification.
Supplementary Material
Video S1. Example of Ca2+ activity in MsAHNs with synchronized behavioral recording upon induction of flight, related to Figure 4.
Video S2. Example of Ca2+ activity in MtAHNs with synchronized behavioral recording upon induction of flight, related to Figure 4.
Highlights.
Ascending histaminergic neurons (AHNs) form a corollary discharge circuit
AHNs integrate input from multiple brain descending neuron types
AHNs become active shortly before induction of flight behavior
AHNs target brain and nerve cord sensory and motor networks
Acknowledgements:
This work was funded by an AFOSR FA9550-17-1-0117 and NSF 2127379 to KCD and AMD, a Howard Hughes Medical Institute Janelia Research Campus Visiting Scientist Program project to KCD, AMD, HSJC and GMC, and NIMH117808 to WAL. We thank Maggie Robertson, Emily Tenshaw, Julie Kovalyak, Danielle Matheny, Malia Miller, Emmanuel Mbamalu, Jason Polsky, Shada Alghailani, Melissa Ryan, Srividya Murthy, and Ruchi Parekh for assistance with tracing and proofreading efforts in EM datasets and Danielle Matheny for assistance with collecting confocal optical stacks. We thank the Janelia FlyEM Project team for providing pre-publication access to the Male Adult Nerve Cord connectome dataset. We thank Dr. Phillip Chapman for assistance with early experiments in this project. We thank Drs. Tyler Sizemore, Kaylynn Coates, Julius Jonaitis, Katharina Eichler, Gregory Jefferis for technical advice. We thank Drs. Katharina Eichler, Gregory Jefferis and Marta Costa for access to light microscopy level identification of descending neurons in the Male Adult Nerve Cord dataset, and corroboration of descending neuron matches in the female adult nerve cord dataset to the Male Adult Nerve Cord dataset. We thank Dr. Gregory Jefferis for pre-publication access to the malevnc R package. We thank Shigehiro Namiki, the Janelia FlyLight Project team, Janelia Fly Descending Interneuron Project team and Janelia Project Technical Resources for providing pre-publication access to light-level descending neuron typing information including that of DNp54, image of the SS02625 (DNg02) splitGal4 expression pattern, and screening of the DNp54 splitGal4 line SS96091 (VT056359AD; VT002021DBD). The Drosophila line 13xLexAop2-IVS-Syn21-jGCaMP7f in su(Hw)attP5 is a kind gift from Dr. Vivek Jayaraman. Ongoing development of the natverse including the fafbseg package is supported by the NIH BRAIN Initiative (grant 1RF1MH120679-01) and the Medical Research Council (MC_U105188491). MB received support from the Summer Undergraduate Research Experience program at WVU.
Footnotes
Publisher's Disclaimer: This is a PDF file of an unedited manuscript that has been accepted for publication. As a service to our customers we are providing this early version of the manuscript. The manuscript will undergo copyediting, typesetting, and review of the resulting proof before it is published in its final form. Please note that during the production process errors may be discovered which could affect the content, and all legal disclaimers that apply to the journal pertain.
Declaration of interests:
The authors have no competing interests.
References
- 1.von Holst E, and Mittelstaedt H (1950). Das Reafferenzprinzip. Naturwissenschaften 37, 464–476. 10.1007/BF00622503. [DOI] [Google Scholar]
- 2.Straka H, Simmers J, and Chagnaud BP (2018). A new perspective on predictive motor signaling. Curr. Biol 28, R232–R243. 10.1016/j.cub.2018.01.033. [DOI] [PubMed] [Google Scholar]
- 3.Fee MS, Mitra PP, and Kleinfeld D (1997). Central versus peripheral determinants of patterned spike activity in rat vibrissa cortex during whisking. J. Neurophysiol 78, 1144–1149. 10.1152/jn.1997.78.2.1144. [DOI] [PubMed] [Google Scholar]
- 4.Chapman PD, Burkland R, Bradley SP, Houot B, Bullman V, Dacks AM, and Daly KC (2018). Flight motor networks modulate primary olfactory processing in the moth Manduca sexta. Proc Natl Acad Sci USA 115, 5588–5593. 10.1073/pnas.1722379115. [DOI] [PMC free article] [PubMed] [Google Scholar]
- 5.Chagnaud BP, and Bass AH (2013). Vocal corollary discharge communicates call duration to vertebrate auditory system. J. Neurosci 33, 18775–18780. 10.1523/JNEUROSCI.3140-13.2013. [DOI] [PMC free article] [PubMed] [Google Scholar]
- 6.Schneider DM, Nelson A, and Mooney R (2014). A synaptic and circuit basis for corollary discharge in the auditory cortex. Nature 513, 189–194. 10.1038/nature13724. [DOI] [PMC free article] [PubMed] [Google Scholar]
- 7.Poulet JFA, and Hedwig B (2006). The cellular basis of a corollary discharge. Science 311, 518–522. 10.1126/science.1120847. [DOI] [PubMed] [Google Scholar]
- 8.Kim AJ, Fitzgerald JK, and Maimon G (2015). Cellular evidence for efference copy in Drosophila visuomotor processing. Nat. Neurosci 18, 1247–1255. 10.1038/nn.4083. [DOI] [PMC free article] [PubMed] [Google Scholar]
- 9.Suga N, and Jen PH (1975). Peripheral control of acoustic signals in the auditory system of echolocating bats. J. Exp. Biol 62, 277–311. 10.1242/jeb.62.2.277. [DOI] [PubMed] [Google Scholar]
- 10.Drexl M, and Kössl M (2003). Sound-evoked efferent effects on cochlear mechanics of the mustached bat. Hear. Res 184, 61–74. 10.1016/s0378-5955(03)00235-1. [DOI] [PubMed] [Google Scholar]
- 11.McGrath JJ, Saha S, Al-Hamzawi A, Alonso J, Bromet EJ, Bruffaerts R, Caldas-de-Almeida JM, Chiu WT, de Jonge P, Fayyad J, et al. (2015). Psychotic Experiences in the General Population: A Cross-National Analysis Based on 31,261 Respondents From 18 Countries. JAMA Psychiatry 72, 697–705. 10.1001/jamapsychiatry.2015.0575. [DOI] [PMC free article] [PubMed] [Google Scholar]
- 12.Morris GO (1960). Misperception and disorientation during sleep deprivation. Arch. Gen. Psychiatry 2, 247. 10.1001/archpsyc.1960.03590090003002. [DOI] [Google Scholar]
- 13.Feinberg I, and Guazzelli M (1999). Schizophrenia--a disorder of the corollary discharge systems that integrate the motor systems of thought with the sensory systems of consciousness. Br. J. Psychiatry 174, 196–204. 10.1192/bjp.174.3.196. [DOI] [PubMed] [Google Scholar]
- 14.Ford JM, and Mathalon DH (2004). Electrophysiological evidence of corollary discharge dysfunction in schizophrenia during talking and thinking. J. Psychiatr. Res 38, 37–46. 10.1016/s0022-3956(03)00095-5. [DOI] [PubMed] [Google Scholar]
- 15.Bradley SP, Chapman PD, Lizbinski KM, Daly KC, and Dacks AM (2016). A Flight Sensory-Motor to Olfactory Processing Circuit in the Moth Manduca sexta. Front. Neural Circuits 10, 5. 10.3389/fncir.2016.00005. [DOI] [PMC free article] [PubMed] [Google Scholar]
- 16.Chapman PD, Bradley SP, Haught EJ, Riggs KE, Haffar MM, Daly KC, and Dacks AM (2017). Co-option of a motor-to-sensory histaminergic circuit correlates with insect flight biomechanics. Proc. Biol. Sci 284. 10.1098/rspb.2017.0339. [DOI] [PMC free article] [PubMed] [Google Scholar]
- 17.Sane SP (2006). Induced airflow in flying insects I. A theoretical model of the induced flow. J. Exp. Biol 209, 32–42. 10.1242/jeb.01957. [DOI] [PubMed] [Google Scholar]
- 18.Sane SP, and Jacobson NP (2006). Induced airflow in flying insects II. Measurement of induced flow. J. Exp. Biol. 209, 43–56. 10.1242/jeb.01958. [DOI] [PubMed] [Google Scholar]
- 19.Nässel DR, Pirvola U, and Panula P (1990). Histaminelike immunoreactive neurons innervating putative neurohaemal areas and central neuropil in the thoraco-abdominal ganglia of the flies Drosophila and Calliphora. J. Comp. Neurol 297, 525–536. 10.1002/cne.902970406. [DOI] [PubMed] [Google Scholar]
- 20.Pollack I, and Hofbauer A (1991). Histamine-like immunoreactivity in the visual system and brain of Drosophila melanogaster. Cell Tissue Res. 266, 391–398. 10.1007/BF00318195. [DOI] [PubMed] [Google Scholar]
- 21.Nässel DR, and Elekes K (1992). Aminergic neurons in the brain of blowflies and Drosophila: dopamine- and tyrosine hydroxylase-immunoreactive neurons and their relationship with putative histaminergic neurons. Cell Tissue Res. 267, 147–167. 10.1007/BF00318701. [DOI] [PubMed] [Google Scholar]
- 22.Melzig J, Buchner S, Wiebel F, Wolf R, Burg M, Pak WL, and Buchner E (1996). Genetic depletion of histamine from the nervous system of Drosophila eliminates specific visual and mechanosensory behavior. Journal of Comparative Physiology a-Sensory Neural and Behavioral Physiology 179, 763–773. [DOI] [PubMed] [Google Scholar]
- 23.Buchner E, Buchner S, Burg MG, Hofbauer A, Pak WL, and Pollack I (1993). Histamine is a major mechanosensory neurotransmitter candidate in Drosophila melanogaster. Cell Tissue Res. 273, 119–125. 10.1007/BF00304618. [DOI] [PubMed] [Google Scholar]
- 24.Han DD, Stein D, and Stevens LM (2000). Investigating the function of follicular subpopulations during Drosophila oogenesis through hormone-dependent enhancer-targeted cell ablation. Development 127, 573–583. 10.1242/dev.127.3.573. [DOI] [PubMed] [Google Scholar]
- 25.Nern A, Pfeiffer BD, and Rubin GM (2015). Optimized tools for multicolor stochastic labeling reveal diverse stereotyped cell arrangements in the fly visual system. Proc Natl Acad Sci USA 112, E2967–76. 10.1073/pnas.1506763112. [DOI] [PMC free article] [PubMed] [Google Scholar]
- 26.Zheng Z, Lauritzen JS, Perlman E, Robinson CG, Nichols M, Milkie D, Torrens O, Price J, Fisher CB, Sharifi N, et al. (2018). A Complete Electron Microscopy Volume of the Brain of Adult Drosophila melanogaster. Cell 174, 730–743.e22. 10.1016/j.cell.2018.06.019. [DOI] [PMC free article] [PubMed] [Google Scholar]
- 27.Phelps JS, Hildebrand DGC, Graham BJ, Kuan AT, Thomas LA, Nguyen TM, Buhmann J, Azevedo AW, Sustar A, Agrawal S, et al. (2021). Reconstruction of motor control circuits in adult Drosophila using automated transmission electron microscopy. Cell 184, 759–774.e18. 10.1016/j.cell.2020.12.013. [DOI] [PMC free article] [PubMed] [Google Scholar]
- 28.Azevedo AW, Lesser E, Mark B, Phelps JS, Elabbady L, Kuroda S, Sustar AE, Moussa AJ, Kandelwal A, Dallmann CJ, et al. (2022). Tools for comprehensive reconstruction and analysis of Drosophila motor circuits. BioRxiv. 10.1101/2022.12.15.520299. [DOI] [Google Scholar]
- 29.Marin EC, Morris BJ, Stuerner T, Champion AS, Krzeminski D, Badalamente G, Gkantia M, Dunne CR, Eichler K, Takemura S, et al. (2023). Systematic annotation of a complete adult male Drosophila nerve cord connectome reveals principles of functional organisation. BioRxiv. 10.1101/2023.06.05.543407. [DOI] [Google Scholar]
- 30.Takemura S, Hayworth KJ, Huang GB, Januszewski M, Lu Z, Marin EC, Preibisch S, Xu CS, Bogovic J, Champion AS, et al. (2023). A connectome of the male drosophila ventral nerve cord. BioRxiv. 10.1101/2023.06.05.543757. [DOI] [Google Scholar]
- 31.Costa M, Manton JD, Ostrovsky AD, Prohaska S, and Jefferis GSXE (2016). NBLAST: rapid, sensitive comparison of neuronal structure and construction of neuron family databases. Neuron 91, 293–311. 10.1016/j.neuron.2016.06.012. [DOI] [PMC free article] [PubMed] [Google Scholar]
- 32.Nicolaï LJJ, Ramaekers A, Raemaekers T, Drozdzecki A, Mauss AS, Yan J, Landgraf M, Annaert W, and Hassan BA (2010). Genetically encoded dendritic marker sheds light on neuronal connectivity in Drosophila. Proc Natl Acad Sci USA 107, 20553–20558. 10.1073/pnas.1010198107. [DOI] [PMC free article] [PubMed] [Google Scholar]
- 33.Namiki S, Dickinson MH, Wong AM, Korff W, and Card GM (2018). The functional organization of descending sensory-motor pathways in Drosophila. eLife 7. 10.7554/eLife.34272. [DOI] [PMC free article] [PubMed] [Google Scholar]
- 34.Court R, Namiki S, Armstrong JD, Börner J, Card G, Costa M, Dickinson M, Duch C, Korff W, Mann R, et al. (2020). A systematic nomenclature for the drosophila ventral nerve cord. Neuron 107, 1071–1079.e2. 10.1016/j.neuron.2020.08.005. [DOI] [PMC free article] [PubMed] [Google Scholar]
- 35.Stuart GJ, and Spruston N (2015). Dendritic integration: 60 years of progress. Nat. Neurosci 18, 1713–1721. 10.1038/nn.4157. [DOI] [PubMed] [Google Scholar]
- 36.Cover KK, and Mathur BN (2021). Axo-axonic synapses: Diversity in neural circuit function. J. Comp. Neurol 529, 2391–2401. 10.1002/cne.25087. [DOI] [PMC free article] [PubMed] [Google Scholar]
- 37.Namiki S, Ros IG, Morrow C, Rowell WJ, Card GM, Korff W, and Dickinson MH (2022). A population of descending neurons that regulates the flight motor of Drosophila. Curr. Biol 32, 1189–1196.e6. 10.1016/j.cub.2022.01.008. [DOI] [PMC free article] [PubMed] [Google Scholar]
- 38.Cheong HSJ, Eichler K, Stuerner T, Asinof SK, Champion AS, Marin EC, Oram TB, Sumathipala M, Venkatasubramanian L, Namiki S, et al. (2023). Transforming descending input into behavior: The organization of premotor circuits in the Drosophila Male Adult Nerve Cord connectome | bioRxiv. 10.1101/2023.06.07.543976v1. [DOI] [Google Scholar]
- 39.Palmer EH, Omoto JJ, and Dickinson MH (2022). The role of a population of descending neurons in the optomotor response in flying Drosophila. BioRxiv. 10.1101/2022.12.05.519224. [DOI] [Google Scholar]
- 40.Diao F, Ironfield H, Luan H, Diao F, Shropshire WC, Ewer J, Marr E, Potter CJ, Landgraf M, and White BH (2015). Plug-and-play genetic access to drosophila cell types using exchangeable exon cassettes. Cell Rep. 10, 1410–1421. 10.1016/j.celrep.2015.01.059. [DOI] [PMC free article] [PubMed] [Google Scholar]
- 41.Dana H, Sun Y, Mohar B, Hulse BK, Kerlin AM, Hasseman JP, Tsegaye G, Tsang A, Wong A, Patel R, et al. (2019). High-performance calcium sensors for imaging activity in neuronal populations and microcompartments. Nat. Methods 16, 649–657. 10.1038/s41592-019-0435-6. [DOI] [PubMed] [Google Scholar]
- 42.Klapoetke NC, Murata Y, Kim SS, Pulver SR, Birdsey-Benson A, Cho YK, Morimoto TK, Chuong AS, Carpenter EJ, Tian Z, et al. (2014). Independent optical excitation of distinct neural populations. Nat. Methods 11, 338–346. 10.1038/nmeth.2836. [DOI] [PMC free article] [PubMed] [Google Scholar]
- 43.Saalfeld S, Cardona A, Hartenstein V, and Tomancak P (2009). CATMAID: collaborative annotation toolkit for massive amounts of image data. Bioinformatics 25, 1984–1986. 10.1093/bioinformatics/btp266. [DOI] [PMC free article] [PubMed] [Google Scholar]
- 44.Dorkenwald S, McKellar CE, Macrina T, Kemnitz N, Lee K, Lu R, Wu J, Popovych S, Mitchell E, Nehoran B, et al. (2022). FlyWire: online community for whole-brain connectomics. Nat. Methods 19, 119–128. 10.1038/s41592-021-01330-0. [DOI] [PMC free article] [PubMed] [Google Scholar]
- 45.Dorkenwald S, Matsliah A, Sterling AR, Schlegel P, Yu S-C, McKellar CE, Lin A, Costa M, Eichler K, Yin Y, et al. (2023). Neuronal wiring diagram of an adult brain. BioRxiv. 10.1101/2023.06.27.546656. [DOI] [PMC free article] [PubMed] [Google Scholar]
- 46.Schlegel P, Yin Y, Bates AS, Dorkenwald S, Eichler K, Brooks P, Han DS, Gkantia M, Dos Santos M, Munnelly EJ, et al. (2023). Whole-brain annotation and multi-connectome cell typing quantifies circuit stereotypy in Drosophila. BioRxiv. 10.1101/2023.06.27.546055. [DOI] [PMC free article] [PubMed] [Google Scholar]
- 47.Strausfeld NJ, and Bassemir UK (1985). Lobula plate and ocellar interneurons converge onto a cluster of descending neurons leading to neck and leg motor neuropil in Calliphora erythrocephala. Cell Tissue Res. 240, 617–640. 10.1007/BF00216351. [DOI] [Google Scholar]
- 48.Strausfeld NJ, and Bassemir UK (1985). The organization of giant horizontal-motion-sensitive neurons and their synaptic relationships in the lateral deutocerebrum of Calliphora erythrocephala and Musca domestica. Cell Tissue Res. 242. 10.1007/BF00225419. [DOI] [Google Scholar]
- 49.Kendroud S, Bohra AA, Kuert PA, Nguyen B, Guillermin O, Sprecher SG, Reichert H, VijayRaghavan K, and Hartenstein V (2018). Structure and development of the subesophageal zone of the Drosophila brain. II. Sensory compartments. J. Comp. Neurol 526, 33–58. 10.1002/cne.24316. [DOI] [PMC free article] [PubMed] [Google Scholar]
- 50.Wu M, Nern A, Williamson WR, Morimoto MM, Reiser MB, Card GM, and Rubin GM (2016). Visual projection neurons in the Drosophila lobula link feature detection to distinct behavioral programs. eLife 5. 10.7554/eLife.21022. [DOI] [PMC free article] [PubMed] [Google Scholar]
- 51.Klapoetke NC, Nern A, Rogers EM, Rubin GM, Reiser MB, and Card GM (2022). A functionally ordered visual feature map in the Drosophila brain. Neuron 110, 1700–1711.e6. 10.1016/j.neuron.2022.02.013. [DOI] [PubMed] [Google Scholar]
- 52.Li F, Lindsey JW, Marin EC, Otto N, Dreher M, Dempsey G, Stark I, Bates AS, Pleijzier MW, Schlegel P, et al. (2020). The connectome of the adult Drosophila mushroom body provides insights into function. eLife 9. 10.7554/eLife.62576. [DOI] [PMC free article] [PubMed] [Google Scholar]
- 53.Yorozu S, Wong A, Fischer BJ, Dankert H, Kernan MJ, Kamikouchi A, Ito K, and Anderson DJ (2009). Distinct sensory representations of wind and near-field sound in the Drosophila brain. Nature 458, 201–205. 10.1038/nature07843. [DOI] [PMC free article] [PubMed] [Google Scholar]
- 54.Ishikawa Y, and Kamikouchi A (2016). Auditory system of fruit flies. Hear. Res 338, 1–8. 10.1016/j.heares.2015.10.017. [DOI] [PubMed] [Google Scholar]
- 55.Todi SV, Sharma Y, and Eberl DF (2004). Anatomical and molecular design of the Drosophila antenna as a flagellar auditory organ. Microsc. Res. Tech 63, 388–399. 10.1002/jemt.20053. [DOI] [PMC free article] [PubMed] [Google Scholar]
- 56.Caldwell JC, and Eberl DF (2002). Towards a molecular understanding of Drosophila hearing. J. Neurobiol 53, 172–189. 10.1002/neu.10126. [DOI] [PMC free article] [PubMed] [Google Scholar]
- 57.Matsuo E, and Kamikouchi A (2013). Neuronal encoding of sound, gravity, and wind in the fruit fly. J. Comp. Physiol. A Neuroethol. Sens. Neural Behav. Physiol 199, 253–262. 10.1007/s00359-013-0806-x. [DOI] [PubMed] [Google Scholar]
- 58.Lai JS-Y, Lo S-J, Dickson BJ, and Chiang A-S (2012). Auditory circuit in the Drosophila brain. Proc Natl Acad Sci USA 109, 2607–2612. 10.1073/pnas.1117307109. [DOI] [PMC free article] [PubMed] [Google Scholar]
- 59.Tootoonian S, Coen P, Kawai R, and Murthy M (2012). Neural representations of courtship song in the Drosophila brain. J. Neurosci 32, 787–798. 10.1523/JNEUROSCI.5104-11.2012. [DOI] [PMC free article] [PubMed] [Google Scholar]
- 60.Matsuo E, Seki H, Asai T, Morimoto T, Miyakawa H, Ito K, and Kamikouchi A (2016). Organization of projection neurons and local neurons of the primary auditory center in the fruit fly Drosophila melanogaster. J. Comp. Neurol 524, 1099–1164. 10.1002/cne.23955. [DOI] [PubMed] [Google Scholar]
- 61.Matsuo E, Yamada D, Ishikawa Y, Asai T, Ishimoto H, and Kamikouchi A (2014). Identification of novel vibration- and deflection-sensitive neuronal subgroups in Johnston’s organ of the fruit fly. Front. Physiol 5, 179. 10.3389/fphys.2014.00179. [DOI] [PMC free article] [PubMed] [Google Scholar]
- 62.Vaughan AG, Zhou C, Manoli DS, and Baker BS (2014). Neural pathways for the detection and discrimination of conspecific song in D. melanogaster. Curr. Biol 24, 1039–1049. 10.1016/j.cub.2014.03.048. [DOI] [PubMed] [Google Scholar]
- 63.Patella P, and Wilson RI (2018). Functional maps of mechanosensory features in the drosophila brain. Curr. Biol 28, 1189–1203.e5. 10.1016/j.cub.2018.02.074. [DOI] [PMC free article] [PubMed] [Google Scholar]
- 64.Kim H, Horigome M, Ishikawa Y, Li F, Lauritzen JS, Card G, Bock DD, and Kamikouchi A (2020). Wiring patterns from auditory sensory neurons to the escape and song-relay pathways in fruit flies. J. Comp. Neurol 528, 2068–2098. 10.1002/cne.24877. [DOI] [PMC free article] [PubMed] [Google Scholar]
- 65.Mamiya A, Sustar A, Siwanowicz I, Qi Y, Lu T-C, Gurung P, Chen C, Phelps JS, Kuan AT, Pacureanu A, et al. (2023). Biomechanical origins of proprioceptor feature selectivity and topographic maps in the Drosophila leg. Neuron 111, 3230–3243.e14. 10.1016/j.neuron.2023.07.009. [DOI] [PMC free article] [PubMed] [Google Scholar]
- 66.Chen C, Agrawal S, Mark B, Mamiya A, Sustar A, Phelps JS, Lee W-CA, Dickson BJ, Card GM, and Tuthill JC (2021). Functional architecture of neural circuits for leg proprioception in Drosophila. Curr. Biol 31, 5163–5175.e7. 10.1016/j.cub.2021.09.035. [DOI] [PMC free article] [PubMed] [Google Scholar]
- 67.Dallmann CJ, Agrawal S, Cook A, Brunton BW, and Tuthill JC (2023). Presynaptic inhibition selectively suppresses leg proprioception in behaving Drosophila. BioRxiv. 10.1101/2023.10.20.563322. [DOI] [Google Scholar]
- 68.Fenk LM, Kim AJ, and Maimon G (2021). Suppression of motion vision during course-changing, but not course-stabilizing, navigational turns. Curr. Biol 31, 4608–4619.e3. 10.1016/j.cub.2021.09.068. [DOI] [PubMed] [Google Scholar]
- 69.Goldberg RL, and Henson OW (1998). Changes in cochlear mechanics during vocalization: evidence for a phasic medial efferent effect. Hear. Res 122, 71–81. 10.1016/s0378-5955(98)00078-1. [DOI] [PubMed] [Google Scholar]
- 70.Hage SR, Jürgens U, and Ehret G (2006). Audio-vocal interaction in the pontine brainstem during self-initiated vocalization in the squirrel monkey. Eur. J. Neurosci 23, 3297–3308. 10.1111/j.1460-9568.2006.04835.x. [DOI] [PubMed] [Google Scholar]
- 71.Eliades SJ, and Wang X (2008). Neural substrates of vocalization feedback monitoring in primate auditory cortex. Nature 453, 1102–1106. 10.1038/nature06910. [DOI] [PubMed] [Google Scholar]
- 72.Buchanan JT, and Einum JF (2008). The spinobulbar system in lamprey. Brain Res. Rev 57, 37–45. 10.1016/j.brainresrev.2007.07.010. [DOI] [PMC free article] [PubMed] [Google Scholar]
- 73.Stecina K, Fedirchuk B, and Hultborn H (2013). Information to cerebellum on spinal motor networks mediated by the dorsal spinocerebellar tract. J Physiol (Lond) 591, 5433–5443. 10.1113/jphysiol.2012.249110. [DOI] [PMC free article] [PubMed] [Google Scholar]
- 74.Chagnaud BP, Banchi R, Simmers J, and Straka H (2015). Spinal corollary discharge modulates motion sensing during vertebrate locomotion. Nat. Commun 6, 7982. 10.1038/ncomms8982. [DOI] [PMC free article] [PubMed] [Google Scholar]
- 75.Crapse TB, and Sommer MA (2008). Corollary discharge across the animal kingdom. Nat. Rev. Neurosci 9, 587–600. 10.1038/nrn2457. [DOI] [PMC free article] [PubMed] [Google Scholar]
- 76.Fukutomi M, and Carlson BA (2020). A history of corollary discharge: contributions of mormyrid weakly electric fish. Front. Integr. Neurosci 14, 42. 10.3389/fnint.2020.00042. [DOI] [PMC free article] [PubMed] [Google Scholar]
- 77.Maimon G, Straw AD, and Dickinson MH (2010). Active flight increases the gain of visual motion processing in Drosophila. Nat. Neurosci 13, 393–399. 10.1038/nn.2492. [DOI] [PubMed] [Google Scholar]
- 78.Suver MP, Mamiya A, and Dickinson MH (2012). Octopamine neurons mediate flight-induced modulation of visual processing in Drosophila. Curr. Biol 22, 2294–2302. 10.1016/j.cub.2012.10.034. [DOI] [PubMed] [Google Scholar]
- 79.Jung SN, Borst A, and Haag J (2011). Flight activity alters velocity tuning of fly motion-sensitive neurons. J. Neurosci 31, 9231–9237. 10.1523/JNEUROSCI.1138-11.2011. [DOI] [PMC free article] [PubMed] [Google Scholar]
- 80.van Breugel F, Suver MP, and Dickinson MH (2014). Octopaminergic modulation of the visual flight speed regulator of Drosophila. J. Exp. Biol 217, 1737–1744. 10.1242/jeb.098665. [DOI] [PubMed] [Google Scholar]
- 81.Ache JM, Namiki S, Lee A, Branson K, and Card GM (2019). State-dependent decoupling of sensory and motor circuits underlies behavioral flexibility in Drosophila. Nat. Neurosci 22, 1132–1139. 10.1038/s41593-019-0413-4. [DOI] [PMC free article] [PubMed] [Google Scholar]
- 82.Chiappe ME (2023). Circuits for self-motion estimation and walking control in Drosophila. Curr. Opin. Neurobiol 81, 102748. 10.1016/j.conb.2023.102748. [DOI] [PubMed] [Google Scholar]
- 83.Longden KD, and Krapp HG (2010). Octopaminergic modulation of temporal frequency coding in an identified optic flow-processing interneuron. Front. Syst. Neurosci 4, 153. 10.3389/fnsys.2010.00153. [DOI] [PMC free article] [PubMed] [Google Scholar]
- 84.Rien D, Kern R, and Kurtz R (2013). Octopaminergic modulation of a fly visual motion-sensitive neuron during stimulation with naturalistic optic flow. Front. Behav. Neurosci 7, 155. 10.3389/fnbeh.2013.00155. [DOI] [PMC free article] [PubMed] [Google Scholar]
- 85.Poulet JFA, and Hedwig B (2002). A corollary discharge maintains auditory sensitivity during sound production. Nature 418, 872–876. 10.1038/nature00919. [DOI] [PubMed] [Google Scholar]
- 86.Poulet JFA, and Hedwig B (2003). Corollary discharge inhibition of ascending auditory neurons in the stridulating cricket. J. Neurosci 23, 4717–4725. 10.1523/JNEUROSCI.23-11-04717.2003. [DOI] [PMC free article] [PubMed] [Google Scholar]
- 87.Bidaye SS, Laturney M, Chang AK, Liu Y, Bockemühl T, Büschges A, and Scott K (2020). Two brain pathways initiate distinct forward walking programs in drosophila. Neuron 108, 469–485.e8. 10.1016/j.neuron.2020.07.032. [DOI] [PMC free article] [PubMed] [Google Scholar]
- 88.Fujiwara T, Brotas M, and Chiappe ME (2022). Walking strides direct rapid and flexible recruitment of visual circuits for course control in Drosophila. Neuron 110, 2124–2138.e8. 10.1016/j.neuron.2022.04.008. [DOI] [PMC free article] [PubMed] [Google Scholar]
- 89.Feng K, Palfreyman MT, Häsemeyer M, Talsma A, and Dickson BJ (2014). Ascending SAG neurons control sexual receptivity of Drosophila females. Neuron 83, 135–148. 10.1016/j.neuron.2014.05.017. [DOI] [PubMed] [Google Scholar]
- 90.Mann K, Gordon MD, and Scott K (2013). A pair of interneurons influences the choice between feeding and locomotion in Drosophila. Neuron 79, 754–765. 10.1016/j.neuron.2013.06.018. [DOI] [PMC free article] [PubMed] [Google Scholar]
- 91.Kim H, Kirkhart C, and Scott K (2017). Long-range projection neurons in the taste circuit of Drosophila. eLife 6. 10.7554/eLife.23386. [DOI] [PMC free article] [PubMed] [Google Scholar]
- 92.Tuthill JC, and Wilson RI (2016). Parallel transformation of tactile signals in central circuits of drosophila. Cell 164, 1046–1059. 10.1016/j.cell.2016.01.014. [DOI] [PMC free article] [PubMed] [Google Scholar]
- 93.Sen R, Wang K, and Dickson BJ (2019). TwoLumps Ascending Neurons Mediate Touch-Evoked Reversal of Walking Direction in Drosophila. Curr. Biol 29, 4337–4344.e5. 10.1016/j.cub.2019.11.004. [DOI] [PubMed] [Google Scholar]
- 94.Bidaye SS, Machacek C, Wu Y, and Dickson BJ (2014). Neuronal control of Drosophila walking direction. Science 344, 97–101. 10.1126/science.1249964. [DOI] [PubMed] [Google Scholar]
- 95.Hampel S, McKellar CE, Simpson JH, and Seeds AM (2017). Simultaneous activation of parallel sensory pathways promotes a grooming sequence in Drosophila. eLife 6. 10.7554/eLife.28804. [DOI] [PMC free article] [PubMed] [Google Scholar]
- 96.Chen C-L, Aymanns F, Minegishi R, Matsuda V, Talabot N, Gunel S, Dickson BJ, and Ramdya P (2022). Ascending neurons convey behavioral state to integrative sensory and action selection centers in the brain. BioRxiv. 10.1101/2022.02.09.479566. [DOI] [PMC free article] [PubMed] [Google Scholar]
- 97.Zhang B, Freeman MR, and Waddell S (2010). Drosophila neurobiology : a laboratory manual (Cold Spring Harbor Laboratory Press; ). [Google Scholar]
- 98.Schneider-Mizell CM, Gerhard S, Longair M, Kazimiers T, Li F, Zwart MF, Champion A, Midgley FM, Fetter RD, Saalfeld S, et al. (2016). Quantitative neuroanatomy for connectomics in Drosophila. eLife 5. 10.7554/eLife.12059. [DOI] [PMC free article] [PubMed] [Google Scholar]
- 99.Li PH, Lindsey LF, Januszewski M, Zheng Z, Bates AS, Taisz I, Tyka M, Nichols M, Li F, Perlman E, et al. (2019). Automated Reconstruction of a Serial-Section EM Drosophila Brain with Flood-Filling Networks and Local Realignment. BioRxiv. 10.1101/605634. [DOI] [Google Scholar]
- 100.Bates AS, Manton JD, Jagannathan SR, Costa M, Schlegel P, Rohlfing T, and Jefferis GS (2020). The natverse, a versatile toolbox for combining and analysing neuroanatomical data. eLife 9. 10.7554/eLife.53350. [DOI] [PMC free article] [PubMed] [Google Scholar]
- 101.Sakai R, Winand R, Verbeiren T, Moere AV, and Aerts J (2014). dendsort: modular leaf ordering methods for dendrogram representations in R. [version 1; peer review: 2 approved]. F1000Res. 3, 177. 10.12688/f1000research.4784.1. [DOI] [PMC free article] [PubMed] [Google Scholar]
- 102.Ito K, Shinomiya K, Ito M, Armstrong JD, Boyan G, Hartenstein V, Harzsch S, Heisenberg M, Homberg U, Jenett A, et al. (2014). A systematic nomenclature for the insect brain. Neuron 81, 755–765. 10.1016/j.neuron.2013.12.017. [DOI] [PubMed] [Google Scholar]
- 103.Turner-Evans D, Wegener S, Rouault H, Franconville R, Wolff T, Seelig JD, Druckmann S, and Jayaraman V (2017). Angular velocity integration in a fly heading circuit. eLife 6. 10.7554/eLife.23496. [DOI] [PMC free article] [PubMed] [Google Scholar]
- 104.Yaksi E, and Wilson RI (2010). Electrical coupling between olfactory glomeruli. Neuron 67, 1034–1047. 10.1016/j.neuron.2010.08.041. [DOI] [PMC free article] [PubMed] [Google Scholar]
- 105.Edelstein AD, Tsuchida MA, Amodaj N, Pinkard H, Vale RD, and Stuurman N (2014). Advanced methods of microscope control using μManager software. J. Biol. Methods 1. 10.14440/jbm.2014.36. [DOI] [PMC free article] [PubMed] [Google Scholar]
- 106.Pologruto TA, Sabatini BL, and Svoboda K (2003). ScanImage: flexible software for operating laser scanning microscopes. Biomed. Eng. Online 2, 13. 10.1186/1475-925X-2-13. [DOI] [PMC free article] [PubMed] [Google Scholar]
- 107.Schindelin J, Arganda-Carreras I, Frise E, Kaynig V, Longair M, Pietzsch T, Preibisch S, Rueden C, Saalfeld S, Schmid B, et al. (2012). Fiji: an open-source platform for biological-image analysis. Nat. Methods 9, 676–682. 10.1038/nmeth.2019. [DOI] [PMC free article] [PubMed] [Google Scholar]
- 108.Dubbs A, Guevara J, and Yuste R (2016). moco: Fast Motion Correction for Calcium Imaging. Front. Neuroinformatics 10, 6. 10.3389/fninf.2016.00006. [DOI] [PMC free article] [PubMed] [Google Scholar]
- 109.Jenett A, Rubin GM, Ngo T-TB, Shepherd D, Murphy C, Dionne H, Pfeiffer BD, Cavallaro A, Hall D, Jeter J, et al. (2012). A GAL4-driver line resource for Drosophila neurobiology. Cell Rep. 2, 991–1001. 10.1016/j.celrep.2012.09.011. [DOI] [PMC free article] [PubMed] [Google Scholar]
- 110.Pfeiffer BD, Ngo T-TB, Hibbard KL, Murphy C, Jenett A, Truman JW, and Rubin GM (2010). Refinement of tools for targeted gene expression in Drosophila. Genetics 186, 735–755. 10.1534/genetics.110.119917. [DOI] [PMC free article] [PubMed] [Google Scholar]
- 111.Pfeiffer BD, Truman JW, and Rubin GM (2012). Using translational enhancers to increase transgene expression in Drosophila. Proc Natl Acad Sci USA 109, 6626–6631. 10.1073/pnas.1204520109. [DOI] [PMC free article] [PubMed] [Google Scholar]
- 112.Dionne H, Hibbard KL, Cavallaro A, Kao J-C, and Rubin GM (2018). Genetic Reagents for Making Split-GAL4 Lines in Drosophila. Genetics 209, 31–35. 10.1534/genetics.118.300682. [DOI] [PMC free article] [PubMed] [Google Scholar]
- 113.Tirian L, and Dickson B (2017). The VT GAL4, LexA, and split-GAL4 driver line collections for targeted expression in the Drosophila nervous system. BioRxiv. 10.1101/198648. [DOI] [Google Scholar]
Associated Data
This section collects any data citations, data availability statements, or supplementary materials included in this article.
Supplementary Materials
Video S1. Example of Ca2+ activity in MsAHNs with synchronized behavioral recording upon induction of flight, related to Figure 4.
Video S2. Example of Ca2+ activity in MtAHNs with synchronized behavioral recording upon induction of flight, related to Figure 4.
Data Availability Statement
All data is available on request from the lead contact.
All original code used for connectomics and calcium imaging analysis has been deposited at Zenodo and is publicly available as of the date of publication. The associated DOI is listed in the key resources table.
Any additional information required to reanalyze the data reported in this paper is available from the lead contact upon request.
| REAGENT or RESOURCE | SOURCE | IDENTIFIER |
|---|---|---|
| Antibodies | ||
| Rabbit anti-RFP | Rockland | Cat#600-401-379; RRID:AB_2209751 |
| Chicken anti-GFP | abcam | Cat# ab13970; RRID:AB_300798 |
| Rat anti-NCAD | Developmental Studies Hybridoma Bank | Cat#DN-Ex #8; RRID:AB_528121 |
| Rabbit anti-histamine | Immunostar | Cat#22939; RRID:AB_572245 |
| Rabbit anti-hemaglutinin | Cell Signaling Technology | Cat#3724; RRID:AB_1549585 |
| Mouse anti-V5-Alexa 555 | Bio-Rad | Cat# MCA1360D550GA; RRID:AB_2687576 |
| Rabbit anti-GABA | Sigma | Cat#A2052; RRID:AB_477652 |
| Rabbit anti-serotonin | Immunostar | Cat#20080; RRID:AB_572263 |
| Rabbit anti-tyrosine hydroxylase | Immunostar | Cat#22941; RRID:AB_572268 |
| Mouse anti-Bruchpilot (nc82) | Developmental Studies Hybridoma Bank | Cat#nc82; RRID:AB_2314866 |
| Donkey anti-chicken AlexaFluor 488 | Jackson ImmunoResearch Laboratories | Cat#703-545-155; RRID:AB_2340375 |
| Donkey anti-rabbit AlexaFluor 546 | Invitrogen | Cat#A-10040; RRID:AB_2534016 |
| Donkey anti-rat AlexaFluor 647 | Abcam | Cat#ab150155; RRID:AB_2813835 |
| Donkey anti-mouse Dylight 649 | Jackson ImmunoResearch Laboratories | Cat#715-495-150 |
| Experimental models: Organisms/strains | ||
| D. melanogaster: R48H10-GAL4 | Jenett et al.109 | BDSC #50395; RRID:BDSC_50395 |
| D. melanogaster: UAS-Cbeta\DT.I | Han et al.24 | BDSC #25039; RRID:BDSC_25039 |
| D. melanogaster: hsFlp;;MCFO | Nern et al.25 | BDSC #64085; RRID:BDSC_64085 |
| D. melanogaster: 40XUAS-IVS-mCD8::GFP | Pfeiffer et al.110 | BDSC #32195; RRID:BDSC_32195 |
| D. melanogaster: pJFRC59-13XLexAop2-IVS-myr::GFP | Pfeiffer et al.111 | Janelia Fly store; 1117286 |
| D. melanogaster: R84G04-Gal4 | Jenett et al.109 | BDSC #40403; RRID:BDSC_40403 |
| D. melanogaster: R84G04-LexA (Chr. 3) | Pfeiffer et al.110; Mobilized derivative of RRID:BDSC_54987 | BDSC #54987; RRID:BDSC_54987 |
| D. melanogaster: R17F12-p65AD | Dionne et al.112 | BDSC #68845; RRID:BDSC_68845 |
| D. melanogaster: VT049652-Gal4.DBD | Tirian et al.113 | BDSC #74970; RRID:BDSC_74970 |
| D. melanogaster: VT025938-p65AD | Tirian et al.113 | BDSC #71314; RRID:BDSC_71314 |
| D. melanogaster: VT040583-GAL4.DBD | Tirian et al.113 | BDSC #71800; RRID:BDSC_71800 |
| D. melanogaster: UAS-DenMark, UAS-syt.eGFP | Nicolaï et al.32 | BDSC #33065; RRID:BDSC_33065 |
| D. melanogaster: VT039465-p65AD;VT023750-Gal4.DBD | Namiki et al.33 | Janelia line SS02625; BDSC #75974; RRID:BDSC_75974 |
| D. melanogaster: R24A03-p65AD; R74C01-Gal4.DBD | Namiki et al.33 | Janelia line SS01062; BDSC #86738; RRID:BDSC_86738 |
| D. melanogaster: VT056359-p65AD; VT002021-Gal4.DBD | This paper | Janelia line SS96091; BDSC #87313; RRID:BDSC_87313 |
| D. melanogaster: 10XUAS-IVS-mCD8::RFP}attP18,P{y[+t7.7]w[+mC]=13XLexAop2-mCD8::GFP}su(Hw)attP8 | Pfeiffer et al.110 | BDSC #32229; RRID:BDSC_32229 |
| D. melanogaster: pJFRC28-10XUAS-IVS-GFP-p10 in attP2 | Pfeiffer et al.111 | Janelia Fly store #1116592 |
| D. melanogaster: ChAT-Trojan-LexA | Diao et al.40 | BDSC #60317; RRID:BDSC_60317 |
| D. melanogaster: vGlut-Trojan-LexA | Diao et al.40 | BDSC #60314; RRID:BDSC_60314 |
| D. melanogaster: GAD1-Trojan-LexA | Diao et al.40 | BDSC #60324; RRID:BDSC_60314 |
| D. melanogaster: 20XUAS-IVS-Syn21-jGCaMP7f-p10 in su(Hw)attP5 | Dana et al.41 | BDSC #80906; RRID:BDSC_80906 |
| D. melanogaster: 20XUAS-IVS-Syn21-jGCaMP7f-p10 in VK00005 | Dana et al.41 | BDSC #79031; RRID:BDSC_79031 |
| D. melanogaster: 20XUAS-IVS-Syn21-jGCaMP7b-p10 in su(Hw)attP5 | Dana et al.41 | BDSC #80907; RRID:BDSC_80907 |
| D. melanogaster: 20XUAS-IVS-Syn21-jGCaMP7b-p10 in VK00005 | Dana et al.41 | BDSC #79029; RRID:BDSC_79029 |
| D. melanogaster: 13XLexAop2-IVS-Syn21-jGCaMP7f in VK00005 | Dana et al.41 | BDSC #80914; RRID:BDSC_80914 |
| D. melanogaster: 13xLexAop2-IVS-Syn21-jGCaMP7f in su(Hw)attP5 | Dana et al.41 | Janelia Fly Store #3032633 |
| D. melanogaster: 20xUAS-CsChrimson-tdTomato-trafficked in su(Hw)attP1 | Klapoetke et al.42 | Janelia Fly Store #3015695 |
| Software and algorithms | ||
| R version 4.1.1 | The R Foundation | https://www.r-project.org/ |
| Fiji ver 2.3.0/1.53f51 | Schindelin et al.107 | https://fiji.sc/ |
| Scanimage version 2016 | Pologruto et al.106 | https://www.mbfbioscience.com/products/scanimage/ |
| μManager | Edelstein et al.105 | https://micro-manager.org/ |
| Code for connectomics and calcium imaging analyses | This paper; GitHub; Zenodo | https://doi.org/10.5281/zenodo.10557545 |