

Abstract
Background:
Understanding factors that explain why some women experience greater postoperative pain and consume more opioids after cesarean delivery (CD) is crucial to building an evidence base for personalized prevention. Comprehensive psychosocial assessment with validated questionnaires in the preoperative period can be time-consuming. A 3-item questionnaire has shown promise as a simpler tool to be integrated into clinical practice, but its brevity may limit the ability to explain heterogeneity in psychosocial pain modulators among individuals. We compared the explanatory ability of 3 models: (1) the 3-item questionnaire, (2) a 58-item questionnaire (Long) including validated questionnaires (e.g., BPI, PROMIS) plus the 3-item questionnaire, and (3) a novel 19-item questionnaire (Brief) assessing several psychosocial factors plus the 3-item questionnaire. Additionally, we explored the utility of adding a pragmatic quantitative sensory test (QST) to models.
Methods:
In this prospective, observational study, 545 women undergoing CD completed questionnaires pre-surgery. Pain during local anesthetic skin wheal prior to spinal placement served as a pragmatic QST. Postoperatively, pain and opioid consumption were assessed. Linear regression analysis assessed model fit and the association of model items with pain and opioid consumption during the 48 hours following surgery.
Results:
A modest amount of variability was explained by each of the 3 models for postoperative pain and opioid consumption. Both Brief and Long questionnaire models performed better than the 3-item questionnaire, but were themselves statistically indistinguishable. Items that were independently associated with pain and opioid consumption included anticipated postsurgical pain medication requirement, surgical anxiety, poor sleep, pre-existing pain, and catastrophic thinking about pain. QST was itself independently associated with pain across models, but only modestly improved models for postoperative pain.
Conclusions:
The Brief questionnaire may be more clinically feasible than longer validated questionnaires, while still performing better and integrating a more comprehensive psychosocial assessment than the 3-item questionnaire.
Introduction
Cesarean delivery (CD) is the most commonly performed surgery worldwide and is often associated with moderate-severe postsurgical pain.1 Greater acute pain after CD is associated with the development of persistent postsurgical pain and chronic opioid use.1–4 Although opioid analgesics can be an important tool to help manage pain, both during the inpatient stay and post-discharge, many patients achieve adequate pain control after CD without the use of opioids.5 Furthermore, the link between higher amounts of inpatient opioid use and greater post-discharge use has raised concerns,6 prompting a laudable goal of reducing opioid-related side effects in patients and minimizing opioids in breast milk.7 Given known opioid-related risks, it is important to understand factors that explain variability in and are associated with greater postoperative pain and opioid consumption, which could help identify patients that might benefit from more judicious use of opioids and augmented non-opioid adjuvant therapies.
The presence of pain before surgery is consistently associated with worse postoperative pain and greater analgesic consumption.8 Several key psychosocial factors, including preoperative symptoms of depression, anxiety, pain catastrophizing, and sleep disturbance, have also been shown to be associated with greater pain and opioid consumption after CD.9–15 However, many prior studies report dichotomous diagnostic measures (e.g., depression yes/no) or employ only a single psychosocial measure. Such limitations preclude a comprehensive assessment of multiple psychosocial constructs in the context of other known risk factors. Taking a multivariable approach, whereby several known modulators of pain are simultaneously investigated, may be particularly important, as many of these factors are themselves interrelated.
The completion of a comprehensive series of validated questionnaires (e.g., Brief Pain Inventory [BPI], Patient Reported Outcome Measurement Information System [PROMIS]) in the pre- and perioperative period can be both cumbersome and time-consuming, and thus, may be impractical to employ in everyday practice.16 A short 3-item questionnaire, assessing anxiety about upcoming surgery, anticipated postsurgical pain, and anticipated postsurgical pain medication requirement, has previously shown promise as a simpler questionnaire that can be integrated into clinical practice.17 However, these 3 items overlook multiple potentially important factors (e.g., presurgical pain, depression, sleep disturbance, catastrophizing) and may not sensitively capture relevant interindividual differences in psychosocial function.
The aim of this study was to compare 3 sets of explanatory variables, each reflecting responses to questionnaires that varied in length and assessment detail, in their ability to explain variability in postoperative pain and opioid consumption after cesarean delivery: (1) the 3-item questionnaire, (2) a 58-item Long questionnaire including a sequential compilation of the validated brief assessment tools for each of these psychosocial constructs (e.g., BPI, PROMIS) plus the 3-item questionnaire, and (3) a novel physician-curated, 19-item Brief questionnaire, containing the 3-item questionnaire plus discrete elements from previously validated psychosocial questionnaires. We hypothesized that the novel 19-item Brief questionnaire would explain more variability in postoperative pain and opioid consumption than the 3-item questionnaire and would perform similarly to the full 58-item Long questionnaire.
Materials and Methods
Participants and Procedure
This prospective, observational study recruited women scheduled for cesarean delivery (CD) at Brigham and Women’s Hospital between October 2018 and April 2021. Inclusion criteria were planned CD, age 18–50, gestational age ≥36 weeks, and English proficiency. Exclusion criteria included planned post-CD hysterectomy, planned vertical incision, or contraindication for spinal anesthesia (to limit additional variability introduced by the anesthetic technique). Women were approached on the day of their scheduled CD and written informed consent was obtained. Using an electronic tablet, all participants completed: (1) the 3-item questionnaire, (2) full validated questionnaires (+55 questions), and (3) the novel Brief questionnaire (+16 questions), for a total of 74 questions. Timestamps were recorded for each question to track participants’ progress. After CD, pain scores were assessed by nursing staff multiple times throughout the day (approximately 10 times per day) and recorded as part of routine nursing documentation. Time-stamped pain scores, opioid consumption, and other analgesic administration were extracted from the electronic medical record. This study was approved by the Partners Human Research Committee/Institutional Review Board.
Preoperative Assessments
3-item Questionnaire
Participants answered 3 items which have been reported in previous studies investigating post-cesarean pain.17,18 Specifically, participants were asked to rate their (1) surgical anxiety level (“How anxious are you for your upcoming surgery?”; 0=no anxiety,10=extremely anxious), (2) anticipated postsurgical pain (“How much pain do you anticipate experiencing after your upcoming surgery?”; 0=no pain at all, 10=pain as bad as you can imagine), and (3) to estimate the amount of postoperative pain medication they thought they would need (“How much medication do you anticipate needing after your upcoming surgery?”; 1=much less than average, 5=much more than average).
Long Validated Pain and Psychosocial Questionnaires
The Long questionnaire was a compilation of several previously validated questionnaires assessing pain and psychosocial constructs. First, the Brief Pain Inventory (BPI)19 was used to assess participants’ baseline pain severity and interference. Four items asked participants to rate their current, worst, least, and average pain over the previous week (0=no pain, 10=pain as bad as it could be). An additional 10 items assessed the extent to which pain interfered with participants’ daily activities (0=does not interfere, 10=completely interferes). The fibromyalgianess scale,20 adapted from the clinical criteria for fibromyalgia, was used to measure widespread pain (number of body areas experiencing pain) and severity of related symptoms characteristic of fibromyalgia (e.g., fatigue). The Patient Reported Outcome Measurement Information System (PROMIS)21 short forms were used to measure symptoms of depression, anxiety, and sleep disturbance over the past week. The 13-item Pain Catastrophizing Scale (PCS)22 was used to measure negative pain-related cognitions (e.g., “I become afraid that the pain will get worse”; 0=not at all, 4=all the time).
Novel Brief Questionnaire
In addition to the validated questionnaires mentioned above, participants also completed a novel Brief questionnaire, which consisted of 19 items in total. Item selection involved a process of discussion among 3 clinicians familiar with postsurgical pain in both the clinical and research contexts, in consultation with an expert pain psychometrician. The resulting Brief questionnaire included the 3-item questionnaire, along with various key elements from the longer validated questionnaires. This Brief questionnaire was designed to be as succinct as possible, while also comprehensive enough to assess the full range of potential risk factors, including items to represent elements of the validated questionnaires regarding pre-existing pain and psychosocial modulators (e.g., anxiety, depression, sleep, fibromyalgianess; see Supplemental Material, Brief Questionnaire).
Perioperative Care and Surgical, Anesthetic, and Analgesic Information
Previous studies have utilized the application of standardized painful stimuli (quantitative sensory testing, or QST), in order to assess differences between individual’s processing of pain using either a comprehensive psychophysical assessment,23,24 or a bedside assessment in chronic pain patients25 and perioperative patients.26–28 As a pragmatic gesture towards QST in our patients, we assessed pain during the relatively standard local anesthetic injection (LAI) in the skin that occurs before spinal needle placement. Immediately prior to administering spinal anesthesia, women were positioned in the sitting position and received LAI in the skin and subcutaneous tissues at the L3–4 or L4–5 vertebral interspace with approximately 2.5 mL lidocaine 1% using a 25-gauge needle. Participants were informed when the LAI was about to be given, but caregivers were specifically instructed not to direct the perception of the sensory experience with phrases including negative language that are often employed in these clinical situations (“this is going to hurt/sting/pinch”). Immediately following the LAI, participants were asked to verbally rate the pain from LAI (0=no pain, 10=worst imaginable pain).
Spinal anesthesia was performed in nearly all participants, predominantly at the L3–4 or L4–5 vertebral interspace using a 25-gauge Whitacre needle. In a small number of participants, a combined spinal epidural was performed with a 17-gauge Weiss needle and 25-gauge Whitacre spinal needle. Intrathecally administered anesthetics included 0.75% hyperbaric bupivacaine (typically 1.6–1.8 mL), fentanyl (15 mcg), and morphine (100 mcg). Participants were then repositioned to the supine position with left lateral uterine displacement, and an adequate sensory block was confirmed 4–5 minutes after neuraxial anesthetic placement by the anesthesia provider. Although practices are somewhat variable among providers, it typically includes using a plastic “cocktail sword” or alcohol swab, applied first on the patient’s shoulder or upper chest to demonstrate normal sensation and then applied to lumbar dermatomes to confirm difference in sensation. Stimulations are then progressively applied in more cephalad dermatomes on the abdomen and chest, asking the patient to indicate whether it feels less sharp/cool in sensation, and at what point it feels similar to the unblocked area, with retesting on the shoulder as needed, with the most common dermatomal loss of sensation around the T4 dermatome level. In addition, surgeons performed a test stimulus at the planned incision site and surrounding area with forceps to confirm surgical anesthesia before proceeding with surgery. In 3 cases, the initial dose did not result in a clear sensory level and an additional dose was administered.
Postoperative Pain and Analgesia Assessments
Nurses assessed participants’ pain in the postoperative period using a numeric rating scale 0–10 on a routine schedule, at least every 4 hours, but also before and after the administration of any pain medication, up until the time participants were discharged. All of these pain scores were extracted from the electronic medical records for analysis. Postoperative pain was managed using a standard regimen, consisting of scheduled oral acetaminophen (975 mg every 6 hours) and intravenous (IV) ketorolac (30 mg every 6 hours) during the first 24 hours after surgery. Thereafter, scheduled oral acetaminophen (975 mg every 6 hours) continued, but IV ketorolac was replaced by scheduled oral ibuprofen (600 mg every 6 hours), and this regimen continued until discharge. Oral oxycodone (5–10 mg), oral hydromorphone (2–4 mg), or IV hydromorphone (0.2–0.4 mg) dosed as needed every 4 hours was available during the postoperative period. Timing and dose of opioids administered were extracted from electronic medical records.
Statistical Analysis
Participants’ demographic, psychosocial, and clinical characteristics, as well as postoperative pain and opioid consumption outcomes were summarized using frequencies and percentages for categorical variables, means with standard deviations (SD) or medians with interquartile ranges (IQR) for continuous and count variables.
Primary Outcomes
The primary study outcomes were pain and opioid consumption from the time the patient exited the operating room (t0) to 48-hours after exiting the operating room (t48). Pain was quantified as area under the curve (pain AUC) derived from all recorded pain scores in the medical record, and opioid consumption was quantified as cumulative oral morphine milligram equivalents (MME). Pain AUC was calculated using the trapezoidal rule, summing the areas of all trapezoids created between pairs of adjacent pain scores and the x-axis between t0 and t48. Among participants, the median time to the first pain score after t0 was 8 minutes (IQR: 4, 20). Nearly all (97%) participants had at least one pain score recorded at or after t48, but 16 participants had their last recorded pain score a median 1.9 hours (IQR:1.1, 3.8) before t48. For calculation of the pain AUC, pain at t0 was taken to be equal to the first pain score at or after t0, and when no pain score was recorded at t48 or after, pain at t48 was taken to be equal to the latest pain score recorded prior to t48. These adjustments allowed the pain AUC to be estimated across exactly 48 hours for all participants.
Model Development and Comparisons
Multivariable linear regression analyses were performed for 2 postoperative outcomes: 1) pain AUC and 2) cumulative opioid consumption (MME) during the first 48 hours following surgery. Three multivariable linear regression models were built for each outcome: (1) a model with the 3-item questionnaire (3 explanatory variables), (2) a model with the 19 items from the Brief questionnaire (19 explanatory variables), and (3) a model with the Long questionnaire (58 items, 10 explanatory variables, using validated brief questionnaire summary scores plus the 3-item questionnaire). There were no violations of multicollinearity (VIFs ≤5, Tolerances ≥0.1)29,30. All linear regression models for postoperative pain displayed normally distributed model residuals. In contrast, the linear regression models for postoperative opioid consumption displayed skewed residuals. Alternative modeling approaches (linear regression with log transformation of the outcome, count models, and quantile regression) did not improve the distribution of residuals, so results are presented from linear regression with an untransformed opioid consumption outcome, and thus, should be interpreted with caution.
To assess the explanatory ability of the 3 linear regression models, each model was assessed for goodness-of-fit, the proportion of variability in the outcome explained, and the central tendency of the difference between observed and estimated outcome values (i.e., model error). Formal comparison of goodness-of-fit between models was accomplished using either the traditional likelihood ratio test31,32 or Vuong’s two-step procedure33. When comparing two models with nested items (i.e., when one model is a reduced version of the other), the traditional likelihood ratio test assessed whether the larger model with more parameters provided a better fit than the reduced model. The 3-item questionnaire is nested within both the Brief and Long questionnaire models, and therefore, traditional likelihood ratio tests were employed to compare the Brief questionnaire versus the 3-item questionnaire and the Long questionnaire versus the 3-item questionnaire. Traditional likelihood ratio tests were also used to assess whether the addition of the pain score with LAI as an explanatory variable to the 3-item, Brief, or Long questionnaire models improved model fit. When models were non-nested, such as when comparing the Brief and Long questionnaire models, Vuong’s two-step procedure was utilized for model comparison. We first used Vuong’s test of distinguishability to assess whether fit statistics obtained in our sample could have been produced by models that have indistinguishable fits in our population of interest.34 If we did not find sufficient evidence to reject the null hypothesis of model indistinguishability, then we ceased further testing. If we did find evidence of model distinguishability, then we proceeded with Vuong’s likelihood ratio test for comparison of model fit.
The variability in the outcome explained by each model was estimated using R2 and adjusted R2. Because R2 always improves with the addition of more explanatory variables, regardless of whether these additional variables improve the model, we accounted for this property by calculating adjusted R2. The adjusted R2 value penalizes the R2 value based on the number of explanatory variables entered in the model. In addition, the central tendency of the differences between observed and estimated outcome values was quantified for each model as the root mean square error (RMSE), calculated as the square root of the mean of the squared difference between each observed and estimated outcome value. The unit of postoperative pain AUC is pain intensity × hours, which is not intuitively interpretable. Therefore, for the pain AUC outcome, the model error is presented as RMSE both with and without division of the AUC by 48 hours to allow interpretation on the original 0–10 pain intensity scale.
This study was originally powered based on a binary pain outcome, although both binary and continuous treatment of the data were planned, and linear regression ultimately allowed more powerful testing of the study hypotheses than logistic regression. In the original estimation of required sample size calculation, we estimated the incidence of severe pain after CD, defined as a pain score of ≥7/10 on a numerical rating scale, as 20%, and an AUC of the Long questionnaire model as 0.8. To detect an absolute difference in AUC of 0.05 between models, the estimated sample size needed was 654. However, we performed a post-hoc power analysis to determine the statistical discriminating power between linear regression models based on our final sample size. This post-hoc analysis revealed that with 545 participants, we had 80% power at an alpha level of 0.05 to detect differences in R2 ranging from 0.03–0.04 between pairs of nested models using F-tests. SPSS version 28.0 (SPSS, Inc., Chicago, IL), SAS version 9.4 (SAS Institute, Cary, NC), and R version 4.2.0 (R Foundation for Statistical Computing, Vienna, Austria) were used for statistical analyses.
Results
Participant and Baseline Questionnaire Characteristics
Out of the 642 women who were recruited, 545 had complete preoperative questionnaire data, allowing comparison of the 3 models (Figure 1), and their characteristics are shown in Table 1. Participants who were excluded (n=97) did not significantly differ from the final sample (n=545) based on demographic or clinical characteristics (ps>.05). The final sample had a mean age of 34 (SD=4), a mean gestational age of 38.7 weeks, and 33% of women were undergoing primary CD. Most women received spinal anesthesia (82%), with the remainder having a combined spinal epidural (18%) or epidural alone (0.4%) placed at the time of scheduled CD. Mean pain with local skin wheal placement before spinal or epidural administration was 3.1 (SD=2.0, range 0–10).
Figure 1. Study flow chart.
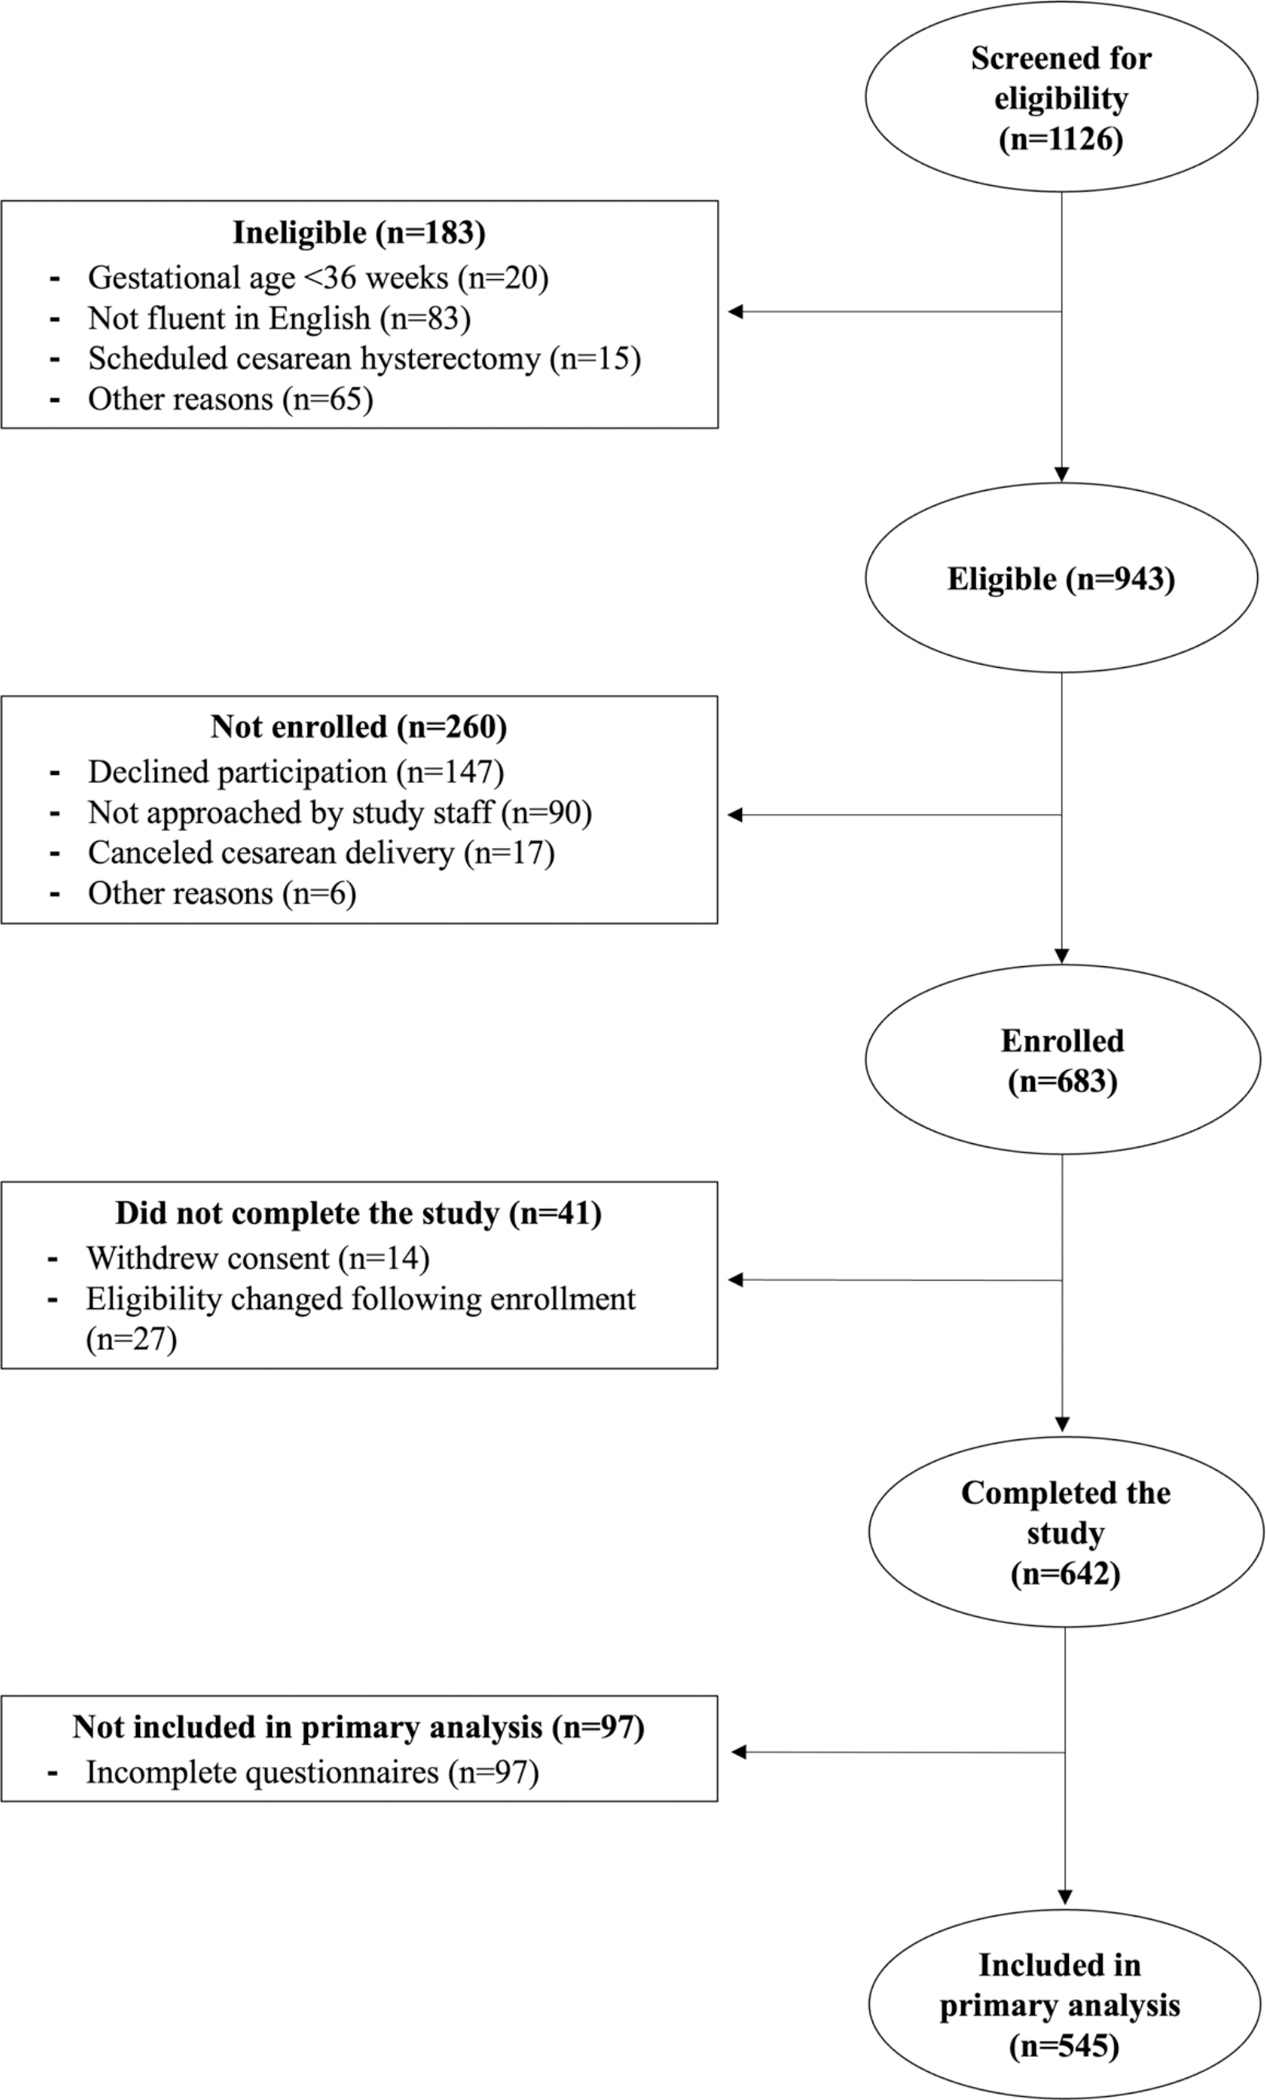
Table 1.
Participant Demographic and Clinical Characteristics (N=545)
| Demographics | M±SD, median (IQ range, or n(%) |
|---|---|
|
| |
| Age | 34.2±4.3 |
| BMI | 32.2±6.5 |
| Race | |
| African American | 59 (10.8%) |
| Asian | 31 (5.7%) |
| Hispanic/Latina | 55 (10.1%) |
| Mixed race | 1 (0.2%) |
| White | 399 (73.2%) |
| Clinical Characteristics | |
| Gestational age | 38.7±1.0 weeks |
| Gravidity, median (interquartile range) | 2 (2, 3) |
| Parity, median (interquartile range) | 2 (1, 2) |
| Repeat cesarean delivery | 367 (67%) |
| Anesthesia type | |
| Spinal | 446 (81.8%) |
| Combined spinal epidural (CSE) | 97 (17.8%) |
| Epidural | 2 (0.4%) |
Based on the timestamps collected, participants spent an average of 20 seconds (±20 seconds SD, median 15 seconds) answering the 3-item questionnaire. For the 19 items on the Brief questionnaire, the average time was 2 minutes (±2min SD, median 1.6 minutes). An average of 9 minutes (±12 min SD, median 6 minutes) were spent on the 58 items on the Long questionnaire. Summary description of responses to all items are displayed in Table 2.
Table 2.
Participant (N=545) Characteristics on Baseline Questionnaires
| M±SD n (%) | Range | |
|---|---|---|
|
| ||
| 3-Item Questionnaire * | ||
| Anxiety about upcoming surgery | 4.1±2.7 | 0–10 |
| Anticipated postsurgical pain | 5±2.2 | 0–10 |
| Anticipated postsurgical pain medication requirement | 1.7±0.6 | 0–4 |
| Brief Questionnaire (19 items) | ||
| Anxiety diagnosis and/or medication | 117 (22%) | 0–1 |
| Felt fearful, anxious, nervous in past week | 1.1±0.9 | 0–4 |
| Depression diagnosis and/or medication | 87 (16%) | 0–1 |
| Felt sad or depressed in past week | 0.4±0.7 | 0–4 |
| Chronic pain for ≥ 3 months | 51 (9%) | 0–1 |
| Chronic widespread pain | 0.3±1.1 | 0–19 |
| Baseline opioid medication | 2 (0.4%) | 0–1 |
| Headaches in past 6 months | 42 (8%) | 0–1 |
| Lower abdomen pain/cramping in past 6 months | 87 (16%) | 0–1 |
| Difficulty falling asleep in past week | 1.6±1.2 | 0–4 |
| Sleep quality in past week | 2.2±0.9 | 0–4 |
| Got enough sleep in past week | 2.1±1 | 0–4 |
| Waking up tired in past week | 2.2±0.9 | 0–4 |
| Pain is terrible and will never get better | 0.4±0.7 | 0–4 |
| Cannot get pain out of mind | 0.5±0.8 | 0–4 |
| Nothing can reduce the intensity of the pain | 0.4±0.6 | 0–4 |
| Long Validated Questionnaires (58 items) | ||
| Pain catastrophizing (13 items) | 8.5±8.4 | 0–52 |
| BPI pain severity (4 items) | 1.2±1.5 | 0–10 |
| BPI pain interference (10 items) | 1.4±1.9 | 0–10 |
| Fibromyalgianess (5 items) | 4.2±3.3 | 0–31 |
| PROMIS anxiety (7 items) | 13.6±5.5 | 7–35 |
| PROMIS depression (8 items) | 9.6±3.1 | 8–40 |
| PROMIS sleep disturbance (8 items) | 25.3±7.1 | 8–40 |
Note.
3-item questions were also included in the brief questionnaire. BPI=Brief Pain Inventory; PROMIS=Patient Reported Outcome Measurement Information System.
Postoperative Characteristics
Figure 2 shows the distribution of daily average pain scores (A) and daily total opioid consumption (B) during the first 48 hours after CD. An average of 8–10 pain scores per day were collected from each participant, with mean daily pain scores ranging from 2.0 to 3.3. There was a relatively wide range of average daily pain scores among women, ranging from 0 to 8.3 (Figure 2A). Similarly, there was variation in opioid administration, with 46% of women receiving at least one dose of opioid analgesics during their time in the hospital (Figure 2B). All participants received scheduled non-steroidal anti-inflammatory medications and acetaminophen during this time frame as well. Specifically, during the first 24hr after surgery, the majority of participants (85%) received a total of 3900 mg acetaminophen (i.e., 975 mg every 6 hours), 85.3% received 120 mg IV ketorolac (i.e., 30 mg every 6 hours), and 2.8% received ibuprofen. Between 24hr and 48hr after surgery, 95.2% received 3900 mg acetaminophen, 91% received 2400 mg ibuprofen (i.e. 600mg every 6 hours), and 1.7% received some ketorolac.
Figure 2. Daily pain and opioid consumption during the 48 hours after cesarean delivery.
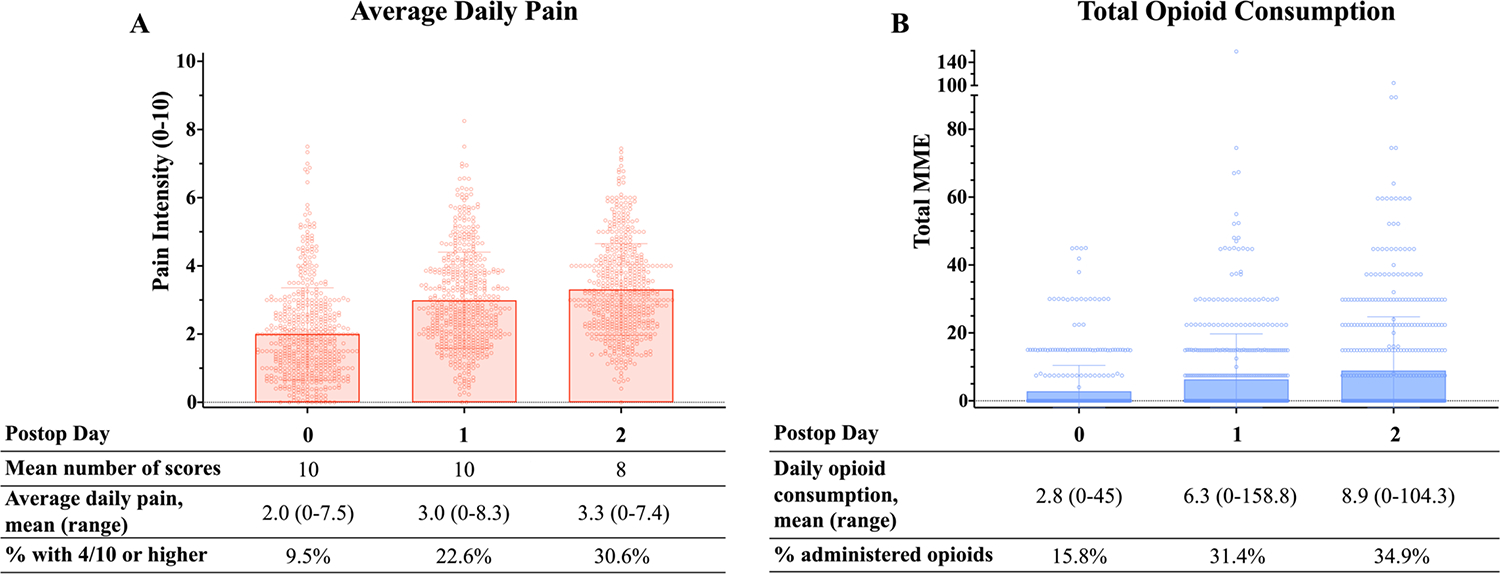
Nurses assessed participants’ pain using a numeric rating scale 0–10 multiple times throughout the day. All opioid consumption was quantified as oral morphine milligram equivalents (MME). (A) Distribution of daily average pain scores, with each circle representing and individual patient’s average daily pain. (B) Distribution of daily total opioid consumption, with each circle representing an individual patient’s cumulative opioid consumption during that 24-hour period.
Multivariable Linear Regression Analyses for Postoperative Pain and Opioid Consumption
Postoperative Pain
In models with pain as the outcome, the 3-item questionnaire, the 19-item Brief questionnaire, and the 58-item Long questionnaire achieved adjusted R2 of 0.06, 0.10, and 0.14, respectively (Table 3). We used likelihood ratio tests to compare the fit of these models. Both the 19-item Brief and 58-item Long questionnaires significantly improved model fit compared to the 3-item questionnaire (Likelihood ratio test; Table 3). Vuong’s test of distinguishability indicated that the non-nested Brief and Long questionnaires models were distinguishable (p<.001), but Vuong’s likelihood ratio test did not detect a difference in fit between the models (p=.17).
Table 3.
Performance Measures for Multivariable Linear Regression Models for Postoperative Pain and Opioid Consumption
| p value | R2 | Adjusted R2 | RMSE | RMSE | |
|---|---|---|---|---|---|
|
| |||||
| Postoperative Pain | (48h AUC [pain*h]) | (48h AUC [pain*h]/48h) | |||
| 3-item Questionnaire | 0.06 | 0.06 | 55.19 | 1.15 | |
| Brief Questionnaire | 0.13 | 0.10 | 53.04 | 1.11 | |
| Traditional likelihood ratio test (vs 3-item) | <.001 | ||||
| Long Questionnaire | 0.16 | 0.14 | 52.30 | 1.09 | |
| Traditional likelihood ratio test (vs 3-item) | <.001 | ||||
| Vuong’s tests (vs. brief) | |||||
| Distinguishability | <.001 | ||||
| Likelihood ratio | .17 | ||||
|
| |||||
| Postoperative Opioid Consumption | (48h MME) | ||||
| 3-item Questionnaire | 0.05 | 0.05 | 23.90 | ||
| Brief Questionnaire | 0.15 | 0.12 | 22.62 | ||
| Traditional likelihood ratio test (vs 3-item) | <.001 | ||||
| Long Questionnaire | 0.10 | 0.09 | 23.20 | ||
| Traditional likelihood ratio test (vs 3-item) | <.001 | ||||
| Vuong’s test of distinguishability (vs. brief) | .19 | ||||
Note. RMSE=Root Mean Squared Error, estimating average difference between estimated and actual scores, with a smaller RMSE indicating a better fit between the observed and estimated values. Goodness-of-fit comparisons were performed between pairs of nested models using the traditional likelihood ratio test and between pairs of non-nested models using Vuong’s two-step procedure. For non-nested models, if insufficient evidence was found to reject the null hypothesis of indistinguishable models, then Vuong’s likelihood ratio test was not subsequently performed.
The root mean square error (RMSE) was used as a metric to assess the accuracy of the models, with a smaller RMSE indicating a better fit between the observed and estimated values (Table 3). The performance of each model is also visually depicted in Figure 3, which shows the alignment between the estimated (x-axis) and observed (y-axis) values. Observing the deviations between the estimated and observed values suggests that the 3-item questionnaire may have limited explanatory power, particularly in the higher range of pain scores, as no higher scores were estimated in this model. In contrast, the Brief and Long questionnaire models did estimate into this higher range of pain scores for some participants, although they each still underestimated for many participants.
Figure 3. Observed vs. estimated postoperative pain and opioid consumption.
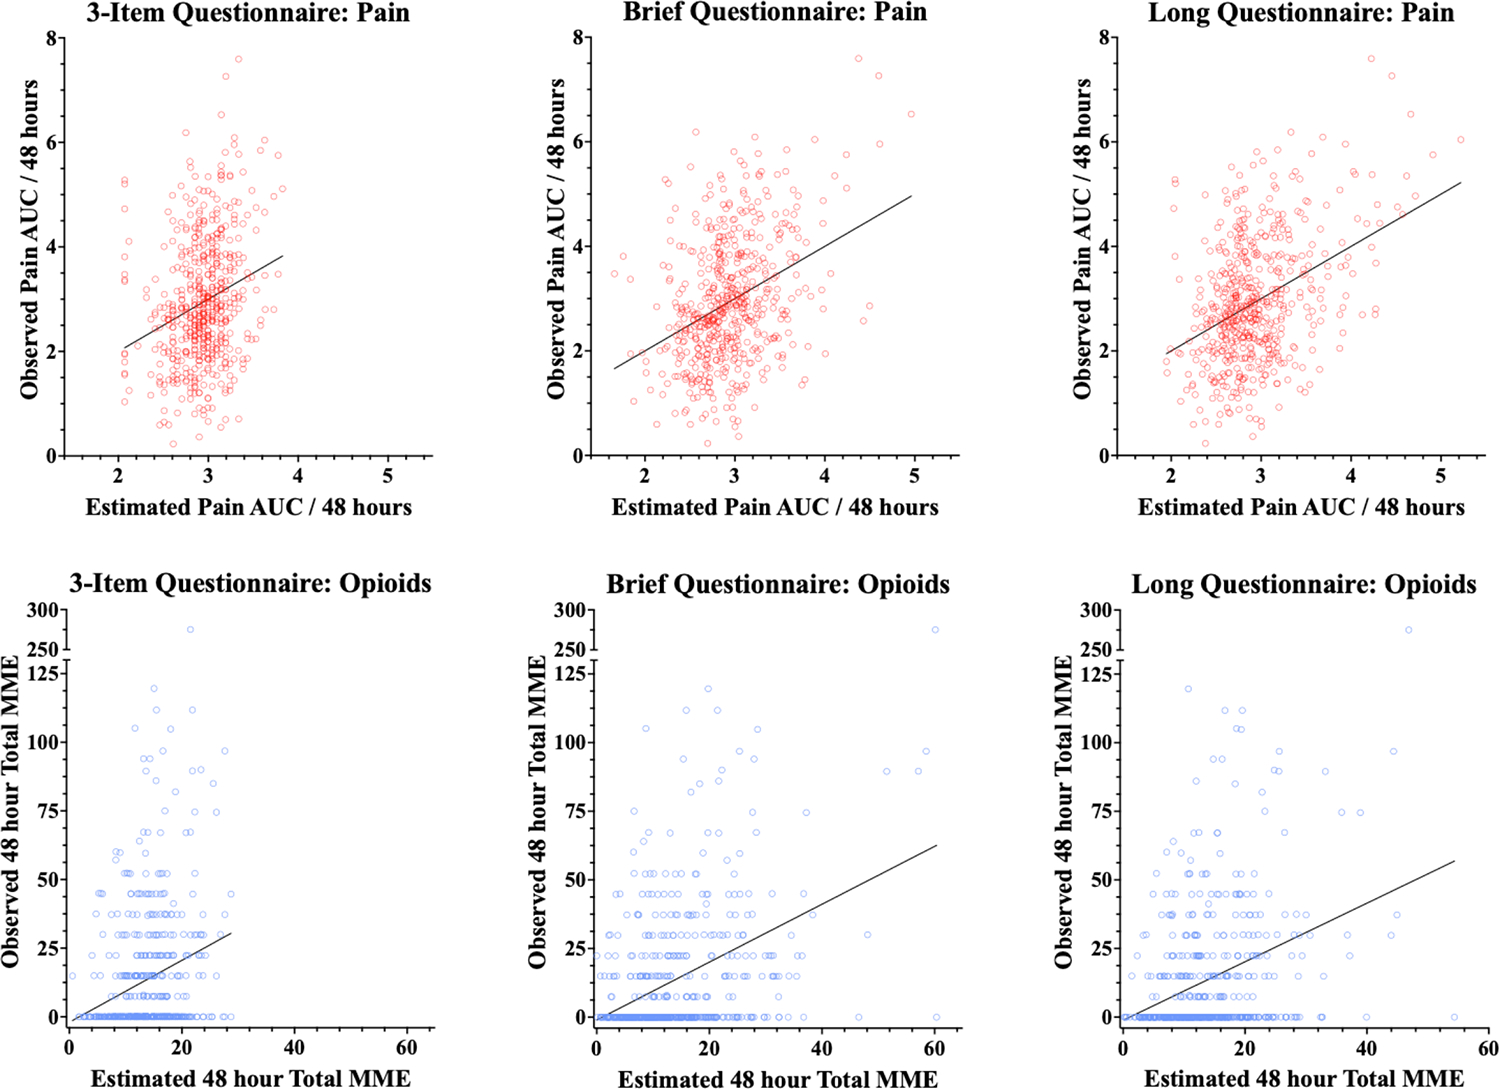
The top row of graphs shows plots of estimated to actual values for pain under each of the models (3-item, Brief and Long). Each red circle represents one participant, with the x-position representing the estimated pain under the model and the y-position representing the actual observed pain value. Note that AUC pain scores were normalized for the 48 hours to render them in a 0–10 scale. The top row of graphs shows plots of estimated to actual values for cumulative opioid consumption under each of the models (3-item, Brief and Long), with each blue circle representing one participant, with the x-position representing the opioid consumption under the model and the y-position representing the actual observed opioid consumption.
We then explored which individual items were independently associated with postoperative pain in each model. The item gauging a participant’s “anticipated postsurgical pain medication requirement” was independently associated with postoperative pain in all 3 models. Other items in the Brief questionnaire that were independently associated with postoperative pain included “anxiety about upcoming surgery” and “waking up tired in the past week” (Table 4). Figure 4 illustrates items that were independently associated with worse postoperative pain within and across the models.
Table 4.
| Pain | Opioid Consumption | |||
|---|---|---|---|---|
| Beta (95% CI) | p | Beta (95% CI) | p | |
| Model 1: 3-Item Questionnaire | ||||
| Anxiety about upcoming surgery | 2.32 (0.43, 4.21) | 0.016 | 1.51 (0.69, 2.33) | <.001 |
| Anticipated postsurgical pain | 2.39 (−0.21, 4.99) | 0.071 | −0.36 (−1.49, 0.76) | 0.528 |
| Anticipated postsurgical pain medication requirement | 11.61 (3.15, 20.07) | 0.007 | 5.70 (2.04, 9.36) | 0.002 |
| Model 2: Brief Questionnaire | ||||
| Anxiety diagnosis and/or medication | −10.64 (−24.98, 3.71) | 0.146 | −0.52 (−6.64, 5.6) | 0.868 |
| Felt fearful, anxious, nervous in past week | −5.58 (−12.28, 1.11) | 0.102 | 0.49 (−2.37, 3.34) | 0.737 |
| Anxiety about upcoming surgery | 2.27 (0.09, 4.45) | 0.042 | 0.82 (−0.11, 1.75) | 0.085 |
| Depression diagnosis and/or medication | 15.18 (−0.76, 31.13) | 0.062 | 3.61 (−3.19, 10.41) | 0.298 |
| Felt sad or depressed in past week | 2.97 (−4.67, 10.61) | 0.445 | 2.48 (−0.78, 5.73) | 0.136 |
| Chronic pain for ≥ 3 months | 2.35 (−22.97, 27.67) | 0.855 | 3.09 (−7.71, 13.89) | 0.574 |
| Chronic widespread pain | −31.48 (−0.19, 13.23) | 0.057 | 2.59 (−0.28, 5.45) | 0.077 |
| Baseline opioid medication | 6.52 (−108.63, 45.68) | 0.423 | −21.03(−53.94, 11.87) | 0.21 |
| Headaches in past 6 months | 10.26 (−8.09, 28.62) | 0.272 | 14.89 (7.07, 22.72) | <.001 |
| Lower abdomen pain/cramping past 6 mo | 4.07 (−9.11, 17.24) | 0.544 | −2.26 (−7.88, 3.36) | 0.431 |
| Anticipated postsurgical pain | 2.44 (−0.15, 5.04) | 0.065 | −0.42 (−1.53, 0.69) | 0.46 |
| Anticipated postsurgical pain medication requirement | 9.95 (1.5, 18.40) | 0.021 | 5.00 (1.39, 8.61) | 0.007 |
| Difficulty falling asleep in past week | −0.38 (−5.43, 4.67) | 0.882 | −0.1 (−2.25, 2.06) | 0.929 |
| Sleep quality in past week | −2.06 (−11.33, 7.2) | 0.662 | −0.95 (−4.9, 3.00) | 0.638 |
| Enough sleep in past week | 2.51 (−6.12, 11.14) | 0.568 | 2.39 (−1.29, 6.07) | 0.203 |
| Waking up tired in past week | 7.84 (0.69, 15) | 0.032 | 0.17 (−2.88, 3.22) | 0.912 |
| Pain is terrible and will never get better | 6.8 (−1.28, 14.89) | 0.099 | 3.36 (−0.08, 6.81) | 0.056 |
| Cannot get pain out of mind | −2.85 (−12.29, 6.58) | 0.553 | −5.27 (−9.29, −1.24) | 0.01 |
| Nothing can reduce the intensity of the pain | −7.41 (−17.87, 3.06) | 0.165 | 4.53 (0.06, 8.99) | 0.047 |
| Model 3: Long Questionnaire | ||||
| Pain catastrophizing | −0.29 (−0.89, 0.30) | 0.332 | −0.01 (−0.27, 0.25) | 0.94 |
| BPI pain severity | 8.11 (3.71, 12.52) | <.001 | 1.90 (−0.05, 3.86) | 0.056 |
| BPI pain interference | 4.02 (0.4, 7.63) | 0.03 | 0.57 (−1.04, 2.17) | 0.49 |
| Fibromyalgianess | −0.02 (−1.89, 1.85) | 0.985 | −0.23 (−1.06, 0.60) | 0.586 |
| PROMIS anxiety | −0.7 (−1.98, 0.57) | 0.277 | 0.38 (−0.18, 0.95) | 0.182 |
| PROMIS depression | 1.60 (−0.27, 3.46) | 0.094 | 0.64 (−0.19, 1.47) | 0.131 |
| PROMIS sleep disturbance | −0.21 (−0.97, 0.56) | 0.597 | 0.21 (−0.13, 0.54) | 0.233 |
| Anxiety about upcoming surgery | 1.89 (−0.28, 4.07) | 0.088 | 0.54 (−0.42, 1.51) | 0.272 |
| Anticipated postsurgical pain | 1.57 (−0.96, 4.10) | 0.223 | −0.58 (−1.70, 0.54) | 0.312 |
| Anticipated postsurgical pain medication requirement | 10.01 (1.86, 18.15) | 0.016 | 5.37 (1.75, 8.98) | 0.004 |
Note. BPI=Brief Pain Inventory; PROMIS=Patient Reported Outcome Measurement Information System.
Figure 4. Comparison of items across Models.
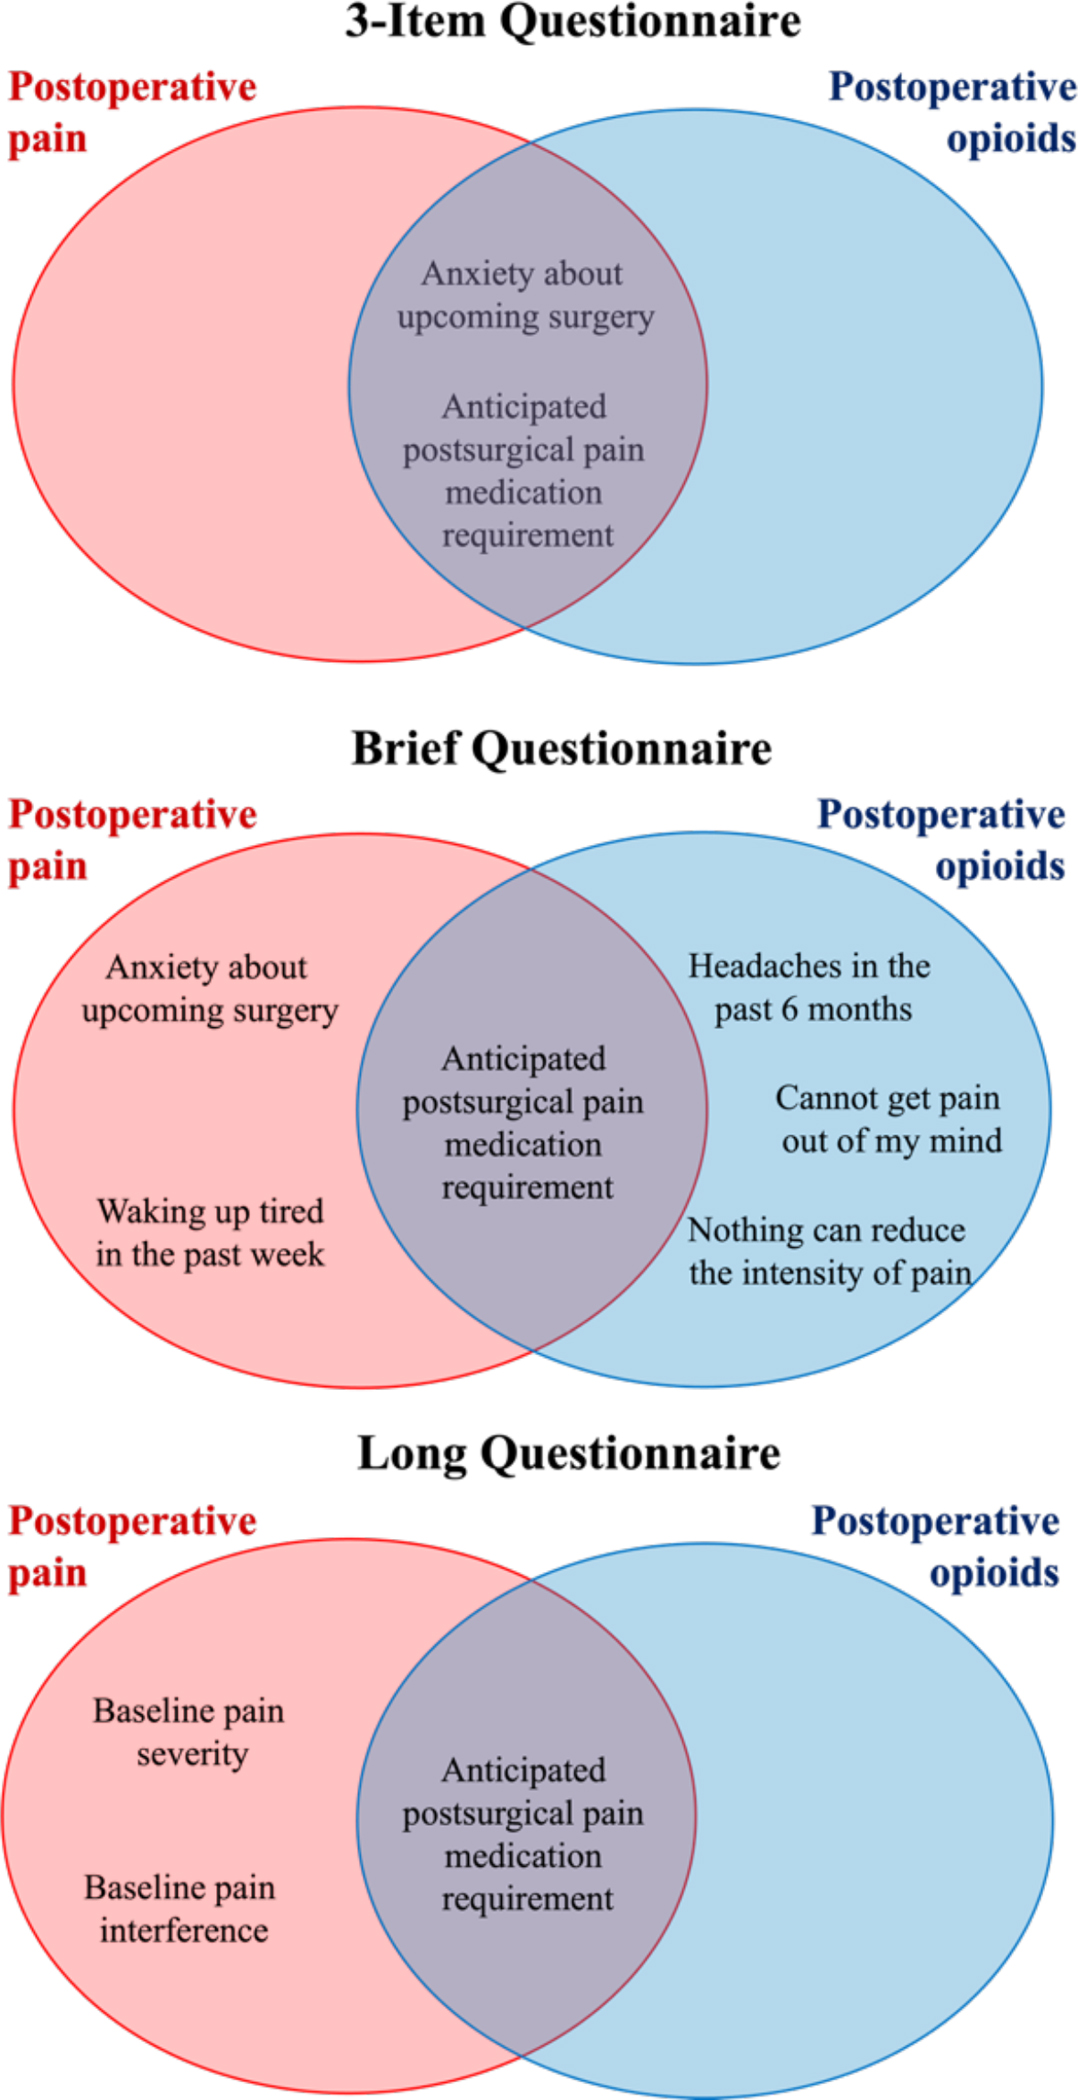
Venn diagram illustrating items that were independently associated with postoperative pain (red ovals) and opioid consumption (blue ovals) across and within the 3-item, Brief and Long models.
When the pain score from LAI was added to each of the multivariable models, it statistically improved model fit based on traditional likelihood ratio tests (Supplement Table 1) and was independently associated with postoperative pain (Supplemental Table 2) in all 3 models.
Postoperative Opioid Consumption
In models with opioid consumption as the outcome, the 3-item questionnaire, the 19-item Brief questionnaire, and the 58-item Long questionnaire achieved adjusted R2 of 0.05, 0.12, and 0.09, respectively (Table 3). Based on the likelihood ratio test, both the Brief and Long questionnaires demonstrated a significantly improved model fit compared to the 3-item questionnaire. A comparison between the Brief and Long questionnaire models suggested that they were not statistically distinguishable (Vuong’s test of distinguishability). The performance of each model is visually depicted in Figure 3. Similar to the model with postoperative pain as outcome, the 3-item questionnaire model did not estimate opioid use values in the higher range for any participant. The Brief and Long questionnaire models did estimate a higher range of opioids for some participants; however, they still demonstrated both under- and over-estimation for other participants.
We then performed an exploratory analysis of which individual items were independently associated with greater postoperative opioid consumption. Like postoperative pain, the item “anticipated postsurgical pain medication requirement” was independently associated with greater opioid consumption in all 3 models. Other items in the Brief questionnaire that were independently associated with greater opioid consumption included pre-existing pain (i.e., “headaches in the past 6 months”), as well as 2 items assessing pain catastrophizing (i.e., “Cannot get pain out of mind” and “Nothing can reduce the intensity of the pain”) (Table 4). Figure 4 illustrates variables from each questionnaire that were independently associated with opioid consumption within and across the models, based on uncorrected p values from these tests of association.
When added to each of the multivariable models, the pain score from LAI did not improve the fit for any of the models based on traditional likelihood ratio tests (Supplement Table 1), nor did it show an independent association with postoperative opioid consumption in any of the models (Supplemental Table 2).
Discussion
This pragmatic observational study in women undergoing CD compared 3 models, which were distinguished by the number of items assessing participant phenotypic characteristics. When comparing the models, our findings suggest that the 19-item physician-curated Brief questionnaire performed modestly better than the 3-item questionnaire, while performing similarly to the 58-item Long questionnaire. All models explained a relatively small amount of variability in postoperative outcomes, performing somewhat better for pain than opioid consumption. The item “anticipated postsurgical pain medication requirement” was significantly associated with both postoperative pain and opioid consumption across all models. On exploratory analysis, other items that were independently associated with postoperative pain included preoperative anxiety and disturbed sleep, and items that were independently associated with greater opioid consumption included pre-existing pain and catastrophic thinking about pain.
A feasible strategy for preoperative assessment involves balancing the collection of salient information about patients, including relevant psychosocial factors, with questionnaire brevity. We drew from our experience employing validated questionnaires within the busy perioperative context to select representative questions from these longer questionnaires. While longer questionnaires often have the advantage of being validated in larger samples,21 they are rarely actually validated for the perioperative context per se, despite being employed perioperatively,35–37 and are more time-intensive. We found that the average time for completion of the Brief questionnaire was 2 minutes, compared to 9 minutes for the Long questionnaire and 20 seconds for the 3-item questionnaire.
In the context of CD, both brevity and explanatory power are important considerations in recommending assessment approaches38. Although all 3 models in the present study left a large proportion of variability in postoperative outcomes unexplained, the Brief questionnaire essentially doubled the explained variability compared to the 3-item questionnaire. This suggests that the addition of the 16 items that are aimed at providing a more comprehensive psychosocial assessment may provide more insight into these outcomes. Formal statistical comparisons of the models also showed that the Brief and Long questionnaires performed significantly better than the 3-item questionnaire. As the 3-item questionnaire lacks an assessment of baseline pain and a comprehensive understanding of patients’ psychosocial characteristics, this may limit its explanatory capacity. On the other hand, we did not observe a statistical difference in the performance of the Brief questionnaire compared to the Long questionnaire, perhaps suggesting that the fewer items in the Brief questionnaire (i.e., 19) captured similar constructs to the Long questionnaire’s full set of validated questionnaires (i.e., 58 items).
The explained variability in opioid consumption was lower than that of pain, perhaps in part because opioid consumption was low overall. Although earlier studies reported that over 90% of women were prescribed opioids inpatient after CD,39 only 46% of patients in our cohort were administered opioids. Increasingly, strategies for opioid reduction have been endorsed by professional societies, including prioritizing non-opioid options.40 The current study was conducted in July 2018, shortly after the implementation of standing non-opioid pain medications. Review of the administration of scheduled non-opioid analgesics revealed high compliance, which may have contributed to the lower overall administration of opioids. One additional consideration is that by scheduling the use of analgesics, we may have uncoupled analgesic administration from a patient’s actual ongoing pain (because they are not as engaged in having to ask for medication), making opioid administration a relatively weaker proxy measure of pain.
The item “anticipated postsurgical pain medication required” on the 3-item questionnaire was independently related to worse postoperative pain and remained so also in the Brief and Long models. The item “anxiety about upcoming surgery” was also independently associated with postoperative pain in the Brief questionnaire model, whereas questions about general anxiety were not, consistent with prior studies of post-CD pain,10 attesting to the relative importance of surgery-specific anxiety. One additional item that independently contributed to postoperative pain in the Brief questionnaire model was an item “waking up tired in the last week”, which is consistent with previous studies linking disturbed sleep at baseline with subsequent postsurgical pain.41 In the Long questionnaire model, additional items independently associated with postoperative pain were BPI pain severity and interference, attesting to the general utility of this pain tool and the predominance of preop/pre-existing pain (and control of it in the perioperative period) as an important explanatory factor for subsequent pain, consistent with many previous studies.8,42
The item about “anticipated postsurgical pain medication required” was also independently associated with actual postoperative opioid consumption, and again this item remained significant in the Brief and Long models. The item on “anxiety about upcoming surgery” was also independently associated with postoperative opioid consumption, but only in the 3-item questionnaire model. Additional items that were independently related to postoperative opioid consumption in the Brief questionnaire model were pre-existing pain (headaches) and catastrophic thinking about pain. This aligns with prior work which has shown that the presence of pain at baseline and preoperative pain catastrophizing are significantly associated with greater analgesic consumption after surgery.8,11,36
Given the variability in CD-associated pain and opioid use, the implementation of personalized pathways beyond the typical enhanced recovery after cesarean delivery (ERAC) protocol is an important goal. In the present study, although the addition of psychosocial items only modestly improved the models compared to the 3-item questionnaire, there may be other advantages to knowing the psychosocial profile of patients. For example, identifying patients with high-risk psychosocial characteristics (e.g., anxiety, disturbed sleep, pain catastrophizing) prior to surgery may inform which patients may have a larger beneficial effect from some treatments. Behavioral interventions, such as cognitive behavioral therapy, have shown promise in modulating these psychosocial factors, while also improving pain outcomes, and may be most beneficial targeted towards high-risk patients.43–45 Methods to routinely and systematically assess preoperative pain-modulatory factors could assist clinical decision-making and evidence-based care planning for a more patient-centered treatment approach. Rigorous studies are needed to understand how the identification of preoperative psychosocial characteristics may inform personalized preventive approaches that can be incorporated into ERAC protocols.
Psychophysical characteristics (measurements of sensitivity in the nervous system) assessed using quantitative sensory testing (QST) are closely linked to greater pain severity and persistence.26,46 The practical use of QST as a tool to identify individuals with greater nociceptive sensitivity, greater tendency to central sensitization, and chronic pain is still unclear.47,48 In the current study, the addition of a brief, pragmatic QST (pain upon local anesthetic injection before spinal placement), substantially improved models with postoperative pain as an outcome, but not opioid consumption. Additionally, this pain score was independently associated with postsurgical pain in all models. These findings suggest that brief pre-surgical testing of pain sensitivity provides potentially valuable information for understanding postoperative pain.
Our findings should be interpreted considering several limitations. First, this study was not planned as a formal prediction study, so we cannot assess how well each model would function as a prediction tool. Second, relatively small percentages of the overall variance in pain and opioid use were explained by all 3 models, which could be due to unaccounted variability in outcome assessment (e.g., variability in methods and timing of recorded pain scores). Having standardized pain assessment at strictly defined timepoints (12 and 24 hours after surgery) might potentially decrease variability, though our method had the advantage of giving a more comprehensive portrait of post-CD pain at important clinical decision points (e.g., around the administration of analgesics). Third, the relatively large sample allowed detection of differences that were relatively small in magnitude. For example, LAI pain was significantly associated with postoperative pain but not opioid use, but the clinical magnitude of this difference is quite small, and thus the overall clinical meaning of these findings should be considered in this context. Fourth, the exploratory analysis of individual items that were independently associated with greater pain or opioid consumption was not corrected for multiple comparisons, and so should be considered as exploratory, and having a higher risk of type I error. Additionally, our conclusions about the feasibility of different lengths of preoperative assessment questionnaires applies specifically to the day of surgery. What might be feasible several days or weeks in advance (20-minute online assessment) is likely longer than what is possible in the context of a busy preoperative period at the hospital. With the movement of preoperative assessments to virtual contexts, it might be of interest to assess these factors more proactively, during one of the many perinatal visits that occur during pregnancy. Lastly, as we limited the enrollment to those undergoing scheduled CD, these findings may not generalize to pain after unplanned CD or vaginal delivery, or to other surgical procedures.
Conclusion
Our findings suggest that the novel, 19-item Brief questionnaire, which takes only a few minutes to complete, may account for more variability in postoperative outcomes compared to the 3-item questionnaire. Psychosocial-related items related to sleep and anxiety were independently related to pain, suggesting that including these as part of a practical preoperative assessment might be helpful. If time is limited, it does appear that this Brief assessment may explain a similar amount of variability in postoperative outcomes as a longer set of validated questionnaires.
Supplementary Material
Summary Statement:
Biopsychosocial characteristics of women undergoing cesarean delivery were preoperatively measured using various questionnaires, and the degree to which questionnaire length and individual measured characteristics explained variability in postsurgical pain and opioid consumption was assessed.
Acknowledgments:
We would like to acknowledge and thank the participants who agreed to take the time to undergo assessment on one of their busiest and most meaningful days, immediately before having their baby delivered by scheduled Cesarean Delivery, as well as the physician and nursing teams that cared for them, contributing to the assessment and treatment of their postsurgical pain.
Funding Statement:
Supported by grants from the Foundation for Anesthesia Education and Research (FAER) and the National Institute of Health (NIH R35 GM128691) and the Brigham and Women’s Hospital Department of Anesthesiology, Perioperative, and Pain Medicine.
Footnotes
Conflicts of interest: MKF has served as consultant to Flat Medical; HemoSonics; Octapharma.
Prior Presentation: Portions of the work were presented at the US Association for the Study of Pain, Durham, NC, April 2023.
REFERENCES
- 1.Eisenach JC, Pan PH, Smiley R, Lavand’homme P, Landau R, Houle TT. Severity of acute pain after childbirth, but not type of delivery, predicts persistent pain and postpartum depression. Pain. 2008;140(1):87–94. doi: 10.1016/j.pain.2008.07.011 [DOI] [PMC free article] [PubMed] [Google Scholar]
- 2.Kainu JP, Sarvela J, Tiippana E, Halmesmäki E, Korttila KT. Persistent pain after caesarean section and vaginal birth: a cohort study. Int J Obstet Anesth. 2010;19(1):4–9. doi: 10.1016/j.ijoa.2009.03.013 [DOI] [PubMed] [Google Scholar]
- 3.Nikolajsen L, Sørensen HC, Jensen TS, Kehlet H. Chronic pain following Caesarean section: Chronic pain after Caesarean section. Acta Anaesthesiologica Scandinavica. 2004;48(1):111–116. doi: 10.1111/j.1399-6576.2004.00271.x [DOI] [PubMed] [Google Scholar]
- 4.Sng BL, Sia ATH, Quek K, Woo D, Lim Y. Incidence and Risk Factors for Chronic Pain after Caesarean Section under Spinal Anaesthesia. Anaesth Intensive Care. 2009;37(5):748–752. doi: 10.1177/0310057X0903700513 [DOI] [PubMed] [Google Scholar]
- 5.Holland E, Bateman BT, Cole N, Taggart A, Robinson LA, Sugrue R, Xu X, Robinson JN. Evaluation of a Quality Improvement Intervention That Eliminated Routine Use of Opioids After Cesarean Delivery. Obstetrics & Gynecology. 2019;133(1):91–97. doi: 10.1097/AOG.0000000000003010 [DOI] [PubMed] [Google Scholar]
- 6.Cohen A, Xie X, Zeuner R, Galperin S, Bruney T. Predictors of patient post-discharge opioid use after cesarean delivery: a prospective study. International Journal of Obstetric Anesthesia. 2022;50:103249. doi: 10.1016/j.ijoa.2021.103249 [DOI] [PubMed] [Google Scholar]
- 7.Hendrickson RG, McKeown NJ. Is maternal opioid use hazardous to breast-fed infants? Clin Toxicol (Phila). 2012;50(1):1–14. doi: 10.3109/15563650.2011.635147 [DOI] [PubMed] [Google Scholar]
- 8.Ip HYV, Abrishami A, Peng PWH, Wong J, Chung F. Predictors of Postoperative Pain and Analgesic Consumption. Anesthesiology. 2009;111(3):657–677. doi: 10.1097/ALN.0b013e3181aae87a [DOI] [PubMed] [Google Scholar]
- 9.Bateman BT, Franklin JM, Bykov K, Avorn J, Shrank WH, Brennan TA, Landon JE, Rathmell JP, Huybrechts KF, Fischer MA, Choudhry NK. Persistent opioid use following cesarean delivery: patterns and predictors among opioid-naïve women. American Journal of Obstetrics and Gynecology. 2016;215(3):353.e1–353.e18. doi: 10.1016/j.ajog.2016.03.016 [DOI] [PMC free article] [PubMed] [Google Scholar]
- 10.Chan JJI, Tan CW, Yeam CT, Sultana R, Sia ATH, Habib AS, Sng BL. Risk Factors Associated with Development of Acute and Sub-Acute Post-Cesarean Pain: A Prospective Cohort Study. JPR. 2020;Volume 13:2317–2328. doi: 10.2147/JPR.S257442 [DOI] [PMC free article] [PubMed] [Google Scholar]
- 11.Janda AM, As-Sanie S, Rajala B, Tsodikov A, Moser SE, Clauw DJ, Brummett CM. Fibromyalgia Survey Criteria Are Associated with Increased Postoperative Opioid Consumption in Women Undergoing Hysterectomy. Anesthesiology. 2015;122(5):1103–1111. doi: 10.1097/ALN.0000000000000637 [DOI] [PubMed] [Google Scholar]
- 12.Orbach-Zinger S, Fireman S, Ben-Haroush A, Karoush T, Klein Z, Mazarib N, Artyukh A, Chen R, Ioscovich A, Eidelman LA, Landau R. Preoperative sleep quality predicts postoperative pain after planned caesarean delivery. Eur J Pain. 2017;21(5):787–794. doi: 10.1002/ejp.980 [DOI] [PubMed] [Google Scholar]
- 13.Pan PH, Coghill R, Houle TT, Seid MH, Lindel WM, Parker RL, Washburn SA, Harris L, Eisenach JC. Multifactorial Preoperative Predictors for Postcesarean Section Pain and Analgesic Requirement. Anesthesiology. 2006;104(3):417–425. doi: 10.1097/00000542-200603000-00007 [DOI] [PubMed] [Google Scholar]
- 14.Poehlmann JR, Stowe ZN, Godecker A, Xiong PT, Broman AT, Antony KM. The impact of preexisting maternal anxiety on pain and opioid use following cesarean delivery: a retrospective cohort study. American Journal of Obstetrics & Gynecology MFM. 2022;4(3):100576. doi: 10.1016/j.ajogmf.2022.100576 [DOI] [PubMed] [Google Scholar]
- 15.Strulov L, Zimmer EZ, Granot M, Tamir A, Jakobi P, Lowenstein L. Pain Catastrophizing, Response to Experimental Heat Stimuli, and Post–Cesarean Section Pain. The Journal of Pain. 2007;8(3):273–279. doi: 10.1016/j.jpain.2006.09.004 [DOI] [PubMed] [Google Scholar]
- 16.Carvalho B, Zheng M, Harter S, Sultan P. A Prospective Cohort Study Evaluating the Ability of Anticipated Pain, Perceived Analgesic Needs, and Psychological Traits to Predict Pain and Analgesic Usage following Cesarean Delivery. Anesthesiology Research and Practice. 2016;2016:1–8. doi: 10.1155/2016/7948412 [DOI] [PMC free article] [PubMed] [Google Scholar]
- 17.Pan PH, Tonidandel AM, Aschenbrenner CA, Houle TT, Harris LC, Eisenach JC. Predicting Acute Pain after Cesarean Delivery Using Three Simple Questions. Anesthesiology. 2013;118(5):1170–1179. doi: 10.1097/ALN.0b013e31828e156f [DOI] [PMC free article] [PubMed] [Google Scholar]
- 18.Guevara J, Carvalho JCA, Downey K, Ye XY, Sharkey AM, Arzola C. Predicting pain after Cesarean delivery: pressure algometry, temporal summation, three-item questionnaire. Can J Anesth/J Can Anesth. 2021;68(12):1802–1810. doi: 10.1007/s12630-021-02105-z [DOI] [PubMed] [Google Scholar]
- 19.Cleeland CS, Ryan KM. Pain assessment: global use of the Brief Pain Inventory. Ann Acad Med Singap. 1994;23(2):129–138. [PubMed] [Google Scholar]
- 20.Wolfe F, Clauw DJ, Fitzcharles MA, Goldenberg DL, Häuser W, Katz RS, Mease P, Russell AS, Russell IJ, Winfield JB. Fibromyalgia Criteria and Severity Scales for Clinical and Epidemiological Studies: A Modification of the ACR Preliminary Diagnostic Criteria for Fibromyalgia. J Rheumatol. 2011;38(6):1113–1122. doi: 10.3899/jrheum.100594 [DOI] [PubMed] [Google Scholar]
- 21.Cella D, Riley W, Stone A, Rothrock N, Reeve B, Yount S, Amtmann D, Bode R, Buysse D, Choi S, Cook K, DeVellis R, DeWalt D, Fries JF, Gershon R, Hahn EA, Lai JS, Pilkonis P, Revicki D, Rose M, Weinfurt K, Hays R. The Patient-Reported Outcomes Measurement Information System (PROMIS) developed and tested its first wave of adult self-reported health outcome item banks: 2005–2008. Journal of Clinical Epidemiology. 2010;63(11):1179–1194. doi: 10.1016/j.jclinepi.2010.04.011 [DOI] [PMC free article] [PubMed] [Google Scholar]
- 22.Sullivan MJL, Bishop SR, Pivik J. The Pain Catastrophizing Scale: Development and validation. Psychological Assessment. 1995;7(4):524–532. doi: 10.1037/1040-3590.7.4.524 [DOI] [Google Scholar]
- 23.Gierthmühlen J, Böhmer J, Attal N, Bouhassira D, Freynhagen R, Haanpää M, Hansson P, Jensen TS, Kennedy J, Maier C, Rice ASC, Sachau J, Segerdahl M, Sindrup S, Tölle T, Treede RD, Ventzel L, Vollert J, Baron R. Association of sensory phenotype with quality of life, functionality, and emotional well-being in patients suffering from neuropathic pain. Pain. 2022;163(7):1378–1387. doi: 10.1097/j.pain.0000000000002501 [DOI] [PMC free article] [PubMed] [Google Scholar]
- 24.Backonja MM, Attal N, Baron R, Bouhassira D, Drangholt M, Dyck PJ, Edwards RR, Freeman R, Gracely R, Haanpaa MH, Hansson P, Hatem SM, Krumova EK, Jensen TS, Maier C, Mick G, Rice AS, Rolke R, Treede RD, Serra J, Toelle T, Tugnoli V, Walk D, Walalce MS, Ware M, Yarnitsky D, Ziegler D. Value of quantitative sensory testing in neurological and pain disorders: NeuPSIG consensus. Pain. 2013;154(9):1807–1819. doi: 10.1016/j.pain.2013.05.047 [DOI] [PubMed] [Google Scholar]
- 25.Koulouris AE, Edwards RR, Dorado K, Schreiber KL, Lazaridou A, Rajan S, White J, Garcia J, Gibbons C, Freeman R. Reliability and Validity of the Boston Bedside Quantitative Sensory Testing Battery for Neuropathic Pain. Pain Med. 2020;21(10):2336–2347. doi: 10.1093/pm/pnaa192 [DOI] [PMC free article] [PubMed] [Google Scholar]
- 26.Schreiber KL, Martel MO, Shnol H, Shaffer JR, Greco C, Viray N, Taylor LN, McLaughlin M, Brufsky A, Ahrendt G, Bovbjerg D, Edwards RR, Belfer I. Persistent pain in postmastectomy patients: Comparison of psychophysical, medical, surgical, and psychosocial characteristics between patients with and without pain. Pain. 2013;154(5):660–668. doi: 10.1016/j.pain.2012.11.015 [DOI] [PMC free article] [PubMed] [Google Scholar]
- 27.Schreiber KL, Zinboonyahgoon N, Xu X, Spivey T, King T, Dominici L, Partridge A, Golshan M, Strichartz G, Edwards RR. Preoperative Psychosocial and Psychophysical Phenotypes as Predictors of Acute Pain Outcomes After Breast Surgery. The Journal of Pain. 2019;20(5):540–556. doi: 10.1016/j.jpain.2018.11.004 [DOI] [PMC free article] [PubMed] [Google Scholar]
- 28.Abrecht CR, Cornelius M, Wu A, Jamison RN, Janfaza D, Urman RD, Campbell C, Smith M, Haythornthwaite J, Edwards RR, Schreiber KL. Prediction of Pain and Opioid Utilization in the Perioperative Period in Patients Undergoing Primary Knee Arthroplasty: Psychophysical and Psychosocial Factors. Pain Med. 2019;20(1):161–171. doi: 10.1093/pm/pny020 [DOI] [PMC free article] [PubMed] [Google Scholar]
- 29.Menard SW. Applied Logistic Regression Analysis. 2nd ed. Sage Publications; 2002. [Google Scholar]
- 30.Myers RH. Classical and Modern Regression with Applications. 2nd ed. PWS-KENT; 1990. [Google Scholar]
- 31.Neyman J, Pearson ES. On the Use and Interpretation of Certain Test Criteria for Purposes of Statistical Inference: Part I. Biometrika. 1928;20A(1/2):175. doi: 10.2307/2331945 [DOI] [Google Scholar]
- 32.Neyman J, Pearson ES. On the problem of the most efficient tests of statistical hypotheses. Phil Trans R Soc Lond A. 1933;231(694–706):289–337. doi: 10.1098/rsta.1933.0009 [DOI] [Google Scholar]
- 33.Vuong QH. Likelihood Ratio Tests for Model Selection and Non-Nested Hypotheses. Econometrica. 1989;57(2):307. doi: 10.2307/1912557 [DOI] [Google Scholar]
- 34.Schneider L, Chalmers RP, Debelak R, Merkle EC. Model Selection of Nested and Non-Nested Item Response Models Using Vuong Tests. Multivariate Behavioral Research. 2020;55(5):664–684. doi: 10.1080/00273171.2019.1664280 [DOI] [PubMed] [Google Scholar]
- 35.Edwards RR, Campbell C, Schreiber KL, Meints S, Lazaridou A, Martel MO, Cornelius M, Xu X, Jamison RN, Katz JN, Carriere J, Khanuja HP, Sterling RS, Smith MT, Haythornthwaite JA. Multimodal prediction of pain and functional outcomes 6 months following total knee replacement: a prospective cohort study. BMC Musculoskelet Disord. 2022;23(1):302. doi: 10.1186/s12891-022-05239-3 [DOI] [PMC free article] [PubMed] [Google Scholar]
- 36.Flowers KM, Patton ME, Hruschak VJ, Fields KG, Schwartz E, Zeballos J, Kang JD, Edwards RR, Kaptchuk TJ, Schreiber KL. Conditioned open-label placebo for opioid reduction after spine surgery: a randomized controlled trial. Pain. 2021;162(6):1828–1839. doi: 10.1097/j.pain.0000000000002185 [DOI] [PMC free article] [PubMed] [Google Scholar]
- 37.Schreiber KL, Zinboonyahgoon N, Flowers KM, Hruschak V, Fields KG, Patton ME, Schwartz E, Azizoddin D, Soens M, King T, Partridge A, Pusic A, Golshan M, Edwards RR. Prediction of Persistent Pain Severity and Impact 12 Months After Breast Surgery Using Comprehensive Preoperative Assessment of Biopsychosocial Pain Modulators. Ann Surg Oncol. 2021;28(9):5015–5038. doi: 10.1245/s10434-020-09479-2 [DOI] [PMC free article] [PubMed] [Google Scholar]
- 38.Gamez BH, Habib AS. Predicting Severity of Acute Pain After Cesarean Delivery: A Narrative Review. Anesthesia & Analgesia. 2018;126(5):1606–1614. doi: 10.1213/ANE.0000000000002658 [DOI] [PubMed] [Google Scholar]
- 39.Rogers RG, Nix M, Chipman Z, Breen M, Dieterichs C, Nutt S, Moxham J, Chang P, Rathouz PJ, Robertson H, Young A. Decreasing Opioid Use Postpartum: A Quality Improvement Initiative. Obstetrics & Gynecology. 2019;134(5):932–940. doi: 10.1097/AOG.0000000000003512 [DOI] [PubMed] [Google Scholar]
- 40.Leziak K, Yee LM, Grobman WA, Badreldin N. Patient Experience with Postpartum Pain Management in the Face of the Opioid Crisis. Journal of Midwifery & Women’s Health. 2021;66(2):203–210. doi: 10.1111/jmwh.13212 [DOI] [PMC free article] [PubMed] [Google Scholar]
- 41.Azizoddin DR, Soens MA, Beck MR, Flowers KM, Edwards RR, Schreiber KL. Perioperative Sleep Disturbance Following Mastectomy: A Longitudinal Investigation of the Relationship to Pain, Opioid Use, Treatment, and Psychosocial Symptoms. The Clinical Journal of Pain. 2023;39(2):76–84. doi: 10.1097/AJP.0000000000001090 [DOI] [PMC free article] [PubMed] [Google Scholar]
- 42.Chen YYK, Boden KA, Schreiber KL. The role of regional anaesthesia and multimodal analgesia in the prevention of chronic postoperative pain: a narrative review. Anaesthesia. 2021;76 Suppl 1(Suppl 1):8–17. doi: 10.1111/anae.15256 [DOI] [PMC free article] [PubMed] [Google Scholar]
- 43.Domínguez-Solís E, Lima-Serrano M, Lima-Rodríguez JS. Non-pharmacological interventions to reduce anxiety in pregnancy, labour and postpartum: A systematic review. Midwifery. 2021;102:103126. doi: 10.1016/j.midw.2021.103126 [DOI] [PubMed] [Google Scholar]
- 44.Manber R, Bei B, Simpson N, Asarnow L, Rangel E, Sit A, Lyell D. Cognitive Behavioral Therapy for Prenatal Insomnia: A Randomized Controlled Trial. Obstetrics & Gynecology. 2019;133(5):911–919. doi: 10.1097/AOG.0000000000003216 [DOI] [PMC free article] [PubMed] [Google Scholar]
- 45.Buvanendran A, Sremac AC, Merriman PA, Della Valle CJ, Burns JW, McCarthy RJ. Preoperative cognitive–behavioral therapy for reducing pain catastrophizing and improving pain outcomes after total knee replacement: a randomized clinical trial. Reg Anesth Pain Med. 2021;46(4):313–321. doi: 10.1136/rapm-2020-102258 [DOI] [PubMed] [Google Scholar]
- 46.Edwards RR, Mensing G, Cahalan C, Greenbaum S, Narang S, Belfer I, Schreiber KL, Campbell C, Wasan AD, Jamison RN. Alteration in Pain Modulation in Women With Persistent Pain After Lumpectomy: Influence of Catastrophizing. Journal of Pain and Symptom Management. 2013;46(1):30–42. doi: 10.1016/j.jpainsymman.2012.06.016 [DOI] [PMC free article] [PubMed] [Google Scholar]
- 47.Petersen KK, Vaegter HB, Stubhaug A, Wolff A, Scammell BE, Arendt-Nielsen L, Larsen DB. The predictive value of quantitative sensory testing: a systematic review on chronic postoperative pain and the analgesic effect of pharmacological therapies in patients with chronic pain. Pain. 2021;162(1):31–44. doi: 10.1097/j.pain.0000000000002019 [DOI] [PubMed] [Google Scholar]
- 48.Van Helmond N, Aarts HM, Timmerman H, Olesen SS, Drewes AM, Wilder-Smith OH, Steegers MA, Vissers KC. Is Preoperative Quantitative Sensory Testing Related to Persistent Postsurgical Pain? A Systematic Literature Review. Anesthesia & Analgesia. 2020;131(4):1146–1155. doi: 10.1213/ANE.0000000000004871 [DOI] [PubMed] [Google Scholar]
Associated Data
This section collects any data citations, data availability statements, or supplementary materials included in this article.