

Abstract
Skeletal muscle cellular development requires the integrated assembly of mitochondria and other organelles adjacent to the sarcomere in support of muscle contractile performance. However, it remains unclear how interactions among organelles and with the sarcomere relates to the development of muscle cell function. Here, we combine 3D volume electron microscopy, proteomic analyses, and live cell functional imaging to investigate the postnatal reorganization of mitochondria-organelle interactions in skeletal muscle. We show that while mitochondrial networks are disorganized and loosely associated with the contractile apparatus at birth, contact sites among mitochondria, lipid droplets, and the sarcoplasmic reticulum are highly abundant in neonatal muscles. The maturation process is characterized by a transition to highly organized mitochondrial networks wrapped tightly around the muscle sarcomere but also to less frequent interactions with both lipid droplets and the sarcoplasmic reticulum. Concomitantly, expression of proteins involved in mitochondria-organelle membrane contact sites decreases during postnatal development in tandem with a decrease in abundance of proteins associated with sarcomere assembly despite an overall increase in contractile protein abundance. Functionally, parallel measures of mitochondrial membrane potential, NADH redox status, and NADH flux within intact cells revealed that mitochondria in adult skeletal muscle fibers maintain a more activated electron transport chain compared to neonatal muscle mitochondria. These data demonstrate a developmental redesign reflecting a shift from muscle cell assembly and frequent inter-organelle communication toward a muscle fiber with mitochondrial structure, interactions, composition, and function specialized to support contractile function.
Keywords: Postnatal muscle development, 3D mitochondrial structure, volume electron microscopy, organelle interactions, functional cellular imaging
Graphical Abstract

Introduction
Skeletal muscle cellular development necessitates the coordination of physical interactions among mitochondria and other organelles interspersed within the contractile apparatus to meet the functional requirements of muscle contraction (Franzini-Armstrong, 1991). While alterations in mitochondrial content and composition have been studied extensively (Dudley et al., 1987; Ohira et al., 1987; Kim et al., 2017; Hood et al., 2019), the impact of mitochondrial organization on muscle function remains less well understood (Glancy & Balaban, 2021; Kuznetsov et al., 2022). Mitochondria within muscle cells do not operate in isolation; they rely on interactions with other organelles in order to effectively convert and distribute energy in support of muscle contraction (Kaasik et al., 2001; Seppet et al., 2001; Glancy, 2020). Consequently, spatial proximity among mitochondria and other organelles influences the frequency and efficiency of these interactions, thereby regulating functional capacity (Glancy et al., 2020). A comprehensive understanding of how organelle interactions change in response to varying functional demands can offer valuable insights into the role of intracellular organization in muscle cell function.
Several types of mitochondria-organelle interactions play a vital role in cellular energy distribution and metabolism in skeletal muscle (Eisner et al., 2013; Gemmink et al., 2018; Parry & Glancy, 2022). For example, mitochondria in striated muscle cells can form a reticulum, or network, of many adjacent mitochondria (Bubenzer, 1966; Bakeeva et al., 1978; Ogata & Yamasaki, 1985; Kirkwood et al., 1986; Picard et al., 2013; Glancy et al., 2015). These mitochondrial networks provide a structural link between mitochondria interspersed between the contractile apparatus and mitochondria located in large pools at the periphery of the cell (Bubenzer, 1966; Bakeeva et al., 1978; Kirkwood et al., 1986; Glancy et al., 2015) and are also thought to facilitate rapid cellular energy distribution throughout the relatively large skeletal muscle cell (Skulachev, 1969, 1990; Glancy et al., 2015). Mitochondria can also form direct contact sites with their lipid droplet fuel source (Zhang et al., 2011; Bosma, 2016; Gemmink et al., 2018), and these lipid droplet-connected mitochondria are reported to be larger, longer, and have increased interactions with adjacent mitochondria compared to non-lipid droplet connected mitochondria within the same cell (Bleck et al., 2018). Additionally, dynamic interactions between mitochondria and the sarcoplasmic reticulum enable tight regulation of mitochondrial and cytosolic calcium levels, which are essential for energy homeostasis, cell viability, and other cellular processes (Boncompagni et al., 2009; Eisner et al., 2013; Boncompagni et al., 2020). Mitochondria are also closely associated with the energy-demanding contractile machinery occupying most of the cellular volume in skeletal muscle (Andrienko et al., 2003; Katti et al., 2022). Although organelle interactions in skeletal muscle cell culture, adult tissues, and pathological conditions have been investigated (Boncompagni et al., 2009; Eisner et al., 2013; Bleck et al., 2018; Boncompagni et al., 2020), the role of interorganelle connectivity during muscle cell development, a critical period for communication and coordination, remains largely unexplored.
Here, we characterize the physical reorganization of the cellular energy distribution system in skeletal muscle during postnatal development, focusing on mitochondria-organelle interactions. By leveraging the high-resolution and large field of view provided by focused ion beam scanning electron microscopy (FIB-SEM) (Heymann et al., 2006; Glancy et al., 2015) combined with machine learning image segmentation (Sommer et al., 2011), we provide a high-throughput analysis of 3D mitochondria-organelle interactions within developing skeletal muscle. Our findings reveal that while tortuous mitochondria are loosely interspersed within the contractile machinery at birth (Bakeeva et al., 1981; Mishra et al., 2015), neonatal muscles display frequent interactions among mitochondria, lipid droplets, and the sarcoplasmic reticulum. As muscles mature into oxidative or glycolytic fiber types, mitochondria undergo a structural transition, becoming more linear and tightly associated with the contractile apparatus (Bakeeva et al., 1981; Mishra et al., 2015). However, muscle maturation also involves less frequent interactions among mitochondria, lipid droplets, and the sarcoplasmic reticulum, with glycolytic muscle exhibiting a near-complete loss of lipid droplets. Additionally, by performing new proteomic analyses, we report reduced expression levels of proteins implicated in mitochondria-organelle membrane contact sites during postnatal development, along with a decrease in proteins related to sarcomere and cellular assembly, despite a large increase in overall contractile protein abundance. Finally, functional analyses of intact muscle cell mitochondrial membrane potential, NADH redox status, and NADH flux indicate that adult skeletal muscle mitochondria maintain a more active electron transport chain compared to neonatal muscle mitochondria. These results highlight a functional redesign of the skeletal muscle cell during postnatal development, transitioning from frequent organelle interactions in coordination with cellular assembly at birth to a cellular energy distribution system specifically tailored to facilitate contractile function in the mature skeletal muscle cell.
Materials and Methods
Ethical Approval
All animal procedures were approved by the National Heart, Lung, and Blood Institute Animal Care and Use Committee and performed in accordance with the guidelines described in the Animal Care and Welfare Act (7 USC 2142 § 13).
Mice
C57BL6/N mice (~6–8 weeks old) were obtained from Taconic Biosciences (Rensselaer, NY) and were used as breeding pairs. Their offspring was randomly assigned as postnatal (P) 1, P14, and P42 group (n=3–4 per group). All pups were weaned at P21-P28, and both breeders and weaned animals accessed to food and water ad libitum. The vivarium was maintained on a 12:12 h light and dark cycle at 20–26 °C. Due to a technical limitation in using anogenital distance to ascertain sex in P1 pups, we randomly used male and female animals rather than separating experimental groups by sex.
Muscle Sample Preparation
As in a previous study (Bleck et al., 2018), both soleus (oxidative) and gastrocnemius (glycolytic) muscle fibers were carefully excised and fixed for FIB-SEM imaging acquisition. Briefly, skin-peeled hindlimbs were submerged in a fixative solution (2% glutaraldehyde in 0.1M phosphate buffer, pH 7.2) for 30 minutes, while mice were under anesthetization with 2% isoflurane by nosecone. Upon completion of the in vivo fixation protocol, the fixed muscles were excised and the animal euthanized by exsanguination. After one-hour incubation in standard fixative solution (2.5% glutaraldehyde, 1% formaldehyde, 0.12 M sodium cacodylate, pH 7.2–7.4), the excised tissues were subsequently post-fixed and en bloc stained (i.e., 2% aqueous osmium tetroxide incubation) following the published protocol with minor modifications(Bleck et al., 2018). After an overnight incubation in 1% uranyl acetate solution at 4 °C, the samples were incubated at 60 °C for 20 min with Walton’s lead aspartate (0.02 M lead nitrate, 0.03 M aspartic acid, pH 5.5) and were thoroughly washed with distilled H2O at room temperature. Afterward, the samples were gradually dehydrated with ethanol and were then incubated in 25%, 50%, 75%, and 100% Embed 812 resin solutions for ~36 hours. Then, the tissue samples were placed on ZEISS SEM specimen mounts (Electron Microscopy Sciences, #75225, USA) and were polymerized at 60 °C for 2–3 days. After the polymerization, the samples were cut and polished by Leica UCT Ultramicrotome (Leica Microsystems Inc., USA) that carried Trimtool 90 diamond knives (DiATOME, Switzerland).
FIB-SEM imaging
The ZEISS crossbeam 540 (Gemini II) was used to collect FIB-SEM images at 10 nm voxel size with ZEISS Atlas 5 software (Carl Zeiss Microscopy GmbH, Jena, Germany). The FIB milling (10 nm thickness) was conducted at 30 keV, while maintaining a beam current at 2–2.5 nA. All collected micrographs were aligned with a proprietary algorithm and then exported as 8-bit TIFF files for further imaging analysis.
Segmentation of cellular structures
All image processing was conducted on a desktop PC (New Tech Solutions, Fremont, CA) equipped with an Intel Xeon W-2155 (3.3 GHz processor, 10 cores/20 threads) and 256 GB RAM. As done previously(Bleck et al., 2018), Ilastik pixel classification software (Ilastik.org) was used for semi-automated image classification and segmentation of 3D structures of mitochondria and other subcellular organelles including lipid droplets, sarcoplasmic reticulum, and t-tubules. Also as done previously(Bleck et al., 2018), individual mitochondria were segmented using the Multicut module in Ilastik. All data were exported as a 32-bit HDF file for imaging analysis with ImageJ (National Institutes of Health, Bethesda, MD, ImageJ.net).
Imaging Analysis
After loading with the HDF5 plugin, all HDF image datasets were processed to investigate both mitochondrial network configurations and individual mitochondrial structures. Following the established analytical pipeline(Bleck et al., 2018), several ImageJ plugins and analytical tools were used to examine mitochondrial networks (OrientationJ Distributions plugin), individual mitochondrial structures (ROIManager3D plugin), intermitochondrial junctions (Image Calculator tool), and mitochondrial spatial interactions with other subcellular components (Image Calculator tool and 3D Geometrical Measure tool). All 3D mitochondrial and subcellular components were extracted and visualized using 3D viewer and volume viewer on ImageJ or in Imaris.
Mitochondrial nanotunnel abundance was assessed by determining the amount of mitochondrial volume with a diameter of 150 nm or less. This threshold value was chosen to ensure that only the thin, nanotunnel protrusions were selected since using a 200 nm value often selected entire mitochondria, particularly in P42 glycolytic cells. 8-bit binary mitochondrial segmentation files were opened in ImageJ and the Local Thickness plugin(Dougherty & Kunzelmann, 2007) was used to determine the local diameters of mitochondria. A 3D median filter of 100nm × 100nm × 100nm was then applied and nanotunnels were selected as all pixels with a filtered local thickness of 150 nm or less using the Manual Threshold tool. The number of pixels within nanotunnels was divided by the total number of mitochondrial pixels and multiplied by 100 to determine the percent nanotunnel volume.
FDB Fiber Isolation & Imaging
FDB muscles of mice were dissected and immediately placed into Tyrodes buffer (pH 7.4, 10 mM HEPES, 137 mM sodium chloride, 4.5 mM potassium chloride, 0.5 mM magnesium sulfate, 0.5 mM potassium phosphate, 10 mM glucose, and 1.8 mM calcium chloride) and 3 mg/ml collagenase solution. The muscles were agitated in a water bath at 37°C for 20 – 75 minutes, depending on the age of mouse (for younger age, less incubation time). The Tyrodes and collagenase solution was then removed, and the digested muscle was resuspended in Tyrodes. Individual muscle fibers were released by gentle trituration (Park et al., 2014). Once cells were isolated, the solution was set aside to allow cells to settle to the bottom of the tube. The remaining Tyrodes solution was siphoned off, and the cells were resuspended in either 2 μM Rhod-2 AM (Thermo Fisher, Waltham, MA) or 5 nM tetramethyl rhodamine, methyl ester (TMRM, Invitrogen, Waltham, MA) and 200 nM MitoTracker Green dye (MTG, Thermo Fisher, Waltham, MA). Rhod-2 stained cells were incubated at 37°C for 1 hour with gentle agitation. The Rhod-2 dye was removed and then washed twice with 200 nM MitoTracker Green were performed prior to imaging. TMRM and MitoTracker Green solution incubated at 37°C for 10 minutes prior to imaging.
Muscle cells were imaged with a Leica upright SP8 microscope with a Nikon 25x (1.1 NA) water-immersion objective. Confocal sequential line scanning and internal HyD detectors were used during image capture. TMRM or Rhod-2 and MitoTracker Green were imaged with 488 nm and 552 nm excitation and 500 – 550 nm and 590 – 650 nm emission wavelengths, respectively.
Image analysis was performed on the whole fiber Z-stack using Fiji ImageJ. Thresholding of the MitoTracker Green signal created a mask of mitochondrial content. The mask was then applied to the TMRM or Rhod-2 images, therefore normalizing the variable measurements to the pixels contained within the mask. Using the Image Calculator in ImageJ, the mask was divided by itself to obtain 1.0 for mitochondrial pixels and NaN for non-mitochondrial pixels. The resultant image was then multiplied by each TMRM, Rhod-2, and MTG image to obtain masked images. The mean pixel values were then used to determine pixel intensity. TMRM and Rhod-2 values were then normalized to MTG pixel intensity to account for mitochondrial content.
MitoRACE
Mitochondrial flux capacity was measured using the MitoRACE method(Willingham et al., 2019). Briefly, FDB fibers were isolated as described above. The isolated fibers were then plated on Cell-Tak coated dishes. Optimal adhesion was achieved by allowing the cells to settle for upwards of 60 minutes before performing further experiments.
Imaging cells was performed using a Leica upright SP8 microscope. Multiphoton laser-scanning fluorescence was used to collect the autofluorescence of NADH. A microperfusion system (MultiChannel Systems, Reutlingen, Germany) was used to flush Tyrodes buffer through the coated cells at 7.8 mL/min. After 30 seconds of baseline imaging, 5 mM sodium cyanide was added to solution to inhibit oxidative phosphorylation. The immediate rise in NADH autofluorescence was then captured. NADH fluorescence was excited at 750 nm and emission was detected using a Leica HyD detector at 414 – 538 nm. Rapid imaging of 32 μm in depth was also employed to obtain measurements throughout the cell depth. Since the complete oxidation of NADH results in zero signal in our system (Willingham et al., 2019), the baseline redox status was calculated based on the baseline and fully reduced NADH intensities.
Fluorescence Lifetime Imaging (FLIM)
NADH fluorescence lifetime decay was measured using isolated FDB muscle fibers as described above. Cells were then imaged using a two-photon Leica (Germany) FALCON FLIM SP8 upright microscope. NADH autofluorescence was excited at 750 nm, and the emission was set at 420 – 440 nm. FLIM images were taken at a speed of 400 Hz, 50 frame repetitions per line.
All FLIM images were converted to a Picoquant BIN file format to integrate with Fiji ImageJ. The files were loaded into FIJI as five-dimensional image stacks using the Bioformats library. Intensity images were produced from the fluorescence lifetime data by integrating the five-dimensional stack across its time dimension. After manual segmentation to remove unwanted artifacts, a manual threshold was applied to the fibers to create a mask, which was then overlaid on top of the five-dimensional image stack, then integrated spatially to produce a single decay curve for each fiber.
After fibers and solutions were converted into fluorescence decay curves, each curve was fitted to an artifact-controlled multi-exponential model convolved with the instrument response function from the Leica system. To determine the appropriate number of lifetimes for this model, components were added or removed to approach unity between the reduced sum of squared residuals.
Once appropriate models for the fibers were determined, curves from each dataset were simultaneously fitted to their respective models via global lifetime analysis (Knutson et al., 1983; Smirnov et al., 2009). Briefly, to establish a baseline test statistic, all curves from each dataset were first fitted to their model predetermined in the prior single curve analysis assuming unlinked lifetime parameters. To determine whether curves shared lifetime species, lifetime terms in the model were permuted to be linked or unlinked across all curves in the dataset, then were fitted keeping all other model options the same. To test whether the linkage assumptions were false, each linked permutation reduced sum of squared residuals was divided by the baseline sum of squared residuals and was mapped to the appropriate F-statistic for the number of degrees of freedom across the dataset. It was determined that all curves within each dataset shared molecular species, meaning that any subsequent calculations of relative species contribution would yield higher accuracy compared to results from a non-global lifetime analysis.
Using the global fit lifetime models, lifetime values of 4.14 ns, 1.36 ns, and 0.39 ns were resolved. Lifetime values around 0.5 ns are known for free NADH, whereas values between 1.4 – 4 ns have been reported for bound NADH(Datta et al., 2020). The amount of molecules contributing to each of NADH components was determined from the amplitude values. The sum of amplitudes for all the components provided a measure of total NADH molecules within each muscle fibers. The average amplitudes were then determined for each developmental stage (P1, P14, P42 oxidative, and P42 glycolytic). A relative measure of total NADH per fiber was determined by finding the ratio of amplitude of each development stage to P42 glycolytic fibers. This value was then used to determine NADH concentration oxidized per second during the NADH flux analysis using a mitochondrial NADH concentration of 2.45 mM previously measured by HPLC in adult mouse hindlimb muscle mitochondria (Willingham et al., 2019). Importantly, the mitochondrial NADPH concentration measured by HPLC in the same mitochondria was <100 μM indicating that mitochondrial NADH contributes >95% of the overall NAD(P)H signal.
Statistical Analysis
Using Excel 2016 (Microsoft, Redmond, WA) and Prism 8 (GraphPad, San Diego, CA), we conducted all statistical analyses. Two-Way ANOVA was used to assess mean values of each dataset within and between groups (Fiber Type [Glycolytic, Oxidative] × Development [P1, P14, P42]). Tukey’s HSD post hoc tests were used for multiple comparisons of muscle type and developmental stage. Sidak’s multiple comparisons test was used for lipid droplet connected/not connected and high/low SR/T connected mitochondrial analyses. Statistical significance level was set at P < 0.05.
Results
Dynamic reorganization of mitochondrial networks during postnatal development.
To evaluate mitochondria-organelle interactions during postnatal muscle development, we used FIB-SEM to collect mouse skeletal muscle cell volumes with 10 nm pixel sizes in 3D at birth (postnatal day 1 (P1), Supplementary Movie 1), during the dynamic phase of the transition between neonatal and mature mitochondrial networks(Kim et al., 2019) (P14, Supplementary Movie 2), and after mitochondrial network structures had reached maturity(Kim et al., 2019) (P42, Supplementary Movies 3–4). To account for the muscle fiber type differences in mitochondrial intra- and inter-organelle interactions previously observed in mature muscles(Bleck et al., 2018), we imaged cells from both the soleus and gastrocnemius muscles representing more oxidative and glycolytic muscles, respectively(Burkholder et al., 1994), and further confirmed adult muscle cell type based on mitochondrial content(Bleck et al., 2018). Machine learning segmentation of the FIB-SEM muscle volumes(Sommer et al., 2011; Beier et al., 2017; Bleck et al., 2018) allowed for high-throughput analyses of mitochondrial, lipid droplet (LD), and sarcotubular (sarcoplasmic reticulum + t-tubules; SR/T) structures as well as interactions among them.
Mitochondrial structure within a cell is coordinated across different spatial scales ranging from cell-wide networks to the size and shape of individual organelles to interactions with adjacent organelles(Bleck et al., 2018; Glancy et al., 2020) (Figure 1a–f). Beginning at the cellular scale, networks of tortuous mitochondria were primarily aligned parallel to but loosely associated with the contractile apparatus in both newborn muscle types (Figure 1a,d,i,j Supplementary Movie 1). Additionally, overall mitochondrial volume and number were similar between muscle types at birth (Figure 1g–h, 6.3±1.2% and 7.0±0.4% of total muscle volume, 345±20 and 313±17 mitochondria/1000 μm3 muscle, mean±SE, n=3 muscle volumes, 618 and 276 mitochondria for P1 soleus and gastrocnemius, respectively). These data suggest that mitochondrial network configuration in neonatal muscles is driven by developmental status rather than muscle type at this stage. During the postnatal transition phase (P14), overall mitochondrial content and number were little changed from birth and were again no different between muscle types (Figure 1g–h, 10.8±0.2% and 7.7±1.9% of total muscle volume, 400±26 and 443±6 mitochondria/1000 μm3 muscle, mean±SE, n=3 muscle volumes, 1124 and 1848 mitochondria for P14 soleus and gastrocnemius, respectively). However, mitochondrial networks in both muscles began to associate more closely with the contractile apparatus at P14 (Figure 1b,e,j Supplementary Movie 2). In the soleus, mitochondrial networks became more linear and elongated along the parallel axis and began to form short branches along the perpendicular axis at the ends of the sarcomeres near the z-disk (Figure 1b,i). In contrast, while the mitochondrial networks in the gastrocnemius muscle also became more linear and elongated compared to at birth (Figure 1e), there was a greater contribution of perpendicularly oriented mitochondrial branches compared to the soleus muscle (Figure 1i). By P42, the divergence of mitochondrial network configurations between muscle types was completed (Figure 1c,f,i) as mitochondrial volume and number were significantly higher in the oxidative compared to glycolytic muscles (Figure 1g–h, 10.8±2.2% and 3.6±0.3% of total muscle volume, 420±37 and 247±25 mitochondria/1000 μm3 muscle, mean±SE, n=3 muscle volumes, 1147 and 475 mitochondria for P42 oxidative and glycolytic muscles, respectively), and the mitochondrial networks reached their mature grid-like (oxidative, Supplementary Movie 3) and primarily perpendicular (glycolytic, Supplementary Movie 4) orientations (Figure 1c,f,i). These data suggest that the formation of cell-type specific mitochondrial network configurations occurs in concert with the fiber-type specificity of myosin isoform composition that occurs during postnatal development(Agbulut et al., 2003; Gokhin et al., 2008).
Figure 1: Dynamic reorganization of mitochondrial networks during postnatal development.

a-f) Representative 3D rendering of individual mitochondria within networks in oxidative (O; SOL) and glycolytic (G; GAS) fibers of mice at postnatal (P) day 1, 14, and 42, respectively. Mitochondrial networks are arranged along muscle contraction axis (yellow arrow) and 90-degree rotated images are depicted in the upper-right corner. Each color indicates individual mitochondria. g) Total mitochondrial volume (% of muscle area). h) Mitochondrial number per 1000 μm3 of muscle. i) Mitochondrial network orientations are calculated in a ratio of parallel to perpendicular arrangement. j) Mitochondrial surface area within 30 nm of a sarcomere. k) Individual mitochondrial volume (μm3). l) Mitochondrial surface area to volume ratio (μm−1). N values: P1 oxidative – 609 mitochondria, 3 datasets; P14 oxidative – 1115 mitochondria, 3 datasets; P42 oxidative – 1414 mitochondria, 3 datasets; P1 glycolytic – 274 mitochondria, 3 datasets; P14 glycolytic – 1828 mitochondria, 3 datasets; P42 glycolytic – 462 mitochondria, 3 datasets. Points are means for each dataset. Bars are means ± SE. *P < 0.05, vs P1; #P < 0.05, vs P14; %P < 0.05, vs O (SOL); αP<0.05, main effect of development; βP<0.05, main effect of fiber type; χP<0.05, interaction effect of development and fiber type. scale bar = 1 μm.
At the single organelle level, the volume of individual mitochondria followed a similar time course to the overall mitochondrial content in both muscle types, where content gradually increased across development in the oxidative muscles and fell in the glycolytic muscles (Figure 1k). While there were no significant differences in mitochondrial surface area to volume (SA/V) ratio among individual groups (Figure 1l), gastrocnemius muscle mitochondria as a whole had greater SA/V ratios compared to soleus muscle mitochondria consistent with previous reports on glycolytic versus oxidative muscle mitochondria(Kirkwood et al., 1986; Kirkwood et al., 1987; Bleck et al., 2018). To further investigate how individual muscle mitochondrial morphology is altered across postnatal development, we quantified the relative number of small (~80–120 nm) donut-like holes in mitochondria (Figure 2a), which have been suggested as a marker of oxidative stress(Liu & Hajnoczky, 2011). In soleus muscles, the number of mitochondrial donuts was highest at birth and then dropped significantly at P14 and remained low in the mature muscle (Figure 2b, 20.0±2.4, 3.3±0.6, and 1.5±0.4 mito donuts per 100 μm3 mito volume, n=3 muscle volumes, 26, 10, and 5 donuts for P1, P14, and P42, respectively). In the gastrocnemius, there were no differences in the number of donuts compared to the soleus at birth. However, the relative number of mitochondrial donuts rose significantly to more than thirty-fold higher than in the oxidative muscles at P42 (Figure 2b, 20.6±1.6, 13.5±4.0, and 45.8±3.1 mito donuts per 100 μm3 mito volume, n=3 muscle volumes, 17, 24, and 32 donuts for P1, P14, and P42, respectively), suggesting that the increased formation of donuts reported previously in glycolytic muscles (Bleck et al., 2018) may be reflected at the mitochondrial level beginning during the late postnatal phase of development. Mitochondrial nanotunnels are another specialized mitochondrial morphology, which is also thought to be a marker oxidative stress (Huang et al., 2013; Lavorato et al., 2017; Vincent et al., 2017). Formation of thin, elongated nanotunnels (Figure 2c) was relatively rare early in development and made up less than 0.5% of mitochondrial volume at P1 and P14 (Figure 2d). However, nanotunnel formation increased significantly by P42 in the glycolytic muscles (Figure 2d, 0.35±0.10, 0.13±0.08, and 0.51±0.15 %nanotunnel volume per mito volume, n=3 muscle volumes for P1, P14, and P42 oxidative muscles, respectively; 0.30±0.05, 0.37±0.08, and 1.53±0.43 %nanotunnel volume per mito volume, n=3 muscle volumes for P1, P14, and P42 glycolytic muscles, respectively). Thus, mature glycolytic muscles are characterized by the most frequent abundance of both mitochondrial donuts and nanotunnels compared to oxidative and developing muscles.
Figure 2: Dynamic reorganization of mitochondrial networks during postnatal development.

a) 3D rendering of mitochondrial donuts within a P42 glycolytic muscle. b) Donut-shaped mitochondria are counted per 100 μm3 of mitochondrial volume. c) 3D rendering of mitochondrial nanotunnels (blue) extending out from a P42 glycolytic muscle mitochondrion (green). d) Nanotunnel volume as a proportion of total mitochondrial volume. Nanotunnels defined as regions with <150 nm diameters. e) 3D rendering of intermitochondrial junctions (IMJs, yellow) within a P1 soleus muscle mitochondrial network (transparent grey). f) 3D rendering of IMJs (yellow) within a P42 soleus muscle mitochondrial network (transparent grey). g) Individual IMJ area (μm3). h) IMJ area per mitochondrial surface area (%). i) Quantification of intermitochondrial junction (IMJ) orientation. N values: P1 oxidative – 609 mitochondria, 375 IMJ, 3 datasets; P14 oxidative – 1115 mitochondria, 523 IMJ, 3 datasets; P42 oxidative – 1414 mitochondria, 509 IMJ, 3 datasets; P1 glycolytic – 274 mitochondria, 173 IMJ, 3 datasets; P14 glycolytic – 1828 mitochondria, 786 IMJ, 3 datasets; P42 glycolytic – 462 mitochondria, 263 IMJ, 3 datasets. Points are means for each dataset. Bars are means ± SE. *P < 0.05, vs P1; #P < 0.05, vs P14; %P < 0.05, vs O (SOL); αP<0.05, main effect of development; χP<0.05, interaction effect of development and fiber type. Scale bars = 200 nm (a,c); 2 μm (e,f).
To determine whether interactions among mitochondria were altered during postnatal muscle development, we assessed the size, abundance, and orientation of the intermitochondrial junctions (IMJs) between adjacent mitochondria (Figure 2e,f), which have been suggested to allow for rapid communication and distribution of molecules among physically coupled mitochondria (Picard et al., 2015; Glancy et al., 2017). The size of individual IMJs and relative abundance of IMJs per mitochondrion were both largely similar across muscle types and developmental timepoints with the exception of an increase in both size and abundance observed at P14 in the soleus compared to the mature oxidative muscle (Figure 2g,h). Conversely, while there were no differences in IMJ orientation detected between muscle types, each muscle type demonstrated a loss of parallel and a gain of perpendicularly oriented IMJs upon maturation (Figure 2i). These data suggest that the putative physical coupling sites permitting the transfer of signaling molecules, metabolites, and/or ions directly between adjacent mitochondria are primarily altered by changing their orientation within the cell rather than size or abundance during postnatal development.
Mitochondria-lipid droplet (LD) contact sites decrease in frequency across postnatal development.
To evaluate how mitochondrial interactions with other organelles were altered during postnatal muscle development, we began by assessing the size and content of the lipid droplets (Figure 3a–c), which provide a direct fuel source for mitochondrial oxidative phosphorylation (Kanaley et al., 2009; Meex et al., 2015). Overall muscle content and the size of individual lipid droplets were highest at birth in both muscle types, followed by a significant decrease during the late postnatal stage that continued into maturation (Figure 3d,e). Contact sites between mitochondria and lipid droplets (i.e., membranes within 30 nm(Gatta & Levine, 2017)) followed a similar pattern with a nearly ten-fold loss in lipid droplet contact site abundance per mitochondrion across postnatal development in the oxidative muscles and a complete loss of contact sites in the mature glycolytic muscle where no lipid droplets were found (Figure 3f). These data suggest that physical interactions between mitochondria and lipid droplets, which facilitate the direct transfer of molecules between them (Herker et al., 2021), may be directly related to the metabolic fuel preferences of the skeletal muscle cell, as neonatal muscles are known to rely more heavily on fatty acids compared to adult muscles (Glatz & Veerkamp, 1982), while glycolytic muscles rely more on carbohydrate fuel sources relative to oxidative muscles (Hargreaves & Spriet, 2020).
Figure 3: Mitochondria-lipid droplet (LD) contact sites decrease in frequency across postnatal development.

a-c) Representative 3D rendering of mitochondrial networks (colored in sky blue) and lipid droplets (colored in yellow) of oxidative fibers of mice at postnatal (P) day 1, 14, and 42, respectively. All images are aligned to contraction axis. d) Total lipid droplet volume (% of muscle). e) Individual lipid droplet volume (μm3). N values: P1 oxidative – 183 LD, 3 datasets; P14 oxidative – 117 LD, 3 datasets; P42 – 81 LD, 3 datasets; P1 glycolytic – 53 LD, 3 datasets; P14 glycolytic – 89 LD, 3 datasets; P42 glycolytic – 0 LD, 3 datasets. f) LD contact per mitochondrial surface area (%). g-i) Individual mitochondrial volume (μm3; g), Mitochondrial surface area to volume ratio (μm−1; h), and Intermitochondrial junction area (μm2; i) connected with LD (LD connected) and non-connected with LD (LD not connected). N values (LD connected): P1 oxidative – 183 mitochondria, 3 datasets; P14 oxidative – 117 mitochondria, 3 datasets; P42 – 81 mitochondria, 3 datasets; P1 glycolytic – 53 mitochondria, 3 datasets; P14 glycolytic – 89 mitochondria, 3 datasets; P42 glycolytic – 0 mitochondria, 3 datasets; N values (LD not connected): P1 oxidative – 414 mitochondria, 3 datasets; P14 oxidative – 406 mitochondria, 3 datasets; P42 – 428 mitochondria, 3 datasets; P1 glycolytic – 219 mitochondria, 3 datasets; P14 glycolytic – 697 mitochondria, 3 datasets; P42 glycolytic – 263 mitochondria, 3 datasets. Points are means for each dataset. Bars represent means±SE. *P < 0.05, vs P1; %P < 0.05, vs O (SOL); αP<0.05, main effect of development. βP<0.05, main effect of fiber type. Scale bar = 1 μm.
We previously found that mitochondria in contact with lipid droplets provided a structural capacity for greater energy distribution compared to non-lipid connected mitochondria within the same adult muscle cells(Bleck et al., 2018). To determine whether this apparent structural specialization of mitochondria within a network was present beginning at birth, we assessed individual mitochondrial structural characteristics for lipid droplet connected and non-connected mitochondria separately. Individual mitochondrial volume, a proxy for the internal capacity of a mitochondrion (Glancy et al., 2020), was consistently greater in lipid connected mitochondria for all muscles with lipid droplets present (Figure 3g). Conversely, mitochondrial SA/V ratio, an indicator of the relative capacity to interact with the surrounding environment (Glancy et al., 2020), was lower in lipid droplet connected mitochondria across all timepoints and in both muscle types (Figure 3h). Additionally, the total IMJ area per mitochondrion, an indicator of molecular transfer capacity to mitochondria, trended higher in lipid droplet connected mitochondria (Figure 3i). Together, these data indicate that the specialization of lipid droplet connected mitochondria has already begun at birth and is maintained throughout the maturation process.
Mitochondria-sarcoplasmic reticulum interactions are highly abundant during early postnatal development.
To begin our evaluation of mitochondrial interactions with the SR/T throughout postnatal development, we first assessed the total muscle cell volume occupied by the SR/T. At birth, the SR/T formed an unorganized mesh wrapping around the myofibrils with no difference in total volume between muscle types (Figure 4a,c,e), similar to previous work in mice(Luff & Atwood, 1971; Franzini-Armstrong, 1991). During maturation, the SR/T became more organized into the well-known longitudinal SR mesh and SR/T triads wrapping around the myofibrils (Figure 4b,d) with SR/T in the mature glycolytic muscle occupying a greater volume than in newborn muscles or mature oxidative muscle (Figure 4e), also in line with previous reports(Luff & Atwood, 1971; Eisenberg, 2010; Bleck et al., 2018). These data demonstrate the cell-type specification of the SR/T as well as the consistency between our 3D analysis and previous 2D assessments of SR/T volume.
Figure 4: Mitochondria-sarcoplasmic reticulum interactions are highly abundant during early postnatal development.

a-d) Representative 3D rendering of mitochondrial network (colored in sky blue color), sarcoplasmic reticulum/t-tubules (SR/T; colored in magenta), and lipid droplets (colored in yellow) in oxidative (O: SOL) and glycolytic (G: GAS) fibers of mice at postnatal (P) day 1 and 42, respectively. These 3D images are arranged along muscle contraction axis and the 90-degree rotated images are depicted in the box of dotted lines. e) Total SR/T volume (% of muscle). f) Mitochondrial surface area in contact with SR/T (%). N values: P1 oxidative – 566 Mitochondria in contact with SR/T (M-SR/T), 3 datasets; P14 oxidative – 1111 M-SR/T, 3 datasets; P42 – 1023 M-SR/T, 3 datasets; P1 glycolytic – 296 M-SR/T, 3 datasets; P14 glycolytic – 1811 M-SR/T, 3 datasets; P42 glycolytic – 458 M-SR/T, 3 datasets. g) Mitochondria with at least 10% surface area contact with SR/T (%). N values: P1 oxidative – 566 Mitochondria in contact with SR/T (M-SR/T), 3 datasets; P14 oxidative – 1111 M-SR/T, 3 datasets; P42 – 1023 M-SR/T, 3 datasets; P1 glycolytic – 296 M-SR/T, 3 datasets; P14 glycolytic – 1811 M-SR/T, 3 datasets; P42 glycolytic – 458 M-SR/T, 3 datasets h-j) Individual mitochondrial volume (μm3; h), Mitochondrial surface area to volume ratio (μm−1; i), and Intermitochondrial junction area (% of mito surface area; j) in mitochondria highly connected with SR/T (>=10% SRC [large area connected] vs. <10% SRC [less area connected]). N values (>=10% SRC): P1 oxidative – 494 mitochondria, 3 datasets; P14 oxidative – 131 mitochondria, 3 datasets; P42 – 174 mitochondria, 3 datasets; P1 glycolytic – 252 mitochondria, 3 datasets; P14 glycolytic – 354 mitochondria, 3 datasets; P42 glycolytic – 110 mitochondria, 3 datasets; N values (<10% SRC): P1 oxidative – 72 mitochondria, 3 datasets; P14 oxidative – 980 mitochondria, 3 datasets; P42 – 849 mitochondria, 3 datasets; P1 glycolytic – 44 mitochondria, 3 datasets; P14 glycolytic – 1457 mitochondria, 3 datasets; P42 glycolytic – 348 mitochondria, 3 datasets. Points are means for each dataset. Bars represent means±SE. *P < 0.05, vs P1; %P < 0.05, vs O (SOL); #P < 0.05, vs P14; χP < 0.05, interaction effect of development and fiber type; αP<0.05, main effect of development. Scale bar = 1 μm.
Next, we assessed the physical interactions between the SR/T and 5332 individual mitochondria during postnatal development. Nearly, every mitochondrion across all conditions had at least one contact (membranes within 30 nm) with the SR/T (99.6±0.5, 99.6±0.2, 99.4±0.2, 99.3±0.3, 99.6±0.2, 98.3±1.2% of mitochondria in contact with SR/T, n=300, 570, 1847, 1124, 468, 1023 mitochondria in 3 datasets for P1 gastrocnemius, P1 soleus, P14 gastrocnemius, P14 soleus, P42 glycolytic, and P42 oxidative, respectively). The triadic nature of the interactions between the t-tubules and the sarcoplasmic reticulum (SR) means that most of the t-tubule surface is covered by the SR(Franzini-Armstrong, 1991), and, as a result, the mitochondrial interactions with the SR/T volume detected here are almost exclusively interactions between mitochondria and the SR. At birth, roughly one-sixth of the mitochondrial surface area was in direct contact with the SR/T on average with more than 80% of mitochondria having at least 10% of its surface area in contact with the SR/T (Figure 4f,g, 16.6±2.2 and 17.3±2.3% mitochondrial surface area contact with SR/T, 83.5±7.9 and 84.3±10.7% of mitochondria with >10% surface area contact with SR/T, n=300 and 570 mitochondria in 3 datasets for P1 gastrocnemius and P1 soleus, respectively). By two weeks of age, interactions between mitochondria and the SR/T fell by more than two-fold for mean surface area contact and more than four-fold for percentage of mitochondria with at least 10% surface area in contact and were maintained at this level into maturity for both muscle types (Figure 4f,g, 7.0±1.1, 6.1±0.6, 8.1±0.6, and 6.8±0.4% mitochondrial surface area contact with SR/T, 18.0±6.7, 15.2±1.9, 18.5±1.1, and 17.1±1.8% of mitochondria with >10% surface area contact with SR/T, n=1847, 1124, 468, and 1023 mitochondria in 3 datasets for P14 gastrocnemius, P14 soleus, P42 glycolytic and P42 oxidative, respectively). These data demonstrate the ubiquitous yet dynamic nature of mitochondrial interactions with the SR in muscle cells.
Due to the unique structural characteristics of lipid droplet-connected mitochondria described above (Figure 3), we hypothesized that mitochondria with high SR/T contact areas may have different morphology compared to lower SR/T contacting mitochondria. To investigate potential differences among mitochondria with high and low SR/T contact, we compared the structures of individual mitochondria with more or less than 10% surface area contact with the SR/T (Figure 4g–j). No differences in mitochondrial volume were detected between high and low SR/T contact mitochondria (Figure 4h). Mitochondrial SA/V ratio was lower in high SR/T contact mitochondria at P14 in both gastrocnemius and soleus muscles and in P42 oxidative muscles (Figure 4i). Additionally, there were no significant differences in mitochondrion-to-mitochondrion interactions through IMJs between high and low SR/T contact groups (Figure 4j). These data are consistent with the lack of structural differences between high and low SR/T contact mitochondria across postnatal cardiac development (Kim et al., 2022) and suggest SR/T contact level may not be associated with mitochondrial specialization as it is for lipid droplet contacts.
Mitochondria-organelle interactions are associated with cellular assembly during postnatal development
To evaluate the integrated role of mitochondrial interactions during postnatal muscle development, we assessed how the total mitochondrial outer membrane surface area in close proximity (30 nm) to other structures changed across time points in both muscle types (Figure 5). At birth, nearly one-quarter of mitochondrial surface area was in direct contact with adjacent organelles and one-tenth of mitochondrial surface area was associated with adjacent sarcomeres in both muscle types (Figure 5a,b,i, 24.6±2.9 and 23.7±1.7% surface area organelle contact per mitochondrion, 10.2±1.1 and 9.1±3.0% surface area associated with sarcomere per mitochondrion, n = 3 datasets each for P1 soleus and P1 gastrocnemius, respectively). However, by P14, membrane contact site abundance had dropped by nearly half and remained at that level throughout development (Figure 4c–i, 13.0±0.7, 11.9±1.3, 9.6±1.1, and 11.9±1.0% surface area contact per mitochondrion, n = 3 datasets each for P14 soleus, P14 gastrocnemius, P42 oxidative, and P42 glycolytic, respectively). Conversely, mitochondrial outer membrane associations with the sarcomere rose throughout development reaching the highest levels in mature muscles (Figure 4c–i, 26.8±3.8, 22.4±2.6, 35.0±8.3, and 28.0±5.4% surface area associated with sarcomere per mitochondrion, n = 3 datasets each for P14 soleus, P14 gastrocnemius, P42 oxidative, and P42 glycolytic, respectively). These data demonstrate the developmental dynamics of mitochondrial interactions where more frequent contacts with other organelles occur early in development followed by a transition to more direct associations with the contractile apparatus in mature muscles.
Figure 5: Specialized mitochondria-organelle interactions transition from supporting cellular assembly to contractile function in skeletal muscle cells.

a,b) Representative single P1 mitochondrion (green) alone (a) and in contact (b) with other mitochondria (magenta), lipid droplets (blue), and SR/T (gold). c,d) Representative single P14 mitochondrion alone (c) and in contact (d) with other mitochondria, lipid droplets, and SR/T. e,f) Representative single P42 oxidative mitochondrion alone (e) and in contact (f) with other mitochondria, lipid droplets, and SR/T. g,h) Representative single P42 glycolytic mitochondrion alone (g) and in contact (h) with the SR/T. i) Total mitochondria-organelle contact area (%) per mitochondrion. Data equivalent to sum of figures 1n+2f+3f.
We previously reported that the developmental transition in glycolytic muscle mitochondrial network configuration occurred together with a transition in mitochondrial protein expression where mitochondrial assembly factors were highly abundant at birth and fell during maturation despite oxidative phosphorylation and total mitochondrial protein abundances increasing across development (Kim et al., 2019). To test the hypothesis that the mitochondrial interactions described above may also be associated with the developmental transition from cellular assembly towards specialized support for muscle contraction, we performed new analyses on our previously published proteomic database of mouse Tibialis anterior skeletal muscle across postnatal development (Kim et al., 2019). As would be expected based on the proliferation of the contractile apparatus during growth (Goldspink, 1970; Deshmukh et al., 2015), muscle contractile proteins steadily increased in total abundance during maturation (Figure 6a). Conversely, the total abundance of sarcomere assembly factors and other cellular assembly factors and chaperones all consistently decreased across postnatal development (Figure 6c–d). Concomitantly, the abundance of reported tether proteins linking mitochondria and the sarcoplasmic reticulum (Csordás et al., 2018) also largely decreased during postnatal muscle development (Figure 6e). Consistently, putative mitochondria-lipid droplet tethers (Cui & Liu, 2020) and lipid droplet-sarcoplasmic reticulum tether proteins (Hugenroth & Bohnert, 2020) also decreased in overall abundance during maturation (Figure 6f,g). It is important to note that these decreases in sarcoplasmic reticulum tether proteins (Figure 6e,g) occur despite the developmental increase in both sarcoplasmic reticulum volume (Figure 4e) and overall protein abundance (Kim et al., 2019). Thus, the protein expression levels of cellular assembly factors and organelle contact sites each decrease during development whereas the expression of contractile, sarcoplasmic reticulum, and mitochondrial proteins all increase with maturation.
Figure 6: Abundance of contractile proteins, assembly factors, and organelle contact site tethers across postnatal muscle development.
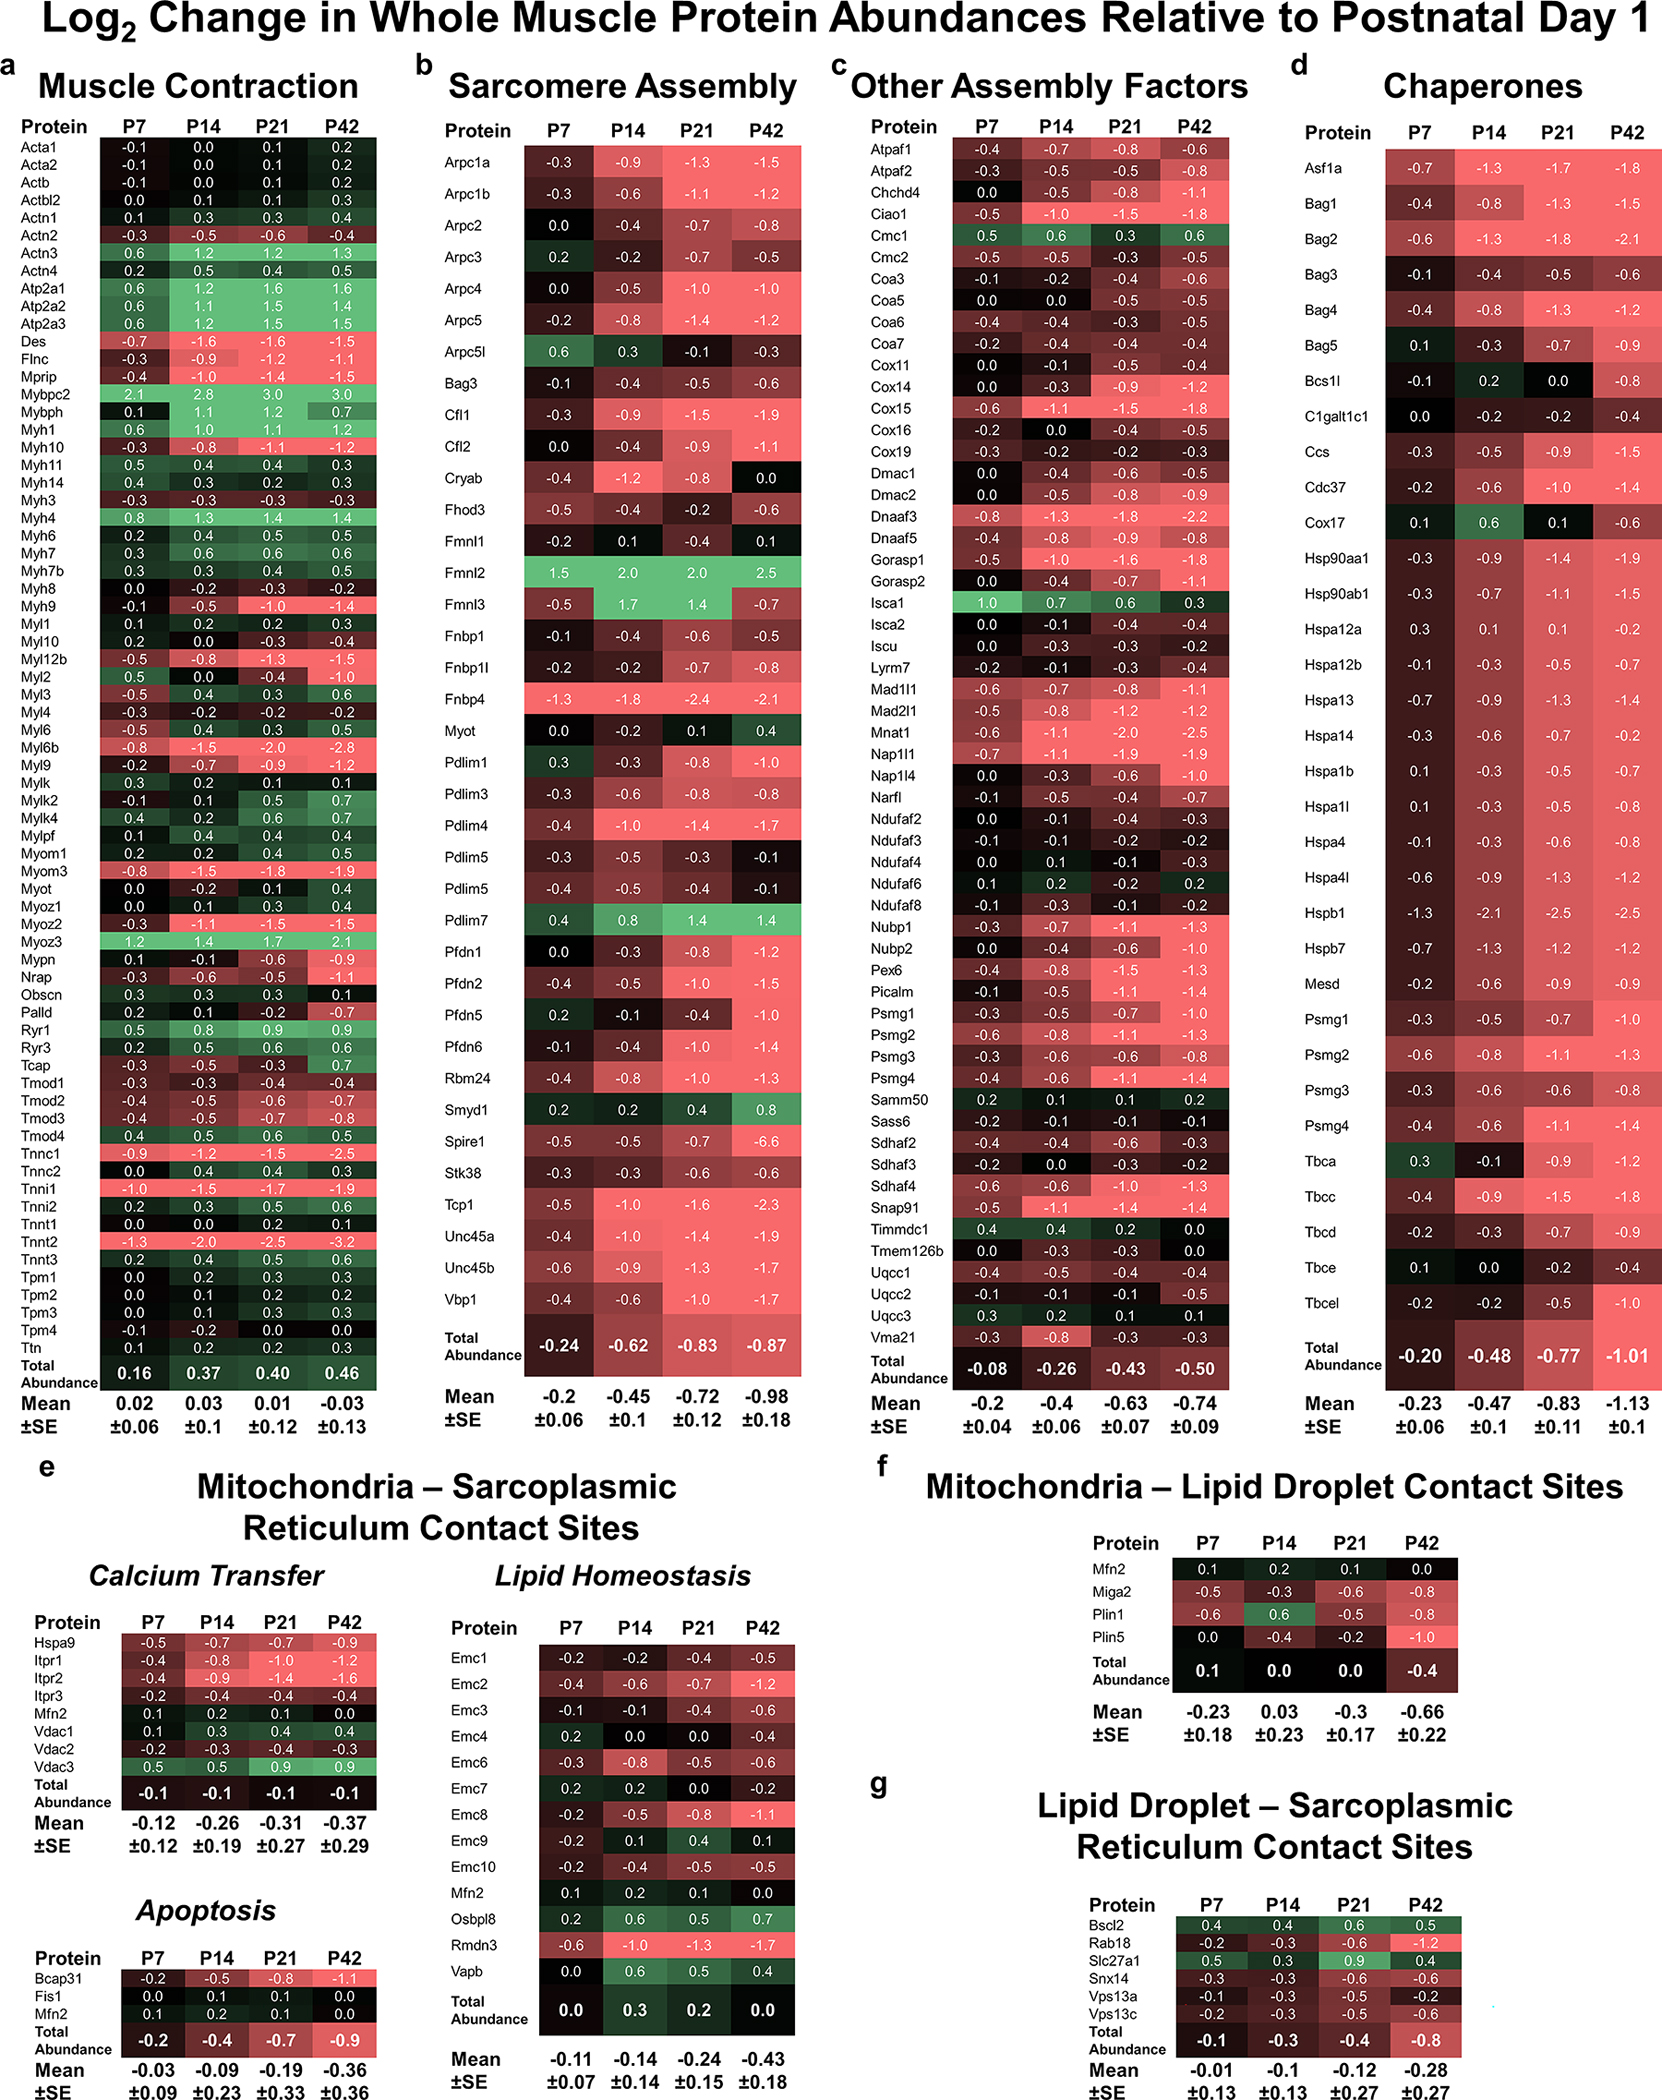
a) Log2 ratio of Tibialis anterior muscle contractile protein abundances relative to P1. Total abundance is the sum of all contractile proteins. Mean±SE values weight each protein equally regardless of abundance differences across proteins. Green highlight indicates increase, black indicates no change, red indicates decrease. b) Sarcomere assembly factor abundances. c) Other assembly factor abundances. d) Chaperone abundances. e) Mitochondria-sarcoplasmic reticulum tether abundances grouped by putative function. f) Mitochondria-lipid droplet tether abundances. g) Lipid droplet-sarcoplasmic reticulum protein abundances. N = 4 separate samples for each group. One sample was pooled tissues from 3–5 mice for P1 and P7 groups, and tissue from 1 mouse for P14, P21, and P42, respectively.
The Electron Transport Chain is Activated during Postnatal Muscle Development
To investigate the functional implications of the developmental reorganization of mitochondria-organelle interactions, we performed live cell functional imaging experiments on intact, isolated flexor digitorum brevis (FDB) muscle fibers from P1, P14, and P42 mice (Figure 7). By assessing NADH autofluorescence (Figure 7a–d) before and after rapid infusion of cyanide, we were able to assess the basal NADH redox state and NADH flux rate (Willingham et al., 2019). The rate of NADH production was significantly higher in both P42 oxidative and glycolytic muscles compared to P1 and P14 (Figure 7r, 1.0±0.1, 0.5±0.1, 3.0±0.2, 2.2±0.2 μM NADH reduced per second, n = 5, 11, 9, 7 cells for P1, P14, P42 oxidative, and P42 glycolytic muscles, respectively). While the NADH driving force into the electron transport chain (i.e., redox status) was highest in P42 glycolytic fibers, there was no difference between P42 oxidative, P14, and P1 muscles (Figure 7q, 59.2±3.6, 52.8±2.6, 56.4±2.9, 71.1±1.7 % reduced NADH, n = 5, 11, 9, 7 cells for P1, P14, P42 oxidative, and P42 glycolytic muscles, respectively). Thus, P42 oxidative fibers had a greater flux with a similar input driving force. To test whether an altered back pressure on the electron transport chain may explain the increased flux in P42 muscles, we assessed the mitochondrial membrane potential using exogenously added tetramethyl rhodamine, methyl ester (TMRM) fluorescent dye (Figure 7e–h). Since the intensity of TMRM fluorescence is a product of the magnitude of the membrane potential and the amount of mitochondria within the cell, we simultaneously assessed mitochondrial content using membrane potential-insensitive MitoTracker Green dye (Pendergrass et al., 2004) (Figure 7i–l) and normalized the TMRM intensity to the MTG signal. The mitochondrial membrane potential was significantly higher in both P42 oxidative and glycolytic muscles compared to P14 and P1 muscles (Figure 7s, 0.32±0.01, 0.26±0.02, 0.47±0.03, 0.51±0.04 TMRM/MTG arbitrary fluorescent units, n = 31, 37, 18, 18 cells for P1, P14, P42 oxidative, and P42 glycolytic muscles, respectively). Thus, the increased flux observed in P42 muscles occurred despite a greater membrane potential back pressure on the electron transport chain. To test whether altered calcium levels, a known activator of mitochondrial energetic flux (McCormack et al., 1990; Glancy & Balaban, 2012), may explain the increased flux in P42 muscles, we assessed mitochondrial calcium using Rhod-2 fluorescence (Figure 7m–p) also normalized to the MTG signal. Mitochondrial calcium levels were highest in P42 glycolytic muscles followed by P14, P42 oxidative, and P1 muscles (Figure 7t, 0.17±0.01, 0.33±0.04, 0.23±0.04, 0.40±0.07 Rhod-2/MTG arbitrary fluorescent units, n = 32, 12, 5, 5 cells for P1, P14, P42 oxidative, and P42 glycolytic muscles, respectively). Thus, mitochondrial calcium may explain the increased driving forces and energetic flux in the P42 glycolytic muscles compared to P1 and P14 muscles. However, mitochondrial calcium levels do not appear to explain how P42 oxidative muscles achieve greater electron transport chain flux with a similar input driving force (NADH redox) and greater back pressure (membrane potential). Thus, this increased conductance (Glancy et al., 2013), or activation state, of the electron transport chain in P42 oxidative muscles appears to occur during development by some other means. Overall, these results show that the mitochondrial electron transport chain becomes more active as the muscle reaches maturity.
Figure 7: Functional analysis of mitochondrial energetic function during skeletal muscle postnatal development.

a-d) Representative images of isolated flexor digitorum brevis muscle fiber NADH autofluorescence across postnatal development. Scale bars – 50 μm. e-h) Representative images of tetramethyl rhodamine, methyl ester (TMRM) fluorescence across postnatal development. Scale bars – 7 μm for e,h, 5 μm for f,g. i-l) Representative images of MitoTracker Green (MTG) fluorescence across postnatal development. Scale bars – 7 μm for i,l, 5 μm for j,k. m-p) Representative images of Rhod-2 fluorescence across postnatal development. Scale bars – 5 μm for m,n, 7 μm for o,p. q) NADH redox state across postnatal development. N = 5, 11, 9, 7 cells for P1, P14, P42 oxidative, and P42 glycolytic, respectively. r) NADH flux rates across postnatal development. N = 5, 11, 9, 7 cells for P1, P14, P42 oxidative, and P42 glycolytic, respectively. s) Mitochondrial membrane potential across postnatal development. N = 31, 37, 18, 18 cells for P1, P14, P42 oxidative, and P42 glycolytic, respectively. t) Mitochondrial calcium levels across postnatal development. N = 32, 12, 5, 5 cells for P1, P14, P42 oxidative, and P42 glycolytic, respectively.
Discussion
By evaluating the 3D mitochondria-organelle interactions within skeletal muscle cells across postnatal development, we demonstrate the physical reorganization of the cellular energy distribution system that occurs as the muscle transitions away from cellular assembly and towards focused support for contractile function. Skeletal muscle in newborn mice was characterized by tortuous mitochondrial networks arranged in parallel to the contractile axis of the cell with frequent contact sites between mitochondria and lipid droplet or sarcoplasmic reticulum membranes. However, despite being placed directly between the myofibrils, the worm-like appearance of the neonatal mitochondria resulted in relatively less of the mitochondrial surface area being located directly adjacent to the contractile apparatus. Thus, the organization of the newborn muscle cell reflects an increased structural capacity for direct communication between organelles(Eisner et al., 2014), lipid metabolism, and calcium signaling, the latter two of which have been suggested to play key roles in cellular assembly and development(Hahn, 1982; Stiber et al., 2008; Tu et al., 2016; Debattisti et al., 2019; Yao et al., 2020). Conversely, regardless of whether the number of mitochondria increased (oxidative) or decreased (glycolytic) or whether mitochondria converted to grid-like (oxidative) or perpendicularly oriented (glycolytic) networks, interactions between mitochondria and other organelles fell nearly two-fold during postnatal development while the more linear mitochondrial segments in mature muscles formed tighter associations with the adjacent contractile structures. These data suggest that the mitochondrial outer membrane surface area in mature muscle is specialized to directly support the energetic requirements of muscle contractions independent of mitochondrial content or network configuration. Consistently, our live cell functional assessments of mitochondrial energy conversion indicate that the electron transport chain becomes more active in both oxidative and glycolytic mature muscles compared to developing muscles. Thus, mitochondrial network structure (Figure 1), function (Figure 7), and protein composition (Kim et al., 2019) all appear to become specialized for energy metabolism in support of muscle contraction during postnatal development.
Individual mitochondria also appear capable of specialization relative to their adjacent neighbors within a mitochondrial network(Bleck et al., 2018; Kim et al., 2022). We show here that mitochondria connected to lipid droplets throughout postnatal skeletal muscle development are larger and more connected to adjacent mitochondria compared to non-lipid droplet connected mitochondria which have greater SA/V ratios. Thus, muscle mitochondria connected to lipid droplets have a greater structural capacity for energy conversion (i.e., greater internal volume) and rapid molecular transfer through mitochondrial networks (i.e., greater IMJ area) and less capacity for interactions with other cellular structures (i.e., lower available surface area relative to volume)(Glancy et al., 2020). This morphological distinction of lipid droplet connected mitochondria is consistent across postnatal development and has also been reported across postnatal heart development (Kim et al., 2022), suggesting that lipid droplet connected mitochondria in all striated muscles may be functionally specialized to utilize the adjacent lipid fuel source and distribute the converted energy throughout the mitochondrial network to adjacent mitochondria which are then structurally more suited for molecular distribution to other cellular components. However, while the relationship formed by membrane contact sites between mitochondria and lipid droplets appears consistent across striated muscles, a different type of functional specialization occurs in brown adipose tissue where lipid droplet connected mitochondria appear to be functionally specialized to support building lipid droplets rather than breaking them down for fuel (Benador et al., 2018; Veliova et al., 2020). Conversely, lipid droplet connected mitochondria in liver were recently reported to be specialized for fatty acid oxidation (Talari et al., 2023). Thus, it is clear that there are tissue-specific differences in the functional specialization of lipid droplet connected mitochondria. As such, future work to gain a better understanding of the molecular nature of the tethers linking lipid droplets and mitochondria and how they may differ among tissue types may offer some insight into how certain tethers facilitate specific functions.
Contact sites between mitochondria and the endo/sarcoplasmic reticulum have been shown to play important roles in many cellular processes, including mitochondrial dynamics (Friedman et al., 2011; Phillips & Voeltz, 2016), calcium signaling (Naon & Scorrano, 2014; Giacomello & Pellegrini, 2016), lipid synthesis (Giacomello & Pellegrini, 2016), ubiquinone synthesis (Subramanian et al., 2019), and cell death (Prudent & McBride, 2017). However, while the specific functional role of interactions between mitochondria and SR in skeletal muscle is not fully understood (Boncompagni et al., 2020), the focus of much of the muscle work to date has revolved around the role of these organelle interactions in calcium signaling (Shkryl & Shirokova, 2006; Yi et al., 2011; Eisner et al., 2013). Previous investigation into the postnatal relationship between mitochondria and SR/t-tubule triads found that the abundance of tethers linking mitochondria to these calcium release units (CRUs) was greater in mature than in two-week old mouse muscles (Boncompagni et al., 2009). Conversely, we found here that mitochondria-SR contact site abundance was greatest at birth and then fell significantly at two weeks of age and was maintained at the lower level until maturation. While the 3D nature of the current analyses versus the 2D nature of the previous study (Glancy et al., 2015) may play a role in this discrepancy, it is more likely due to the specificity of the previous analyses only to mitochondria-SR tethers located at CRUs whereas our analysis was not restricted to specific subcellular domains. The functional coupling of the SR and t-tubule triads likely specializes the calcium signaling in this region to support skeletal muscle excitation-contraction coupling. Thus, it is not surprising, and is consistent with the rest of this study, that mitochondrial interactions with CRUs would increase during the postnatal developmental reorganization period in order to more optimally support contraction in mature muscles. The current data combined with the previous study also suggest that it is the regions of the SR that are not part of the triads that account for the high abundance of mitochondria-SR contacts observed in the muscle at birth here. Indeed, in neonatal muscles, the SR is frequently associated with ribosomal granules(Schiaffino & Margreth, 1969), which suggests that the SR has a greater capacity for classical endoplasmic reticulum functions such as protein synthesis(Westrate et al., 2015; Schwarz & Blower, 2016) at this time point and it is consistent with a role in cellular assembly. Additionally, calcium signaling may still take place in the non-triadic mitochondria-SR contacts observed in neonatal muscles, as calcium activity beyond its role in muscle contraction is known to be important for postnatal muscle development and cellular assembly(Stiber et al., 2008; Tu et al., 2016; Debattisti et al., 2019), and the abundance of the mitochondrial calcium uniporter is higher in both myotubes and neonatal muscles than in mature skeletal muscle(Deshmukh et al., 2015; Kim et al., 2019). Again, detailing the molecular nature of the tethers linking the SR and mitochondria in skeletal muscle and how it may differ between subcellular domains would provide key insight into the major molecular exchanges occurring at these specialized contact sites.
Building a skeletal muscle cell into a specialized contractile fiber requires the coordination of several different organelles, first to assemble and synthesize the structures needed, and then to reorganize the cell into the optimal configuration to meet the given contractile demands. During the neonatal phase in which cellular assembly is ongoing, the mitochondrial outer membrane maintains abundant contact with both the SR and large lipid droplets. In the dynamic phase of the transition towards functional specialization for contraction, the frequency of interactions between mitochondrial and SR membranes in the muscle cell decreases quickly, whereas the reduction in mitochondria-lipid droplet interactions drops more gradually. Finally, upon maturation, the mitochondrial outer membrane surface area becomes optimized to provide energetic support through molecular exchange with the surrounding contractile apparatus. Thus, these data reflect that, in addition to cellular organelle content and composition, organelle interactions are also highly tuned to the functional demands of the cell.
Supplementary Material
Key Points.
Mitochondrial network organization is remodeled during skeletal muscle postnatal development
The mitochondrial outer membrane is in frequent contact with other organelles at birth and transitions to more close associations with the contractile apparatus in mature muscles
Mitochondrial energy metabolism becomes more activated during postnatal development
Understanding the developmental redesign process within skeletal muscle cells may help pinpoint specific areas of deficit in muscles with developmental disorders
Acknowledgements
This study was supported by the Division of Intramural Research of the National Heart Lung and Blood Institute and the Intramural Research Program of the National Institute of Arthritis and Musculoskeletal and Skin Diseases.
Funding
This work was supported by the Division of Intramural Research of the National Heart Lung and Blood Institute and the Intramural Research Program of the National Institute of Arthritis and Musculoskeletal and Skin Diseases (ZIA HL006221 to BG).
Biography

Yuho Kim is an assistant professor in the Department of Physical Therapy and Kinesiology at the University of Massachusetts Lowell. After earning his doctoral degree in Science Education (Exercise Science) from Syracuse University (Advisor: Dr. Keith C. DeRuisseau), he had postdoctoral training under the guidance of Dr. David A. Hood (York University) and Dr. Brian Glancy (NIH/NHLBI), respectively. His research focus is on understanding the functional/molecular/structural roles of mitochondria in muscle health and disease.
Footnotes
Competing Interests
The authors declare no competing interests.
Data Availability Statement
FIB-SEM datasets of P1 soleus and gastrocnemius, P14 soleus and gastrocnemius, and P42 oxidative and glycolytic muscles (11 total) have been deposited online (https://zenodo.org/record/5796264). Underlying raw data for graphs are available at https://doi.org/10.25444/nhlbi.22782665. All other data generated are available from the corresponding author upon reasonable request.
References
- Agbulut O, Noirez P, Beaumont F & Butler-Browne G. (2003). Myosin heavy chain isoforms in postnatal muscle development of mice. Biology of the Cell 95, 399–406. [DOI] [PubMed] [Google Scholar]
- Andrienko T, Kuznetsov AV, Kaambre T, Usson Y, Orosco A, Appaix F, Tiivel T, Sikk P, Vendelin M, Margreiter R & Saks VA. (2003). Metabolic consequences of functional complexes of mitochondria, myofibrils and sarcoplasmic reticulum in muscle cells. J Exp Biol 206, 2059–2072. [DOI] [PubMed] [Google Scholar]
- Bakeeva LE, Chentsov YS & Skulachev VP. (1981). Ontogenesis of mitochondrial reticulum in rat diaphragm muscle. Eur J Cell Biol 25, 175–181. [PubMed] [Google Scholar]
- Bakeeva LE, Chentsov Yu S & Skulachev VP. (1978). Mitochondrial framework (reticulum mitochondriale) in rat diaphragm muscle. Biochim Biophys Acta 501, 349–369. [DOI] [PubMed] [Google Scholar]
- Beier T, Pape C, Rahaman N, Prange T, Berg S, Bock DD, Cardona A, Knott GW, Plaza SM, Scheffer LK, Koethe U, Kreshuk A & Hamprecht FA. (2017). Multicut brings automated neurite segmentation closer to human performance. Nat Methods 14, 101–102. [DOI] [PubMed] [Google Scholar]
- Benador IY, Veliova M, Mahdaviani K, Petcherski A, Wikstrom JD, Assali EA, Acin-Perez R, Shum M, Oliveira MF, Cinti S, Sztalryd C, Barshop WD, Wohlschlegel JA, Corkey BE, Liesa M & Shirihai OS. (2018). Mitochondria Bound to Lipid Droplets Have Unique Bioenergetics, Composition, and Dynamics that Support Lipid Droplet Expansion. Cell metabolism 27, 869–885 e866. [DOI] [PMC free article] [PubMed] [Google Scholar]
- Bleck CKE, Kim Y, Willingham TB & Glancy B. (2018). Subcellular connectomic analyses of energy networks in striated muscle. Nature communications 9, 5111. [DOI] [PMC free article] [PubMed] [Google Scholar]
- Boncompagni S, Pozzer D, Viscomi C, Ferreiro A & Zito E. (2020). Physical and functional cross talk between endo-sarcoplasmic reticulum and mitochondria in skeletal muscle. Antioxidants & redox signaling 32, 873–883. [DOI] [PubMed] [Google Scholar]
- Boncompagni S, Rossi AE, Micaroni M, Beznoussenko GV, Polishchuk RS, Dirksen RT & Protasi F. (2009). Mitochondria are linked to calcium stores in striated muscle by developmentally regulated tethering structures. Molecular biology of the cell 20, 1058–1067. [DOI] [PMC free article] [PubMed] [Google Scholar]
- Bosma M (2016). Lipid droplet dynamics in skeletal muscle. Experimental cell research 340, 180–186. [DOI] [PubMed] [Google Scholar]
- Bubenzer HJ. (1966). Die Dunnen Und Die Dicken Muskelfasern Des Zwerchfells Der Ratte. Z Zellforsch Mik Ana 69, 520–550. [PubMed] [Google Scholar]
- Burkholder TJ, Fingado B, Baron S & Lieber RL. (1994). Relationship between muscle fiber types and sizes and muscle architectural properties in the mouse hindlimb. Journal of morphology 221, 177–190. [DOI] [PubMed] [Google Scholar]
- Csordás G, Weaver D & Hajnóczky G. (2018). Endoplasmic reticulum–mitochondrial contactology: structure and signaling functions. Trends in cell biology 28, 523–540. [DOI] [PMC free article] [PubMed] [Google Scholar]
- Cui L & Liu P. (2020). Two types of contact between lipid droplets and mitochondria. Frontiers in cell and developmental biology 8, 618322. [DOI] [PMC free article] [PubMed] [Google Scholar]
- Datta R, Heaster TM, Sharick JT, Gillette AA & Skala MC. (2020). Fluorescence lifetime imaging microscopy: fundamentals and advances in instrumentation, analysis, and applications. Journal of biomedical optics 25, 071203. [DOI] [PMC free article] [PubMed] [Google Scholar]
- Debattisti V, Horn A, Singh R, Seifert EL, Hogarth MW, Mazala DA, Huang KT, Horvath R, Jaiswal JK & Hajnóczky G. (2019). Dysregulation of mitochondrial Ca2+ uptake and sarcolemma repair underlie muscle weakness and wasting in patients and mice lacking MICU1. Cell reports 29, 1274–1286. e1276. [DOI] [PMC free article] [PubMed] [Google Scholar]
- Deshmukh AS, Murgia M, Nagaraj N, Treebak JT, Cox J & Mann M. (2015). Deep proteomics of mouse skeletal muscle enables quantitation of protein isoforms, metabolic pathways, and transcription factors. Molecular & Cellular Proteomics 14, 841–853. [DOI] [PMC free article] [PubMed] [Google Scholar]
- Dougherty R & Kunzelmann K-H. (2007). Computing local thickness of 3D structures with ImageJ. Microscopy and Microanalysis 13, 1678–1679. [Google Scholar]
- Dudley GA, Tullson PC & Terjung RL. (1987). Influence of mitochondrial content on the sensitivity of respiratory control. J Biol Chem 262, 9109–9114. [PubMed] [Google Scholar]
- Eisenberg BR. (2010). Quantitative ultrastructure of mammalian skeletal muscle. Comprehensive physiology, 73–112. [Google Scholar]
- Eisner V, Csordás G & Hajnóczky G. (2013). Interactions between sarco-endoplasmic reticulum and mitochondria in cardiac and skeletal muscle–pivotal roles in Ca2+ and reactive oxygen species signaling. Journal of cell science 126, 2965–2978. [DOI] [PMC free article] [PubMed] [Google Scholar]
- Eisner V, Lenaers G & Hajnoczky G. (2014). Mitochondrial fusion is frequent in skeletal muscle and supports excitation-contraction coupling. J Cell Biol 205, 179–195. [DOI] [PMC free article] [PubMed] [Google Scholar]
- Franzini-Armstrong C (1991). Simultaneous maturation of transverse tubules and sarcoplasmic reticulum during muscle differentiation in the mouse. Dev Biol 146, 353–363. [DOI] [PubMed] [Google Scholar]
- Friedman JR, Lackner LL, West M, DiBenedetto JR, Nunnari J & Voeltz GK. (2011). ER tubules mark sites of mitochondrial division. Science 334, 358–362. [DOI] [PMC free article] [PubMed] [Google Scholar]
- Gatta AT & Levine TP. (2017). Piecing Together the Patchwork of Contact Sites. Trends Cell Biol 27, 214–229. [DOI] [PubMed] [Google Scholar]
- Gemmink A, Daemen S, Kuijpers HJH, Schaart G, Duimel H, Lopez-Iglesias C, van Zandvoort M, Knoops K & Hesselink MKC. (2018). Super-resolution microscopy localizes perilipin 5 at lipid droplet-mitochondria interaction sites and at lipid droplets juxtaposing to perilipin 2. Biochim Biophys Acta Mol Cell Biol Lipids 1863, 1423–1432. [DOI] [PubMed] [Google Scholar]
- Giacomello M & Pellegrini L. (2016). The coming of age of the mitochondria–ER contact: a matter of thickness. Cell Death & Differentiation 23, 1417–1427. [DOI] [PMC free article] [PubMed] [Google Scholar]
- Glancy B (2020). Visualizing Mitochondrial Form and Function within the Cell. Trends Mol Med 26, 58–70. [DOI] [PMC free article] [PubMed] [Google Scholar]
- Glancy B & Balaban RS. (2012). Role of mitochondrial Ca2+ in the regulation of cellular energetics. Biochemistry 51, 2959–2973. [DOI] [PMC free article] [PubMed] [Google Scholar]
- Glancy B & Balaban RS. (2021). Energy metabolism design of the striated muscle cell. Physiol Rev 101, 1561–1607. [DOI] [PMC free article] [PubMed] [Google Scholar]
- Glancy B, Hartnell LM, Combs CA, Femnou A, Sun J, Murphy E, Subramaniam S & Balaban RS. (2017). Power Grid Protection of the Muscle Mitochondrial Reticulum. Cell reports 19, 487–496. [DOI] [PMC free article] [PubMed] [Google Scholar]
- Glancy B, Hartnell LM, Malide D, Yu ZX, Combs CA, Connelly PS, Subramaniam S & Balaban RS. (2015). Mitochondrial reticulum for cellular energy distribution in muscle. Nature 523, 617–620. [DOI] [PMC free article] [PubMed] [Google Scholar]
- Glancy B, Kim Y, Katti P & Willingham TB. (2020). The Functional Impact of Mitochondrial Structure Across Subcellular Scales. Frontiers in physiology 11, 1462. [DOI] [PMC free article] [PubMed] [Google Scholar]
- Glancy B, Willis WT, Chess DJ & Balaban RS. (2013). Effect of calcium on the oxidative phosphorylation cascade in skeletal muscle mitochondria. Biochemistry 52, 2793–2809. [DOI] [PMC free article] [PubMed] [Google Scholar]
- Glatz JF & Veerkamp JH. (1982). Postnatal development of palmitate oxidation and mitochondrial enzyme activities in rat cardiac and skeletal muscle. Biochim Biophys Acta 711, 327–335. [DOI] [PubMed] [Google Scholar]
- Gokhin DS, Ward SR, Bremner SN & Lieber RL. (2008). Quantitative analysis of neonatal skeletal muscle functional improvement in the mouse. Journal of Experimental Biology 211, 837–843. [DOI] [PubMed] [Google Scholar]
- Goldspink G (1970). The proliferation of myofibrils during muscle fibre growth. J Cell Sci 6, 593–603. [DOI] [PubMed] [Google Scholar]
- Hahn P (1982). Development of lipid metabolism. Annual review of nutrition 2, 91–111. [DOI] [PubMed] [Google Scholar]
- Hargreaves M & Spriet LL. (2020). Skeletal muscle energy metabolism during exercise. Nat Metab 2, 817–828. [DOI] [PubMed] [Google Scholar]
- Herker E, Vieyres G, Beller M, Krahmer N & Bohnert M. (2021). Lipid droplet contact sites in health and disease. Trends in Cell Biology 31, 345–358. [DOI] [PubMed] [Google Scholar]
- Heymann JA, Hayles M, Gestmann I, Giannuzzi LA, Lich B & Subramaniam S. (2006). Site-specific 3D imaging of cells and tissues with a dual beam microscope. J Struct Biol 155, 63–73. [DOI] [PMC free article] [PubMed] [Google Scholar]
- Hood DA, Memme JM, Oliveira AN & Triolo M. (2019). Maintenance of Skeletal Muscle Mitochondria in Health, Exercise, and Aging. Annu Rev Physiol 81, 19–41. [DOI] [PubMed] [Google Scholar]
- Huang X, Sun L, Ji S, Zhao T, Zhang W, Xu J, Zhang J, Wang Y, Wang X, Franzini-Armstrong C, Zheng M & Cheng H. (2013). Kissing and nanotunneling mediate intermitochondrial communication in the heart. Proc Natl Acad Sci U S A 110, 2846–2851. [DOI] [PMC free article] [PubMed] [Google Scholar]
- Hugenroth M & Bohnert M. (2020). Come a little bit closer! Lipid droplet-ER contact sites are getting crowded. Biochimica et Biophysica Acta (BBA)-Molecular Cell Research 1867, 118603. [DOI] [PubMed] [Google Scholar]
- Kaasik A, Veksler V, Boehm E, Novotova M, Minajeva A & Ventura-Clapier R. (2001). Energetic crosstalk between organelles: architectural integration of energy production and utilization. Circ Res 89, 153–159. [DOI] [PubMed] [Google Scholar]
- Kanaley JA, Shadid S, Sheehan MT, Guo Z & Jensen MD. (2009). Relationship between plasma free fatty acid, intramyocellular triglycerides and long-chain acylcarnitines in resting humans. The Journal of physiology 587, 5939–5950. [DOI] [PMC free article] [PubMed] [Google Scholar]
- Katti P, Hall AS, Parry HA, Ajayi PT, Kim Y, Willingham TB, Bleck CK, Wen H & Glancy B. (2022). Mitochondrial network configuration influences sarcomere and myosin filament structure in striated muscles. Nature communications 13, 6058. [DOI] [PMC free article] [PubMed] [Google Scholar]
- Kim Y, Ajayi PT, Bleck CK & Glancy B. (2022). Three-dimensional remodelling of the cellular energy distribution system during postnatal heart development. Philosophical Transactions of the Royal Society B 377, 20210322. [DOI] [PMC free article] [PubMed] [Google Scholar]
- Kim Y, Triolo M & Hood DA. (2017). Impact of Aging and Exercise on Mitochondrial Quality Control in Skeletal Muscle. Oxidative Med Cell Longev, 16. [DOI] [PMC free article] [PubMed] [Google Scholar]
- Kim Y, Yang DS, Katti P & Glancy B. (2019). Protein composition of the muscle mitochondrial reticulum during postnatal development. J Physiol 597, 2707–2727. [DOI] [PMC free article] [PubMed] [Google Scholar]
- Kirkwood SP, Munn EA & Brooks GA. (1986). Mitochondrial reticulum in limb skeletal muscle. Am J Physiol 251, C395–402. [DOI] [PubMed] [Google Scholar]
- Kirkwood SP, Packer L & Brooks GA. (1987). Effects of endurance training on a mitochondrial reticulum in limb skeletal muscle. Arch Biochem Biophys 255, 80–88. [DOI] [PubMed] [Google Scholar]
- Knutson JR, Beechem JM & Brand L. (1983). Simultaneous analysis of multiple fluorescence decay curves: a global approach. Chemical physics letters 102, 501–507. [Google Scholar]
- Kuznetsov AV, Javadov S, Margreiter R, Hagenbuchner J & Ausserlechner MJ. (2022). Analysis of mitochondrial function, structure, and intracellular organization in situ in cardiomyocytes and skeletal muscles. International Journal of Molecular Sciences 23, 2252. [DOI] [PMC free article] [PubMed] [Google Scholar]
- Lavorato M, Iyer VR, Dewight W, Cupo RR, Debattisti V, Gomez L, De la Fuente S, Zhao YT, Valdivia HH, Hajnoczky G & Franzini-Armstrong C. (2017). Increased mitochondrial nanotunneling activity, induced by calcium imbalance, affects intermitochondrial matrix exchanges. Proc Natl Acad Sci U S A 114, E849–E858. [DOI] [PMC free article] [PubMed] [Google Scholar]
- Liu X & Hajnoczky G. (2011). Altered fusion dynamics underlie unique morphological changes in mitochondria during hypoxia-reoxygenation stress. Cell death and differentiation 18, 1561–1572. [DOI] [PMC free article] [PubMed] [Google Scholar]
- Luff AR & Atwood HL. (1971). Changes in the sarcoplasmic reticulum and transverse tubular system of fast and slow skeletal muscles of the mouse during postnatal development. J Cell Biol 51, 369–383. [DOI] [PMC free article] [PubMed] [Google Scholar]
- McCormack JG, Halestrap AP & Denton RM. (1990). Role of calcium ions in regulation of mammalian intramitochondrial metabolism. Physiol Rev 70, 391–425. [DOI] [PubMed] [Google Scholar]
- Meex RC, Hoy AJ, Mason RM, Martin SD, McGee SL, Bruce CR & Watt MJ. (2015). ATGL-mediated triglyceride turnover and the regulation of mitochondrial capacity in skeletal muscle. American Journal of Physiology-Endocrinology and Metabolism 308, E960–E970. [DOI] [PubMed] [Google Scholar]
- Mishra P, Varuzhanyan G, Pham AH & Chan DC. (2015). Mitochondrial Dynamics is a Distinguishing Feature of Skeletal Muscle Fiber Types and Regulates Organellar Compartmentalization. Cell metabolism 22, 1033–1044. [DOI] [PMC free article] [PubMed] [Google Scholar]
- Naon D & Scorrano L. (2014). At the right distance: ER-mitochondria juxtaposition in cell life and death. Biochim Biophys Acta 1843, 2184–2194. [DOI] [PubMed] [Google Scholar]
- Ogata T & Yamasaki Y. (1985). Scanning electron-microscopic studies on the three-dimensional structure of mitochondria in the mammalian red, white and intermediate muscle fibers. Cell Tissue Res 241, 251–256. [DOI] [PubMed] [Google Scholar]
- Ohira Y, Cartier LJ, Chen M & Holloszy JO. (1987). Induction of an increase in mitochondrial matrix enzymes in muscle of iron-deficient rats. Am J Physiol 253, C639–644. [DOI] [PubMed] [Google Scholar]
- Park KH, Weisleder N, Zhou J, Gumpper K, Zhou X, Duann P, Ma J & Lin P-H. (2014). Assessment of calcium sparks in intact skeletal muscle fibers. JoVE (Journal of Visualized Experiments), e50898. [DOI] [PMC free article] [PubMed] [Google Scholar]
- Parry HA & Glancy B. (2022). Energy transfer between the mitochondrial network and lipid droplets in insulin resistant skeletal muscle. Current Opinion in Physiology, 100487. [DOI] [PMC free article] [PubMed] [Google Scholar]
- Pendergrass W, Wolf N & Poot M. (2004). Efficacy of MitoTracker Green and CMXrosamine to measure changes in mitochondrial membrane potentials in living cells and tissues. Cytometry A 61, 162–169. [DOI] [PubMed] [Google Scholar]
- Phillips MJ & Voeltz GK. (2016). Structure and function of ER membrane contact sites with other organelles. Nat Rev Mol Cell Biol 17, 69–82. [DOI] [PMC free article] [PubMed] [Google Scholar]
- Picard M, Gentil BJ, McManus MJ, White K, St Louis K, Gartside SE, Wallace DC & Turnbull DM. (2013). Acute exercise remodels mitochondrial membrane interactions in mouse skeletal muscle. J Appl Physiol (1985) 115, 1562–1571. [DOI] [PMC free article] [PubMed] [Google Scholar]
- Picard M, McManus MJ, Csordas G, Varnai P, Dorn GW 2nd, Williams D, Hajnoczky G & Wallace DC. (2015). Trans-mitochondrial coordination of cristae at regulated membrane junctions. Nature communications 6, 6259. [DOI] [PMC free article] [PubMed] [Google Scholar]
- Prudent J & McBride HM. (2017). The mitochondria–endoplasmic reticulum contact sites: a signalling platform for cell death. Current opinion in cell biology 47, 52–63. [DOI] [PubMed] [Google Scholar]
- Schiaffino S & Margreth A. (1969). Coordinated development of the sarcoplasmic reticulum and T system during postnatal differentiation of rat skeletal muscle. J Cell Biol 41, 855–875. [DOI] [PMC free article] [PubMed] [Google Scholar]
- Schwarz DS & Blower MD. (2016). The endoplasmic reticulum: structure, function and response to cellular signaling. Cellular and Molecular Life Sciences 73, 79–94. [DOI] [PMC free article] [PubMed] [Google Scholar]
- Seppet EK, Kaambre T, Sikk P, Tiivel T, Vija H, Tonkonogi M, Sahlin K, Kay L, Appaix F & Braun U. (2001). Functional complexes of mitochondria with Ca, MgATPases of myofibrils and sarcoplasmic reticulum in muscle cells. Biochimica et Biophysica Acta (BBA)-Bioenergetics 1504, 379–395. [DOI] [PubMed] [Google Scholar]
- Shkryl VM & Shirokova N. (2006). Transfer and tunneling of Ca2+ from sarcoplasmic reticulum to mitochondria in skeletal muscle. Journal of Biological Chemistry 281, 1547–1554. [DOI] [PubMed] [Google Scholar]
- Skulachev VP. (1969). Energy accumulation in the cell. Nauka Press, Moscow. [Google Scholar]
- Skulachev VP. (1990). Power transmission along biological membranes. J Membr Biol 114, 97–112. [DOI] [PubMed] [Google Scholar]
- Smirnov AV, Combs CA, Balaban RS, Tang K & Knutson JR. (2009). A hybrid global fitting algorithm for decay-associated images from fluorescence lifetime image microscopy data. In Three-Dimensional and Multidimensional Microscopy: Image Acquisition and Processing XVI, pp. 209–214. SPIE. [Google Scholar]
- Sommer C, Straehle C, Kothe U & Hamprecht FA. (2011). Ilastik: Interactive Learning and Segmentation Toolkit. I S Biomed Imaging, 230–233. [Google Scholar]
- Stiber J, Hawkins A, Zhang Z-S, Wang S, Burch J, Graham V, Ward CC, Seth M, Finch E & Malouf N. (2008). STIM1 signalling controls store-operated calcium entry required for development and contractile function in skeletal muscle. Nature cell biology 10, 688–697. [DOI] [PMC free article] [PubMed] [Google Scholar]
- Subramanian K, Jochem A, Le Vasseur M, Lewis S, Paulson BR, Reddy TR, Russell JD, Coon JJ, Pagliarini DJ & Nunnari J. (2019). Coenzyme Q biosynthetic proteins assemble in a substrate-dependent manner into domains at ER–mitochondria contacts. Journal of Cell Biology 218, 1353–1369. [DOI] [PMC free article] [PubMed] [Google Scholar]
- Talari NK, Mattam U, Meher NK, Paripati AK, Mahadev K, Krishnamoorthy T & Sepuri NBV. (2023). Lipid-droplet associated mitochondria promote fatty-acid oxidation through a distinct bioenergetic pattern in male Wistar rats. Nature communications 14, 766. [DOI] [PMC free article] [PubMed] [Google Scholar]
- Tu MK, Levin JB, Hamilton AM & Borodinsky LN. (2016). Calcium signaling in skeletal muscle development, maintenance and regeneration. Cell calcium 59, 91–97. [DOI] [PMC free article] [PubMed] [Google Scholar]
- Veliova M, Petcherski A, Liesa M & Shirihai OS. (2020). The biology of lipid droplet-bound mitochondria. Semin Cell Dev Biol 108, 55–64. [DOI] [PMC free article] [PubMed] [Google Scholar]
- Vincent AE, Turnbull DM, Eisner V, Hajnoczky G & Picard M. (2017). Mitochondrial Nanotunnels. Trends Cell Biol 27, 787–799. [DOI] [PMC free article] [PubMed] [Google Scholar]
- Westrate L, Lee J, Prinz W & Voeltz G. (2015). Form follows function: the importance of endoplasmic reticulum shape. Annual review of biochemistry 84, 791–811. [DOI] [PubMed] [Google Scholar]
- Willingham TB, Zhang Y, Andreoni A, Knutson JR, Lee D-Y & Glancy B. (2019). MitoRACE: evaluating mitochondrial function in vivo and in single cells with subcellular resolution using multiphoton NADH autofluorescence. The Journal of Physiology 597, 5411–5428. [DOI] [PMC free article] [PubMed] [Google Scholar]
- Yao Y, Ding L & Huang X. (2020). Diverse Functions of Lipids and Lipid Metabolism in Development. Small Methods 4, 1900564. [Google Scholar]
- Yi J, Ma C, Li Y, Weisleder N, Ríos E, Ma J & Zhou J. (2011). Mitochondrial calcium uptake regulates rapid calcium transients in skeletal muscle during excitation-contraction (EC) coupling. Journal of Biological Chemistry 286, 32436–32443. [DOI] [PMC free article] [PubMed] [Google Scholar]
- Zhang H, Wang Y, Li J, Yu J, Pu J, Li L, Zhang H, Zhang S, Peng G & Yang F. (2011). Proteome of skeletal muscle lipid droplet reveals association with mitochondria and apolipoprotein aI. Journal of proteome research 10, 4757–4768. [DOI] [PubMed] [Google Scholar]
Associated Data
This section collects any data citations, data availability statements, or supplementary materials included in this article.
Supplementary Materials
Data Availability Statement
FIB-SEM datasets of P1 soleus and gastrocnemius, P14 soleus and gastrocnemius, and P42 oxidative and glycolytic muscles (11 total) have been deposited online (https://zenodo.org/record/5796264). Underlying raw data for graphs are available at https://doi.org/10.25444/nhlbi.22782665. All other data generated are available from the corresponding author upon reasonable request.