

Abstract
Objective:
Many emergency general surgery (EGS) conditions can be managed operatively or non-operatively, with outcomes that vary by diagnosis. We hypothesized that operative management would lead to higher in-hospital costs but to cost savings over time.
Summary Background Data:
Emergency general surgery conditions account for $28 billion in healthcare costs in the US annually. Compared to scheduled surgery, patients who undergo emergency surgery are at increased risk of complications, readmissions, and death, with accompanying costs of care that are up to 50% higher than elective surgery. Our prior work demonstrated that operative management had variable impacts on clinical outcomes depending on EGS condition.
Methods:
This was a nationwide, retrospective study using fee-for-service Medicare claims data. We included patients ≥ 65.5 years of age with a principal diagnosis for an EGS condition, 7/1/2015–6/30/2018. EGS conditions were categorized as: colorectal, general abdominal, hepatopancreaticobiliary, intestinal obstruction, and upper gastrointestinal. We used near-far matching with a preference-based instrumental variable to adjust for confounding and selection bias. Outcomes included Medicare payments for the index hospitalization and at 30, 90, and 180 days.
Results:
Of 507,677 patients, 30.6% received an operation. For hepatopancreaticobiliary conditions, costs for operative management were initially higher but became equivalent at 90 and 180 days. For all others, operative management was associated with higher inpatient costs which persisted, though narrowed, over time. Out-of-pocket costs were nearly equivalent for operative and non-operative management.
Conclusions:
Compared to non-operative management, costs were higher or equivalent for operative management of EGS conditions through 180 days, which could impact decision-making for clinicians, patients, and health systems in situations where clinical outcomes are similar.
Mini-Abstract
Many emergency general surgery conditions can be treated operatively or nonoperatively, with variable costs and outcomes. This study identified higher or equivalent costs for operative management through 180 days. For Medicare patients, out-of-pocket costs for EGS conditions were similar for all condition groups, with no difference by management.
Introduction
The US healthcare system spends approximately $28 billion per year to care for emergency general surgery conditions.1 Emergency general surgery (EGS) consists of acute conditions potentially amenable to surgical management, with diagnoses ranging from appendicitis to intestinal obstruction and perforation. EGS conditions account for 3–4 million admissions and more than 800,000 operations in the U.S. each year. Older adults account for 60% of EGS cases.2–4 While the potential for operative management defines these diseases, many can be managed either operatively or nonoperatively. Evolution in critical care and nonsurgical interventions such as catheter-based therapy and endoscopic treatment have enhanced the efficacy of non-operative management for many EGS conditions, and potentially altered the difference in costs between operative and nonoperative management.
Compared to scheduled surgery, patients who undergo emergency surgery are at increased risk of complications,5,6 readmissions,7,8 and death,9 with accompanying costs of care that are up to 50% higher than elective surgery.10 However, studies have generally focused only on the subgroup of patients undergoing operative treatment, and little is known about how operative management decisions influence costs of care for EGS.
Our prior work demonstrated that operative management had variable impacts on clinical outcomes depending on EGS condition. For hepatopancreaticobiliary conditions, operative management had equivalent in-hospital mortality to nonoperative management, but had lower mortality at 30, 90, and 180 days, along with lower risk of nonroutine discharge and readmissions. For all other conditions, operative management was associated with higher risk of inpatient mortality. This risk equalized over time for intestinal obstruction and colorectal conditions and general abdominal conditions, but remained elevated for upper gastrointestinal conditions.11
The index operation is not the only contributor to healthcare cost. Whether operative or nonoperative management is chosen, either course of action may incur additional diagnostic and therapeutic procedures, along with inpatient and ICU days. In the absence of distinctive clinical benefit for one or another management strategy, costs of care may be relevant for individual patient, family, and clinician decision-making, as well as for health systems designing management pathways. We sought to determine the effect of operative management on short- and long-term healthcare costs for EGS conditions. We hypothesized that index hospitalization costs would be higher for patients undergoing operative management, but that long-term costs would be lower.
Methods
Data source and population:
Patients age ≥ 65.5 years who were enrolled in Medicare fee-for-service plans were included if they had a principal diagnosis for an EGS condition and were admitted through a nonfederal, acute care hospital emergency department between July 1, 2015 and June 30, 2018. These dates and ages were chosen to allow a 6 month look-back period to identify comorbidities and to ensure that the index admission was indeed the first within the study time frame for the condition in question. To ensure capture of all relevant care, we excluded patients who did not have continuous Part A & B coverage or who were enrolled in an HMO at any time between 6 months prior to and 6 months after their index EGS admission.
The coding strategy was previously described.11 In brief, EGS conditions were identified by International Classification of Diseases, Ninth or Tenth Revision, Clinical Modification codes (ICD-9/10-CM), and classified into five categories developed by Shafi et al. and refined by the research team: colorectal, general abdominal, hepatopancreaticbiliary, intestinal obstruction, and upper gastrointestinal. eTable 1 lists the specific diagnoses in each condition group and their frequency.11–13 Patients were categorized according to their primary diagnosis, even if two EGS diagnoses were present. The included conditions are summarized in Table 1. Patients were included if they were cared for by a surgeon, as defined by 1) the admitting physician was a general surgeon; 2) a general surgeon was consulted within 2 days of admission; or 3) the patient underwent a general surgery operation within 2 days of admission. Physicians listed in claims were considered to be general surgeons if they performed ≥ 5 general surgery operations per year. Only emergent admissions with a principle diagnosis of an EGS condition were included. Operations were identified using ICD-CM-9/10 procedure codes and Current Procedural Terminology (CPT) codes. Management was considered operative for patients who underwent qualifying operations on hospital day 0,1, or 2, consistent with the EGS literature.12,14–17 Patients initially assigned to non-operative management may have undergone surgery later in their hospital course or at readmission.
Table 1:
Categories of Emergency General Surgery conditions
| EGS Condition Group | EGS Subcondition |
|---|---|
| Colorectal | Colitis, colorectal neoplasm, diverticular disease, hemorrhoids, anorectal stenosis, polyp, or ulcer, megacolon, colon fistula, colorectal bleeding, complications of colostomy |
| General Abdominal | Abdominal Mass, peritonitis, retroperitoneal abscess, hemoperitoneum, abdominal pain |
| HPB | Hepatic neoplasm, hepatic necrosis, hepatic abscess, gallstones and related disease, biliary obstruction, perforation, or fistula, spasm of sphincter of Oddi, other biliary tract disease, pancreatitis |
| Intestinal obstruction | Bowel obstruction, intussusception, volvulus |
| Upper GI | Gastritis, neoplasm of stomach or small bowel, esophageal varices, esophageal perforation, peptic ulcer disease, complications of gastrostomy, gastric fistula, duodenal fistula, upper GI bleeding, appendicitis, appendiceal abscess, other diseases of the appendix, ileus, diverticular disease of the small intestine, upper GI fistula, bowel perforation, Meckel’s diverticulum, Crohn’s disease. |
Exposure:
The exposure of interest was operative management within 48 hours of admission.
Outcomes:
Outcomes of interest were costs for the index hospital admission as well as at 30, 90, and 180 days. Costs were defined as Medicare payments for inpatient care, durable medical equipment, or professional provider claims with an EGS condition as the primary diagnosis during the follow-up periods. Out-of-pocket medical costs related to EGS diagnoses included any co-insurance, inpatient deductible, or blood deductible liability amounts reported in the Inpatient, Part B Carrier, or Durable Medical Equipment claims during the project period. All costs were converted to 2018 US Dollars using the annual medical component of the Consumer Price Index.18 We also tabulated length of stay, ICU admission and length of stay, diagnostic radiology, interventional radiology, and endoscopic procedures. Finally, the use of diagnostic radiology, interventional radiology, and endoscopic procedures was determined using International Classification of Diseases – Version 9 or 10, Current Procedural Terminology and Healthcare Common Procedure Coding System codes.19
Covariates:
We extracted diagnosis and procedure codes and dates from claims, along with patient gender, and race. We used dual-eligibility status as a proxy for socioeconomic status. We identified Elixhauser comorbidities20 using the index hospitalization and a 6-month look-back period. Validated algorithms were used to identify sepsis and frailty at the time of index admission.21,22
Instrumental variable analysis:
EGS patients undergoing operative management may differ from those undergoing nonoperative management in ways that are difficult to capture in claims data, leading to major concerns about selection bias. In the absence of feasible options for randomized trials of these emergent, heterogenous decisions, an instrumental variable can provide consistent estimates of treatment effect in the presence of unmeasured confounders.23 An instrumental variable is one that is associated with the treatment of interest (in this case, operative management), but not otherwise associated with the outcome. The IV serves as a pseudorandomizer to balance both observed and unobserved confounders. This gets us as close as possible to a randomized trial when prospective randomization is not possible. In this case, we developed a preference-based instrumental variable (PBIV) that was judged to meet the key IV criteria of being associated with the exposure of interest without having a direct effect on the outcome.11,13,24 As previously described, the PBIV was defined as the treating surgeon’s tendency to operate, and calculated as the proportion of all EGS patients on whom the treating surgeon operated. After developing the IV, there are several strategies available for incorporating the IV into the analysis. Matching provides one of the strongest approaches to causal inference within instrumental variable analysis. We used near-far matching25 to match patients treated by surgeons with low values of the PBIV to patients treated by high PBIV surgeons on observed confounders. We matched patients exactly within hospitals to further control for inter-institutional variation that could affect outcomes. The analysis was then conducted on these matched pairs, to determine whether patients treated by surgeons with high levels of the PBIV (more likely to operate in general) fared better or worse than those treated by patients with low levels of the PBIV (less likely to operate). After matching, we applied the Wald estimator in two-stage least squares and corrected standard errors for clustering by surgeon.
Contributors to cost:
To examine potential sources of differences in costs among management strategies, we compared Medicare payments at the index hospitalization, and at each time point between operative and non-operatively managed patients in each condition group. Itemized payments for ICU care and specific diagnostic and treatment strategies were examined.
The analysis was performed in Stata Version 17.0 (StataCorp, College Station, TX) and R (R Core Team, 2017). This study was approved by the Institutional Review Board of the University of Pennsylvania.
Results
Of 507,677 patients meeting inclusion criteria, 155,653 (30.7%) had an operation. Differences between patients undergoing operative management and non-operative management were slight prior to matching. After matching, there were no clinically or statistically significant differences between patients who underwent operative or nonoperative treatment. The final, matched sample included 224,350 patients (60,094 with HPB conditions, 56,582 with obstructions, 41,878 with UGI conditions, 33,326 with colorectal conditions, and 32,470 with general abdominal conditions). Characteristics of the unmatched and matched samples are previously published.11
Unadjusted outcomes
Unadjusted costs are shown in Figure 1 and Table 2. Of all conditions, total, unadjusted costs were highest for operative management of general abdominal conditions at 180 days. In this group, operative management was more than twice as costly as nonoperative management ($31,490 vs. $14,926). The disparity between operative and nonoperative management was greatest for colorectal conditions: operative management was more than 3 times costlier than nonoperative management ($29,898 vs. $9,665 at 180 days). For hepatopancreaticobiliary conditions, costs were similar: an average of $11,453 for operative management and $12,914 for non-operative management at 180 days.
Figure 1:
Unadjusted costs for operative and non-operative management of EGS conditions
Table 2:
Total costs for EGS conditions
| Colorectal | General Abdominal | HPB | Intestinal Obstruction | Upper GI | |||||||||||
|---|---|---|---|---|---|---|---|---|---|---|---|---|---|---|---|
| Non-Operative | Operative | P-value | Non-Operative | Operative | P-value | Non-Operative | Operative | P-value | Non-Operative | Operative | P-value | Non-Operative | Operative | P-value | |
| Time frame | |||||||||||||||
| In-Hospital costs | 6550 (4768; 11069) | 20520 (16046; 31449) | <0.001 | 7518 (4869; 13020) | 21474 (13544; 33606) | <0.001 | 10161 (6477; 14578) | 11152 (9040; 14934) | <0.001 | 5799 (4237; 10036) | 15409 (10041; 23889) | <0.001 | 8095 (5653; 12979) | 13243 (8303; 26740) | <0.001 |
| Cumulative post-discharge costs through 180d | 309 (0; 7523) | 1019 (74; 13654) | <0.001 | 2863 (401; 16455) | 2275 (401; 14815) | <0.001 | 247 (0; 4003) | 0 (0; 107) | <0.001 | 57 (0; 554) | 0 (0; 220) | <0.001 | 190 (0; 4585) | 0 (0; 266) | <0.001 |
Costs expressed in dollars, median (interquartile interval)
The index hospitalization accounted for the majority of costs for all conditions, regardless of management strategy, and accounted for a greater proportion of costs for operative management for all conditions, as well. The index hospitalization accounted for the greatest proportion of costs for operative management of hepatopancreaticobiliary conditions (97%), but only 50% of costs for non-operative management of general abdominal conditions.
As shown in Figure 1 and Table 2, for all conditions, index hospitalization costs were higher for operative management. For colorectal conditions, operative management also carried higher post-discharge costs. For all other conditions, operative management had lower post-discharge costs through 180 days. Indeed for HPB, intestinal obstruction, and upper GI conditions, the median post-discharge costs were $0.
Out-of-Pocket Costs
As shown in Table 3, out-of-pocket costs for EGS conditions were generally similar between condition groups, and between operative and non-operative management. In-hospital costs accounted for the majority of expenses for all condition groups, ranging from a mean of $920.50 for nonoperative management of general abdominal conditions to $1214.04 for operative management of HPB conditions. For HPB conditions, cumulative out-of-pocket costs were slightly lower at 180 days. For all other condition groups, out-of-pocket costs remained slightly higher throughout the follow up period.
Table 3:
Out-of-pocket costs for EGS conditions
| Colorectal | General Abdominal | HPB | Intestinal Obstruction | Upper GI | |||||||||||
|---|---|---|---|---|---|---|---|---|---|---|---|---|---|---|---|
| Non-Operative | Operative | P-value | Non-Operative | Operative | P-value | Non-Operative | Operative | P-value | Non-Operative | Operative | P-value | Non-Operative | Operative | P-value | |
| Time frame | |||||||||||||||
| In-Hospital | 1,112 (694) | 1,125.23 (660.14) | 0.059 | 920.50 (781.54) | 962.64 (654.87) | <0.001 | 1,114.62 (768.30) | 1,214.04 (438.56) | <0.001 | 1,130.35 (642.00) | 1,164.63 (699.99) | <0.001 | 1,013.08 (969.51) | 1,154.05 (730.10) | <0.001 |
| 30d | 1,139.07 (756.73) | 1,151.01 (741.77) | 0.132 | 966.24 (875.18) | 997.23 (696.96) | <0.001 | 1,155.66 (804.30) | 1,221.15 (442.96) | <0.001 | 1,148.08 (659.83) | 1,174.36 (710.81) | <0.001 | 1,056.95 (1,099.97) | 1,169.50 (785.67) | <0.001 |
| 90d | 1,207.49 (1,033.65) | 1,255.19 (1,206.26) | 0.000 | 1,078.55 (1,371.52) | 1,123.23 (1,352.95) | <0.001 | 1,203.13 (1,044.89) | 1,231.34 (539.22) | <0.001 | 1,178.20 (812.79) | 1,196.06 (819.37) | <0.001 | 1,143.62 (1,628.33) | 1,226.06 (1,242.64) | <0.001 |
| 180d | 1,336.57 (1,443.15) | 1,552.40 (1,824.57) | 0.000 | 1,308.72 (2,055.67) | 1,374.39 (2,294.92) | 0.001 | 1,286.88 (1,463.74) | 1,249.78 (753.35) | 0.000 | 1,245.91 (1,015.74) | 1,246.87 (1,136.69) | 0.876 | 1,272.81 (2,202.12) | 1,305.32 (1,862.05) | 0.014 |
Costs expressed in dollars, mean (SD)
Instrumental variable analysis
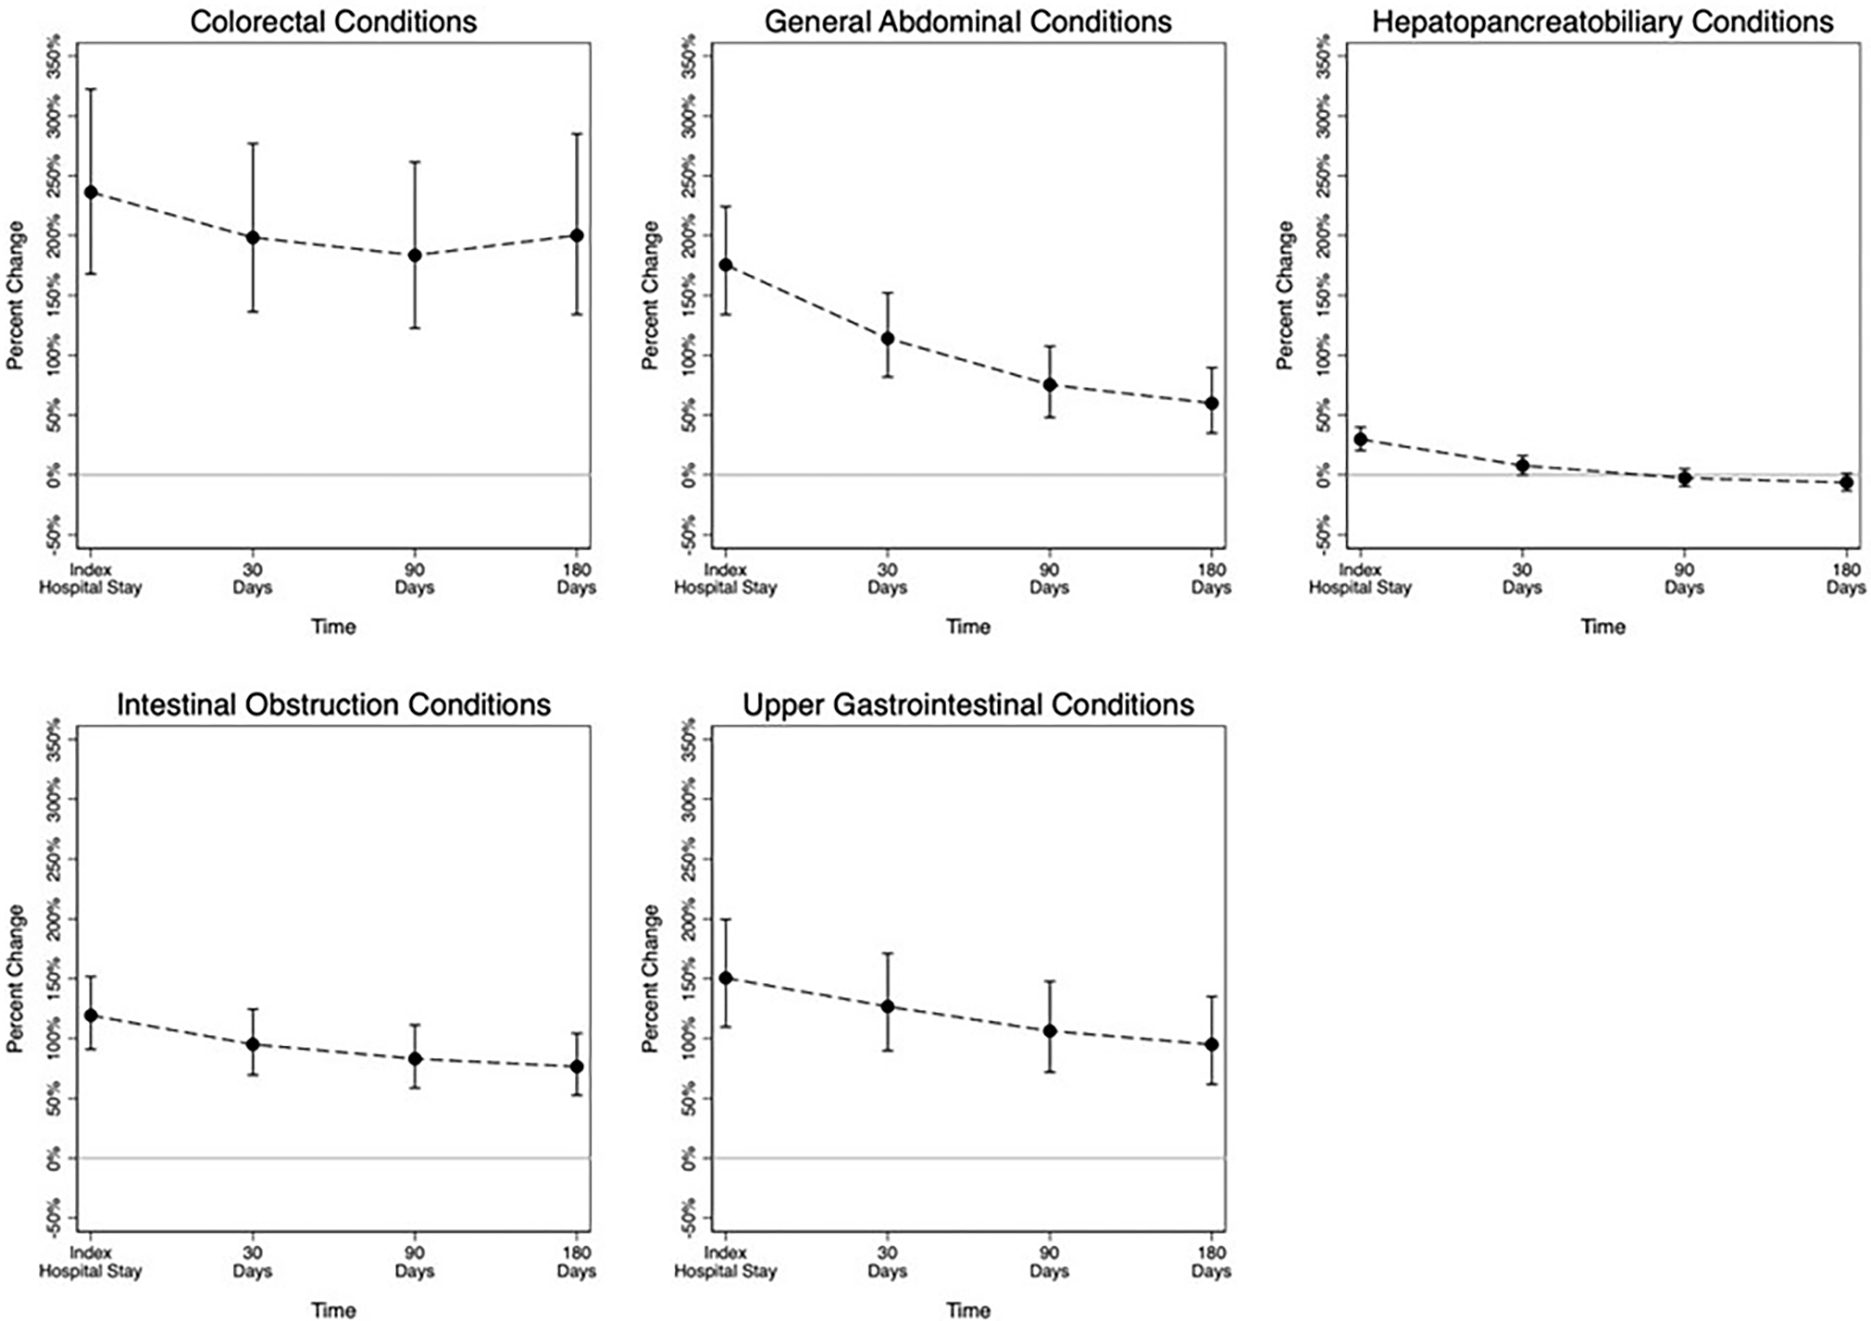
The percentage increase in Medicare costs at each time point associated with operative management are shown in Figure 2. Operative management was associated with significantly higher costs for all condition groups for the index inpatient stay and at 30 days. For hepatopancreaticobiliary conditions, costs at 90 and 180 days were equivalent. For all other condition groups, costs associated with operative management remained higher throughout the study period. For colorectal conditions, operative management was associated with approximately triple the costs of nonoperative management at all time points. For general abdominal conditions, intestinal obstruction, and upper GI conditions, the cost difference narrowed over time.
Figure 2:

Percent increase in costs associated with operative management of EGS conditions: results of the instrumental variable analysis
Contributors to cost
Table 4 compares healthcare resource utilization between operative and nonoperative management for each condition group. Non-operative management did not imply that no invasive procedure was involved. For colorectal conditions, 31.1% of non-operative patients underwent at least one invasive procedure (including upper or lower endoscopy or interventional radiology) at the index admission. For general abdominal conditions, 18.1% of non-operative patients underwent at least one invasive procedure. For hepatopancreaticobiliary conditions, 13.3% of non-operative patients underwent at least one invasive procedure. For intestinal obstructions, just 9.5% of non-operative patients underwent an invasive procedure. For upper GI conditions, 63.2% of non-operative patients had an invasive procedure.
Table 4:
Resource utilization for EGS patients managed operatively vs. nonoperatively, according to condition group
| Colorectal | General abdominal | HPB | Obstruction | Upper GI | |||||||||||
|---|---|---|---|---|---|---|---|---|---|---|---|---|---|---|---|
| Non-op | Op | P | Non-op | Op | P | Non-op | Op | P | Non-op | Op | P | Non-op | Op | p | |
| n (%) | 324,000 (96.9) | 10,508 (3.1) | 226,258 (93.8) | 14,905 (6.2) | 199,538 (73.6) | 71,422 (26.4) | 140,333 (76.1) | 44,182 (23.9) | 448,479 (92.4) | 37,118 (7.6) | |||||
| Index Hospital LOS (days)* | 3.0 (2.0; 5.0) | 8.0 (6.0; 11.0) | <0.001 | 3.0 (2.0; 6.0) | 8.0 (5.0; 12.0) | <0.001 | 4.0 (2.0; 6.0) | 3.0 (2.0; 5.0) | <0.001 | 4.0 (2.0; 6.0) | 6.0 (3.0; 8.0) | <0.001 | 3.0 (2.0; 5.0) | 5.0 (2.0; 8.0) | <0.001 |
| ICU Admission | 74,220 (22.9) | 5,633 (53.6) | <0.001 | 54,488 (24.1) | 8,730 (58.6) | <0.001 | 40,583 (20.3) | 12,481 (17.5) | <0.001 | 24,584 (17.5) | 15,666 (35.5) | <0.001 | 168,137 (37.5) | 13,146 (35.4) | <0.001 |
| Any procedure | 100,877 (31.1) | 10,508 (100.0) | <0.001 | 41,064 (18.1) | 14,905 (100.0) | <0.001 | 26,448 (13.3) | 71,422 (100.0) | <0.001 | 13,354 (9.5) | 44,182 (100.0) | <0.001 | 283,308 (63.2) | 37,118 (100.0) | <0.001 |
| Colonoscopy | 89,402 (27.6) | 1,203 (11.4) | <0.001 | 13,541 (6.0) | 606 (4.1) | <0.001 | 2,079 (1.0) | 141 (0.2) | <0.001 | 7,418 (5.3) | 1,258 (2.8) | <0.001 | 92,235 (20.6) | 721 (1.9) | <0.001 |
| EGD | 46,855 (14.5) | 585 (5.6) | <0.001 | 25,186 (11.1) | 547 (3.7) | <0.001 | 13,991 (7.0) | 2,049 (2.9) | <0.001 | 6,329 (4.5) | 880 (2.0) | <0.001 | 257,223 (57.4) | 1,821 (4.9) | <0.001 |
| Interventional Radiology | 1,709 (0.5) | 70 (0.7) | 0.054 | 9,458 (4.2) | 181 (1.2) | <0.001 | 12,529 (6.3) | 254 (0.4) | <0.001 | 859 (0.6) | 222 (0.5) | 0.008 | 5,008 (1.1) | 177 (0.5) | <0.001 |
| Blood transfusion | 43,926 (13.6) | 1,634 (15.6) | <0.001 | 13,579 (6.0) | 2,256 (15.1) | <0.001 | 7,740 (3.9) | 2,367 (3.3) | <0.001 | 4,061 (2.9) | 3,256 (7.4) | <0.001 | 143,132 (31.9) | 3,630 (9.8) | <0.001 |
| Diagnostic Radiology | 237,898 (73.4) | 9,617 (91.5) | <0.001 | 185,542 (82.0) | 14,143 (94.9) | <0.001 | 176,767 (88.6) | 60,659 (84.9) | <0.001 | 127,098 (90.6) | 40,220 (91.0) | 0.003 | 326,840 (72.9) | 33,966 (91.5) | <0.001 |
| Computed tomography | 172,219 (53.2) | 8,257 (78.6) | <0.001 | 146,616 (64.8) | 12,103 (81.2) | <0.001 | 122,191 (61.2) | 35,128 (49.2) | <0.001 | 106,606 (76.0) | 34,886 (79.0) | <0.001 | 157,218 (35.1) | 30,967 (83.4) | <0.001 |
| Abdominal ultrasound | 13,161 (4.1) | 354 (3.4) | <0.001 | 38,802 (17.1) | 2,380 (16.0) | <0.001 | 108,356 (54.3) | 43,062 (60.3) | <0.001 | 6,706 (4.8) | 1,804 (4.1) | <0.001 | 29,549 (6.6) | 1,954 (5.3) | <0.001 |
| MRI | 3,795 (1.2) | 51 (0.5) | <0.001 | 12,010 (5.3) | 445 (3.0) | <0.001 | 49,104 (24.6) | 10,120 (14.2) | <0.001 | 1,342 (1.0) | 185 (0.4) | <0.001 | 4,712 (1.1) | 165 (0.4) | <0.001 |
| GI bleeding scan | 16,677 (5.1) | 277 (2.6) | <0.001 | 322 (0.1) | 36 (0.2) | 0.002 | 174 (0.1) | 25 (0.0) | <0.001 | 125 (0.1) | 64 (0.1) | 0.001 | 14,992 (3.3) | 219 (0.6) | <0.001 |
Median (Interquartile range). All others N (%).
Length of stay varied by management as well. For colorectal conditions, operative patients had longer length of stay (8.0 vs. 3.0 days, p < 0.001), and more ICU admissions (53.6% vs. 22.9%, p < 0.001). For general abdominal conditions, operative patients had longer length of stay (8.0 vs. 3.0 days, p < 0.001), and more ICU admissions (58.6% vs. 24.1%, p < 0.001). For hepatopancreaticobiliary conditions, operative patients had shorter longer lengths of stay (3.0 vs. 4.0 days, p < 0.001), and fewer ICU admissions (17.5% vs. 20.3%, p < 0.001). For intestinal obstructions, operative patients also had longer length of stay (6.0 vs. 4.0 days, p < 0.001), and more ICU admissions (35.5% vs. 17.5%, p < 0.001). For upper GI conditions, operative patients had longer lengths of stay (5.0 vs. 3.0 days, p < 0.001), and similar rates of ICU admissions (35.4% vs. 37.5%, p < 0.001).
Discussion
For older adults with emergency general surgery conditions, surgeons often confront uncertainty. While “the chance to cut is the chance to cure”, with surgery promising an efficient and definitive fix, the risks associated with general anesthesia and surgery itself can outweigh the benefits of the operation, particularly as complications and prolonged inpatient stays accrue. At the bedside, even experienced clinicians struggle to predict the trajectories and outcomes of these complex patients,26 but guiding evidence is scarce.
Management of EGS conditions contributes substantial costs to individual patients and to the healthcare system, regardless of management strategy. Furthermore, emergency surgery is approximately 30% more costly than similar procedures performed in the elective setting.10 We anticipated that patients undergoing surgery would incur higher costs for their initial hospitalization, but we hoped that definitively addressing their condition with surgical management would lead to lower costs in long-term follow up. This was the case only for HPB conditions. For all others, where operative and nonoperative treatment were both reasonable, costs associated with operative management were persistently higher out to 90 days. While higher costs could be justified by improved outcomes, our prior work demonstrated that mortality, readmissions, and complications were also equivalent or higher for operative management (compared to non-operative management) at all time points for colorectal, upper gastrointestinal, small bowel obstruction, and general abdominal patients.11 With the exception of colorectal conditions, patients managed operatively had lower unadjusted, post-discharge costs, which could be an indication of better general health and quality of life after surgery. However, given the contrast with the instrumental variable results for outcomes and costs, this may represent the lack of comparability among the two groups. The finding of higher costs after discharge for patients with colorectal conditions managed operatively is interesting. One possible explanation for this difference is costs incurred for subsequent reversal of an ostomy created in the emergent setting.27
HPB was the only condition group for which costs were lower among operative patients by 90 days; in this group, length of stay was shorter and other procedures less common than for nonoperative management. For these conditions, operative management was accompanied by a shorter index length of stay, and very few post-operative procedures. Nonoperatively managed patients had few procedures, but a longer length of stay. These results further confirm the benefits of early (over delayed) cholecystectomy for acute cholecystitis, for example.28–31 The upper GI conditions group includes appendicitis, and are results are in contrast to those from trials that have demonstrated lower long-term costs for operative management of appendicitis in privately-insured patients.32 This may relate to our focus on older adults, or to other conditions included in this heterogenous group. For intestinal obstruction, index hospital length of stay was longer among operative patients, in contrast to literature suggesting that early operative intervention for bowel obstruction shortened hospital stays.16 For upper GI, colorectal, and general abdominal conditions, costs for operative management remained higher throughout our period of observation.
Out-of-pocket costs, including copays, deductibles, and coinsurance, were primarily determined by the inpatient hospitalization for all conditions, and were in the range of $1,000 regardless of management approach, below the standard Medicare Part A inpatient hospital deductible.33 Costs were quite similar between operative and nonoperative management, indicating that concerns about out-of-pocket expenditures should not factor heavily into decision-making in these situations. While out-of-pocket expenditures account for a low percentage of total costs to Medicare, they may still represent substantial expenditures for older adults, as median household income for older adults was $34,900 in 2017.34 Our data does not indicate which patients, if any, have supplemental coverage (Medigap) which could lessen out-of-pocket costs.
Our analysis of resource utilization gives some insight into the differences in costs of care. Invasive diagnostic and therapeutic procedures were common in patients managed nonoperatively for all condition groups. However, for all conditions except HPB, length of stay was longer and ICU admissions more common for operative patients, consistent with evidence that inpatient days and ICU care are major drivers of healthcare costs.35,36
Higher costs are not always a bad thing when the associated care is valuable to patients. Indeed, higher healthcare costs have been positively associated with patient satisfaction.37 Unfortunately, this study design does not permit us to measure patient-centered outcomes directly. However, with the exception of HPB conditions, our evidence for costs and outcomes is concordant, and supports nonoperative management where possible. However, the calculus might change if these results were extrapolated beyond Medicare, not only because of patient risk profiles, but also because of cost structures. For example, patients with private insurance are at higher risk of larger out-of-pocket expenses, particularly if members of the care team are outside of network.
Our study design had several key strengths. Medicare claims data allowed us to follow patients longitudinally to collect post-discharge costs at a national scale. Medicare payment scales also reduce heterogeneity among institutional payments ensuring accurate comparisons, which is essential given the wide range of pricing in US healthcare.38,39 This research shares the limitations common to using claims data: coding may be inaccurate and may vary among cases and institutions. Medicare data do not include physiologic parameters or laboratory values that may have influenced decision making. These are among the unobserved confounders for which instrumental variable analysis attempts to adjust. We matched patients within condition groups, but each group included a heterogenous set of conditions. We could not identify additional advantages of operative or nonoperative management strategies for any particular diagnosis. Differences in resource utilization may reflect in part differences in the specific conditions treated. Likewise, operative approaches and nonoperative approaches may have varied within groups, though the within-hospital match may have reduced this variation. Instrumental variable analysis speaks to the difference between treatments for patients who whose treatment is determined by the instrument—in this case, the surgeon’s tendency to operate. For patients who always would have or never would have had surgery, the estimates do not apply. This analysis is limited to direct costs of care to Medicare Parts A and B, and does not account for other costs, including travel or lost work for the patient or their caregivers. This analysis was limited to patients age ≥ 65 and may not apply to younger patients.
Conclusion
Many patients with emergency general surgery conditions have options for their care. In these cases, nonoperative management was most often associated with overall lower costs as well as improved or equivalent patient outcomes compared to operative management. With the exception of colorectal conditions, post-discharge costs were lower after an operation. For HPB conditions, costs were equivalent over the longer term. For patients in whom nonoperative management is feasible, cost considerations support this approach in some older EGS patients.
Supplementary Material
Acknowledgements
This work was supported by the National Institute on Aging grant R01AG060612.
Footnotes
Conflicts of Interest and Source of Funding: Research reported in this publication was supported by the National Institute on Aging of the National Institutes of Health under Award Number R01AG060612. The content is solely the responsibility of the authors and does not necessarily represent the official views of the National Institutes of Health. The funder had no role in design or conduct of the study; collection, management, analysis, and interpretation of the data; preparation, review, or approval of the manuscript; or decision to submit the manuscript for publication. No other conflicts of interest
Contributor Information
Elinore J. Kaufman, Division of Traumatology, Surgical Critical Care, and Emergency Surgery, Center for Surgery and Health Economics, University of Pennsylvania Perelman School of Medicine, The Leonard Davis Institute of Health Economics, The University of Pennsylvania.
Christopher J. Wirtalla, Department of Surgery, Center for Surgery and Health Economics, The University of Pennsylvania Perelman School of Medicine.
Luke J. Keele, Department of Surgery, Center for Surgery and Health Economics, The University of Pennsylvania Perelman School of Medicine.
Mark D. Neuman, Department of Anesthesia and critical Care Medicine, The University of Pennsylvania Perelman School of Medicine.
Claire B. Rosen, Department of Surgery, Center for Surgery and Health Economics, The University of Pennsylvania Perelman School of Medicine.
Solomiya Syvyk, Department of Surgery, Center for Surgery and Health Economics, The University of Pennsylvania Perelman School of Medicine.
Justin Hatchimonji, Division of Traumatology, Surgical Critical Care, and Emergency Surgery, Center for Surgery and Health Economics, University of Pennsylvania Perelman School of Medicine.
Sara Ginzberg, Department of Surgery, Center for Surgery and Health Economics, The University of Pennsylvania Perelman School of Medicine.
Ari Friedman, Department of Emergency Medicine, The University of Pennsylvania Perelman School of Medicine.
Sanford E. Roberts, Department of Surgery, Center for Surgery and Health Economics, The University of Pennsylvania Perelman School of Medicine.
Rachel R. Kelz, Department of Surgery, Center for Surgery and Health Economics, University of Pennsylvania Perelman School of Medicine, The Leonard Davis Institute of Health Economics, The University of Pennsylvania.
References
- 1.Ogola GO, Gale SC, Haider A, Shafi S. The financial burden of emergency general surgery: National estimates 2010 to 2060. J Trauma Acute Care Surg. 2015;79(3):444–448. doi: 10.1097/TA.0000000000000787 [DOI] [PubMed] [Google Scholar]
- 2.Ansaloni L, Catena F, Chattat R, et al. Risk factors and incidence of postoperative delirium in elderly patients after elective and emergency surgery. Br J Surg. 2010;97(2):273–280. doi: 10.1002/bjs.6843 [DOI] [PubMed] [Google Scholar]
- 3.Laurell H, Hansson LE, Gunnarsson U. Acute abdominal pain among elderly patients. Gerontology. 2006;52(6):339–344. doi: 10.1159/000094982 [DOI] [PubMed] [Google Scholar]
- 4.Shah AA, Haider AH, Zogg CK, et al. National estimates of predictors of outcomes for emergency general surgery. J Trauma Acute Care Surg. 2015;78(3):482–490; discussion 490–491. doi: 10.1097/TA.0000000000000555 [DOI] [PubMed] [Google Scholar]
- 5.Lubitz AL, Chan E, Zarif D, et al. American College of Surgeons NSQIP Risk Calculator Accuracy for Emergent and Elective Colorectal Operations. J Am Coll Surg. 2017;225(5):601–611. doi: 10.1016/j.jamcollsurg.2017.07.1069 [DOI] [PubMed] [Google Scholar]
- 6.Ingraham AM, Cohen ME, Raval MV, Ko CY, Nathens AB. Variation in quality of care after emergency general surgery procedures in the elderly. J Am Coll Surg. 2011;212(6):1039–1048. doi: 10.1016/j.jamcollsurg.2011.03.001 [DOI] [PubMed] [Google Scholar]
- 7.Muthuvel G, Tevis SE, Liepert AE, Agarwal SK, Kennedy GD. A composite index for predicting readmission following emergency general surgery: Journal of Trauma and Acute Care Surgery. 2014;76(6):1467–1472. doi: 10.1097/TA.0000000000000223 [DOI] [PMC free article] [PubMed] [Google Scholar]
- 8.Havens JM, Olufajo OA, Cooper ZR, Haider AH, Shah AA, Salim A. Defining Rates and Risk Factors for Readmissions Following Emergency General Surgery. JAMA Surgery. 2016;151(4):330. doi: 10.1001/jamasurg.2015.4056 [DOI] [PubMed] [Google Scholar]
- 9.Ingraham AM, Cohen ME, Bilimoria KY, et al. Comparison of 30-day outcomes after emergency general surgery procedures: potential for targeted improvement. Surgery. 2010;148(2):217–238. doi: 10.1016/j.surg.2010.05.009 [DOI] [PubMed] [Google Scholar]
- 10.Haider AH, Obirieze A, Velopulos CG, et al. Incremental Cost of Emergency Versus Elective Surgery: Annals of Surgery. 2015;262(2):260–266. doi: 10.1097/SLA.0000000000001080 [DOI] [PubMed] [Google Scholar]
- 11.Kaufman EJ, Keele L, Wirtalla CJ, et al. Operative and nonoperative outcomes of emergency general surgery conditions: An observational study using a novel instrumental variable. Annals of Surgery. Published online 2022. [DOI] [PMC free article] [PubMed] [Google Scholar]
- 12.Shafi S, Aboutanos MB, Agarwal S, et al. Emergency general surgery: Definition and estimated burden of disease. Journal of Trauma and Acute Care Surgery. 2013;74(4):1092–1097. doi: 10.1097/TA.0b013e31827e1bc7 [DOI] [PubMed] [Google Scholar]
- 13.Keele L, Sharoky CE, Sellers MM, Wirtalla CJ, Kelz RR. An Instrumental Variables Design for the Effect of Emergency General Surgery. Epidemiologic Methods. 2018;7(1):20170012. doi: 10.1515/em-2017-0012 [DOI] [Google Scholar]
- 14.Scott JW, Olufajo OA, Brat GA, et al. Use of National Burden to Define Operative Emergency General Surgery. JAMA Surgery. Published online April 27, 2016:e160480. doi: 10.1001/jamasurg.2016.0480 [DOI] [PubMed] [Google Scholar]
- 15.Diaz JJ, Bokhari F, Mowery NT, et al. Guidelines for management of small bowel obstruction. J Trauma. 2008;64(6):1651–1664. doi: 10.1097/TA.0b013e31816f709e [DOI] [PubMed] [Google Scholar]
- 16.Schraufnagel D, Rajaee S, Millham FH. How many sunsets? Timing of surgery in adhesive small bowel obstruction: a study of the Nationwide Inpatient Sample. J Trauma Acute Care Surg. 2013;74(1):181–187; discussion 187–189. doi: 10.1097/TA.0b013e31827891a1 [DOI] [PubMed] [Google Scholar]
- 17.Sharoky CE, Bailey EA, Sellers MM, et al. Outcomes of hospitalized patients undergoing emergency general surgery remote from admission. Surgery. 2017;162(3):612–619. doi: 10.1016/j.surg.2017.05.008 [DOI] [PubMed] [Google Scholar]
- 18.Bureau of Labor Statistics Data. Accessed October 25, 2022. https://data.bls.gov/timeseries/CUUR0000SAM?output_view=data
- 19.Hatchimonji JS. Resource Utilization in Emergency General Surgery. in submission. [Google Scholar]
- 20.Elixhauser Anne, Steiner Claudia, Harris D. Robert, Coffey Rosanna M.. Comorbidity Measures for Use with Administrative Data. Med Care. 1998;36(1):8–27. [DOI] [PubMed] [Google Scholar]
- 21.Iwashyna TJ, Odden A, Rohde J, et al. Identifying patients with severe sepsis using administrative claims: patient-level validation of the angus implementation of the international consensus conference definition of severe sepsis. Med Care. 2014;52(6):e39–43. doi: 10.1097/MLR.0b013e318268ac86 [DOI] [PMC free article] [PubMed] [Google Scholar]
- 22.Kim DH, Schneeweiss S, Glynn RJ, Lipsitz LA, Rockwood K, Avorn J. Measuring Frailty in Medicare Data: Development and Validation of a Claims-Based Frailty Index. J Gerontol A Biol Sci Med Sci. 2018;73(7):980–987. doi: 10.1093/gerona/glx229 [DOI] [PMC free article] [PubMed] [Google Scholar]
- 23.Baiocchi M, Cheng J, Small DS. Instrumental variable methods for causal inference. Stat Med. 2014;33(13):2297–2340. doi: 10.1002/sim.6128 [DOI] [PMC free article] [PubMed] [Google Scholar]
- 24.Brookhart MA, Schneeweiss S. Preference-based instrumental variable methods for the estimation of treatment effects: assessing validity and interpreting results. Int J Biostat. 2007;3(1):Article 14. doi: 10.2202/1557-4679.1072 [DOI] [PMC free article] [PubMed] [Google Scholar]
- 25.Small DS, Rosenbaum PR. War and Wages. Journal of the American Statistical Association. 2008;103(483):924–933. doi: 10.1198/016214507000001247 [DOI] [Google Scholar]
- 26.Christakis NA, Lamont EB. Extent and determinants of error in doctors’ prognoses in terminally ill patients: prospective cohort study. BMJ. 2000;320(7233):469–473. [DOI] [PMC free article] [PubMed] [Google Scholar]
- 27.Resio BJ, Jean R, Chiu AS, Pei KY. Association of Timing of Colostomy Reversal With Outcomes Following Hartmann Procedure for Diverticulitis. JAMA Surg. 2019;154(3):218–224. doi: 10.1001/jamasurg.2018.4359 [DOI] [PMC free article] [PubMed] [Google Scholar]
- 28.Discolo A, Reiter S, French B, et al. Outcomes following early versus delayed cholecystectomy performed for acute cholangitis. Surg Endosc. 2020;34(7):3204–3210. doi: 10.1007/s00464-019-07095-0 [DOI] [PubMed] [Google Scholar]
- 29.Severance SE, Feizpour C, Feliciano DV, Coleman J, Zarzaur BL, Rozycki GF. Timing of Cholecystectomy after Emergent Endoscopic Retrograde Cholangiopancreatography for Cholangitis. Am Surg. 2019;85(8):895–899. [PubMed] [Google Scholar]
- 30.Gurusamy KS, Nagendran M, Davidson BR. Early versus delayed laparoscopic cholecystectomy for acute gallstone pancreatitis. Cochrane Database Syst Rev. 2013;(9):CD010326. doi: 10.1002/14651858.CD010326.pub2 [DOI] [PMC free article] [PubMed] [Google Scholar]
- 31.Cao AM, Eslick GD, Cox MR. Early laparoscopic cholecystectomy is superior to delayed acute cholecystitis: a meta-analysis of case-control studies. Surg Endosc. 2016;30(3):1172–1182. doi: 10.1007/s00464-015-4325-4 [DOI] [PubMed] [Google Scholar]
- 32.Sceats LA, Trickey AW, Morris AM, Kin C, Staudenmayer KL. Nonoperative Management of Uncomplicated Appendicitis Among Privately Insured Patients. JAMA Surg. 2019;154(2):141–149. doi: 10.1001/jamasurg.2018.4282 [DOI] [PMC free article] [PubMed] [Google Scholar]
- 33.2018. Medicare Parts A & B Premiums and Deductibles | CMS. Accessed October 14, 2022. https://www.cms.gov/newsroom/fact-sheets/2018-medicare-parts-b-premiums-and-deductibles [Google Scholar]
- 34.Thompson D, King MD. Income Sources of Older Households: 2017. :11. [Google Scholar]
- 35.National Inpatient Hospital Costs: The Most Expensive Conditions by Payer, 2017 #261. Accessed July 26, 2022. https://www.hcup-us.ahrq.gov/reports/statbriefs/sb261-Most-Expensive-Hospital-Conditions-2017.jsp [PubMed]
- 36.Dasta JF, McLaughlin TP, Mody SH, Piech CT. Daily cost of an intensive care unit day: the contribution of mechanical ventilation. Crit Care Med. 2005;33(6):1266–1271. doi: 10.1097/01.ccm.0000164543.14619.00 [DOI] [PubMed] [Google Scholar]
- 37.Fenton JJ. The Cost of Satisfaction: A National Study of Patient Satisfaction, Health Care Utilization, Expenditures, and Mortality. Archives of Internal Medicine. 2012;172(5):405. doi: 10.1001/archinternmed.2011.1662 [DOI] [PubMed] [Google Scholar]
- 38.Reinhardt UE. The Pricing Of U.S. Hospital Services: Chaos Behind A Veil Of Secrecy. Health Affairs. 2006;25(1):57–69. doi: 10.1377/hlthaff.25.1.57 [DOI] [PubMed] [Google Scholar]
- 39.Miller DC, Gust C, Dimick JB, Birkmeyer N, Skinner J, Birkmeyer JD. Large Variations In Medicare Payments For Surgery Highlight Savings Potential From Bundled Payment Programs. Health Affairs. 2011;30(11):2107–2115. doi: 10.1377/hlthaff.2011.0783 [DOI] [PMC free article] [PubMed] [Google Scholar]
Associated Data
This section collects any data citations, data availability statements, or supplementary materials included in this article.