

Summary
The impact of tobacco exposure on health varies by race and ethnicity and is closely tied to internal nicotine dose, a marker of carcinogen uptake. DNA methylation is strongly responsive to smoking status and may mediate health effects, but study of associations with internal dose is limited. We performed a blood leukocyte epigenome-wide association study (EWAS) of urinary total nicotine equivalents (TNEs; a measure of nicotine uptake) and DNA methylation measured using the MethylationEPIC v1.0 BeadChip (EPIC) in six racial and ethnic groups across three cohort studies. In the Multiethnic Cohort Study (discovery, n = 1994), TNEs were associated with differential methylation at 408 CpG sites across >250 genomic regions (p < 9 × 10⁻⁸). The top significant sites were annotated to AHRR, F2RL3, RARA, GPR15, PRSS23, and 2q37.1, all of which had decreasing methylation with increasing TNEs. We identified 45 novel CpG sites, of which 42 were unique to the EPIC array and eight annotated to genes not previously linked with smoking-related DNA methylation. The most significant signal in a novel gene was cg03748458 in MIR383;SGCZ. Fifty-one of the 408 discovery sites were validated in the Singapore Chinese Health Study (n = 340) and the Southern Community Cohort Study (n = 394) (Bonferroni corrected p < 1.23 × 10⁻⁴). Significant heterogeneity by race and ethnicity was detected for CpG sites in MYO1G and CYTH1. Furthermore, TNEs significantly mediated the association between cigarettes per day and DNA methylation at 15 sites (average 22.5%–44.3% proportion mediated). Our multiethnic study highlights the transethnic and ethnic-specific methylation associations with internal nicotine dose, a strong predictor of smoking-related morbidities.
Keywords: nicotine, total nicotine equivalents, DNA methylation, epigenetics, epigenome-wide association study, EWAS, race and ethnicity, lung cancer, smoking, cohort
Graphical abstract
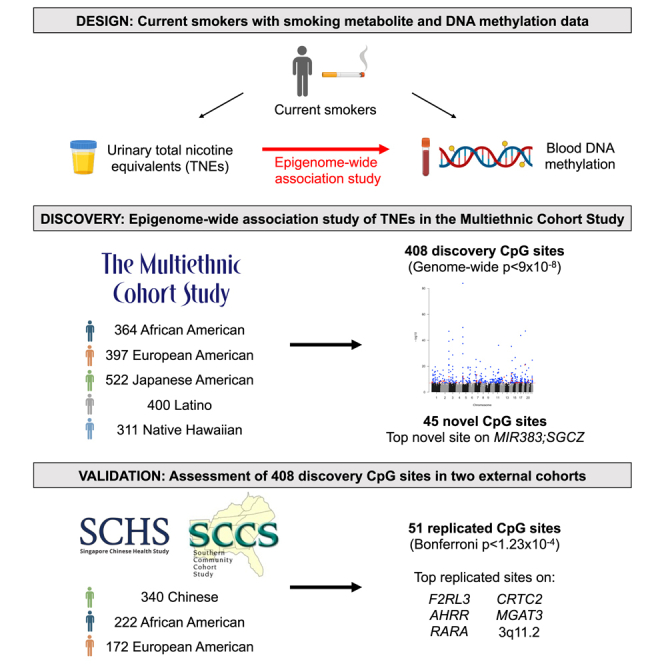
In this large multiethnic epigenome-wide association study of total nicotine equivalents across three cohorts, we identified differential methylation at 408 CpG loci, of which 45 were novel and 51 were externally validated. Our findings highlight the generalizability of these internal smoking dose-related epigenetic modifications across multiple racial and ethnic populations.
Introduction
Cigarette smoking is a strong, global risk factor for lung cancer. Epidemiologic studies have shown that the risk for smoking-related lung cancer differs by race and ethnicity,1,2 even after accounting for self-reported smoking history. This inter-individual variation in risk may in part be attributed to racial and ethnic differences in smokers’ uptake of nicotine and carcinogens from each cigarette.3 We previously observed that urinary total nicotine equivalents (TNEs; a measure of nicotine uptake) levels per cigarette were higher among African Americans and lower among Japanese Americans compared to European Americans, which is consistent with the corresponding higher and lower smoking-related lung cancer risk for these groups.1,2,3 However, the TNE uptake levels per cigarette for Native Hawaiians and Latinos, which were similar to that of European Americans, were not consistent with their respective higher and lower smoking-related lung cancer risk.1,2,3
Additional understanding of the racial- and ethnic-specific and transethnic impact of cigarette smoking on lung cancer risk may be provided by its association with altered blood DNA methylation. Many previous epigenome-wide association studies (EWASs) of smoking have focused on self-reported smoking status, with the largest study across 16 epidemiologic cohorts reporting differential methylation between current and never smokers for >2,600 cytosine-phosphate-guanine (CpG) sites in 1,405 genes, including AHRR, F2RL3, and GPR15.4,5 Although most of these studies were conducted in populations of mainly European ancestry, more recent EWASs in racial and ethnic minorities have replicated many of the differentially methylated sites associated with smoking status in American Indians, African Americans, and Latinos.6,7,8 However, the generalizability of these studies is still limited due to the lack of data for other underrepresented populations.
Furthermore, self-reported smoking status may not fully capture the effect of smoking dose on DNA methylation. To assess the effect of smoking dose, epigenetic studies have used other measures including self-reported cigarettes per day9,10 and biomarkers of smoking (e.g., cotinine10,11,12,13 and cadmium6). However, these measures do not entirely correlate with direction of disease risks (e.g., self-reported cigarettes per day),14 nor do they account for inter-individual differences in nicotine uptake related to smoking behavior and nicotine metabolism (e.g., cotinine).3 Importantly, internal smoking dose as measured by urinary TNEs (the sum of major metabolites nicotine, cotinine, trans-3′-hydroxycotinine [3-HCOT], and their glucuronides and nicotine N-oxide) estimates 80%–90% of nicotine uptake15,16 and, thus, is the more reliable measure of dose. In a prior EWAS of internal smoking dose in three racial and ethnic groups (Japanese Americans, Native Hawaiians, and European Americans; n = 612 individuals) in Hawaii using the Infinium HumanMethylation450 BeadChip array (HM450K), we observed that increasing urinary nicotine equivalents (sum of nicotine, cotinine, 3-HCOT, and their glucuronides) were associated with higher DNA methylation at eight CpG sites in Native Hawaiians but not in European Americans or Japanese Americans.17 As this provided evidence of potential variation across race and ethnicity, further investigation is needed to better explicate the transethnic effects of smoking dose on the epigenome. Therefore, we conducted an EWAS of TNEs using the Infinium MethylationEPIC v1.0 BeadChip array (EPIC) across six distinct racial and ethnic groups from three large prospective cohorts: the Multiethnic Cohort Study (MEC), the Singapore Chinese Health Study (SCHS), and the Southern Community Cohort Study (SCCS).
Material and methods
Discovery cohort
The discovery cohort is comprised of smokers from the MEC. The MEC is a prospective cohort study that was established in 1993–1996 to investigate risk factors for cancer and chronic diseases.18 It consists of over 215,000 men and women, aged 45–75 at enrollment, from Hawaii and California (primarily Los Angeles County) from five racial and ethnic groups: African Americans, European Americans, Japanese Americans, Latinos, and Native Hawaiians. All participants completed a baseline questionnaire at cohort entry (additional details on the race and ethnicity descriptors collected via the questionnaire can be found in the supplemental methods), and approximately 70,000 individuals provided blood/urine specimens around 10 years after cohort entry.
For the present study, we focused our analysis on the subcohort of participants who were currently smoking at the time of biospecimen collection, reported smoking ≥10 cigarettes per day, had available genotype data and valid urinary TNE measurements (≥1.27 nmol/mL, sum of four times the limit of quantization [LOQ] for nicotine, cotinine, 3-HCOT, and nicotine N-oxide), had no history of lung cancer at the time of biospecimen collection (n = 2,239),19 and had DNA methylation data available (n = 1,998). During methylation pre-processing (described under section “DNA methylation”), we further excluded two individuals with poor methylation signals and two with discordant self-reported and methylation-predicted sex, leaving a total of 1,994 remaining participants for the analysis (Figure S1). These individuals were genotyped using the Illumina Human1M-Duo BeadChip (1,199,187 single nucleotide polymorphisms [SNPs]), and principal components were estimated with EIGENSTRAT using a random sample of 19,059 autosomal SNPs.20,21
Validation cohorts
We pursued replication in a subset of smokers from two prospective cohorts: the SCHS and the SCCS.
The SCHS is a population-based cohort of >63,000 Chinese individuals from Singapore that was designed to assess the influence of diet and genetics on cancer and other chronic diseases.22 Men and women, aged 47–74, residing in Singapore were recruited from 1993 to 1998. Demographic information (see additional details in supplemental methods) and smoking history were obtained at the time of recruitment by a trained interviewer. 61% of eligible subjects donated baseline blood, buccal, and urine samples at the follow-up interview in 2000–2005. For this analysis, we utilized data from participants recruited for a nested case-control study of lung cancer (n = 169 cases, 171 controls) comprised of current smokers with available blood and valid urinary TNE data.23 Each control was randomly selected from the eligible cohort of participants who were alive and free of cancer on the date of cancer diagnosis of the index case. Cases and controls were matched on smoking status at baseline (i.e., current smoker), sex, dialect (Hokkien/Cantonese as a proxy for geographical area and ancestry), age at enrollment (±3 years), date of baseline interview (±2 years), and date of biospecimen collection (±6 months).
The SCCS is a prospective cohort of approximately 86,000 African American and European American individuals from the southeastern United States that was developed to evaluate disparities in cancer and other chronic diseases.24 Men and women, aged 40–79, from 12 southeastern states (Alabama, Arkansas, Florida, Georgia, Kentucky, Louisiana, Mississippi, North Carolina, South Carolina, Tennessee, Virginia, and West Virginia) were recruited during 2002–2009 from predominantly community health centers. At baseline, demographic information (see additional details in supplemental methods) and smoking history were collected from trained study interviewers who administered a computer-assisted personal interview at the community health centers. Approximately 91% of cohort participants provided a biospecimen at enrollment, with 20.8% providing both blood and spot urine. For the present analysis, we selected individuals from a nested case-control study of lung cancer (n = 197 cases, 197 controls) among SCCS participants who were current smokers with available blood and valid urinary TNE data. One control for every case was selected at random among current smokers with available blood and urinary TNE data. Controls were matched on age, sex, race and ethnicity, and recruitment site.
For the present analysis, we included all participants from the SCHS and SCCS nested case-control studies for the validation cohort. All participants had valid DNA methylation data after pre-processing and were retained for the analysis. In total, the validation cohort was comprised of 734 individuals: 340 (169 Chinese cases, 171 Chinese controls) from the SCHS and 394 (111 African American and 86 European American cases, 111 African American and 86 European American controls) from the SCCS (Figure S1).
Measurement of TNEs
TNEs are comprised of the sum of cotinine, nicotine, 3-HCOT and their glucuronides, and nicotine N-oxide.15 These metabolites were quantified in overnight or first morning urine samples in the MEC and spot urine in the SCHS and SCCS by liquid chromatography-tandem mass spectrometry (LC-MS/MS)19,25 at the University of Minnesota. To measure total nicotine (free + nicotine N-glucuronide), total cotinine (free + cotinine N-glucuronide), and total 3-HCOT (free + 3-HCOT glucuronide), the urine samples were first treated with β-glucuronidase and then analyzed by LC-MS/MS.
DNA methylation
DNA methylation profiling of peripheral blood leukocytes was performed by the University of Hawaii Cancer Center Genomics and Bioinformatics Shared Resource using the Illumina MethylationEPIC v1.0 BeadChip assay (EPIC) (San Diego, CA) following the manufacturer’s protocol. This array measures the methylation levels at over 850,000 CpG sites across the genome, including >90% of the loci from the HumanMethylation450 array with additional coverage of regulatory regions.26
Raw methylated and unmethylated signal intensities were extracted from the IDAT files and pre-processed using several R Bioconductor packages including minfi, shinyMethyl, wateRmelon, ENmix, and sva.27,28,29,30,31,32,33,34 Initial quality control of the raw intensities included assessment of the red and green channel signals and comparison of self-reported vs. methylation-predicted sex. Probes with poor intensity values (detection p values >0.01, zero methylated or unmethylated intensity values, or <3 beads) in more than 5% of the samples were removed (27,792 probes). Within-sample normalization consisted of background correction to estimate true signal from the observed foreground (using normal out-of-band background correction “noob”), dye-bias correction to normalize imbalance due to intensities measured in two color channels, and type I and type II bias to correct for differences in range of signal intensity from two probe types (using the regression on correlated probes [RCP] method).33 Between-sample normalization included adjusting for potential batch effects of assay plate using ComBat.34
After pre-processing, the intensities of methylated and unmethylated signals at each cytosine position (CpG) were measured using a composite β value (methylated signal/[methylated signal + unmethylated signal]) ranging from 0 to 1, with larger values indicating more methylation. Probes with poor intensity values were imputed as missing. As the distribution of SNPs varies by race and ethnicity, we did not remove CpG probes overlapping SNPs (at the same genomic coordinates) a priori. To identify any outliers or multimodal distributions that would suggest a potential effect of genetic polymorphisms on DNA methylation levels, the distribution of methylation at these CpG sites was evaluated using density plots and scatterplots. After pre-processing and exclusions, 838,299 CpG sites (819,505 on autosomal chromosomes) were available for analysis in the discovery cohort.
Cell type
For each participant, cell type proportions of B cells, CD4+ T cells, CD8+ T cells, natural killer cells, neutrophils, and monocytes of the blood samples used were predicted from DNA methylation data by applying a constrained projection procedure35 using the Identifying Optimal Libraries (IDOL) optimized probes with the FlowSorted.Blood.EPIC R package for the EPIC array.36
Statistical analyses
Baseline characteristics were compared across racial and ethnic groups in both the discovery and validation cohorts using chi-square tests for categorical variables and ANOVA for continuous variables. The correlation between TNEs and cigarettes per day was assessed using the Pearson correlation coefficient. The associations between smoking measures (TNEs, cigarettes per day, and pack-years) and DNA methylation-predicted cell type proportions were evaluated using linear regression.
Discovery EWAS of TNEs
For our primary analysis in the discovery phase, an EWAS of TNEs was performed using robust linear regression (using the rlm function in the MASS R package) to assess the association between TNEs and DNA methylation (β value) at each locus. Urinary TNEs were log-transformed in all analyses to meet model assumptions (Figure S2). The parameter estimates and standard errors from the robust linear regressions were calculated using heteroscedasticity-consistent estimation of the covariance matrix (using the vcovHC function in the sandwich R package).37,38 The parameter estimates from the models represent the change in methylation β value per one log-unit increase in TNEs. All models were adjusted for age at biospecimen collection, sex, DNA methylation-based estimates of cell type proportions, and the first eight genetic principal components to account for population stratification. Models were run within each racial and ethnic group, and the results were meta-analyzed using a fixed-effects inverse-variance weighted model to obtain a single estimate per locus. The epigenome-wide significance level was set at p < 9 × 10⁻⁸, a threshold which has been shown to adequately control the false-positive rate for studies using the EPIC array.39 See Figure 1 for a flowchart of the analyses.
Figure 1.

Flowchart of analyses and results
Discovery phase in the MEC identified 408 hits, of which 51 were replicated in the validation phase in the SCHS and SCCS. In each phase, sensitivity analyses were run further adjusting for (1) pack-years, (2) cigarettes per day, (3) education, or (4) creatinine. In the discovery phase, the sensitivity analyses of the 408 discovery hits used a Bonferroni-corrected threshold of p < 1.23 × 10⁻⁴ (p = 0.05/408). In the validation phase, the sensitivity analyses of the 51 replicated hits used a Bonferroni-corrected threshold of p < 9.80 × 10⁻⁴ (p = 0.05/51). Abbreviations: EWAS, epigenome-wide association study; MEC, Multiethnic Cohort Study; SCHS, Singapore Chinese Health Study; SCCS, Southern Community Cohort Study; TNEs, total nicotine equivalents.
For the CpG sites reaching genome-wide significance in the discovery EWAS (n = 408 CpG sites), we performed four sensitivity analyses to further examine the relationship between TNEs and DNA methylation. First, to assess the influence of TNEs irrespective of cumulative self-reported smoking exposure, each base model was re-run with self-reported smoking pack-years as an additional covariate. Second, to examine the influence of TNEs independent of self-reported smoking intensity, self-reported cigarettes per day (log-transformed due to nonnormal distribution; Figure S2) was included as an additional covariate in the base model. Third, to account for potential confounding by socioeconomic status, the base model was adjusted for years of education (≤high school vs. >high school in the MEC/SCCS; no formal education vs. any education in the SCHS). Fourth, to address the variation in urinary TNE levels due to different urine collection methods (i.e., overnight, first morning, or spot urine) across cohorts, the base model was adjusted for creatinine. For all sets of sensitivity analyses, models were fit in each racial and ethnic group separately and then meta-analyzed to get a single estimate per locus. Here, we used a Bonferroni-corrected threshold of p < 1.23 × 10⁻⁴ (p = 0.05/408 sites).
Replication of significant TNE EWAS hits
Replication of the significant hits in the primary discovery EWAS of TNEs (n = 408 CpG sites) was performed among participants in the SCHS and SCCS (Figure 1). Models were run separately in cases and controls within each of the three racial and ethnic groups: Chinese individuals from the SCHS, African Americans from the SCCS, and European Americans from the SCCS (six replication groups total). For the analysis of the SCHS participants, models were adjusted for age at enrollment/biospecimen collection, sex, dialect, years since first enrollment, and DNA methylation-based estimates of cell type proportions. For the analysis of the SCCS participants, models were adjusted for age at enrollment/biospecimen collection, sex, and DNA methylation-based estimates of cell type proportions. Results from the six replication groups were meta-analyzed to obtain a single estimate per locus using a Bonferroni-corrected significance threshold of p < 1.23 × 10⁻⁴ (p = 0.05/408 sites).
Similar to the discovery phase, four follow-up sensitivity analyses—i.e., adjustment for (1) pack-years, (2) log-transformed cigarettes per day, (3) education, or (4) creatinine levels—were performed on the hits that were replicated in the validation cohort (n = 51 CpG sites). In each set of sensitivity analyses, models were run in each of the six replication groups and then meta-analyzed with a Bonferroni-corrected significance threshold of p < 9.80 × 10⁻⁴ (p = 0.05/51 sites).
Although the lung cancer cases in the validation sets developed cancer after biospecimen collection, cases on average had higher levels of TNEs compared to the controls. Thus, to address potential oversampling of individuals with higher levels of TNEs, we re-ran all the replication meta-analyses with only the non-lung cancer controls (three replication groups total).
Assessment of heterogeneity by race and ethnicity and sex
To examine heterogeneity by race and ethnicity and/or by sex in the discovery cohort, a follow-up analysis of the significant hits in the primary discovery EWAS of TNEs (n = 408 CpG sites) was performed. Racial and ethnic heterogeneity at any site meeting genome-wide significance (p < 9 × 10⁻⁸) in the discovery EWAS or any race- and ethnicity-specific EWAS of TNEs was evaluated using the heterogeneity statistics (I2 and p value) from the meta-analysis of the five racial and ethnic groups. To assess differences by sex, we ran models separately for men and women, meta-analyzed the results from each sex, and then evaluated the heterogeneity statistics from this meta-analysis. Here, a Bonferroni-corrected threshold of p < 1.23 × 10⁻⁴ (p = 0.05/408 sites) was used to determine significant heterogeneity. To evaluate whether CpG sites showing significant heterogeneity were driven by outlier methylation values within a specific subgroup, scatterplots of TNEs and methylation by race and ethnicity or sex were examined. As no outliers were observed (data not shown), replication in the SCHS/SCCS was sought.
Internal vs. self-reported smoking dose
We conducted additional analyses to evaluate differences in epigenetic signatures between internal smoking dose (as measured by urinary TNEs) and self-reported smoking dose (as measured by self-reported cigarettes per day). First, we compared in the MEC the meta-analyzed results from the discovery EWAS of TNEs with the meta-analyzed results from a discovery EWAS of cigarettes per day, where log-transformed cigarettes per day was the exposure and age at biospecimen collection, sex, DNA methylation-based estimates of cell type proportions, and the first eight genetic principal components were the covariates. Replication of significant CpG sites in the EWAS of cigarettes per day (n = 362) was performed in the SCCS/SCHS using a Bonferroni-corrected threshold of p < 1.38 × 10⁻⁴ (p = 0.05/362 sites).
Second, for the overlapping significant CpG sites across the discovery EWAS of TNEs and the discovery EWAS of cigarettes per day (n = 201 CpG sites), the strength of association was assessed between the two exposure variables by comparing the parameter estimates and Z scores, with Z = 5.35 indicating genome-wide significance at p < 9 × 10⁻⁸.
Third, for the significant hits in the discovery EWAS of cigarettes per day (n = 362 CpG sites), a mediation analysis (using the regmedint R package)40 was conducted to investigate the degree in which TNEs mediate the association between cigarettes per day and DNA methylation. The pure natural direct effect, total natural indirect effect, and proportion mediated at each CpG site was calculated by comparing a one-unit increase from the median value of log-transformed cigarettes per day with the median value of log-transformed TNEs as the mediator level. The covariates were set at the median value for continuous variables and at the mode for categorical variables. Mediation analysis was conducted within each of the five racial and ethnic groups, and the estimate for the proportion mediated was meta-analyzed. CpG sites with significant mediation by TNEs were defined by a Bonferroni-corrected threshold of p < 1.38 × 10⁻⁴ (p = 0.05/362 sites).
All analyses were conducted using R version 4.1.3, meta-analyses were performed using METAL,41 and circular genomic plots were created using shinyCircos.42 This study was approved by the Institutional Review Boards of University of Hawaii Cancer Center, University of Southern California, Vanderbilt University, and University of Pittsburgh. All study participants provided informed consent at cohort entry.
Results
Baseline characteristics
The discovery cohort consisted of 1,994 (364 African American, 397 European American, 522 Japanese American, 400 Latino, and 311 Native Hawaiian) smokers from the MEC (Table 1). Urinary TNEs were highest in African Americans (mean = 56.1 nmol/mL) and lowest in Japanese Americans (33.7 nmol/mL). The average cigarettes smoked per day and pack-years were highest in European Americans and lowest in Latinos. The correlation (Pearson’s r) between TNEs and cigarettes per day ranged from 0.33 in Japanese Americans to 0.52 in Latinos (Table S1). TNEs were weakly associated with the proportion of CD4+ T cells, natural killer cells, monocytes, and neutrophils (Table S2).
Table 1.
Characteristics of the discovery and validation study cohorts
| Characteristic |
Discovery cohort (MEC) |
Validation cohorts (SCHS and SCCS) |
|||||||||
|---|---|---|---|---|---|---|---|---|---|---|---|
| African American | European American | Japanese American | Latino | Native Hawaiian | SCHS - Chinese - case | SCHS - Chinese - control | SCCS - African American - case | SCCS - African American - control | SCCS - European American - case | SCCS - European American - control | |
| N | 364 | 397 | 522 | 400 | 311 | 169 | 171 | 111 | 111 | 86 | 86 |
| Age at biospecimen collectiona | 64.8 (7.5) | 63.8 (7.4) | 63.8 (7.2) | 65.5 (6.3) | 61.3 (7.1) | 60.1 (6.2) | 60.1 (6.2) | 54.2 (7.7) | 53.5 (7.6) | 55.6 (7.3) | 55.0 (7.1) |
| Sex, N (%) | |||||||||||
| Male | 111 (30.5%) | 172 (43.3%) | 298 (57.1%) | 207 (51.7%) | 114 (36.7%) | 144 (85.2%) | 145 (84.8%) | 72 (64.9%) | 72 (64.9%) | 28 (32.6%) | 28 (32.6%) |
| Female | 253 (69.5%) | 225 (56.7%) | 224 (42.9%) | 193 (48.2%) | 197 (63.3%) | 25 (14.8%) | 26 (15.2%) | 39 (35.1%) | 39 (35.1%) | 58 (67.4%) | 58 (67.4%) |
| Urinary total nicotine equivalents (nmol/mL)a | 56.1 (41.7) | 45.7 (35.7) | 33.7 (23.9) | 42.0 (35.1) | 37.7 (27.8) | 34.8 (42.9) | 28.6 (32.8) | 82.3 (76.0) | 36.7 (31.3) | 67.8 (60.4) | 37.9 (37.3) |
| Cigarettes per daya,b | 11.2 (7.3) | 17.7 (11.4) | 14.2 (8.4) | 9.3 (7.1) | 15.2 (9.7) | 19.2 (10.8) | 16.0 (10.1) | 13.4 (8.0) | 10.3 (6.8) | 22.4 (11.7) | 17.3 (10.2) |
| Smoking pack-yearsa,b | 22.1 (15.9) | 36.7 (26.9) | 29.1 (18.6) | 19.0 (16.6) | 29.9 (21.4) | 38.9 (23.1) | 31.1 (21.4) | 25.3 (14.9) | 19.2 (15.1) | 45.2 (26.0) | 32.9 (19.4) |
| Cell type proportiona,c | |||||||||||
| B cells | 0.07 (0.03) | 0.05 (0.03) | 0.07 (0.03) | 0.06 (0.02) | 0.06 (0.03) | 0.07 (0.03) | 0.07 (0.03) | 0.07 (0.03) | 0.07 (0.03) | 0.06 (0.05) | 0.05 (0.02) |
| CD4+ T cells | 0.21 (0.07) | 0.19 (0.07) | 0.18 (0.06) | 0.18 (0.05) | 0.17 (0.05) | 0.17 (0.05) | 0.19 (0.05) | 0.16 (0.06) | 0.15 (0.05) | 0.13 (0.05) | 0.14 (0.05) |
| CD8+ T cells | 0.11 (0.05) | 0.08 (0.04) | 0.08 (0.04) | 0.10 (0.05) | 0.10 (0.04) | 0.09 (0.03) | 0.10 (0.03) | 0.09 (0.05) | 0.09 (0.04) | 0.06 (0.04) | 0.07 (0.04) |
| Monocytes | 0.08 (0.02) | 0.07 (0.02) | 0.06 (0.02) | 0.08 (0.02) | 0.06 (0.02) | 0.08 (0.02) | 0.08 (0.02) | 0.09 (0.03) | 0.10 (0.04) | 0.08 (0.03) | 0.08 (0.04) |
| Natural killer cells | 0.06 (0.03) | 0.06 (0.03) | 0.06 (0.03) | 0.06 (0.03) | 0.06 (0.03) | 0.06 (0.03) | 0.07 (0.03) | 0.06 (0.03) | 0.07 (0.03) | 0.06 (0.02) | 0.06 (0.02) |
| Neutrophils | 0.48 (0.11) | 0.57 (0.10) | 0.57 (0.10) | 0.55 (0.08) | 0.56 (0.09) | 0.52 (0.09) | 0.49 (0.09) | 0.53 (0.13) | 0.52 (0.11) | 0.62 (0.12) | 0.58 (0.10) |
Abbreviations: MEC, Multiethnic Cohort Study; SCHS, Singapore Chinese Health Study; SCCS, Southern Community Cohort Study.
Mean (standard deviation).
Self-reported measurement.
DNA methylation-based estimates of cell type proportions.
The validation cohorts consisted of 340 (169 cases, 171 controls) Chinese smokers from the SCHS and 222 (111 cases, 111 controls) African American and 172 (86 cases, 86 controls) European American smokers from the SCCS (Table 1). Urinary TNEs were generally lower among SCHS participants and SCCS controls and higher in SCCS cases. The mean cigarettes smoked per day and pack-years were lower among SCCS African Americans and higher for SCHS Chinese participants and SCCS European Americans (Table 1). TNEs were weakly correlated with cigarettes per day (Pearson’s r ranging from 0.17 to 0.31; Table S1) and weakly associated with the proportion of CD8+ T cells, CD4+ T cells, natural killer cells, and neutrophils (Table S2).
Discovery EWAS of TNEs
In our multiethnic discovery EWAS of urinary TNEs, we identified statistically significant associations for 408 CpG sites in or nearby more than 250 genomic regions (genome-wide significance threshold p < 9 × 10⁻⁸; Figures 1 and 2 and Table S3). Among these sites, 207 were previously present on the HM450K array and 201 were unique to the EPIC array. In addition, 85 (20.8%) of these sites were overlapping SNPs (at the same genomic coordinates) based on the EPIC annotation files from Illumina or Zhou et al.43 (in the overall population or population-specific [AFR, EAS, EUR, SAS, AMR] files; Table S4). However, we did not observe multimodal distributions of DNA methylation at these loci that would indicate that the variation is primarily driven by genetic polymorphisms. There was no evidence of genomic inflation (λ = 1.04).
Figure 2.

Manhattan plot of discovery meta-analysis EWAS of TNEs
Horizontal line indicates genome-wide significance threshold of p < 9 × 10⁻⁸. Blue dots represent decreasing DNA methylation with increasing TNEs, and red dots represent increasing DNA methylation with increasing TNEs. Only the top 10 significant hits are annotated.
For 369 (90%) of the 408 significant CpG sites, each one log-unit increase in TNEs was associated with decreasing levels of DNA methylation (average decrease in methylation β value ranging from 0.0016 to 0.0444 per log-unit increase in TNEs; Table S3). The top ten statistically significant probes were annotated to AHRR (cg05575921, cg23576855, cg21161138, cg26703534), F2RL3 (cg03636183), RARA (cg17739917), GPR15 (cg19859270), PRSS23 (cg14391737), and 2q37.1 (cg21566642, cg01940273), all of which had decreasing methylation with increasing TNEs. CpG sites in AHRR (cg05575921, cg23576855) had the most statistically significant associations and largest effect sizes, with an average 0.0425–0.0444 decrease in methylation β value per log-unit increase in TNEs (Table S3).
Among the 408 significant hits, 45 were novel CpG sites (42 unique to the EPIC array) that were not previously found to be associated with any measure of smoking (i.e., status, cigarettes per day, pack-years, cotinine) in prior studies identified from EWAS catalogs (i.e., EWAS Atlas44 and EWAS Catalog45) and the current literature (Table 2 and Figure 3). Increasing TNEs were inversely associated with DNA methylation at 39 of the 45 (86.7%) novel sites (average decrease in methylation β value ranging from 0.0035–0.0147 per log-unit increase in TNEs). The 45 novel sites were annotated to 39 unique genes, of which eight genes were not previously associated with smoking-related DNA methylation: MIR383;SGCZ, SVILP1, EDEM2, LINC01411, LINC01475, PIK3C2G, C16orf96, and CLDN11. The most significant hit among the novel genes was cg03748458 in MIR383;SGCZ. Across all 45 novel sites, the most significant CpG sites were in 17q21.32 (cg21901790), SLC28A1 (cg22548335), CXXC5 (cg10185953), and SPTBN1 (cg09465516).
Table 2.
45 novel differentially methylated loci associated with TNEs in the discovery meta-analysis
|
Discovery meta-analysis |
Validation meta-analysis |
||||||||
|---|---|---|---|---|---|---|---|---|---|
| Probe_ID | Chr | Mapinfoa | Gene | Estimateb | SE | p value | Estimateb | SE | p value |
| cg21901790 | 17 | 46599866 | 17q21.32 | −0.0065 | 0.0009 | 4.22 × 10⁻¹³ | −0.0048 | 0.0014 | 8.46 × 10⁻⁴ |
| cg22548335 | 15 | 85473388 | SLC28A1 | −0.0067 | 0.0010 | 2.33 × 10⁻¹² | −0.0033 | 0.0013 | 0.01 |
| cg10185953 | 5 | 139048784 | CXXC5 | −0.0072 | 0.0010 | 3.77 × 10⁻¹² | −0.0036 | 0.0018 | 0.04 |
| cg03748458 | 8 | 14711248 | MIR383;SGCZ | −0.0104 | 0.0016 | 2.09 × 10⁻¹¹ | −0.0060 | 0.0030 | 0.04 |
| cg09465516 | 2 | 54751985 | SPTBN1 | −0.0077 | 0.0012 | 3.14 × 10⁻¹¹ | −0.0027 | 0.0018 | 0.14 |
| cg19931745 | 10 | 30984844 | SVILP1 | −0.0068 | 0.0011 | 1.31 × 10⁻¹⁰ | −0.0022 | 0.0021 | 0.29 |
| cg13218707 | 11 | 118900557 | SLC37A4 | −0.0096 | 0.0015 | 3.08 × 10⁻¹⁰ | −0.0075 | 0.0028 | 7.52 × 10⁻³ |
| cg16788982 | 20 | 33733327 | EDEM2 | −0.0097 | 0.0015 | 3.42 × 10⁻¹⁰ | −0.0046 | 0.0020 | 0.02 |
| cg18921991 | 5 | 173910163 | LINC01411 | −0.0051 | 0.0008 | 1.17 × 10⁻⁹ | −0.0023 | 0.0012 | 0.06 |
| cg23203766 | 15 | 79270157 | RASGRF1 | −0.0050 | 0.0008 | 1.22 × 10⁻⁹ | −0.0033 | 0.0011 | 2.06 × 10⁻³ |
| cg17408993 | 12 | 65110360 | GNS | 0.0063 | 0.0010 | 1.39 × 10⁻⁹ | 0.0073 | 0.0019 | 1.47 × 10⁻⁴ |
| cg26540765 | 6 | 130065605 | 6q22.33 | −0.0050 | 0.0008 | 1.45 × 10⁻⁹ | −0.0018 | 0.0013 | 0.16 |
| cg16485845 | 8 | 141802466 | PTK2 | −0.0035 | 0.0006 | 2.05 × 10⁻⁹ | −0.0008 | 0.0009 | 0.38 |
| cg15755028 | 11 | 64074198 | ESRRA | −0.0048 | 0.0008 | 2.33 × 10⁻⁹ | −0.0022 | 0.0012 | 0.06 |
| cg23690488 | 2 | 114299609 | 2q13 | 0.0034 | 0.0006 | 4.95 × 10⁻⁹ | 0.0009 | 0.0008 | 0.25 |
| cg21594588 | 2 | 69869990 | AAK1 | 0.0019 | 0.0003 | 5.88 × 10⁻⁹ | 0.0018 | 0.0008 | 0.03 |
| cg07259245 | 10 | 101287322 | LINC01475 | −0.0062 | 0.0011 | 1.07 × 10⁻⁸ | −0.0037 | 0.0018 | 0.04 |
| cg03935228 | 7 | 104771546 | SRPK2 | −0.0035 | 0.0006 | 1.25 × 10⁻⁸ | −0.0011 | 0.0011 | 0.32 |
| cg01419727 | 5 | 131438977 | 5q31.1 | −0.0051 | 0.0009 | 1.39 × 10⁻⁸ | −0.0020 | 0.0014 | 0.17 |
| cg07093667 | 10 | 23652849 | 10p12.2 | −0.0040 | 0.0007 | 1.42 × 10⁻⁸ | −0.0009 | 0.0012 | 0.47 |
| cg22260008 | 7 | 27207318 | HOXA10-AS; HOXA10-HOXA9 | −0.0050 | 0.0009 | 1.45 × 10⁻⁸ | −0.0014 | 0.0015 | 0.34 |
| cg05889768 | 10 | 13143286 | OPTN | −0.0051 | 0.0009 | 1.70 × 10⁻⁸ | −0.0040 | 0.0014 | 3.96 × 10⁻³ |
| cg06446365 | 5 | 176729812 | RAB24;PRELID1 | −0.0057 | 0.0010 | 1.89 × 10⁻⁸ | −0.0025 | 0.0019 | 0.18 |
| cg17141212 | 7 | 99718026 | TAF6;CNPY4 | −0.0065 | 0.0012 | 2.26 × 10⁻⁸ | −0.0043 | 0.0019 | 0.02 |
| cg04233381 | 11 | 126243896 | ST3GAL4 | −0.0043 | 0.0008 | 2.61 × 10⁻⁸ | −0.0011 | 0.0012 | 0.36 |
| cg06538881 | 11 | 3011050 | NAP1L4 | −0.0087 | 0.0016 | 2.61 × 10⁻⁸ | −0.0052 | 0.0029 | 0.07 |
| cg02294028 | 7 | 114564373 | MDFIC | −0.0147 | 0.0026 | 2.64 × 10⁻⁸ | 0.0016 | 0.0056 | 0.77 |
| cg01036611 | 17 | 2169272 | SMG6 | −0.0054 | 0.0010 | 2.90 × 10⁻⁸ | −0.0013 | 0.0014 | 0.34 |
| cg04878685 | 12 | 18584312 | PIK3C2G | −0.0045 | 0.0008 | 3.03 × 10⁻⁸ | −0.0020 | 0.0014 | 0.17 |
| cg21971539 | 14 | 39734390 | CTAGE5 | 0.0043 | 0.0008 | 3.09 × 10⁻⁸ | 0.0035 | 0.0013 | 8.81 × 10⁻³ |
| cg19716697 | 8 | 144449916 | RHPN1-AS1;RHPN1 | −0.0047 | 0.0009 | 3.62 × 10⁻⁸ | −0.0017 | 0.0016 | 0.30 |
| cg00172979 | 19 | 19549603 | GATAD2A | −0.0050 | 0.0009 | 3.98 × 10⁻⁸ | 0.0005 | 0.0014 | 0.71 |
| cg08565919 | 16 | 4625419 | C16orf96 | 0.0041 | 0.0008 | 4.05 × 10⁻⁸ | −0.0001 | 0.0011 | 0.90 |
| cg14691266 | 14 | 102277400 | PPP2R5C | −0.0067 | 0.0012 | 4.21 × 10⁻⁸ | −0.0040 | 0.0025 | 0.12 |
| cg10375645 | 16 | 20687193 | ACSM1 | 0.0040 | 0.0007 | 4.26 × 10⁻⁸ | 0.0011 | 0.0012 | 0.35 |
| cg26739807 | 17 | 49244797 | NME2;NME1-NME2 | −0.0076 | 0.0014 | 4.56 × 10⁻⁸ | −0.0031 | 0.0020 | 0.11 |
| cg10711136 | 11 | 86515053 | PRSS23 | −0.0065 | 0.0012 | 4.81 × 10⁻⁸ | −0.0084 | 0.0020 | 1.81 × 10⁻⁵ |
| cg25635022 | 3 | 170147199 | CLDN11 | −0.0048 | 0.0009 | 5.14 × 10⁻⁸ | −0.0039 | 0.0013 | 2.81 × 10⁻³ |
| cg07815896 | 15 | 40385132 | BMF | −0.0045 | 0.0008 | 5.45 × 10⁻⁸ | 0.0002 | 0.0015 | 0.91 |
| cg14732445 | 14 | 61870472 | PRKCH | −0.0051 | 0.0009 | 5.47 × 10⁻⁸ | −0.0004 | 0.0016 | 0.81 |
| cg20404288 | 3 | 194023890 | LINC00887 | −0.0043 | 0.0008 | 5.92 × 10⁻⁸ | −0.0016 | 0.0012 | 0.18 |
| cg03026982 | 11 | 19953699 | NAV2 | −0.0057 | 0.0011 | 7.72 × 10⁻⁸ | −0.0035 | 0.0017 | 0.03 |
| cg23644132 | 11 | 3010640 | NAP1L4 | −0.0049 | 0.0009 | 8.40 × 10⁻⁸ | −0.0028 | 0.0017 | 0.09 |
| cg05422344 | 11 | 114033783 | ZBTB16 | −0.0062 | 0.0012 | 8.51 × 10⁻⁸ | −0.0004 | 0.0019 | 0.82 |
| cg08607482 | 15 | 75092823 | CSK | −0.0044 | 0.0008 | 8.62 × 10⁻⁸ | −0.0029 | 0.0014 | 0.04 |
Discovery genome-wide significance threshold: p < 9 × 10⁻⁸.
Validation Bonferroni-corrected significance threshold: p < 1.23 × 10⁻⁴ (p = 0.05/408).
Results are ordered by statistical significance in the discovery meta-analysis.
Chromosomal coordinates based on GRCh37.
Parameter estimate representing the change in methylation β value per one log-unit increase in TNEs.
Figure 3.

Circular genomics plot of 408 significant hits in the discovery EWAS of TNEs, annotated with novel hits
Starting from the most outer ring, first ring is chromosome, second ring is position on chromosome, and third ring is the discovery phase parameter estimate (axis range from −0.05 to 0.05 with horizontal line representing 0). In the third ring, triangles away from the center indicate increasing methylation with increasing TNEs (parameter estimate >0), and circles closer to the center indicate decreasing methylation with increasing TNEs (parameter estimate <0); black indicates known smoking-related hits, orange indicates novel associations. Only the novel hits are annotated.
In the sensitivity analyses adjusting for cigarettes per day, pack-years, and education, the parameter estimates were in the same direction and had very similar magnitude compared to the original models (Table S5). In contrast, the creatinine-adjusted results were more significant than the original results. Across the discovery TNE EWAS and the four sensitivity analyses, the top associations were the same top sites in the primary TNE analysis (e.g., sites annotated to AHRR, F2RL3, RARA, etc.).
Replication of significant TNE hits
In the validation phase meta-analysis, 51 out of 408 significant CpG sites were replicated in the SCHS and SCCS at a Bonferroni-corrected threshold of p < 1.23 × 10⁻⁴ (Figures 1 and 4 and Tables 3 and S6). Increasing TNEs were associated with decreasing DNA methylation levels at nearly all (50 out of 51) of these replicated probes (average decrease in methylation β value ranging from 0.0015–0.0216 per log-unit increase in TNEs). The most statistically significant replicated hits included established smoking-related CpG sites in F2RL3 (cg03636183) and AHRR (cg05575921, cg25648203, cg23576855), as well as fewer reported smoking CpG sites in RARA (cg17739917), CRTC2 (cg22441770), MGAT3 (cg05086879), F2RL3 (cg21911711), 3q11.2 (cg04180924), and 12p13.32 (cg09842685) (Table 3). Furthermore, the parameter estimates for the replicated sites in the validation phase were in the same direction and of very similar magnitude compared to the estimates in the discovery phase. At a more relaxed significance threshold of p < 0.01, 120 additional hits (171 total) were replicated in the SCHS and SCCS, with parameter estimates in the same direction and of similar magnitude as those in the discovery cohort (Table S6).
Figure 4.

Circular genomics plot of 408 significant hits in the discovery EWAS of TNEs and 51 significant hits in the validation analyses, annotated with replicated hits
Starting from the most outer ring, first ring is chromosome, second ring is position on chromosome, third ring is the discovery phase parameter estimate, and fourth ring is the validation phase parameter estimate (axis range from −0.05 to 0.05 with horizontal line representing 0). In the third and fourth rings, triangles away from the center indicate increasing methylation with increasing TNEs (parameter estimate >0), and circles closer to the center indicate decreasing methylation with increasing TNEs (parameter estimate <0); black indicates known smoking-related hits, orange indicates novel associations. Only the replicated hits are annotated.
Table 3.
51 differentially methylated loci associated with TNEs in the discovery meta-analysis that were replicated in the validation meta-analysis
|
Discovery meta-analysis |
Validation meta-analysis |
||||||||
|---|---|---|---|---|---|---|---|---|---|
| Probe_ID | Chr | Mapinfoa | Gene | Estimateb | SE | p value | Estimateb | SE | p value |
| cg05575921 | 5 | 373378 | AHRR | −0.0425 | 0.0022 | 1.52 × 10−84 | −0.0200 | 0.0033 | 9.90 × 10⁻¹⁰ |
| cg23576855 | 5 | 373299 | AHRR | −0.0444 | 0.0030 | 1.82 × 10−50 | −0.0216 | 0.0044 | 7.72 × 10⁻⁷ |
| cg03636183 | 19 | 17000585 | F2RL3 | −0.0276 | 0.0019 | 8.49 × 10−48 | −0.0182 | 0.0027 | 1.60 × 10⁻¹¹ |
| cg17739917 | 17 | 38477572 | RARA | −0.0205 | 0.0015 | 2.50 × 10−44 | −0.0163 | 0.0028 | 4.22 × 10⁻⁹ |
| cg21161138 | 5 | 399360 | AHRR | −0.0156 | 0.0011 | 2.99 × 10−43 | −0.0086 | 0.0018 | 1.99 × 10⁻⁶ |
| cg19859270 | 3 | 98251294 | GPR15 | −0.0053 | 0.0004 | 3.80 × 10−41 | −0.0031 | 0.0007 | 8.45 × 10⁻⁶ |
| cg01940273 | 2 | 233284934 | 2q37.1 | −0.0165 | 0.0012 | 6.41 × 10−40 | −0.0076 | 0.0020 | 9.17 × 10⁻⁵ |
| cg26703534 | 5 | 377358 | AHRR | −0.0118 | 0.0009 | 4.74 × 10−38 | −0.0072 | 0.0017 | 2.22 × 10⁻⁵ |
| cg25845814 | 14 | 74224613 | MIR4505;ELMSAN1 | −0.0074 | 0.0006 | 4.93 × 10−36 | −0.0053 | 0.0011 | 1.46 × 10⁻⁶ |
| cg25648203 | 5 | 395444 | AHRR | −0.0117 | 0.0010 | 2.79 × 10⁻³⁰ | −0.0084 | 0.0017 | 7.23 × 10⁻⁷ |
| cg02978227 | 3 | 98292027 | 3q11.2 | −0.0055 | 0.0005 | 2.45 × 10⁻²⁹ | −0.0032 | 0.0007 | 6.90 × 10⁻⁶ |
| cg03329539 | 2 | 233283329 | 2q37.1 | −0.0116 | 0.0011 | 3.22 × 10⁻²⁶ | −0.0085 | 0.0019 | 9.88 × 10⁻⁶ |
| cg07741821 | 7 | 26577897 | KIAA0087 | −0.0130 | 0.0012 | 8.25 × 10⁻²⁶ | −0.0077 | 0.0019 | 7.00 × 10⁻⁵ |
| cg05086879 | 22 | 39861490 | MGAT3 | −0.0099 | 0.0010 | 2.26 × 10⁻²⁵ | −0.0079 | 0.0015 | 1.97 × 10⁻⁷ |
| cg21911711 | 19 | 16998668 | F2RL3 | −0.0115 | 0.0012 | 3.39 × 10⁻²² | −0.0104 | 0.0021 | 7.55 × 10⁻⁷ |
| cg16841366 | 2 | 233286192 | 2q37.1 | −0.0233 | 0.0024 | 5.90 × 10⁻²² | −0.0126 | 0.0032 | 9.52 × 10⁻⁵ |
| cg02657160 | 3 | 98311063 | CPOX | −0.0049 | 0.0005 | 1.29 × 10⁻²⁰ | −0.0035 | 0.0009 | 5.29 × 10⁻⁵ |
| cg26768182 | 9 | 134272679 | 9q34.13 | −0.0061 | 0.0007 | 3.47 × 10⁻²⁰ | −0.0049 | 0.0012 | 6.50 × 10⁻⁵ |
| cg09935388 | 1 | 92947588 | GFI1 | −0.0212 | 0.0023 | 3.48 × 10⁻²⁰ | −0.0156 | 0.0032 | 1.12 × 10⁻⁶ |
| cg23161492 | 15 | 90357202 | ANPEP | −0.0145 | 0.0016 | 9.59 × 10⁻¹⁹ | −0.0108 | 0.0024 | 9.10 × 10⁻⁶ |
| cg11660018 | 11 | 86510915 | PRSS23 | −0.0106 | 0.0012 | 3.89 × 10⁻¹⁸ | −0.0084 | 0.0019 | 1.52 × 10⁻⁵ |
| cg04180924 | 3 | 98272064 | 3q11.2 | −0.0026 | 0.0003 | 4.44 × 10⁻¹⁸ | −0.0027 | 0.0005 | 1.09 × 10⁻⁸ |
| cg22812571 | 2 | 233286229 | 2q37.1 | −0.0181 | 0.0021 | 7.59 × 10⁻¹⁸ | −0.0131 | 0.0028 | 3.91 × 10⁻⁶ |
| cg12876356 | 1 | 92946825 | GFI1 | −0.0117 | 0.0014 | 1.92 × 10⁻¹⁶ | −0.0063 | 0.0015 | 3.14 × 10⁻⁵ |
| cg22675726 | 18 | 3179889 | MYOM1 | −0.0139 | 0.0017 | 5.23 × 10⁻¹⁶ | −0.0144 | 0.0035 | 3.43 × 10⁻⁵ |
| cg04551776 | 5 | 393366 | AHRR | −0.0065 | 0.0008 | 2.75 × 10⁻¹⁵ | −0.0048 | 0.0012 | 1.09 × 10⁻⁴ |
| cg10765427 | 19 | 17005225 | CPAMD8 | −0.0058 | 0.0007 | 1.25 × 10⁻¹⁴ | −0.0046 | 0.0011 | 4.87 × 10⁻⁵ |
| cg23079012 | 2 | 8343710 | 2p25.1 | −0.0070 | 0.0009 | 2.47 × 10⁻¹⁴ | −0.0031 | 0.0007 | 2.91 × 10⁻⁵ |
| cg15159987 | 19 | 17003890 | CPAMD8 | −0.0067 | 0.0009 | 2.49 × 10⁻¹⁴ | −0.0060 | 0.0012 | 1.76 × 10⁻⁶ |
| cg14466441 | 6 | 11392193 | 6p24.2 | −0.0047 | 0.0006 | 4.30 × 10⁻¹⁴ | −0.0041 | 0.0009 | 1.20 × 10⁻⁵ |
| cg25061445 | 15 | 57912784 | GCOM1;MYZAP | −0.0099 | 0.0014 | 2.68 × 10⁻¹³ | −0.0102 | 0.0025 | 6.09 × 10⁻⁵ |
| cg06035956 | 5 | 379099 | AHRR | −0.0016 | 0.0002 | 4.27 × 10⁻¹³ | −0.0015 | 0.0004 | 7.80 × 10⁻⁵ |
| cg22441770 | 1 | 153929592 | CRTC2 | −0.0049 | 0.0007 | 1.18 × 10⁻¹¹ | −0.0056 | 0.0011 | 6.28 × 10⁻⁷ |
| cg09098393 | 8 | 55423202 | 8q11.23 | −0.0099 | 0.0015 | 3.26 × 10⁻¹¹ | −0.0116 | 0.0028 | 2.92 × 10⁻⁵ |
| cg07390844 | 18 | 72935911 | TSHZ1 | −0.0095 | 0.0014 | 5.29 × 10⁻¹¹ | −0.0093 | 0.0024 | 9.34 × 10⁻⁵ |
| cg09842685 | 12 | 4492769 | 12p13.32 | −0.0065 | 0.001 | 1.36 × 10⁻¹⁰ | −0.0084 | 0.0014 | 2.01 × 10⁻⁹ |
| cg20684110 | 10 | 64565750 | ADO | −0.008 | 0.0013 | 4.00 × 10⁻¹⁰ | −0.0071 | 0.0017 | 1.91 × 10⁻⁵ |
| cg13849276 | 17 | 41328544 | NBR1 | −0.0111 | 0.0018 | 7.79 × 10⁻¹⁰ | −0.0096 | 0.0023 | 3.74 × 10⁻⁵ |
| cg23110422 | 21 | 40182073 | ETS2 | −0.0055 | 0.0009 | 7.82 × 10⁻¹⁰ | −0.0065 | 0.0014 | 3.93 × 10⁻⁶ |
| cg13177778 | 11 | 92900159 | SLC36A4 | −0.0084 | 0.0014 | 1.80 × 10⁻⁹ | −0.009 | 0.0022 | 3.82 × 10⁻⁵ |
| cg01005506 | 10 | 64565768 | ADO | −0.0071 | 0.0012 | 9.35 × 10⁻⁹ | −0.0076 | 0.002 | 1.16 × 10⁻⁴ |
| cg26237233 | 11 | 80782064 | 11q14.1 | −0.0057 | 0.001 | 9.40 × 10⁻⁹ | −0.0064 | 0.0015 | 1.36 × 10⁻⁵ |
| cg11931220 | 12 | 49276387 | 12q13.12 | −0.0069 | 0.0012 | 1.16 × 10⁻⁸ | −0.008 | 0.0019 | 2.23 × 10⁻⁵ |
| cg10062919 | 17 | 38503802 | RARA | −0.0034 | 0.0006 | 1.55 × 10⁻⁸ | −0.0035 | 0.0008 | 2.02 × 10⁻⁵ |
| cg15829114 | 14 | 53617878 | DDHD1 | −0.0054 | 0.001 | 1.66 × 10⁻⁸ | −0.0049 | 0.0012 | 7.00 × 10⁻⁵ |
| cg07978331 | 16 | 75046041 | ZNRF1 | −0.0073 | 0.0013 | 1.96 × 10⁻⁸ | −0.0079 | 0.0019 | 1.96 × 10⁻⁵ |
| cg05753553 | 17 | 2689486 | 17p13.3 | 0.0058 | 0.0011 | 3.02 × 10⁻⁸ | 0.0076 | 0.0017 | 5.57 × 10⁻⁶ |
| cg01481251 | 11 | 32912719 | 11p13 | −0.0045 | 0.0008 | 3.57 × 10⁻⁸ | −0.0051 | 0.0011 | 4.55 × 10⁻⁶ |
| cg17547179 | 7 | 45068955 | CCM2 | −0.0049 | 0.0009 | 3.67 × 10⁻⁸ | −0.0059 | 0.0014 | 1.94 × 10⁻⁵ |
| cg14034325 | 10 | 43891459 | HNRNPF | −0.0076 | 0.0014 | 4.74 × 10⁻⁸ | −0.0078 | 0.002 | 8.47 × 10⁻⁵ |
| cg10711136 | 11 | 86515053 | PRSS23 | −0.0065 | 0.0012 | 4.81 × 10⁻⁸ | −0.0084 | 0.002 | 1.81 × 10⁻⁵ |
Discovery genome-wide significance threshold: p < 9 × 10⁻⁸.
Validation Bonferroni-corrected significance threshold: p < 1.23 × 10⁻⁴ (p = 0.05/408).
Results are ordered by statistical significance in the discovery meta-analysis.
Chromosomal coordinates based on GRCh37.
Parameter estimate representing the change in methylation β value per one log-unit increase in TNEs.
Similar to the sensitivity analyses of our discovery findings, further adjustment for pack-years, cigarettes per day, or education did not make much difference in either the direction or strength of the parameter estimates for the 51 replicated CpG hits, while the creatinine-adjusted results were more significant than the original results (Table S7).
Of the 45 novel hits identified in the discovery phase, only cg10711136 in PRSS23 was replicated in the SCHS and SCCS at a Bonferroni-corrected threshold of p < 1.23 × 10⁻⁴ (Table 2). Seven other novel hits replicated at a more relaxed threshold of p < 0.01, including cg17408993 in GNS, cg21901790 in 17q21.32, cg23203766 in RASGRF1, cg25635022 in CLDN11, cg05889768 in OPTN, cg13218707 in SLC37A4, and cg21971539 in CTAGE5. The effect sizes for most of the novel CpG sites (39 out of 45) were in the same direction and attenuated in the validation phase compared to the discovery phase. Only the top two replicated novel CpG sites (cg10711136 in PRSS23 and cg17408993 in GNS) had stronger effect sizes in the validation phase. In general, the standard errors were larger in the validation phase, and most sites had overlapping 95% confidence intervals (CIs) in the parameter estimates across the discovery and validation phases (Table 2 and Figure S3).
Results were fairly consistent when using only SCHS/SCCS non-lung cancer controls compared to using all cases and controls as the validation cohort. The parameter estimates were in the same direction and of similar magnitude with overlapping 95% CIs across the two validation sets (Table S8).
Race- and ethnicity-specific and sex-specific hits
In the five race- and ethnicity-specific discovery EWASs, TNEs were associated (genome-wide significance threshold p < 9 × 10⁻⁸) with differential methylation in four CpG sites in African Americans, 21 sites in European Americans, 38 sites in Japanese Americans, 37 sites in Latinos, and three sites in Native Hawaiians (67 unique CpG sites across the five EWASs; Figure S4 and Table S9). Most of these sites (63 out of 67) had effect estimates in the same direction across all racial and ethnic groups and were also statistically significant in the meta-analysis of the five groups (Table S9). CpG sites in AHRR (cg05575921, cg23576855, cg26703534) were among the top associations across all racial and ethnic groups.
For the four significant CpG sites in the MEC African Americans, none were replicated in the SCCS African American cases, and two were replicated in the SCCS African American controls (p < 0.05). For the 21 significant CpG sites in the MEC European Americans, one was replicated in the SCCS European American cases, and six were replicated in the SCCS European American controls (p < 0.05). For the 38 significant CpG sites in the MEC Japanese Americans, 18 were replicated in the SCHS Chinese cases, and 24 were replicated in the SCHS Chinese controls (p < 0.05) (Table S9).
Of the CpG sites that were significant in the discovery meta-analysis or in any of the race- and ethnicity-specific discovery EWASs (total 412 CpG sites), two CpG sites exhibited significant heterogeneity by race and ethnicity in the MEC: cg12803068 in an intron of MYO1G and cg18364453 in an intron of CYTH1. For cg12803068 in MYO1G, the relationship between TNEs and DNA methylation was strongest in Latinos. Each log-unit increase in TNEs was associated with significant average increases in methylation β value of 0.032 for Latinos, 0.018 for European Americans, 0.014 in Japanese Americans, and non-significant average increases of 0.005 in African Americans and 0.004 in Native Hawaiians (I2 = 85%, phet = 2.65 × 10⁻⁵; Figure S5 and Table S9). In the validation cohorts, the association between TNEs and methylation at this locus was similar. However, due to the lack of Hispanic/Latino participants in the SCHS and SCCS, we could not validate the race- and ethnicity-specific strength of this association.
For cg18364453 in CYTH1, TNEs were significantly associated with increased DNA methylation in African Americans but not in the other racial and ethnic groups in the MEC (I2 = 85%, phet = 2.31 × 10⁻⁵; Figure S6 and Table S9). Though this locus did not reach genome-wide significance in the meta-analysis of the five racial and ethnic groups (p = 0.02), it was the fourth most statistically significant hit in the African American-specific EWAS of TNEs (average 0.014 increase in methylation β value per log-unit increase of TNEs; p = 4.90 × 10⁻⁸). This association was also replicated in the SCCS African Americans controls (average 0.025 increase in methylation β value per log-unit increase of TNEs; p = 0.003) but not in the SCCS African American cases.
Additionally, we observed heterogeneity by sex for two CpG sites in TSHR (cg13525276, cg18625627) (Figures S7 and S8). For both sites, each log-unit increase in TNEs was associated with an average 0.014 increase in DNA methylation β value for females and an average 0.003–0.004 increase in DNA methylation β value in males (I2 = 95%, phet = 4.59 × 10⁻⁶ for cg13525276; I2 = 94%, phet = 2.04 × 10⁻⁵ for cg18625627). However, this association did not replicate in the validation cohorts.
Internal vs. self-reported smoking dose
In the discovery EWAS of cigarettes per day, we identified statistically significant associations for 362 CpG sites (Figure S9 and Table S10). The top hits (e.g., sites in AHRR, F2RL3, RARA, GPR15, and 2q37.1) were very similar in significance and magnitude of effect as in the discovery EWAS of TNEs. None of the 362 significant CpG sites were replicated in the validation cohorts at a Bonferroni-corrected threshold of p < 1.38 × 10⁻⁴, but 32 were replicated at a relaxed significance threshold of p < 0.01 (Table S10).
There were 569 CpG sites that were significant in either the discovery EWAS of TNEs or discovery EWAS of cigarettes per day: 207 were associated with TNEs only, 161 were associated with cigarettes per day only, and 201 were associated with both TNEs and cigarettes per day (Table S11). Of the 201 overlapping sites, the strength of association (as indicated by the absolute value of the Z score) was greater for TNEs for a majority of the sites (135 out of 201), particularly those in AHRR, 2q37.1, GNG7, and ANPEP (Figure S10 and Table S11). In general, the parameter estimates for the models with cigarettes per day as the primary exposure were in the same direction and had very similar magnitude compared to the models with TNEs as the primary exposure (Table S11).
In the mediation analysis, we observed that TNEs significantly mediated the association between cigarettes per day and DNA methylation at 15 CpG sites (Table S12). The most significant finding was observed for cg05575921 in AHRR, in which TNEs mediated 28.1% of the effect between cigarettes per day and DNA methylation. Across all sites with significant mediation, the proportion mediated ranged from 22.5% for cg03636183 in F2RL3 to 43.3% for cg23161492 in ANPEP.
Discussion
In this study, we performed an EWAS of internal smoking dose, as measured by urinary TNEs, in six distinct racial and ethnic groups across three prospective cohorts. In the discovery phase in the MEC, we observed that TNEs were significantly associated with differential DNA methylation at 408 CpG sites (genome-wide p < 9 × 10⁻⁸), of which 45 were novel sites (defined as not previously associated with any measure of smoking [e.g., status, cigarettes per day, pack-years, cotinine] in prior literature). The 45 novel CpG sites were annotated to 39 genes, eight of which were not previously linked to smoking-related differential methylation. In the validation phase, we were able to replicate 51 out of the 408 discovery EWAS hits in the SCHS and SCCS (Bonferroni p < 1.23 × 10⁻⁴), of which one was a novel hit (cg10711136 in PRSS23). We also identified significant heterogeneity by race and ethnicity for cg12803068 in MYO1G, which had a stronger association in Latinos, and cg18364453 in CYTH1, which had a stronger association in African Americans. Moreover, we observed that the associations for two CpG sites in TSHR (cg13525276, cg18625627) were stronger in females.
TNEs and DNA methylation were inversely associated at a majority (90%) of the 408 discovery CpG sites. Many prior EWASs of self-reported smoking have also detected a large proportion of inverse associations, particularly recent studies using the EPIC array where current smoking was associated with decreased methylation at 74%–96% of the significant hits.6,7,8,46 In contrast, the largest EWAS of self-reported smoking using the HM450k array observed that only about half of the significant sites were inversely associated with current smoking.5 Of note, when comparing the associations for our 408 discovery TNE hits with results from past EWASs of self-reported smoking, nearly all the overlapping sites (>99%) had the same direction of effect across all studies.
The top significant CpG sites in the discovery EWAS included known smoking-related CpG sites in AHRR, F2RL3, RARA, GPR15, PRSS23, and 2q37.1.4,5 The inverse association between TNEs and DNA methylation at these sites was present across all racial and ethnic groups in the MEC, illustrating the generalizability of these epigenetic associations with smoking dose. Additionally, our mediation analysis showed that for five of the top ten discovery EWAS hits (e.g., sites in AHRR, GPR15, and 2q37.1), the smoking-related effects are in part mediated through TNEs. This suggests that TNEs may provide further insight into smoking-related mechanisms and that additional components of smoking may influence DNA methylation levels beyond what is captured by TNEs.
Moreover, most of the replicated CpG sites (50 out of 51) in the SCHS/SCCS were ones that were previously associated with smoking measures in prior literature. The only replicated novel CpG site was cg10711136 in PRSS23, which is in close proximity (within 1.6–4.1 kb) to other sites in PRSS23 (cg14391737, cg11660018, cg00475490, cg23771366) that were associated with TNEs in our EWAS and have been associated with smoking and lung cancer in past studies.4,5,6,7,46,47,48 The lack of replication for the novel hits could be explained by the attenuated effect sizes for many of these sites in the validation cohort. Additionally, the larger standard errors for the estimates in the validation phase suggest that the low rate of replication could be attributed to the smaller sample size of the SCHS/SCCS compared to the MEC.
In the discovery EWAS, the strongest signal on a novel gene was cg03748458 in MIR383;SGCZ, which had an inverse association with TNEs. MIR383, located in the intron of SGCZ, encodes for microRNA-383 (miR-383), which operates as a tumor inhibitor miRNA in many types of cancer.49 The expression of this gene has been observed to be downregulated in non-small cell lung cancer,50 but no prior study has reported associations between DNA methylation of this gene and smoking or lung cancer risk. Cg03748458 in MIR383;SGCZ has also been associated with chronic obstructive pulmonary disease (COPD), a smoking-related disease, in a recent analysis of 18,000 Scottish adults from the Generation Scotland cohort.51
Besides cg03748458 in MIR383;SGCZ, the other top novel CpG sites were in 17q21.32 (cg21901790), SLC28A1 (cg22548335), and CXXC5 (cg10185953), all of which had an inverse association with TNEs. While these CpG sites were not included in the older HM450k array, DNA methylation at nearby CpG loci and expression of proximate genes have been associated with smoking and cancer risk. Cg21901790 in 17q21.32 was also inversely associated with lung cancer in two prior studies: the aforementioned analysis in the Generation Scotland cohort (with 168 lung cancer cases)51 as well as in a nested case-control of 140 lung cancer cases and 140 controls from the Trøndelag Health Study (HUNT; a population-based survey of adults aged ≥20 in Trøndelag, Norway).46 Furthermore, cg21901790 is 6.9 kb upstream of HOXB1, which encodes for transcription factors involved in morphogenesis and has been associated with the proliferation of lung cancer cells.52 SLC28A1, which encodes for a transmembrane transporter, has been observed to have increased expression in the lungs of former smokers with COPD.53 Another CpG site in SLC28A1 (cg24945881), which is 15.5 kb downstream of cg22548335, was also inversely associated with prenatal smoke exposure in two prior studies47,54 but was not associated with TNEs in our present study. CXXC5 encodes for a transcription factor involved in myelopoiesis and p53 tumor suppressor activation. The aberrant expression of CXXC5 has been linked with tumorigenesis.55 In past epigenetic studies of smoking status using the HM450k array conducted in mostly populations of European ancestry, multiple CpG sites in CXXC5 (cg18814344, cg04104695, cg03992638, cg16360310, cg06053376) within 6.3–12.2 kb from cg10185953 were positively associated with current smoking.5,47,56 These particular CpG sites were not associated with TNEs in our current study (p > 0.1 for all sites).
In our discovery EWAS, we observed that TNEs had a greater positive effect on DNA methylation levels among Latinos at cg12803068 in MYO1G, which encodes for a plasma membrane-associated class I myosin. While we could not validate this effect in other Latino populations, the Multi-Ethnic Study of Atherosclerosis (MESA), which is 35% Hispanic, 45% European American, and 21% African American, found that cg12803068 was also significantly positively associated with cotinine (p = 7.31 × 10⁻¹³).12
Moreover, cg18364453 in CYTH1 was significantly positively associated with TNEs only among African Americans in the MEC and SCCS, suggesting that this CpG site may be impacted by smoking dose in only African Americans. Cg18364453 is a new CpG probe on the EPIC array and has not been reported in other epigenetic studies of smoking phenotypes. CYTH1 encodes for a cytohesin that mediates the regulation of protein sorting and membrane trafficking. Prior EWASs of smoking status, dose, or lung cancer with African Americans in the study population did not detect this association. The MESA cohort, which includes 21% African Americans, found a significant positive association between cotinine and another CpG site on CYTH1 (cg07823562; p = 3.28 × 10⁻⁷), which is 5.5 kb downstream of cg18364453.12 Our findings, in conjunction with that from MESA, suggest that this genomic region could be impacted by smoking dose in populations of African ancestry.
Two CpG sites in TSHR (cg13525276, cg18625627) had stronger associations in females than males in the discovery EWAS, but this was not replicated in the validation cohorts. Mutations and high expression of TSHR, which encodes for the thyroid-stimulating hormone receptor, have been involved in thyroid cancer risk and tumor proliferation.57,58 While both of these CpG sites were associated with smoking in prior reports,5,7,47,48,59 their effects across sex were not assessed.
Our study has several notable strengths. First, our discovery and replication cohorts included six different racial and ethnic groups from three large population-based prospective cohorts, making this a quite diverse investigation of smoking dose and DNA methylation. The identification of transethnic associations of smoking-related epigenetic sites is novel for racial and ethnic groups underrepresented in epigenetic research and allows us to directly assess the generalizability of prior findings while also validating potential race- and ethnicity-specific hits. Our study was also able to account for the effect of urinary TNEs independent of self-reported cumulative smoking exposure and dose by further adjusting for self-reported pack-years and cigarettes per day, respectively. Lastly, we were able to investigate differences in epigenetic associations for both internal smoking dose, as measured by urinary TNEs, and self-reported smoking dose, as measured through cigarettes per day.
However, our investigation has a number of limitations. As this was a cross-sectional sample and urine and blood samples were collected in close proximity, we could not assess temporality between TNEs and DNA methylation. Though TNEs are a more reliable marker of nicotine uptake, they are still short-term biomarkers and only measured at a single time point; therefore, our measurement does not fully capture smoking history but rather recent smoking intensity at the time of sample collection. There were also different urine collection methods across cohorts, which was addressed in sensitivity analyses adjusting for creatinine. The creatinine-adjusted associations were found to be of greater statistical significance, suggesting that they may, in part, correct for variations of analyte concentration in urine. However, as creatinine is also associated with other covariates already in the model, including age, sex, and race and ethnicity, this adjustment was not included in the primary analysis. In addition, we evaluated DNA methylation in peripheral blood leukocytes, which may be used as a marker of risk but is not the target tissue and, thus, may not reflect mechanisms for lung cancer. Nevertheless, there is emerging evidence that well-established smoking-related CpG loci found in blood (e.g., cg05575921 and cg21161138 in AHRR, cg21566642 in 2q37.1) are also replicated in lung tissue.60,61 The evaluation of the relationship between these TNE-associated CpG sites and lung cancer risk in our data is currently in progress. Lastly, while we had data from two other prospective cohorts for validation, we could not pursue replication for all racial and ethnic groups in the MEC, such as Latinos and Native Hawaiians.
In this multiethnic EWAS of TNEs, we were able to demonstrate the transethnic effect of internal smoking dose on many known smoking-related CpG sites as well as identify 45 novel CpG sites not previously associated with various measures of smoking. We also observed potential heterogeneous effects across race and ethnicity and sex, suggesting that smoking may impact epigenetic modification differently across these subgroups. Additional investigations in diverse populations are warranted to validate these findings and further clarify how epigenetics may contribute to the known racial and ethnic disparities in smoking-related lung cancer risk.
Data and code availability
The data generated as part of this study was funded by the NIH and will be shared in accordance with the NIH Genomic Data Sharing policies via the database of Genotypes and Phenotypes (dbGaP). Summary statistics from the discovery EWAS are available at https://doi.org/10.6084/m9.figshare.c.6905236.v1.
Acknowledgments
This work was supported by the National Institutes of Health/National Cancer Institute (NIH/NCI) (P01CA138338). The MEC was supported by U01CA164973. Additional funding for B.Z.H. was supported by T32CA229110, K99CA256525, and R00CA256525. The SCHS was supported by R01CA129534, R01CA144034, and UM1CA182876. The SCCS was supported by U01CA202979 and R01CA092447. The SCCS data collection and sample preparation were performed by the Survey and Biospecimen Shared Resource, which is supported in part by the Vanderbilt-Ingram Cancer Center (P30CA068485). The EPIC methylation analysis was performed by the Genomics and Bioinformatics Shared Resource (RRID: SCR_019085), which is supported in part by the University of Hawaii Cancer Center grant (P30CA071789). The content is solely the responsibility of the authors and does not necessarily represent the official views of the NIH.
Author contributions
Study concept and design, analysis and interpretation of data, drafting of the manuscript, critical revision of the manuscript for important intellectual content, B.Z.H., A.M.B., L.L.M., and S.L.P. Obtained funding, B.Z.H., C.A.H., L.R.W., S.S.H., J.-M.Y., W.J.B., D.O.S., L.L.M., and S.L.P. Acquisition of data, A.L.-J., M.T., S.E.M., C.A.H., L.R.W., L.L.M., and S.L.P. Analysis and interpretation of data and critical revision of the manuscript for important intellectual content, B.Q., Y.M.P., and K.D.S. Critical revision of the manuscript for important intellectual content, all authors.
Declaration of interests
The authors declare no competing interests.
Published: February 16, 2024
Footnotes
Supplemental information can be found online at https://doi.org/10.1016/j.ajhg.2024.01.012.
Contributor Information
Brian Z. Huang, Email: brian.huang@usc.edu.
Sungshim L. Park, Email: lpark@cc.hawaii.edu.
Supplemental information
References
- 1.Haiman C.A., Stram D.O., Wilkens L.R., Pike M.C., Kolonel L.N., Henderson B.E., Le Marchand L. Ethnic and racial differences in the smoking-related risk of lung cancer. N. Engl. J. Med. 2006;354:333–342. doi: 10.1056/NEJMOA033250. [DOI] [PubMed] [Google Scholar]
- 2.Stram D.O., Park S.L., Haiman C.A., Murphy S.E., Patel Y., Hecht S.S., Le Marchand L. Racial/Ethnic Differences in Lung Cancer Incidence in the Multiethnic Cohort Study: An Update. J. Natl. Cancer Inst. 2019;111:811–819. doi: 10.1093/JNCI/DJY206. [DOI] [PMC free article] [PubMed] [Google Scholar]
- 3.Murphy S.E., Park S.L., Balbo S., Haiman C.A., Hatsukami D.K., Patel Y., Peterson L.A., Stepanov I., Stram D.O., Tretyakova N., et al. Tobacco biomarkers and genetic/epigenetic analysis to investigate ethnic/racial differences in lung cancer risk among smokers. npj Precis. Oncol. 2018;2:17. doi: 10.1038/s41698-018-0057-y. [DOI] [PMC free article] [PubMed] [Google Scholar]
- 4.Gao X., Jia M., Zhang Y., Breitling L.P., Brenner H. DNA methylation changes of whole blood cells in response to active smoking exposure in adults: A systematic review of DNA methylation studies. Clin. Epigenetics. 2015;7 doi: 10.1186/s13148-015-0148-3. [DOI] [PMC free article] [PubMed] [Google Scholar]
- 5.Joehanes R., Just A.C., Marioni R.E., Pilling L.C., Reynolds L.M., Mandaviya P.R., Guan W., Xu T., Elks C.E., Aslibekyan S., et al. Epigenetic Signatures of Cigarette Smoking. Circ. Cardiovasc. Genet. 2016;9:436–447. doi: 10.1161/CIRCGENETICS.116.001506. [DOI] [PMC free article] [PubMed] [Google Scholar]
- 6.Domingo-Relloso A., Riffo-Campos A.L., Haack K., Rentero-Garrido P., Ladd-Acosta C., Fallin D.M., Tang W.Y., Herreros-Martinez M., Gonzalez J.R., Bozack A.K., et al. Cadmium, smoking, and human blood DNA methylation profiles in adults from the strong heart study. Environ. Health Perspect. 2020;128 doi: 10.1289/EHP6345. [DOI] [PMC free article] [PubMed] [Google Scholar]
- 7.Christiansen C., Castillo-Fernandez J.E., Domingo-Relloso A., Zhao W., El-Sayed Moustafa J.S., Tsai P.C., Maddock J., Haack K., Cole S.A., Kardia S.L.R., et al. Novel DNA methylation signatures of tobacco smoking with trans-ethnic effects. Clin. Epigenetics. 2021;13 doi: 10.1186/s13148-021-01018-4. [DOI] [PMC free article] [PubMed] [Google Scholar]
- 8.Cardenas A., Ecker S., Fadadu R.P., Huen K., Orozco A., McEwen L.M., Engelbrecht H.R., Gladish N., Kobor M.S., Rosero-Bixby L., et al. Epigenome-wide association study and epigenetic age acceleration associated with cigarette smoking among Costa Rican adults. Sci. Rep. 2022;12 doi: 10.1038/s41598-022-08160-w. [DOI] [PMC free article] [PubMed] [Google Scholar]
- 9.Shenker N.S., Polidoro S., van Veldhoven K., Sacerdote C., Ricceri F., Birrell M.A., Belvisi M.G., Brown R., Vineis P., Flanagan J.M. Epigenome-wide association study in the European Prospective Investigation Into Cancer And Nutrition (EPIC-Turin) identifies novel genetic loci associated with smoking. Hum. Mol. Genet. 2013;22:843–851. doi: 10.1093/hmg/dds488. [DOI] [PubMed] [Google Scholar]
- 10.Zhang Y., Florath I., Saum K.U., Brenner H. Self-reported smoking, serum cotinine, and blood DNA methylation. Environ. Res. 2016;146:395–403. doi: 10.1016/j.envres.2016.01.026. [DOI] [PubMed] [Google Scholar]
- 11.Philibert R.A., Beach S.R.H., Lei M.-K., Brody G.H. Changes in DNA methylation at the aryl hydrocarbon receptor repressor may be a new biomarker for smoking. Clin. Epigenetics. 2013;5:19. doi: 10.1186/1868-7083-5-19. [DOI] [PMC free article] [PubMed] [Google Scholar]
- 12.Reynolds L.M., Lohman K., Pittman G.S., Barr R.G., Chi G.C., Kaufman J., Wan M., Bell D.A., Blaha M.J., Rodriguez C.J., Liu Y. Tobacco exposure-related alterations in DNA methylation and gene expression in human monocytes: the Multi-Ethnic Study of Atherosclerosis (MESA) Epigenetics. 2017;12:1092–1100. doi: 10.1080/15592294.2017.1403692. [DOI] [PMC free article] [PubMed] [Google Scholar]
- 13.Gupta R., Van Dongen J., Fu Y., Abdellaoui A., Tyndale R.F., Velagapudi V., Boomsma D.I., Korhonen T., Kaprio J., Loukola A., Ollikainen M. Epigenome-wide association study of serum cotinine in current smokers reveals novel genetically driven loci 06 Biological Sciences 0604 Genetics 11 Medical and Health Sciences 1117 Public Health and Health Services. Clin. Epigenetics. 2019;11 doi: 10.1186/s13148-018-0606-9. [DOI] [PMC free article] [PubMed] [Google Scholar]
- 14.Pérez-Stable E.J., Benowitz N.L., Marín G. Is Serum Cotinine a Better Measure of Cigarette-Smoking Than Self-Report? Prev. Med. 1995;24:171–179. doi: 10.1006/pmed.1995.1031. [DOI] [PubMed] [Google Scholar]
- 15.Benowitz N.L., Jacob P., Fong I., Gupta S. Nicotine metabolic profile in man: Comparison of cigarette smoking and transdermal nicotine. J. Pharmacol. Exp. Ther. 1994;268:296–303. [PubMed] [Google Scholar]
- 16.Benowitz N.L., Dains K.M., Dempsey D., Yu L., Jacob P. Estimation of nicotine dose after low-level exposure using plasma and urine nicotine metabolites. Cancer Epidemiol. Biomarkers Prev. 2010;19:1160–1166. doi: 10.1158/1055-9965.EPI-09-1303. [DOI] [PMC free article] [PubMed] [Google Scholar]
- 17.Park S.L., Patel Y.M., Loo L.W.M., Mullen D.J., Offringa I.A., Maunakea A., Stram D.O., Siegmund K., Murphy S.E., Tiirikainen M., Le Marchand L. Association of internal smoking dose with blood DNA methylation in three racial/ethnic populations. Clin. Epigenetics. 2018;10 doi: 10.1186/s13148-018-0543-7. [DOI] [PMC free article] [PubMed] [Google Scholar]
- 18.Kolonel L.N., Henderson B.E., Hankin J.H., Nomura A.M., Wilkens L.R., Pike M.C., Stram D.O., Monroe K.R., Earle M.E., Nagamine F.S. A multiethnic cohort in Hawaii and Los Angeles: baseline characteristics. Am. J. Epidemiol. 2000;151:346–357. doi: 10.1093/oxfordjournals.aje.a010213. [DOI] [PMC free article] [PubMed] [Google Scholar]
- 19.Murphy S.E., Park S.S.L., Thompson E.F., Wilkens L.R., Patel Y., Stram D.O., Le Marchand L. Nicotine N-glucuronidation relative to N-oxidation and C-oxidation and UGT2B10 genotype in five ethnic/racial groups. Carcinogenesis. 2014;35:2526–2533. doi: 10.1093/carcin/bgu191. [DOI] [PMC free article] [PubMed] [Google Scholar]
- 20.Patel Y.M., Stram D.O., Wilkens L.R., Park S.S.L., Henderson B.E., Le Marchand L., Haiman C.A., Murphy S.E. The contribution of common genetic variation to nicotine and cotinine glucuronidation in multiple ethnic/racial populations. Cancer Epidemiol. Biomarkers Prev. 2015;24:119–127. doi: 10.1158/1055-9965.EPI-14-0815. [DOI] [PMC free article] [PubMed] [Google Scholar]
- 21.Price A.L., Patterson N.J., Plenge R.M., Weinblatt M.E., Shadick N.A., Reich D. Principal components analysis corrects for stratification in genome-wide association studies. Nat. Genet. 2006;38:904–909. doi: 10.1038/NG1847. [DOI] [PubMed] [Google Scholar]
- 22.Yuan J.M., Stram D.O., Arakawa K., Lee H.P., Yu M.C. Dietary cryptoxanthin and reduced risk of lung cancer: The Singapore Chinese health study. Cancer Epidemiol. Biomarkers Prev. 2003;12:890–898. [PubMed] [Google Scholar]
- 23.Yuan J.M., Nelson H.H., Carmella S.G., Wang R., Kuriger-Laber J., Jin A., Adams-Haduch J., Hecht S.S., Koh W.P., Murphy S.E. CYP2A6 genetic polymorphisms and biomarkers of tobacco smoke constituents in relation to risk of lung cancer in the Singapore Chinese Health Study. Carcinogenesis. 2017;38:411–418. doi: 10.1093/carcin/bgx012. [DOI] [PMC free article] [PubMed] [Google Scholar]
- 24.Signorello L.B., Hargreaves M.K., Steinwandel M.D., Zheng W., Cai Q., Schlundt D.G., Buchowski M.S., Arnold C.W., McLaughlin J.K., Blot W.J. Southern Community Cohort Study: Establishing a cohort to investigate health disparities. J. Natl. Med. Assoc. 2005;97:972–979. [PMC free article] [PubMed] [Google Scholar]
- 25.von Weymarn L.B., Lu X., Thomson N.M., LeMarchand L., Park S.L., Murphy S.E. Quantitation of Ten Urinary Nicotine Metabolites, Including 4-Hydroxy-4-(3-pyridyl) Butanoic Acid, a Product of Nicotine 2’-Oxidation, and CYP2A6 Activity in Japanese Americans, Native Hawaiians, and Whites. Chem. Res. Toxicol. 2023;36:313–321. doi: 10.1021/ACS.CHEMRESTOX.2C00413. [DOI] [PMC free article] [PubMed] [Google Scholar]
- 26.Pidsley R., Zotenko E., Peters T.J., Lawrence M.G., Risbridger G.P., Molloy P., Van Djik S., Muhlhausler B., Stirzaker C., Clark S.J. Critical evaluation of the Illumina MethylationEPIC BeadChip microarray for whole-genome DNA methylation profiling. Genome Biol. 2016;17 doi: 10.1186/s13059-016-1066-1. [DOI] [PMC free article] [PubMed] [Google Scholar]
- 27.Huber W., Carey V.J., Gentleman R., Anders S., Carlson M., Carvalho B.S., Bravo H.C., Davis S., Gatto L., Girke T., et al. Orchestrating high-throughput genomic analysis with Bioconductor. Nat. Methods. 2015;12:115–121. doi: 10.1038/NMETH.3252. [DOI] [PMC free article] [PubMed] [Google Scholar]
- 28.Aryee M.J., Jaffe A.E., Corrada-Bravo H., Ladd-Acosta C., Feinberg A.P., Hansen K.D., Irizarry R.A. Minfi: a flexible and comprehensive Bioconductor package for the analysis of Infinium DNA methylation microarrays. Bioinformatics. 2014;30:1363–1369. doi: 10.1093/bioinformatics/btu049. [DOI] [PMC free article] [PubMed] [Google Scholar]
- 29.Fortin J.P., Fertig E., Hansen K. shinyMethyl: interactive quality control of Illumina 450k DNA methylation arrays in R. F1000Res. 2014;3 doi: 10.12688/F1000RESEARCH.4680.2. [DOI] [PMC free article] [PubMed] [Google Scholar]
- 30.Fortin J.P., Triche T.J., Hansen K.D. Preprocessing, normalization and integration of the Illumina HumanMethylationEPIC array with minfi. Bioinformatics. 2017;33:558–560. doi: 10.1093/BIOINFORMATICS/BTW691. [DOI] [PMC free article] [PubMed] [Google Scholar]
- 31.Triche T.J., Jr., Weisenberger D.J., Van Den Berg D., Laird P.W., Siegmund K.D. Low-level processing of Illumina Infinium DNA Methylation BeadArrays. Nucleic Acids Res. 2013;41:e90. doi: 10.1093/nar/gkt090. [DOI] [PMC free article] [PubMed] [Google Scholar]
- 32.Pidsley R., Y Wong C.C., Volta M., Lunnon K., Mill J., Schalkwyk L.C. A data-driven approach to preprocessing Illumina 450K methylation array data. BMC Genom. 2013;14:293. doi: 10.1186/1471-2164-14-293. [DOI] [PMC free article] [PubMed] [Google Scholar]
- 33.Niu L., Xu Z., Taylor J.A. RCP: a novel probe design bias correction method for Illumina Methylation BeadChip. Bioinformatics. 2016;32:2659–2663. doi: 10.1093/BIOINFORMATICS/BTW285. [DOI] [PMC free article] [PubMed] [Google Scholar]
- 34.Johnson W.E., Li C., Rabinovic A. Adjusting batch effects in microarray expression data using empirical Bayes methods. Biostatistics. 2007;8:118–127. doi: 10.1093/BIOSTATISTICS/KXJ037. [DOI] [PubMed] [Google Scholar]
- 35.Houseman E.A., Accomando W.P., Koestler D.C., Christensen B.C., Marsit C.J., Nelson H.H., Wiencke J.K., Kelsey K.T. DNA methylation arrays as surrogate measures of cell mixture distribution. BMC Bioinf. 2012;13:86. doi: 10.1186/1471-2105-13-86. [DOI] [PMC free article] [PubMed] [Google Scholar]
- 36.Salas L.A., Koestler D.C., Butler R.A., Hansen H.M., Wiencke J.K., Kelsey K.T., Christensen B.C. An optimized library for reference-based deconvolution of whole-blood biospecimens assayed using the Illumina HumanMethylationEPIC BeadArray. Genome Biol. 2018;19 doi: 10.1186/s13059-018-1448-7. [DOI] [PMC free article] [PubMed] [Google Scholar]
- 37.White H. A Heteroskedasticity-Consistent Covariance Matrix Estimator and a Direct Test for Heteroskedasticity. Econometrica. 1980;48:817. doi: 10.2307/1912934. [DOI] [Google Scholar]
- 38.Long J.S., Ervin L.H. Using Heteroscedasticity Consistent Standard Errors in the Linear Regression Model. Am. Stat. 2000;54:217–224. doi: 10.1080/00031305.2000.10474549. [DOI] [Google Scholar]
- 39.Mansell G., Gorrie-Stone T.J., Bao Y., Kumari M., Schalkwyk L.S., Mill J., Hannon E. Guidance for DNA methylation studies: Statistical insights from the Illumina EPIC array. BMC Genom. 2019;20 doi: 10.1186/s12864-019-5761-7. [DOI] [PMC free article] [PubMed] [Google Scholar]
- 40.Yoshida K., Li Y. regmedint: Regression-Based Causal Mediation Analysis with Interaction and Effect Modification Terms. 2022. https://kaz-yos.github.io/regmedint/
- 41.Willer C.J., Li Y., Abecasis G.R. METAL: Fast and efficient meta-analysis of genomewide association scans. Bioinformatics. 2010;26:2190–2191. doi: 10.1093/bioinformatics/btq340. [DOI] [PMC free article] [PubMed] [Google Scholar]
- 42.Yu Y., Ouyang Y., Yao W. ShinyCircos: An R/Shiny application for interactive creation of Circos plot. Bioinformatics. 2018;34:1229–1231. doi: 10.1093/bioinformatics/btx763. [DOI] [PubMed] [Google Scholar]
- 43.Zhou W., Laird P.W., Shen H. Comprehensive characterization, annotation and innovative use of Infinium DNA methylation BeadChip probes. Nucleic Acids Res. 2017;45:e22. doi: 10.1093/nar/gkw967. [DOI] [PMC free article] [PubMed] [Google Scholar]
- 44.Li M., Zou D., Li Z., Gao R., Sang J., Zhang Y., Li R., Xia L., Zhang T., Niu G., et al. EWAS Atlas: A curated knowledgebase of epigenome-wide association studies. Nucleic Acids Res. 2019;47:D983–D988. doi: 10.1093/nar/gky1027. [DOI] [PMC free article] [PubMed] [Google Scholar]
- 45.Battram T., Yousefi P., Crawford G., Prince C., Sheikhali Babaei M., Sharp G., Hatcher C., Vega-Salas M.J., Khodabakhsh S., Whitehurst O., et al. The EWAS Catalog: a database of epigenome-wide association studies. Wellcome Open Res. 2022;7:41. doi: 10.12688/wellcomeopenres.17598.2. [DOI] [PMC free article] [PubMed] [Google Scholar]
- 46.Sun Y.Q., Richmond R.C., Suderman M., Min J.L., Battram T., Flatberg A., Beisvag V., Nøst T.H., Guida F., Jiang L., et al. Assessing the role of genome-wide DNA methylation between smoking and risk of lung cancer using repeated measurements: The HUNT study. Int. J. Epidemiol. 2021;50:1482–1497. doi: 10.1093/ije/dyab044. [DOI] [PMC free article] [PubMed] [Google Scholar]
- 47.Sikdar S., Joehanes R., Joubert B.R., Xu C.J., Vives-Usano M., Rezwan F.I., Felix J.F., Ward J.M., Guan W., Richmond R.C., et al. Comparison of smoking-related DNA methylation between newborns from prenatal exposure and adults from personal smoking. Epigenomics. 2019;11:1487–1500. doi: 10.2217/epi-2019-0066. [DOI] [PMC free article] [PubMed] [Google Scholar]
- 48.Dugué P.A., Jung C.H., Joo J.E., Wang X., Wong E.M., Makalic E., Schmidt D.F., Baglietto L., Severi G., Southey M.C., et al. Smoking and blood DNA methylation: an epigenome-wide association study and assessment of reversibility. Epigenetics. 2020;15:358–368. doi: 10.1080/15592294.2019.1668739. [DOI] [PMC free article] [PubMed] [Google Scholar]
- 49.Jafarzadeh A., Noori M., Sarrafzadeh S., Tamehri Zadeh S.S., Nemati M., Chatrabnous N., Jafarzadeh S., Hamblin M.R., Jafari Najaf Abadi M.H., Mirzaei H. MicroRNA-383: A tumor suppressor miRNA in human cancer. Front. Cell Dev. Biol. 2022;10 doi: 10.3389/fcell.2022.955486. [DOI] [PMC free article] [PubMed] [Google Scholar]
- 50.Shang Y., Zang A., Li J., Jia Y., Li X., Zhang L., Huo R., Yang J., Feng J., Ge K., et al. MicroRNA-383 is a tumor suppressor and potential prognostic biomarker in human non-small cell lung caner. Biomed. Pharmacother. 2016;83:1175–1181. doi: 10.1016/j.biopha.2016.08.006. [DOI] [PubMed] [Google Scholar]
- 51.Hillary R.F., McCartney D.L., Smith H.M., Bernabeu E., Gadd D.A., Chybowska A.D., Cheng Y., Murphy L., Wrobel N., Campbell A., et al. Blood-based epigenome-wide analyses of 19 common disease states: A longitudinal, population-based linked cohort study of 18,413 Scottish individuals. PLoS Med. 2023;20 doi: 10.1371/JOURNAL.PMED.1004247. [DOI] [PMC free article] [PubMed] [Google Scholar]
- 52.Cui F., Zhou Q., Xiao K., Ma S. The microRNA hsa-let-7g promotes proliferation and inhibits apoptosis in lung cancer by targeting HOXB1. Yonsei Med. J. 2020;61:210–217. doi: 10.3349/ymj.2020.61.3.210. [DOI] [PMC free article] [PubMed] [Google Scholar]
- 53.Berg T., Hegelund Myrbäck T., Olsson M., Seidegård J., Werkström V., Zhou X.-H., Grunewald J., Gustavsson L., Nord M. Gene expression analysis of membrane transporters and drug-metabolizing enzymes in the lung of healthy and COPD subjects. Pharmacol. Res. Perspect. 2014;2 doi: 10.1002/prp2.54. [DOI] [PMC free article] [PubMed] [Google Scholar]
- 54.Joubert B.R., Felix J.F., Yousefi P., Bakulski K.M., Just A.C., Breton C., Reese S.E., Markunas C.A., Richmond R.C., Xu C.J., et al. DNA Methylation in Newborns and Maternal Smoking in Pregnancy: Genome-wide Consortium Meta-analysis. Am. J. Hum. Genet. 2016;98:680–696. doi: 10.1016/j.ajhg.2016.02.019. [DOI] [PMC free article] [PubMed] [Google Scholar]
- 55.Xiong X., Tu S., Wang J., Luo S., Yan X. CXXC5: A novel regulator and coordinator of TGF-β, BMP and Wnt signaling. J. Cell Mol. Med. 2019;23:740–749. doi: 10.1111/jcmm.14046. [DOI] [PMC free article] [PubMed] [Google Scholar]
- 56.Zeilinger S., Kühnel B., Klopp N., Baurecht H., Kleinschmidt A., Gieger C., Weidinger S., Lattka E., Adamski J., Peters A., et al. Tobacco Smoking Leads to Extensive Genome-Wide Changes in DNA Methylation. PLoS One. 2013;8 doi: 10.1371/journal.pone.0063812. [DOI] [PMC free article] [PubMed] [Google Scholar]
- 57.Mon S.Y., Riedlinger G., Abbott C.E., Seethala R., Ohori N.P., Nikiforova M.N., Nikiforov Y.E., Hodak S.P. Cancer risk and clinicopathological characteristics of thyroid nodules harboring thyroid-stimulating hormone receptor gene mutations. Diagn. Cytopathol. 2018;46:369–377. doi: 10.1002/dc.23915. [DOI] [PubMed] [Google Scholar]
- 58.Wu Z., Xi Z., Xiao Y., Zhao X., Li J., Feng N., Hu L., Zheng R., Zhang N., Wang S., Huang T. TSH-TSHR axis promotes tumor immune evasion. J. Immunother. Cancer. 2022;10 doi: 10.1136/jitc-2021-004049. [DOI] [PMC free article] [PubMed] [Google Scholar]
- 59.Dogan M.V., Beach S.R.H., Philibert R.A. Genetically contextual effects of smoking on genome wide DNA methylation. Am. J. Med. Genet. B Neuropsychiatr. Genet. 2017;174:595–607. doi: 10.1002/ajmg.b.32565. [DOI] [PMC free article] [PubMed] [Google Scholar]
- 60.Stueve T.R., Li W.Q., Shi J., Marconett C.N., Zhang T., Yang C., Mullen D., Yan C., Wheeler W., Hua X., et al. Epigenome-wide analysis of DNA methylation in lung tissue shows concordance with blood studies and identifies tobacco smoke-inducible enhancers. Hum. Mol. Genet. 2017;26:3014–3027. doi: 10.1093/HMG/DDX188. [DOI] [PMC free article] [PubMed] [Google Scholar]
- 61.De Vries M., Van Der Plaat D.A., Nedeljkovic I., Verkaik-Schakel R.N., Kooistra W., Amin N., Van Duijn C.M., Brandsma C.A., Van Diemen C.C., Vonk J.M., Marike Boezen H. From blood to lung tissue: Effect of cigarette smoke on DNA methylation and lung function. Respir. Res. 2018;19:212–219. doi: 10.1186/S12931-018-0904-Y/FIGURES/5. [DOI] [PMC free article] [PubMed] [Google Scholar]
Associated Data
This section collects any data citations, data availability statements, or supplementary materials included in this article.
Supplementary Materials
Data Availability Statement
The data generated as part of this study was funded by the NIH and will be shared in accordance with the NIH Genomic Data Sharing policies via the database of Genotypes and Phenotypes (dbGaP). Summary statistics from the discovery EWAS are available at https://doi.org/10.6084/m9.figshare.c.6905236.v1.