

Abstract
Drugs intended to target mammalian cells can have broad off-target effects on the human gut microbiota with potential downstream consequences for drug efficacy and side effect profiles. Yet, despite a rich literature on antibiotic resistance, we still know very little about the mechanisms through which commensal bacteria evade non-antibiotic drugs. Here, we focus on statins, one of the most prescribed drug types in the world and an essential tool in the prevention and treatment of high circulating cholesterol levels. Prior work in humans, mice, and cell culture support an off-target effect of statins on human gut bacteria; however, the genetic determinants of statin sensitivity remain unknown. We confirmed that simvastatin inhibits the growth of diverse human gut bacterial strains grown in communities and in pure cultures. Drug sensitivity varied between phyla and was dose-dependent. We selected two representative simvastatin-sensitive species for more in-depth analysis: Eggerthella lenta (phylum: Actinobacteriota) and Bacteroides thetaiotaomicron (phylum: Bacteroidota). Transcriptomics revealed that both bacterial species upregulate genes in response to simvastatin that alter the cell membrane, including fatty acid biogenesis (E. lenta) and drug efflux systems (B. thetaiotaomicron). Transposon mutagenesis identified a key efflux system in B. thetaiotaomicron that enables growth in the presence of statins. Taken together, these results emphasize the importance of the bacterial cell membrane in countering the off-target effects of host-targeted drugs. Continued mechanistic dissection of the various mechanisms through which the human gut microbiota evades drugs will be essential to understand and predict the effects of drug administration in human cohorts and the potential downstream consequences for health and disease.
Keywords: human gut microbiome, antimicrobial resistance, drug efflux, transcriptomics, bacterial genetics
ABBREVIATED SUMMARY
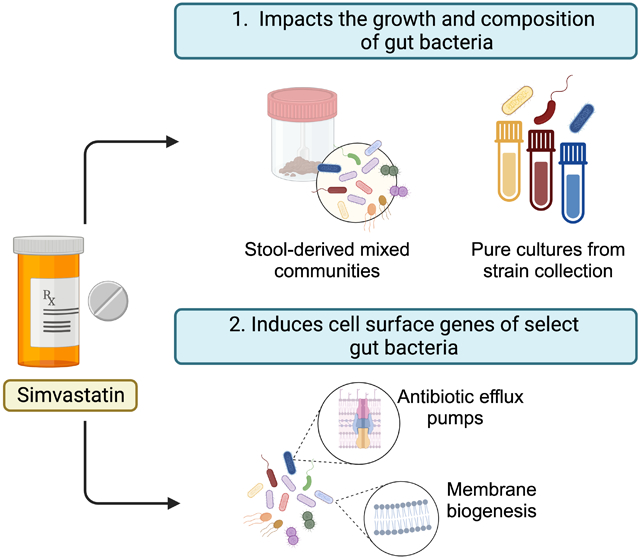
Drugs have broad off-target effects on the human microbiota, but the mechanisms determining drug sensitivity remain unclear. Escalante et al. dissect the impact of the common cardiovascular disease medication simvastatin on the growth of human gut bacteria in isolation and in complex communities, revealing drug-induced genes for membrane biogenesis and drug efflux. The results provide a valuable foundation to understand the bacterial sensitivity to simvastatin, informing ongoing studies in humans and preclinical animal models.
1 ∣. INTRODUCTION
Population-level surveys of the human gut microbiota have revealed that pharmaceuticals are the top predictor of inter-individual variations in gut microbial community structure (Falony et al., 2016; Zhernakova et al., 2016). Surprisingly, this association extends beyond drugs for infectious disease to drugs used in a wide range of noncommunicable diseases, including cancer (Spanogiannopoulos et al., 2022), rheumatoid arthritis (Nayak et al., 2021), and cardiovascular disease (Falony et al., 2016; Vieira-Silva et al., 2020). The off-target of statins on the gut microbiota is of particular interest due to the ubiquity of the use of these drugs in patients and the existence of rare but potentially severe adverse effects, including muscle damage and diabetes (Golomb and Evans, 2008).
Studies in humans, mice, and cell culture support a robust and clinically relevant interaction between statins and the gut microbiota. Early work in humans demonstrated that bile acid metabolites produced by the gut microbiome are positively associated with statin bioavailability and efficacy (Kaddurah-Daouk et al., 2011), consistent with a recent metagenomic sequencing study demonstrating that the gut microbiome is associated with both statin efficacy and toxicity (Wilmanski et al., 2022). Statins may also have a broader beneficial effect on the gut microbiota; for example, by decreasing the risk of obesity (Vieira-Silva et al., 2020). While gold-standard data from double-blinded longitudinal randomized controlled trials remains lacking, experiments in mouse models support a direct causal effect of statins on the gut microbiota (Catry et al., 2015; Caparrós-Martín et al., 2017; Cheng et al., 2021; Zhang et al., 2021; Xu et al., 2022) and even a potential role of the gut microbiota in contributing to their lipid-lowering effects (He et al., 2017). Furthermore, a screen of human gut bacterial isolates suggested that statins can directly inhibit the growth of gut bacteria (Maier et al., 2018).
However, despite the extensive literature supporting an important interaction between statins and the gut microbiome, multiple key questions remain. The bacterial targets of statins remains a mystery, given that their canonical target, 3-hydroxy-3-methylglutaryl coenzyme A (HMG-CoA) reductase, is rarely found in the human gut microbiome (Gill et al., 2006). The one prior in vitro study (Maier et al., 2018) only evaluated a single dose of statins in mono-culture; thus, the minimal inhibitory concentration (MIC) and relevance of the observed growth inhibition to microbial communities remains unclear. Furthermore, although growth inhibition is a valuable starting point, far more work is needed to assess the impact of statins on bacterial physiology, gene expression, and metabolic activity. And perhaps most importantly, prior to this study we lacked any insight into the genes and gene products that contribute to bacterial sensitivity to statins or if these mechanisms were shared across phyla.
To address these major knowledge gaps, we conducted an in-depth analysis of the interactions of a single representative statin (simvastatin) and the human gut microbiota. Simvastatin was selected due to its clinical relevance and clear evidence for microbiota interactions in humans (Kaddurah-Daouk et al., 2011), mice (He et al., 2017; Xu et al., 2022), and cell culture (Maier et al., 2018). As expected, we found that simvastatin has dose-dependent effects on bacterial growth across phyla. Further, we used a combination of transcriptomics and transposon mutagenesis to identify pathways in representative strains from two bacterial phyla (one Gram-positive and one Gram-negative) that support bacterial growth in the presence of statins. These results emphasize the parallels between pathways for resistance to antibiotics and host-targeted drugs (Maier et al., 2018), while providing an experimental and conceptual framework to dissect the impact of a broader range of statins or other drugs on human gut bacteria.
2 ∣. MATERIALS AND METHODS
2.1 ∣. Media, strains, drugs used
BHICHAV: Bacto Brain Heart Infusion (BD Biosciences, 37 g/L) supplemented with L-cysteine-HCl (0.05%, w/v), hemin (5 μg/mL), L-arginine (1.0%, w/v), vitamin K (1 μg/mL). BHICHV: Bacto Brain Heart Infusion (BD Biosciences, 37 g/L) supplemented with L-cysteine-HCl (0.05%, w/v), hemin (5 μg/mL), vitamin K (1 μg/mL). Simvastatin: Toronto chemicals S485000. DMSO (anhydrous, ≥99.9%): Sigma-Aldrich Sure/Seal 276855. MeOH (anhydrous, ≥99.9%): Sigma-Aldrich Sure/Seal 294829.
2.2 ∣. Ex vivo incubations of human stool samples
Stool from four human donors (Table S1), previously frozen at −80°C upon collection, was aliquoted into a pre-equilibrated cryovial, weighed, diluted in reduced BHICHV at 10 mL per 1 gram of stool (0.1 g/mL) and vortexed to homogenize. Each sample was allowed to settle for 5 minutes and 100 μL of the sediment-free supernatant aliquoted into a new pre-equilibrated cryovial. Growth was evaluated by inoculating sterile BHICHV with 1:10 dilution of this fecal slurry, with OD600 readings performed every 15 minutes for 48 hours with a 1-min shake prior to each absorbance reading at 37 °C using an Eon Microplate Spectrophotometer (Biotek Instruments, Inc.). Simvastatin dilutions were made from a freshly prepared base stock of 2.5 mg/mL in DMSO. Samples were treated with either simvastatin (25 μg/mL and 12 μg/mL) or an equal volume of 4% DMSO in a final volume of 100 μL prior to placing in the plate reader. Each donor’s stool inoculation and treatment were evaluated in triplicate (3 replicates per treatment group, Table S2). Samples were collected at the experimental endpoint to perform 16S rRNA gene sequencing (16S-seq) and analysis. All work described above was carried out in an anaerobic COY chamber. Growth curves were averaged by treatment and individual, and growth parameters (time to mid-exponential, carrying capacity and growth rate) were estimated using the Growthcurver package (Sprouffske and Wagner, 2016). ANOVA was used to determine changes in growth parameters between groups. The maximal intestinal concentration of simvastatin was calculated as previously described (Zou et al., 2020): 40 mg recommended daily dose (source:simvastatin package insert) divided by 250 mL. Distal gut levels were estimated based on isotope labeling experiments indicating that 60% of the administered dose is excreted in stool (Wishart et al., 2018) (DrugBank accession: DB00641).
2.3 ∣. 16S-seq and analysis of ex vivo incubations with simvastatin
Bacterial pellets from the ex vivo incubations above (100 μL) were collected by centrifugation at 3,000 rpm for 5 min and then stored at −80 °C. DNA was extracted using a ZymoBIOMICS 96 MagBead DNA Kit (Zymo D4308) as per the manufacturer's protocol, and 16S rRNA amplicon library was constructed following a dual-indexing approach (Gohl et al., 2016). Samples underwent 16S rRNA gene amplification using GoLay-barcoded V4 region V4-515F and V4-806R primers (Gohl et al., 2016) on a BioRad CFX 384 real-time PCR instrument with four serial 10 fold dilutions of extracted DNA template. Individual sample dilutions in the exponential phase were manually selected for subsequent indexing PCR using a dual GoLay index primers to add flow cell adaptors and indices as previously described (Gohl et al., 2016). DNA concentration was measured using a PicoGreen assay (P7589, Life Technologies) and samples were pooled at equimolar concentrations. Pooled libraries were purified and concentrated with MinElute PCR Purification kit (Qiagen #28004), run on 1% gel, size-selected (~427 bp) and purified using MinElute Gel Extraction kits (Qiagen, #28604). Libraries were quantified (NEBNext Library Quantification Kit; New England Biolabs) and sequenced with a 600 cycle MiSeq Reagent Kit v3 (paired-end reads set up for 250X8X8X250; Illumina MiSeq) with 15% PhiX spiked in before sequencing at the UCSF Center for Advanced Technology.
QIIME2 (Bolyen et al., 2019) was used to trim primer reads, denoise the data and create a feature table using the following: qiime cutadapt trim-paired, qiime dada2 denoise-paired, and qiime feature-classifier classify-sklearn as in our lab pipeline (https://github.com/jbisanz/16Spipelines/blob/master/QIIME2_pipeline.Rmd). Taxonomy was assigned using DADA2 (Callahan et al., 2016) with implementation of the RDP classifier (Wang et al., 2007) using the DADA2-formatted SILVA v128 training set. A phylogenetic tree was constructed using QIIME2 and the command phylogeny align-to-tree-mafft-fasttree. QIIME2 artifacts were imported into R using the qiime2R package (https://github.com/jbisanz/qiime2R). Low abundance taxa present in less than 3 samples and with less than 10 reads were filtered out. We assigned a unique ASV identifier that can be used to look up a full taxonomic assignment, from kingdom to species, associated with a sequence variant. Diversity metrics were generated using vegan (Dixon, 2003) and phyloseq (McMurdie and Holmes, 2013) packages in R. Principal coordinates analysis (PCoA) or Principal components analysis (PCA) were performed with ape (Paradis et al., 2004) or vegan packages, respectively. Analyses were carried out using the centered log2-ratio (CLR) normalized taxonomic abudances Aclr = [log2(A1/ga), log2(A2/ga),… log2(An/ga)], where A is a vector of read counts with a prior of 0.5 added and ga is the geometric mean of all values of A. Taxa were merged at different taxonomic levels using tax_glom from the phyloseq package before being CLR transformed where applicable. PERMANOVA was employed to detect changes in community composition from rarified counts or Bray-Curtis distances. Differential abundant ASVs were determined by employing ALDEx2 (Fernandes et al., 2013; Fernandes et al., 2014) using 150 simulations.
2.4 ∣. In vitro bacterial growth studies
The isolates used in this study are found in Table S3. 37/39 of the tested isolates are commonly found in the human gut microbiota. Each of these strains was obtained from the Deutsche Sammlung von Mikroorganismen und Zellkulturen (DSMZ) culture collection. A single colony of each isolate was subcultured in 5 mL of BHICHAV for 48 hours in an anaerobic chamber (Coy Laboratory Products) at 37°C with an atmosphere composed of 2-3% H2, 20% CO2, and the balance N2. This subculture was diluted down to an OD600 of 0.1, which was then further diluted 100-fold, and then used to inoculate a microtiter plate with 2-fold serial dilutions of simvastatin concentrations ranging from 1.5625 – 100 μg/mL or a 4% DMSO/MeOH vehicle control in a final volume of 100 μL. DMSO was used as a vehicle control for most of the isolates, except for the isolates from the Actinobacteria phylum which we found did not tolerate DMSO well and MeOH was used instead. Higher concentrations of simvastatin were not tested due to solubility limits in BHICHAV. Plates were incubated at 37°C for 48 hours in the anaerobic chamber and growth assessed by a final OD600 measurement. The minimal inhibitory concentration (MIC) was measured as the lowest concentration of simvastatin resulting in >90% growth inhibition after 48 hours of incubation. Absorbance of cultures in 96-well plates were read using an Eon Microplate Spectrophotometer (BioTek Instruments, Inc).
2.5 ∣. Tree construction
Full-length ribosomal sequences for each isolate were extracted from the database greengenes (DeSantis et al., 2006). Sequences were imported into Unipro UGENE (Okonechnikov et al., 2012) and aligned using MUSCLE (Edgar, 2004). Gaps occurring in >50% of sequences were removed and a maximum likelihood tree generated using PhyML (Guindon et al., 2010). For trees generated from 16S-seq from ex vivo samples, we used the ggtree R package (Yu et al., 2018).
2.6 ∣. Bacterial incubations for transcriptional profiling
Bacterial isolates E. lenta DSM 2243 and B. thetaiotaomicron DSM 2079 were grown anaerobically in previously equilibrated BHICHAV at 37 °C. Cultures for each isolate were grown to mid-exponential phase, split into triplicates, and incubated for 15 min at a range of simvastatin concentrations (1X, 0.5X, and 0.1X MIC; Table S3) or vehicle. Following incubations, cultures were removed from the anaerobic chamber in sealed Falcon tubes and placed immediately on ice. Cultures were centrifuged at 3,000 rpm for 5 min at 4 °C, the supernatant removed, and the bacterial pellets flash-frozen in liquid nitrogen for future RNA extraction.
2.7 ∣. RNA extraction
Each bacterial pellet was incubated with 1 mL of Tri Reagent (Sigma Aldrich T9424) at room temperature for 10 minutes. The cell suspension was transferred into Lysing Matrix E tubes (MP Biomedicals, 116914050) and homogenized in a bead-beater (Mini-Beadbeater-24, BioSpec) for 5 minutes at room temperature. The sample was incubated with 200 μL of chloroform at room temperature for 10 minutes, followed by centrifugation at 16,000 g for 15 minutes at 4 °C. Next, 500 μL of the upper aqueous phase was transferred into a new tube and 500 μL of 100% ethanol was added. To isolate RNA, we used the PureLink RNA Mini Kit (Life Technologies, catalog #: 12183025). This mixture was transferred onto a PureLink spin column and spun at ≥ 12,000 × g for 30 seconds. The column was washed with 350 μL of wash buffer I as described in the PureLink manual. The column was incubated with 80 μL of PureLink DNase (Life Technologies, catalog #: 12185010) at room temperature for 15 minutes, and washed with 350 μL of wash buffer I. The column was washed with wash buffer II twice as described in the PureLink manual. Total RNA was recovered in 50 μL of RNAase-free water. A second round of DNAse treatment was undertaken. The RNA was incubated with 6 μL of TURBO DNAse (Ambion, ThermoFisher, catalog #: AM2238) at 37 °C for 30 minutes. To stop the reaction, 56 μL of lysis buffer from the PureLink kit and 56 μL of 100% ethanol was added to the sample and vortexed. This suspension was transferred onto a PureLink column and washed once with 350 μL of wash buffer I and twice with 500 μL of wash buffer II. The RNA was recovered in 30 μL of RNAse-free water.
2.8 ∣. rRNA depletion, library generation, and RNA sequencing
Total RNA was subjected to rRNA depletion using the RiboMinus Bacteria Transcription Isolation kit (ThermoFisher, catalog # A47335), following the manufacturer’s protocol. RNA fragmentation, cDNA synthesis, and library preparation proceeded using NEBNext Ultra RNA Library Prep Kit for Illumina (New England BioLabs, catalog # E7530) and NEBNext Multiplex Oligos for Illumina, Dual Index Primers (New England BioLabs, catalog # E7600), following the manufacturer’s protocol. All samples were paired end sequenced (2x150 bp) using an Illumina NovaSeq platform (NovaSeq 6000 v1.5) at UCSF’s Institute for Human Genomics.
2.9 ∣. RNA sequencing analysis
Reads were trimmed using fastp (Chen et al., 2018). Reference genomes were obtained from NCBI’s genome assembly database under the following accession numbers: ASM2426v1 for E. lenta and ASM1106v1 for B. thetaiotaomicron. Reads were mapped to reference genomes using Bowtie2 (Langmead and Salzberg, 2012) using the following options: q, --met-file, --end-to-end, --sensitive. HTSeq (Anders et al., 2014) was used to count the number of transcripts mapping to genes using the following options: --type=CDS, --idattr:ID, --stranded=no, --minaqual=10. Differential abundance of gene transcripts in the simvastatin treated (low, med, high) and untreated samples was assessed using DESeq2 (Love et al., 2014) (v1.26.0) with the DeSeqDataSetFromHTSeqCount and ddsHTSeq functions and their default options. Different FDR thresholds ranging from 0.01 to 0.1 were used to determine the number of differentially expressed genes, and irrespective of the threshold used, consistent percentages of each bacterial genome were affected by simvastatin. Ultimately, a threshold of FDR<0.1 and ∣log2 fold-change∣>1 was chosen to determine significance. BlastKOALA (Kanehisa et al., 2016) was used to map protein sequences from each organism to KO terms using the “species_prokaryote” database. KEGG pathway enrichment was carried out using clusterProfiler (Yu et al., 2012) (v3.14.3) and the enrichKEGG function. KO terms for all differentially abundant barcodes (both up- and down- regulated with a padj<0.1, DESeq2 and ∣log2 fold-change∣>1) were provided and the organism parameter was set to “ko”. Heatmaps and volcano plots were generated using the ggplot2 R package (Wickham, 2016) (v3.3.5).
2.10 ∣. In vitro transposon mutant fitness assays and barcode sequencing
We performed B. thetaiotaomicron transposon mutant fitness assays as described previously (Liu et al., 2021). For B. thetaiotaomicron, we thawed an aliquot of the full transposon mutant library, inoculated the entire aliquot into 50 mL of BHICHV supplemented with 10 μg/mL erythromycin, and grew the library to mid-log phase. We then collected 6 cell pellets of ~1.0 OD600 unit each (the “Time0” sample). We used the remaining cells to inoculate competitive growth assays in the presence of simvastatin or a vehicle control. All fitness assays were performed in 1.2 mL of growth medium in a 24-well transparent microplate (Greiner) at a starting OD600 of 0.02. We grew cultures until the vehicle group reached stationary phase, and then collected cell pellets (the “Condition” sample). We extracted genomic DNA from the Time0 and Condition samples in a 96-well microplate format with a ZymoBIOMICS 96 MagBead DNA kit (ZymoResearch, catalog # D4302). We performed barcode sequencing (BarSeq) as previously described (Price et al., 2018; Liu et al., 2021). We used BarSeq oligos with both P1 and P2 indexed to minimize the impact of incorrectly assigned indexes in Illumina HiSeq4000 runs (Sinha et al., 2017). Strain and gene fitness scores were calculated as previously described and can be found within the Fitness Browser (https://fit.genomics.lbl.gov) (Wetmore et al., 2015). Fitness values are log2 ratios that describe the change in abundance of mutants in that gene during the experiment. For most of the fitness experiments, which are growth experiments, the change reflects how well the mutants grow relative to the “Time0” samples. The “Time0” samples also serve as a control to ensure the number of mutants across an experiment are consistent with previous fitness assays.
2.11 ∣. Transposon sequencing analysis
Barcoded transposon insertions were summed for each gene. Differential abundance of the individual genes in the treated and untreated mutant populations was assessed using DESeq2 (Love et al., 2014) (v1.26.0) with the DeSeqDataSetFromMatrix and dds functions and their default options on the gene count matrix. A threshold of FDR<0.1 and ∣log2 fold-change∣>1 was used to determine significance. BlastKOALA (Kanehisa et al., 2016) was used to map protein sequences from each organism to KO terms using the “species_prokaryote” database. KEGG pathway enrichment was carried out using clusterProfiler (Yu et al., 2012) (v3.14.3) using the enrichKEGG function. KO terms for all differentially abundant barcodes (both up- and down- regulated with a FDR<0.1, DESeq2 and ∣log2 fold-change∣ > 1) were provided and the organism parameter was set to “ko”. Heatmaps and volcano plots were generated using the ggplot2 R package (Wickham, 2016) (v3.3.5).
2.12 ∣. Comparative genomics
A previous pan-genome analysis (Bisanz et al., 2020) was used to assess conservation of marR genes across gut Coriobacteriia isolate genomes defined using ProteinOrtho v6.0.6 (Lechner et al., 2011), with gene family cutoffs of 60% identity and 80% coverage. marR gene families were defined based on annotation of the E. lenta DSM 2243 genome using InterProScan (Zdobnov and Apweiler, 2001). Our results were largely unchanged when using a looser sequence identity cutoff (40%). The United Human Gastrointestinal Genome collection (v2.0.1) was used to assess conservation of tolC-like systems across human gut microbes. The 4,744 species representative genomes and corresponding eggNOG-db annotations (https://doi.org/10.1093/nar/gky1085) were downloaded from the MGnify database, including 619 assigned to the Bacteroidota phylum (91 isolates and 528 metagenome-assembled genomes) (https://doi.org/10.1016/j.jmb.2023.168016). The following phylum-level eggNOG gene families were used to define the B. thetaiotaomicron-like tolC gene cluster: 4NEXN (BT_3339), 4NDZG (BT_3338) and 4NDZK (BT_3337). All 3 gene families were required to be adjacent to each other to be counted as a complete system, as in the B. thetaiotaomicron genome. The following phylum-level eggNOG gene families were used to define the E. coli-like tolC genes in Proteobacteria: 1MU78 (b0463), 1MU48 (b0462), and 1MWCJ (b3035). These were not required to be adjacent.
3 ∣. RESULTS
3.1 ∣. Simvastatin directly inhibits gut bacterial growth in mixed and pure cultures
We used our established methods for the ex vivo incubation of the human gut microbiota (Maurice et al., 2013; Nayak et al., 2021) to test the impact of simvastatin on gut microbial community structure in the absence of a host. Stool samples were selected from ImmunoMicrobiome cohort, an ongoing study of the microbiome and immune system of healthy participants (Table S1). Growth was tracked longitudinally for 48 hours by optical density and 16S rRNA gene sequencing (16S-seq) was performed at the experimental endpoint (Table S2). The simvastatin concentrations tested (≤25 μg/mL) were below the estimated maximum intestinal concentration (160 μg/mL) even after accounting for absorption in the proximal gut (96 μg/mL in stool).
Simvastatin had a significant impact on the gut microbiota across multiple metrics. Analysis of our growth curves revealed a dose-dependent delay in the overall growth of the human gut microbiota, resulting in a significant increase in the time it took to reach mid-exponential phase (Figure 1a). Community-wide carrying capacity and growth rate trended lower in response to simvastatin, but did not reach statistical significance potentially due to insufficient power (Figure S1a,b). We also observed a significant and dose-dependent decrease in microbial diversity, as assessed by the Shannon diversity index (Figure 1b) and the number of amplicon sequence variants (ASVs; Figure S1c). Consistent with prior studies (Maurice et al., 2013), analysis of the full 16S-seq dataset revealed marked inter-individual variations in the gut microbiota with a slight convergence based on simvastatin concentration (Figures 1c and Figure S1d). After stratifying the data by subject, we observed clear and statistically significant effects of simvastatin on gut microbial community structure (Figure 1d). At the phylum level, simvastatin significantly decreased Bacteroidota and increased Verrucomicrobiota (Figure 1e). Significant differences were also apparent at the ASV level, including 7 depleted ASVs and 3 enriched ASVs (Figure 1f). With the exception of an ASV identified as Eggerthella lenta, the remaining 6 depleted ASVs were significantly affected at both doses of simvastatin. An ASV identified as Bacteroides thetaiotaomicron was the most dramatically depleted ASV, with a 9-fold reduction in abundance. Taken together, these results show that simvastatin has a dramatic effect on the human gut microbiota in the absence of a host.
FIGURE 1. Simvastatin directly alters the growth and community structure of the human gut microbiota.

Human ex vivo stool cultures (n=4 donors, n=3 biological replicates/concentration; Table S1) were grown with simvastatin or a vehicle control for 48 hours and analyzed by 16S rRNA gene sequencing (Table S2). (A) Time to mid-exponential growth in hours from the growth data. (B) Bacterial diversity decreases as the concentration of simvastatin increases based on the Shannon diversity index. (C) Principal components 1 and 3 of Euclidean distances using center log2-ratio (CLR)-transformed values from 16S-seq data colored by simvastatin concentration and shaped by donor sample to facilitate the visualization of their effects. (D) Principal components 1 and 2 of Euclidean distances using CLR-transformed values from 16S-seq data calculated for each donor. (E) Taxonomic data from all samples aggregated at the phylum-level, CLR-transformed and compared across simvastatin concentrations. (F) ASVs differentially abundant across all samples in response to simvastatin at 25 μg/mL that also show consistent directionality in response to simvastatin at 12 μg/mL (ALDEx2 comparing samples treated with each simvastatin concentration relative to the vehicle). Colors indicate the difference in CLR-transformed values between simvastatin and vehicle groups. Boxplots in panels A,E: top and bottom hinges are the first and third quartiles, horizontal lines denote the median, and whiskers extend to the maximum and minimum values. p-values represent Wilcoxon rank-sum tests (panels A,B,E; *p-value<0.05, panel F) or PERMANOVA tests (panel C and D) between treatment groups.
Next, we sought to gain a more precise understanding of the growth inhibitory properties of simvastatin on human gut bacteria grown in isolation. We leveraged a previously generated collection of 39 human gut bacterial strains spanning 5 phyla (Table S3) (Nayak et al., 2021; Spanogiannopoulos et al., 2022). Each strain was grown in rich media (brain heart infusion with supplements; BHICHAV), which we previously showed supports the robust growth of this entire collection (Spanogiannopoulos et al., 2022). Simvastatin was included at a range of concentrations (1.56-100 μg/mL) at or below the estimated distal gut concentration (96 μg/mL). Most of the tested strains (29/39) had a measurable MIC (defined by a 90% decrease in carrying capacity), which ranged from 25-100 μg/mL (Figure 2 and Table S3). Of the strains with a measurable MIC, members of the Firmicutes and Actinobacteriota phyla had a significantly higher MIC relative to members of the Bacteroidota phylum (Figure S2). Within the tested Actinobacteriota, simvastatin sensitivity varied >3-fold, with Collinsella aerofaciens and Bifidobacterium longum tolerating higher levels than E. lenta and the other Coriobacteriaceae. Of note, both B. thetaiotaomicron and E. lenta were consistently affected by simvastatin in the context of a complex community and pure cultures. This fact, together with our extensive tools for B. thetaiotaomicron genetics (Liu et al., 2021) and E. lenta functional genomics (Bisanz et al., 2020) led us to focus on these two bacteria for more in-depth analysis.
FIGURE 2. Simvastatin directly inhibits the growth of human gut bacterial isolates.

A diverse panel of 39 representative gut bacterial strains (Table S3) were incubated with varying concentrations of simvastatin (1.56-100 μg/mL in 2-fold increments, n=3 biological replicates/concentration tested) and the MIC determined. A phylogenetic tree using full-length 16S rRNA gene sequences for each organism was constructed. MIC, minimum inhibitory concentration. The tree shows 37 of the isolates (2 additional Eggerthella strains were tested but only one of each species was included in the tree).
3.2 ∣. E. lenta upregulates genes for membrane biogenesis in response to simvastatin
Given the lack of variation in simvastatin sensitivity within the Eggerthellaceae (Table S3), we turned to transcriptional profiling (RNA-seq) to gain insights into the genes and metabolic pathways altered in response to simvastatin. We grew E. lenta in rich media and added 3 concentrations of simvastatin [low, med, high; 0.1-1X MIC] or vehicle controls at mid-exponential growth. Samples were collected 15 minutes later and used for RNA-seq and analysis (Table S4).
Simvastatin induced a substantial change in E. lenta gene expression. Principal components analysis revealed clear grouping of the overall transcriptomes of the two higher doses relative to the lowest dose and vehicle controls (Figure 3a). These differences were statistically significant (R2=0.393 and p=0.046, PERMANOVA; comparing simvastatin doses to vehicle controls). The number of differentially expressed genes (FDR<0.1 and ∣log2 fold-change∣>1, DESeq2) was dose-dependent (Figure 3b and Table S5), ranging from 2-250 upregulated and 0-240 downregulated genes relative to vehicle controls. At the highest dose ~16% (490/3,086) of E. lenta protein-coding genes were differentially expressed. The set of differentially expressed genes was dose-dependent, with 294 genes unique to the highest dose (Figure 3c). Pathway enrichment analysis demonstrated that the two higher doses of simvastatin consistently impacted 7 genes involved in fatty acid biosynthesis important for building lipids used in the cell membrane (Figure 3d).
FIGURE 3. Simvastatin has a dose-dependent effect on the E. lenta transcriptome and induces genes for cell membrane integrity.

(A) PCA of E. lenta DSM 2243 RNA-seq data comparing three doses of simvastatin to vehicle controls: low, low-dose (6 μg/mL); med, medium-dose (30 μg/mL); high, high-dose (60 μg/mL). Statistical results of PERMANOVA are reported (n=3 biological replicates/group, Tables S4-5). (B) Number of differentially expressed genes (DEGs; FDR<0.1 and ∣log2 fold-change∣>1, DESeq2) comparing each simvastatin dose relative to vehicle controls. (C) Overlap between DEGs across simvastatin doses. (D) Volcano plot of the medium and high simvastatin doses relative to vehicle controls: horizontal line, ∣log2 fold-change∣>1; vertical line, FDR<0.1. Colored points represent fatty acid biosynthesis pathway genes found to be significantly enriched by a KEGG pathway enrichment using clusterProfiler (padj<0.2, Benjamini–Hochberg correction). The KEGG overview map for fatty acid metabolism (KEGG map01212), which the fatty acid biosynthesis pathway falls under, was also significantly enriched due to an overlapping set of genes between them.
Interestingly, we observed 4 simvastatin-dependent genes annotated in NCBI as multiple antibiotic resistance transcriptional regulators (MarRs) (Sulavik et al., 1995). MarRs typically repress their own promoter (Perera and Grove, 2010; Grove, 2013). Ligand binding releases MarR from the promoter, inducing expression of MarR and neighboring genes (Figure 4a). MarR has been implicated in stress responses as well as the degradation/export of phenolic compounds and antibiotics (Grove, 2013). MarRs can bind to diverse ligands, including the antibiotics kanamycin, salicylate, and 2,4-dinitrophenol (Lomovskaya et al., 1995; Xiong et al., 2000; Perera and Grove, 2010; Grove, 2013), but direct binding to statins has not been reported.
FIGURE 4. Simvastatin induces multiple MarR-dependent gene clusters in E. lenta.

(A) Diagram of a marR and its mode of gene regulation (created with BioRender.com). MarR acts as a transcriptional repressor of itself and neighboring gene clusters by binding to site-specific DNA regions upstream. When MarR is bound to a ligand, repression is released and allows for the transcription of previously repressed genes (Grove, 2013). (B) Locus diagram showing 4 of the 9 differentially expressed marR genes (FDR<0.1 and ∣log2 fold-change∣>1, DESeq2) and their adjacent gene clusters across different doses of simvastatin. Colors are log2 fold-changes relative to vehicle controls. Significance is represented with an asterisk. Gene and gene cluster annotations shown where available.
In total, the E. lenta genome contains 9 MarR homologs, of which 4 are upregulated with a high dose of simvastatin. These 4 gene clusters have diverse functions including ATP-binding cassette (ABC) drug transport, heat shock response, fatty acid biosynthesis, and multidrug and toxic compound extrusion (Figure 4b). Of note, one of these putative MarR-regulated clusters encodes 6 genes involved in fatty acid biosynthesis (Figure 4b), all of which are induced at the two higher doses of simvastatin, consistent with our pathway enrichment analysis (Figure 3d). Taken together, these results support a working model in which simvastatin either directly or indirectly affects E. lenta MarR, lifting its repression of multiple gene clusters, including a suite of genes that are predicted to alter cell membrane lipid composition. Notably, all 9 MarR genes are also conserved across the E. lenta species, supporting their core importance for stress response (Figure S3).
3.3 ∣. B. thetaiotaomicron upregulates efflux systems that protect against simvastatin
Next, we sought to assess the similarities and differences in simvastatin response in another drug sensitive bacterium. We selected B. thetaiotaomicron due to its robust genetic tools (Liu et al., 2021) and to compare a Gram-negative bacterium to the Gram-positive E. lenta. As done previously for E. lenta, we grew B. thetaiotaomicron to mid-exponential phase then added 3 concentrations of simvastatin [low, med, high; 0.1-1X MIC] or vehicle controls at mid-exponential growth. Samples were collected 15 minutes later and used for RNA-seq and analysis (Table S4).
Remarkably, B. thetaiotaomicron exhibited an even more dramatic transcriptional response to simvastatin than E. lenta. Principal components analysis revealed clear grouping of the overall transcriptomes of all three doses relative to vehicle controls (Figure 5a); all three doses were statistically significant relative to vehicle controls (R2=0.47 and p=0.003, PERMANOVA; comparing simvastatin doses to vehicle controls). The number of differentially expressed genes (FDR<0.1 and ∣log2 fold-change∣>1, DESeq2) was higher than E. lenta overall but still dose-dependent (Figure 5b and Table S6), ranging from 115-473 upregulated and 8-468 downregulated genes relative to vehicle controls. At the highest dose, 19% of B. thetaiotaomicron genes (879/4,650) were differentially expressed. 31 differentially expressed genes were independent of dose; whereas 619 were consistently altered at the two higher doses (Figure 5c). Pathway enrichment analysis demonstrated a dose-independent enrichment for differentially expressed genes involved in oxidative phosphorylation (Figure 5d). The highest dose also affected genes involved in histidine, glyoxylate/dicarboxylate, and galactose metabolism pathways, whereas the lowest dose affected genes involved drug (beta-lactam) resistance and the TCA cycle (Figure 5d).
FIGURE 5. Simvastatin has a dose-dependent effect on the B. thetaiotaomicron transcriptome.

(A) PCA of B. thetaiotaomicron DSM2079 RNA-seq data comparing three doses of simvastatin to vehicle controls: low, low-dose (5 μg/mL);, med, medium-dose (25 μg/mL); high, high dose (50 μg/mL) . Statistical results of PERMANOVA are reported (n=3 biological replicates/group, Tables S4,S6). (B) Number of differentially expressed genes (DEGs; FDR<0.1 and ∣log2 fold-change∣>1 DESeq2) comparing each simvastatin dose relative to vehicle controls. (C) Overlap between DEGs across simvastatin doses. (D) KEGG pathway enrichments for DEGs (padj<0.2, Benjamini–Hochberg correction): colors, log10 padj; count, number of DEGs. (B-D) n=2-3 biological replicates/group; one sample from the high dose simvastatin group was excluded due to low sequencing depth (Table S4).
Interestingly, many of the top differentially expressed genes encoded the subunits of 3 distinct multidrug efflux systems (Figures 6a,b). All of these systems are homologous to the AcrAB-TolC system in E. coli (Table S7), which enables the efflux of a wide variety of compounds, including antibiotics (Li and Nikaido, 2009). Similar to E. coli, each efflux system in B. thetaiotaomicron includes three major subunits, all of which are differentially expressed in response to simvastatin: (i) the hydrogen-dependent inner membrane transporter AcrB; (ii) the periplasmic membrane fusion protein AcrA; and (iii) the outer membrane channel protein TolC (Li and Nikaido, 2009). Gene order is conserved in the 3 putative B. thetaiotaomicron AcrAB-TolC efflux systems (Figure 6d). Although the B. thetaiotaomicron systems remain uncharacterized at the biochemical level, we recently used transposon mutagenesis to implicate one of the 3 systems (encoded by the genes BT3337-9; referred to herein as AcrAB-TolC1) in resistance to the antibiotics fusidic acid and cefoxitin, and the antipsychotic chlorpromazine (Liu et al., 2021).
FIGURE 6. Simvastatin induces drug efflux systems in B. thetaiotaomicron that enable growth.

(A) Schematic of a characterized Resistance-Nodulation-Division (RND) family efflux system [adapted from (Anes et al., 2015)]. (B-C) Volcano plots of RNA-seq (B, Table S6) and RB-TnSeq (C, Table S9) following exposure of B. thetaiotaomicron to a low dose of simvastatin relative to vehicle controls (5 μg/mL, 0.1X MIC, n=3 biological replicates/group). Genes homologous to the RND family efflux system BT3337-BT3339/AcrAB-TolC1 (Liu et al., 2021) are labeled red (Table S7). Points above the horizontal dotted line and to the right and left of the vertical dotted lines have an FDR<0.1 and ∣log2 fold-change∣>1 (DESeq2). (D-E) Genomic loci in B. thetaiotaomicron containing RND efflux genes and neighboring genes. Asterisks indicate genes differentially abundant in the presence of simvastatin relative to vehicle controls. (B-E) AcrAB-TolC1 refers to BT3337-BT3339; AcrAB-TolC2 refers to BT1965-1967; AcrAB-TolC3 refers to BT2940-BT2942 (Tables S7 and S9).
In order to test the impact of all three efflux systems on growth in presence of simvastatin, we turned to our previously published barcoded transposon sequencing library (Liu et al., 2021). This barcoded transposon mutant library carries transposon insertions in 4,055 non-essential genes whose change in abundance can be measured in the presence of a stressor, previously described as a genome-wide fitness assay (Liu et al., 2021). We performed a fitness assay in which we grew up the transposon mutant library in the presence of low [0.1X MIC] levels of simvastatin or vehicle and then looked at the differential abundance of the gene insertions relative to the vehicle (Table S8). In total, we identified 102 genes that have significantly improved growth in simvastatin when disrupted and 117 genes whose insertions had significantly impaired growth (FDR<0.1, ∣log2 fold-change∣>1, DESeq2; Table S9). The genes that exhibited increased growth upon transposon insertion included cardiolipin synthetase (BT3978, Table S9), potentially suggesting that cardiolipin incorporation into the inner membrane increases simvastatin sensitivity (Davlieva et al., 2013). On the other hand, we noted multiple genes important for simvastatin tolerance, including the transporter system encoded by BT3337-BT3339 (referred to herein as AcrAB-TolC1), important for fusidic acid tolerance (Liu et al., 2021) (Figure 6c).
We performed a more in-depth analysis of the three B. thetaiotaomicron AcrAB-TolC systems that we had previously identified by RNA-seq. The greatest fitness defect was observed when AcrAB-TolC1 was disrupted (Figures 6c,e and Table S9), consistent with its high level of baseline gene expression (Figure S4a). All three systems were significantly induced by low levels of simvastatin, with AcrAB-TolC2 and AcrAB-TolC3 showing the most dramatic upregulation (Figures 6b,d and Figures S4a-c).
Follow-up experiments confirmed that the sensitivity of B. thetaiotaomicron to simvastatin was increased in response to chemical and genetic disruption of drug efflux. We used phenylalanine-arginine β-napthylamide (PAβN), which inhibits RND family drug efflux systems, including AcrAB-TolC (Lamers et al., 2013). The B. thetaiotaomicron MIC for simvastatin significantly decreased in response to PAβN (Figure 7a). We obtained stocks with transposon insertions in each of the three B. thetaiotaomicron tolC genes (Arjes et al., 2022). Transposon insertions in two of the loci (tolC1::Tn and tolC3::Tn) resulted in a lower MIC for simvastatin relative to wt (Figure 7b). These results are generalizable to other species; disruption of the single tolC encoded by Escherichia coli (ΔtolC::KanR) led to a significant increase in simvastatin sensitivity (Figure 7c). Interestingly, while AcrAB-TolC systems are prevalent in members of the Bacteroidota and Proteobacteria, they vary in copy number; Bacteroidota strains can have a maximum of up to 7 systems (Figure S5a), while Proteobacteria a maximum of 2 (Figure S5b). These results, together with another recent report (Maier et al., 2018), highlight the key role of multi-drug efflux systems in bacterial resistance to both antibiotics and host-targeted drugs.
FIGURE 7. RND family drug efflux systems decrease simvastatin sensitivity in B. thetaiotaomicron and E. coli.

(A) B. thetaiotaomicron simvastatin MIC is decreased in response to the efflux inhibitor PAβN (Spearman ρ=−0.81, p=0.00015; n=2 biological replicates/concentration). Regression line and 95% confidence interval are shown. (B) Transposon insertions in individual tolC genes decreases the MIC of simvastatin for B. thetaiotaomicron. (Kruskal-Wallis multiple comparison test; n=3 biological replicates/concentration). (C) TolC protects E. coli from simvastatin. The ΔtolC::KanR strain exhibits significantly lower carrying capacity in response to increasing concentrations of simvastatin (Spearman ρ=−0.97, p<2.2e−16; n=3 biological replicates/concentration). Regression lines and 95% confidence intervals are shown.
4 ∣. DISCUSSION
Our results demonstrate that simvastatin elicits a direct antibacterial effect on a broader range of human gut bacteria than previously appreciated (Ko et al., 2017; Maier et al., 2018). A prior in vitro screen identified a single dose of simvastatin (8.37 μg/mL, 20 μM) that affected the growth of 3 gut bacterial isolates (P. distasonis, R. torques and R. intestinalis) in mono-culture (Maier et al., 2018). In this study, we expanded the list of simvastatin-sensitive strains by testing a range of physiologically-relevant drug concentrations on human gut bacterial communities and a panel of gut bacterial isolates. Drug sensitivity varied in the context of a community versus pure culture. However, common trends in susceptibility to simvastatin were observed from the phylum- to strain-level. Members of the phylum Bacteroidota were on average more susceptible to simvastatin. A subset of strains from multiple phyla had consistent susceptibility to simvastatin when present in either a community or in isolation, including B. thetaiotaomicron and E. lenta, which we chose for more in-depth follow-up experiments.
It remains perplexing that simvastatin has direct antimicrobial effects given that HMG-CoA reductase, the canonical target of simvastatin, is rare in human gut bacterial genomes (Gill et al., 2006; Heuston et al., 2012). More work is needed to elucidate the mechanism(s) of action that leads to the observed inhibition of diverse gut bacterial species.
Our results indicate that simvastatin has a broad impact on gut bacterial gene expression. These results mirror our prior work on the antimetabolite drugs methotrexate and 5-fluorouracil which demonstrate the marked effect drug exposure can have on gut bacterial transcriptional activity (Nayak et al., 2021; Spanogiannopoulos et al., 2022). This suggests that simvastatin either directly or indirectly alters the core metabolic pathways of gut bacteria which are often essential and not reflected in loss-of-function screens. A gain-of-function screen using a barcoded overexpression bacterial shotgun expression library sequencing (Boba-seq), might help complement some of our findings and has the advantage of capturing essential genes (Huang et al., 2022). Future studies utilizing affinity probes (Brandvold et al., 2021) or other chemical biology tools could help to identify proteins that directly interact with simvastatin within bacterial cells, complementing the bacterial genetic and transcriptomic tools used in this study.
The bacterial cell membrane and its changes in permeability from the incorporation of fatty acids play a key role in antibiotic resistance (Royce et al., 2013; Su et al., 2021). This has been established for antibiotics like ciprofloxacin (Su et al., 2021), but not for antibacterial statins. Here, we found that E. lenta responds to simvastatin via the upregulation of genes for fatty acid biosynthesis. More work is needed to explore exactly how the enhanced biosynthesis of fatty acids might contribute to simvastatin resistance. This can be studied by employing fatty acid biosynthesis inhibitors (Su et al., 2021) like triclosan and 2-aminooxazole in synergy with simvastatin to test how their combination affects simvastatin susceptibility and cell morphology.
We also found that a subset of transcriptional regulators from the MarR family are upregulated by E. lenta in response to simvastatin. MarR-type regulators generally respond to environmental stress responses, including stress triggered by antibiotics, by controlling a small set of genes often located in the same gene cluster (Lomovskaya et al., 1995; Poole et al., 1996; Srikumar et al., 2000; Xiong et al., 2000). In E. lenta, these MarR homologs appear to regulate multiple gene clusters in response to simvastatin, including genes for membrane biogenesis (fatty acid biosynthesis), increased drug efflux (ABC and MATE transporters), and heat shock response (DnaK). More work is needed to further characterize how simvastatin interacts with MarR to affect these systems. Dissociation of its genetic target is triggered by ligand binding, which could be due to a direct binding to simvastatin or to another compound that is responsive to simvastatin exposure.
Similarly, our data suggests that the gut bacterium B. thetaiotaomicron also uses the cell wall to evade the antibacterial effects of simvastatin. We identified three distinct AcrAB-TolC efflux systems, one of which had been previously characterized as important for the tolerance to the antibacterial fusidic acid which is lipophilic and structurally resembles simvastatin (Liu et al., 2021). These systems are all homologous to E. coli, which only encodes a single AcrAB-TolC efflux system (Nikaido and Takatsuka, 2009). More work is needed to assess the substrate-specificity and expression level of B. thetaiotaomicron’s different AcrAB-TolC efflux systems and their relative impacts on growth in the presence of simvastatin and other drugs. While all three efflux systems were differentially expressed in the presence of simvastatin, only one of these efflux systems significantly impacted competitive growth in our transposon data, suggesting that system is more important for simvastatin tolerance.
This study has multiple key limitations. The bacterial determinants of susceptibility to simvastatin at the cellular and community level remain to be fully elucidated, but likely involve mechanisms of resistance or other microbe-microbe and host-microbe interactions. Furthermore, it will be important to extend our paired transcriptomic and genetic analyses to additional human gut bacterial species; for example, the simvastatin resistant Bifidobacterium longum and Clostridium sporogenes, which are both genetically tractable. Of note, prior work has indicated that gut bacteria metabolize simvastatin (Aura et al., 2011; Đanić et al., 2023), which could potentially influence the variation in drug sensitivity we observed. It remains to be explored whether any of the responses observed in this study could be attributed to simvastatin metabolites. While bacterial drug sensitivity was evaluated in vitro, more work is needed to assess the susceptibility of gut bacteria to simvastatin in vivo, including in gnotobiotic and conventionally raised mice or other model species.
These findings open the door to exploring how simvastatin’s antibacterial properties can be contributing to changes in gut microbiome signatures and how they might explain adverse and beneficial effects from statin intake previously observed in metagenomics-based association studies (Zhernakova et al., 2016; Vieira-Silva et al., 2020). Our current results clearly demonstrate the feasibility and utility of focused studies of individual non-antibiotic drugs, like simvastatin, that can have unintended effects for diverse members of the human gut microbiota. Such knowledge sets the foundation for further mechanistic dissection of these drug-microbiome interactions while informing ongoing work in humans looking at cross-sectional and longitudinal differences in the gut microbiome of patients on these widely used medications.
Supplementary Material
Acknowledgements:
We thank Moriah Sandy (UCSF Quantitative Metabolite Analysis Center) for analytical support and K.C. Huang (Stanford Department of Bioengineering) for sharing the RB-TnSeq ordered library. National Institutes of Health (R01HL122593, R01AT011117, R01DK114034, R01AR074500, P.J.T.; R25GM056847, V.E.; F32GM140808, C.N.; RM1GM135102, A.M.D.). V.E. received a graduate fellowship from the National Sciences Foundation (1650113). P.J.T. is a Chan Zuckerberg Biohub-San Francisco Investigator (7028823) and held an Investigators in the Pathogenesis of Infectious Disease Award from the Burroughs Wellcome Fund (1017921).
Footnotes
COI: The authors declare no competing interests.
Ethics Approval: This study was approved by the University of California San Francisco Institutional Review Board and conducted accordingly. All subjects were given informed consent. This is not a registered clinical trial.
Data availability:
Sequencing data is available under NCBI BioProject PRJNA925231.
REFERENCES
- Anders S, Pyl PT, and Huber W (2014) HTSeq—a Python framework to work with high-throughput sequencing data. Bioinformatics 31: 166–169. [DOI] [PMC free article] [PubMed] [Google Scholar]
- Anes J, McCusker MP, Fanning S, and Martins M (2015) The ins and outs of RND efflux pumps in Escherichia coli. Frontiers in Microbiology 6 10.3389/fmicb.2015.00587. [DOI] [PMC free article] [PubMed] [Google Scholar]
- Arjes HA, Sun J, Liu H, Nguyen TH, Culver RN, Celis AI, et al. (2022) Construction and characterization of a genome-scale ordered mutant collection of Bacteroides thetaiotaomicron. BMC Biol 20: 285. [DOI] [PMC free article] [PubMed] [Google Scholar]
- Aura A-M, Mattila I, Hyötyläinen T, Gopalacharyulu P, Bounsaythip C, Orešič M, and Oksman-Caldentey K-M (2011) Drug metabolome of the simvastatin formed by human intestinal microbiota in vitro. Mol Biosyst 7: 437–446. [DOI] [PubMed] [Google Scholar]
- Bisanz JE, Soto-Perez P, Noecker C, Aksenov AA, Lam KN, Kenney GE, et al. (2020) A Genomic Toolkit for the Mechanistic Dissection of Intractable Human Gut Bacteria. Cell Host Microbe 27: 1001–1013.e9. [DOI] [PMC free article] [PubMed] [Google Scholar]
- Bolyen E, Rideout JR, Dillon MR, and Bokulich NA (2019) Reproducible, interactive, scalable and extensible microbiome data science using QIIME 2. Nature https://www.nature.com/articles/s41587-019-0209-9?ref=https://githubhelp.com. [DOI] [PMC free article] [PubMed] [Google Scholar]
- Brandvold KR, Miller CJ, Volk RF, Killinger BJ, Whidbey C, and Wright AT (2021) Activity-based protein profiling of bile salt hydrolysis in the human gut microbiome with beta-lactam or acrylamide-based probes. Chembiochem 22: 1448–1455. [DOI] [PubMed] [Google Scholar]
- Callahan BJ, McMurdie PJ, Rosen MJ, Han AW, Johnson AJA, and Holmes SP (2016) DADA2: High-resolution sample inference from Illumina amplicon data. Nat Methods 13: 581–583. [DOI] [PMC free article] [PubMed] [Google Scholar]
- Caparrós-Martín JA, Lareu RR, Ramsay JP, Peplies J, Reen FJ, Headlam HA, et al. (2017) Statin therapy causes gut dysbiosis in mice through a PXR-dependent mechanism. Microbiome 5: 95. [DOI] [PMC free article] [PubMed] [Google Scholar]
- Catry E, Pachikian BD, Salazar N, Neyrinck AM, Cani PD, and Delzenne NM (2015) Ezetimibe and simvastatin modulate gut microbiota and expression of genes related to cholesterol metabolism. Life Sci 132: 77–84. [DOI] [PubMed] [Google Scholar]
- Cheng T, Li C, Shen L, Wang S, Li X, Fu C, et al. (2021) The Intestinal Effect of Atorvastatin: Akkermansia muciniphila and Barrier Function. Front Microbiol 12: 797062. [DOI] [PMC free article] [PubMed] [Google Scholar]
- Chen S, Zhou Y, Chen Y, and Gu J (2018) fastp: an ultra-fast all-in-one FASTQ preprocessor. Bioinformatics 34: i884–i890. [DOI] [PMC free article] [PubMed] [Google Scholar]
- Đanić M, Pavlović N, Lazarević S, Stanimirov B, Vukmirović S, Al-Salami H, et al. (2023) Bioaccumulation and biotransformation of simvastatin in probiotic bacteria: A step towards better understanding of drug-bile acids-microbiome interactions. Front Pharmacol 14: 1111115. [DOI] [PMC free article] [PubMed] [Google Scholar]
- Davlieva M, Zhang W, Arias CA, and Shamoo Y (2013) Biochemical characterization of cardiolipin synthase mutations associated with daptomycin resistance in enterococci. Antimicrob Agents Chemother 57: 289–296. [DOI] [PMC free article] [PubMed] [Google Scholar]
- DeSantis TZ, Hugenholtz P, Larsen N, Rojas M, Brodie EL, Keller K, et al. (2006) Greengenes, a chimera-checked 16S rRNA gene database and workbench compatible with ARB. Appl Environ Microbiol 72: 5069–5072. [DOI] [PMC free article] [PubMed] [Google Scholar]
- Dixon P (2003) VEGAN, a package of R functions for community ecology. J Veg Sci https://onlinelibrary.wiley.com/doi/abs/10.1111/j.1654-1103.2003.tb02228.x. [Google Scholar]
- Edgar RC (2004) MUSCLE: multiple sequence alignment with high accuracy and high throughput. Nucleic Acids Res 32: 1792–1797. [DOI] [PMC free article] [PubMed] [Google Scholar]
- Falony G, Joossens M, Vieira-Silva S, Wang J, Darzi Y, Faust K, et al. (2016) Population-level analysis of gut microbiome variation. Science 352: 560–564. [DOI] [PubMed] [Google Scholar]
- Fernandes AD, Macklaim JM, Linn TG, Reid G, and Gloor GB (2013) ANOVA-like differential expression (ALDEx) analysis for mixed population RNA-Seq. PLoS One 8: e67019. [DOI] [PMC free article] [PubMed] [Google Scholar]
- Fernandes AD, Reid JN, Macklaim JM, McMurrough TA, Edgell DR, and Gloor GB (2014) Unifying the analysis of high-throughput sequencing datasets: characterizing RNA-seq, 16S rRNA gene sequencing and selective growth experiments by compositional data analysis. Microbiome 2: 15. [DOI] [PMC free article] [PubMed] [Google Scholar]
- Gill SR, Pop M, Deboy RT, Eckburg PB, Turnbaugh PJ, Samuel BS, et al. (2006) Metagenomic analysis of the human distal gut microbiome. Science 312: 1355–1359. [DOI] [PMC free article] [PubMed] [Google Scholar]
- Gohl DM, Vangay P, Garbe J, MacLean A, Hauge A, Becker A, et al. (2016) Systematic improvement of amplicon marker gene methods for increased accuracy in microbiome studies. Nat Biotechnol 34: 942–949. [DOI] [PubMed] [Google Scholar]
- Golomb BA, and Evans MA (2008) Statin adverse effects : a review of the literature and evidence for a mitochondrial mechanism. Am J Cardiovasc Drugs 8: 373–418. [DOI] [PMC free article] [PubMed] [Google Scholar]
- Grove A (2013) MarR family transcription factors. Curr Biol 23: R142–R143. [DOI] [PubMed] [Google Scholar]
- Guindon S, Dufayard J-F, Lefort V, Anisimova M, Hordijk W, and Gascuel O (2010) New algorithms and methods to estimate maximum-likelihood phylogenies: assessing the performance of PhyML 3.0. Syst Biol 59: 307–321. [DOI] [PubMed] [Google Scholar]
- Heuston S, Begley M, Gahan CGM, and Hill C (2012) Isoprenoid biosynthesis in bacterial pathogens. Microbiology 158: 1389–1401. [DOI] [PubMed] [Google Scholar]
- He X, Zheng N, He J, Liu C, Feng J, Jia W, and Li H (2017) Gut Microbiota Modulation Attenuated the Hypolipidemic Effect of Simvastatin in High-Fat/Cholesterol-Diet Fed Mice. J Proteome Res 16: 1900–1910. [DOI] [PMC free article] [PubMed] [Google Scholar]
- Huang YY, Price MN, Hung A, Gal-Oz O, Ho D, Carion H, et al. (2022) Functional screens of barcoded expression libraries uncover new gene functions in carbon utilization among gut Bacteroidales. bioRxiv 2022.10.10.511384 https://www.biorxiv.org/content/10.1101/2022.10.10.511384v2.full. Accessed February 7, 2023. [Google Scholar]
- Kaddurah-Daouk R, Baillie RA, Zhu H, Zeng Z-B, Wiest MM, Nguyen UT, et al. (2011) Enteric microbiome metabolites correlate with response to simvastatin treatment. PLoS One 6: e25482. [DOI] [PMC free article] [PubMed] [Google Scholar]
- Kanehisa M, Sato Y, and Morishima K (2016) BlastKOALA and GhostKOALA: KEGG Tools for Functional Characterization of Genome and Metagenome Sequences. J Mol Biol 428: 726–731. [DOI] [PubMed] [Google Scholar]
- Ko HHT, Lareu RR, Dix BR, and Hughes JD (2017) Statins: antimicrobial resistance breakers or makers? PeerJ 5: e3952. [DOI] [PMC free article] [PubMed] [Google Scholar]
- Lamers RP, Cavallari JF, and Burrows LL (2013) The efflux inhibitor phenylalanine-arginine beta-naphthylamide (PAβN) permeabilizes the outer membrane of gram-negative bacteria. PLoS One 8: e60666. [DOI] [PMC free article] [PubMed] [Google Scholar]
- Langmead B, and Salzberg SL (2012) Fast gapped-read alignment with Bowtie 2. Nat Methods 9: 357–359. [DOI] [PMC free article] [PubMed] [Google Scholar]
- Lechner M, Findeiss S, Steiner L, Marz M, Stadler PF, and Prohaska SJ (2011) Proteinortho: detection of (co-)orthologs in large-scale analysis. BMC Bioinformatics 12: 124. [DOI] [PMC free article] [PubMed] [Google Scholar]
- Liu H, Shiver AL, Price MN, Carlson HK, Trotter VV, Chen Y, et al. (2021) Functional genetics of human gut commensal Bacteroides thetaiotaomicron reveals metabolic requirements for growth across environments. Cell Rep 34: 108789. [DOI] [PMC free article] [PubMed] [Google Scholar]
- Li X-Z, and Nikaido H (2009) Efflux-mediated drug resistance in bacteria: an update. Drugs 69: 1555–1623. [DOI] [PMC free article] [PubMed] [Google Scholar]
- Lomovskaya O, Lewis K, and Matin A (1995) EmrR is a negative regulator of the Escherichia coli multidrug resistance pump EmrAB. J Bacteriol 177: 2328–2334. [DOI] [PMC free article] [PubMed] [Google Scholar]
- Love MI, Huber W, and Anders S (2014) Moderated estimation of fold change and dispersion for RNA-seq data with DESeq2. Genome Biol 15: 550. [DOI] [PMC free article] [PubMed] [Google Scholar]
- Maier L, Pruteanu M, Kuhn M, Zeller G, Telzerow A, Anderson EE, et al. (2018) Extensive impact of non-antibiotic drugs on human gut bacteria. Nature 555: 623–628. [DOI] [PMC free article] [PubMed] [Google Scholar]
- Maurice CF, Haiser HJ, and Turnbaugh PJ (2013) Xenobiotics shape the physiology and gene expression of the active human gut microbiome. Cell 152: 39–50. [DOI] [PMC free article] [PubMed] [Google Scholar]
- McMurdie PJ, and Holmes S (2013) phyloseq: an R package for reproducible interactive analysis and graphics of microbiome census data. PLoS One 8: e61217. [DOI] [PMC free article] [PubMed] [Google Scholar]
- Nayak RR, Alexander M, Deshpande I, Stapleton-Gray K, Rimal B, Patterson AD, et al. (2021) Methotrexate impacts conserved pathways in diverse human gut bacteria leading to decreased host immune activation. Cell Host Microbe 10.1016/j.chom.2020.12.008. [DOI] [PMC free article] [PubMed] [Google Scholar]
- Nikaido H, and Takatsuka Y (2009) Mechanisms of RND multidrug efflux pumps. Biochim Biophys Acta 1794: 769–781. [DOI] [PMC free article] [PubMed] [Google Scholar]
- Okonechnikov K, Golosova O, Fursov M, and UGENE team (2012) Unipro UGENE: a unified bioinformatics toolkit. Bioinformatics 28: 1166–1167. [DOI] [PubMed] [Google Scholar]
- Paradis E, Claude J, and Strimmer K (2004) APE: Analyses of Phylogenetics and Evolution in R language. Bioinformatics 20: 289–290. [DOI] [PubMed] [Google Scholar]
- Perera IC, and Grove A (2010) Molecular mechanisms of ligand-mediated attenuation of DNA binding by MarR family transcriptional regulators. J Mol Cell Biol 2: 243–254. [DOI] [PubMed] [Google Scholar]
- Poole K, Tetro K, Zhao Q, Neshat S, Heinrichs DE, and Bianco N (1996) Expression of the multidrug resistance operon mexA-mexB-oprM in Pseudomonas aeruginosa: mexR encodes a regulator of operon expression. Antimicrob Agents Chemother 40: 2021–2028. [DOI] [PMC free article] [PubMed] [Google Scholar]
- Price MN, Wetmore KM, Waters RJ, Callaghan M, Ray J, Liu H, et al. (2018) Mutant phenotypes for thousands of bacterial genes of unknown function. Nature 557: 503–509. [DOI] [PubMed] [Google Scholar]
- Royce LA, Liu P, Stebbins MJ, Hanson BC, and Jarboe LR (2013) The damaging effects of short chain fatty acids on Escherichia coli membranes. Appl Microbiol Biotechnol 97: 8317–8327. [DOI] [PMC free article] [PubMed] [Google Scholar]
- Sinha R, Stanley G, Gulati GS, Ezran C, Travaglini KJ, Wei E, et al. (2017) Index switching causes “spreading-of-signal” among multiplexed samples in Illumina HiSeq 4000 DNA sequencing. bioRxiv 125724 https://www.biorxiv.org/content/10.1101/125724. Accessed September 6, 2022. [Google Scholar]
- Spanogiannopoulos P, Kyaw TS, Guthrie BGH, Bradley PH, Lee JV, Melamed J, et al. (2022) Host and gut bacteria share metabolic pathways for anti-cancer drug metabolism. Nature Microbiology 7: 1605–1620 10.1038/s41564-022-01226-5. [DOI] [PMC free article] [PubMed] [Google Scholar]
- Sprouffske K, and Wagner A (2016) Growthcurver: an R package for obtaining interpretable metrics from microbial growth curves. BMC Bioinformatics 17: 172. [DOI] [PMC free article] [PubMed] [Google Scholar]
- Srikumar R, Paul CJ, and Poole K (2000) Influence of mutations in the mexR repressor gene on expression of the MexA-MexB-oprM multidrug efflux system of Pseudomonas aeruginosa. J Bacteriol 182: 1410–1414. [DOI] [PMC free article] [PubMed] [Google Scholar]
- Sulavik MC, Gambino LF, and Miller PF (1995) The MarR repressor of the multiple antibiotic resistance (mar) operon in Escherichia coli: prototypic member of a family of bacterial regulatory proteins involved in sensing phenolic compounds. Mol Med 1: 436–446. [PMC free article] [PubMed] [Google Scholar]
- Su Y-B, Kuang S-F, Ye J-Z, Tao J-J, Li H, Peng X-X, and Peng B (2021) Enhanced Biosynthesis of Fatty Acids Is Associated with the Acquisition of Ciprofloxacin Resistance in Edwardsiella tarda. mSystems 6: e0069421. [DOI] [PMC free article] [PubMed] [Google Scholar]
- Vieira-Silva S, Falony G, Belda E, Nielsen T, Aron-Wisnewsky J, Chakaroun R, et al. (2020) Statin therapy is associated with lower prevalence of gut microbiota dysbiosis. Nature 581: 310–315. [DOI] [PubMed] [Google Scholar]
- Wang Q, Garrity GM, Tiedje JM, and Cole JR (2007) Naive Bayesian classifier for rapid assignment of rRNA sequences into the new bacterial taxonomy. Appl Environ Microbiol 73: 5261–5267. [DOI] [PMC free article] [PubMed] [Google Scholar]
- Wetmore KM, Price MN, Waters RJ, Lamson JS, He J, Hoover CA, et al. (2015) Rapid quantification of mutant fitness in diverse bacteria by sequencing randomly bar-coded transposons. MBio 6: e00306–15. [DOI] [PMC free article] [PubMed] [Google Scholar]
- Wickham H (2016) Data Analysis. In ggplot2: Elegant Graphics for Data Analysis. Wickham H (ed.). Springer International Publishing, Cham. pp. 189–201. [Google Scholar]
- Wilmanski T, Kornilov SA, Diener C, Conomos MP, Lovejoy JC, Sebastiani P, et al. (2022) Heterogeneity in statin responses explained by variation in the human gut microbiome. Med (N Y) 3: 388–405.e6. [DOI] [PMC free article] [PubMed] [Google Scholar]
- Wishart DS, Feunang YD, Guo AC, Lo EJ, Marcu A, Grant JR, et al. (2018) DrugBank 5.0: a major update to the DrugBank database for 2018. Nucleic Acids Res 46: D1074–D1082. [DOI] [PMC free article] [PubMed] [Google Scholar]
- Xiong A, Gottman A, Park C, Baetens M, Pandza S, and Matin A (2000) The EmrR protein represses the Escherichia coli emrRAB multidrug resistance operon by directly binding to its promoter region. Antimicrob Agents Chemother 44: 2905–2907. [DOI] [PMC free article] [PubMed] [Google Scholar]
- Xu M, Luo L-L, Du M-Y, Tang L, Zhou J, Hu Y, and Mei H (2022) Simvastatin Improves Outcomes of Endotoxin-induced Coagulopathy by Regulating Intestinal Microenvironment. Curr Med Sci 42: 26–38. [DOI] [PubMed] [Google Scholar]
- Yu G, Lam TT-Y, Zhu H, and Guan Y (2018) Two Methods for Mapping and Visualizing Associated Data on Phylogeny Using Ggtree. Mol Biol Evol 35: 3041–3043. [DOI] [PMC free article] [PubMed] [Google Scholar]
- Yu G, Wang L-G, Han Y, and He Q-Y (2012) clusterProfiler: an R package for comparing biological themes among gene clusters. OMICS 16: 284–287. [DOI] [PMC free article] [PubMed] [Google Scholar]
- Zdobnov EM, and Apweiler R (2001) InterProScan--an integration platform for the signature-recognition methods in InterPro. Bioinformatics 17: 847–848. [DOI] [PubMed] [Google Scholar]
- Zhang P, Zhang X, Huang Y, Chen J, Shang W, Shi G, et al. (2021) Atorvastatin alleviates microglia-mediated neuroinflammation via modulating the microbial composition and the intestinal barrier function in ischemic stroke mice. Free Radic Biol Med 162: 104–117. [DOI] [PubMed] [Google Scholar]
- Zhernakova A, Kurilshikov A, Bonder MJ, Tigchelaar EF, Schirmer M, Vatanen T, et al. (2016) Population-based metagenomics analysis reveals markers for gut microbiome composition and diversity. Science 352: 565–569. [DOI] [PMC free article] [PubMed] [Google Scholar]
- Zou L, Spanogiannopoulos P, Pieper LM, Chien H-C, Cai W, Khuri N, et al. (2020) Bacterial metabolism rescues the inhibition of intestinal drug absorption by food and drug additives. Proc Natl Acad Sci U S A 117: 16009–16018. [DOI] [PMC free article] [PubMed] [Google Scholar]
Associated Data
This section collects any data citations, data availability statements, or supplementary materials included in this article.
Supplementary Materials
Data Availability Statement
Sequencing data is available under NCBI BioProject PRJNA925231.