

Summary
Phospholipids containing a single polyunsaturated fatty acyl tail (PL-PUFA1s) are considered the driving force behind ferroptosis, while phospholipids with diacyl-PUFA tails (PL-PUFA2s) have been rarely characterized. Dietary lipids modulate ferroptosis, but the mechanisms governing lipid metabolism and ferroptosis sensitivity is not well understood. Our research revealed a significant accumulation of diacyl-PUFA phosphatidylcholines (PC-PUFA2s) following fatty acid or phospholipid treatments, correlating with cancer cell sensitivity to ferroptosis. Depletion of PC-PUFA2s occurred in aging and Huntington’s disease brain tissue, linking it to ferroptosis. Notably, PC-PUFA2s interacted with the mitochondrial electron transport chain, generating reactive oxygen species (ROS) for initiating lipid peroxidation. Mitochondria-targeted antioxidants protected cells from PC-PUFA2-induced mitochondrial ROS, lipid peroxidation, and cell death. These findings reveal a critical role for PC-PUFA2s in controlling mitochondria homeostasis and ferroptosis in various contexts, and explain the ferroptosis-modulating mechanisms of free fatty acids. PC-PUFA2s may serve as diagnostic and therapeutic targets for modulating ferroptosis.
Keywords: Polyunsaturated fatty acid, PUFA, phospholipid, mitochondria, electron transport chain, ROS, ferroptosis, lipids
Graphical Abstract

In Brief
Due to their higher abundance, mixed-acyl phospholipids have long been considered the general drivers of lipid peroxidation and ferroptosis. Qiu et al., however, report that a minor phospholipid species with two polyunsaturated fatty acyl tails is a key driver of ferroptosis in mammalian cells.
Introduction
Phospholipids are the basic building blocks of lipid bilayers that constitute cellular membranes. Membrane phospholipids are classified by their head groups, and include phosphatidylcholine (PC), phosphatidylethanolamine (PE), phosphatidylserine (PS), phosphatidylinositol (PI), and phosphatidic acid (PA), among which PC is the most abundant species in mammalian cell membranes1,2. For most phospholipids, the sn1 position of glycerol backbone often contains a saturated fatty acyl tail, such as palmitic acid (C16:0) or stearic acid (C18:0), while the sn2 position has greater diversity, containing either a saturated fatty acyl (SFA), a monounsaturated fatty acyl (MUFA), or a polyunsaturated fatty acyl (PUFA) tail. Phospholipids with PUFA tails in both sn1 and sn2 positions (PL-PUFA2s; diacyl-PUFA phospholipids) are uncommon lipid species3. While little is known about the functions of PL-PUFA2s, a few studies found them to be physiologically relevant. Diacyl-PUFA diglyceride containing arachidonoyl tails (C20:4) was first discovered by Siegel et al. in 1981 from rat neutrophils treated with arachidonic acid4. PC(20:4, 20:4) was then identified to be a unique species that rapidly increased after treatment with arachidonic acid5,6. Diacyl-PUFA phosphatidylcholine was found to be most potent in reducing mammalian cell proliferation in comparison with other mixed-acyl phosphatidylcholine species7. The predominant model of PL-PUFA2 function is as a transiently increased carrier of PUFAs that serve as a mobile source of PUFAs for transfer to the sn2 position of other phospholipids5.
Ferroptosis is an iron-dependent non-apoptotic form of cell death resulting from extensive lipid peroxidation that overwhelms lipid protection mechanisms. Phospholipids containing PUFA tails are particularly susceptible to peroxidation at bis-allylic carbons. Long-chain ϖ−6 and ϖ −3 PUFAs, such as arachidonic acid (ARA; C20:4) and docosahexaenoic acid (DHA; C22:6), which contain multiple double bonds, are particularly able to facilitate ferroptosis8,9.
Since mammalian cells are not able to synthesize long-chain PUFAs, dietary PUFAs serve as important sources of intracellular PUFA-containing lipids10. Dietary supplementation with free PUFAs sensitizes cells to ferroptosis, while supplementation with MUFAs inhibited ferroptosis through an unknown mechanism11. PUFAs needs to be activated by acyl-coenzyme A synthetase long-chain family member 4 (ACSL4) and incorporated into phospholipids by lysophospholipid acyltransferases (e.g., LPCAT3) to drive ferroptosis12,13. PL-PUFAs undergo peroxidation by labile iron and iron-containing enzymes to produce phospholipid hydroperoxides (PL-PUFA-OOHs) that spread quickly in membrane through oxidative chain reaction14. Lipid repair mechanisms suppressing ferroptosis include the glutathione-GPX4 pathway that reduces PL-PUFA-OOH to PL-PUFA-OH and the phospholipase A2 pathway that cleaves oxidized PUFA tails from PL-PUFA-OOHs to generate lysophospholipids15. In addition, monounsaturated fatty acids (MUFAs) are potent inhibitors of ferroptosis, but the mechanism by which they protect from ferroptosis is unknown.
Due to the higher abundance of mixed-acyl phospholipids in mammalian cells, PL-PUFA1s have long been considered the general reactant of lipid peroxidation and driver of ferroptosis. However, we found that the ability of the GTP cyclohydrolase-1 (GCH1)/BH4 axis to protect cells from ferroptosis was correlated with peroxidation and cleavage of specific PL-PUFA2 species16. GCH1 overexpression did not prevent the oxidation of most PL-PUFA1s, and yet exerted an overall protective effect against ferroptosis. This suggested that PL-PUFA2s rather than PL-PUFA1s play a key role in executing ferroptosis. However, the general role of phospholipids with two PUFA tails in cell death, and the specific mechanism by which they might function in ferroptosis is enigmatic.
Different subcellular organelles play distinct roles in the execution of ferroptosis. The endoplasmic reticulum (ER) has been shown to be a key site of lipid peroxidation in response to treatment with three classes of ferroptosis inducers, RSL3, FIN56, and FINO217. Upon cysteine starvation or treatment with system xc− inhibitors, such as erastin or IKE, however, mitochondria play a role in initiating and amplifying ferroptosis, although they are not strictly required for cell death18,19. The radical trapping lipid peroxidation and ferroptosis inhibitor, ferrostatin-1, accumulates in mitochondria, lysosomes, and ER to suppress lipid peroxidation; localization in mitochondria protects against ferroptosis induced by cysteine starvation or system xc− inhibitors, while ER localization protects against all classes of small molecule ferroptosis inducers20. Mitochondria thus play an important role in promoting ferroptosis through the generation of mitochondrial reactive oxygen species (ROS), labile iron, and perhaps more generally through the disruption of mitochondrial-driven metabolic homeostasis21,22. The mitochondrial electron transport chain (ETC) is a key part of cellular energy-producing machinery and the major site of ROS production that drives oxidative stress in cells23. In addition, mitochondria-targeted antioxidants prevent ferroptosis induced by system xc− inhibition or GPX4 inhibition24. ROS produced by ETC complex I, but not complex III, has been shown to induce lipid peroxidation in mitochondria that leads to ferroptosis25. Hence, mitochondria are key players in ferroptosis in response to cysteine withdrawal, but the mechanism by which ferroptosis is triggered in mitochondria is not known.
Here, we identified PC-PUFA2 as a specific lipid class that drives ferroptosis through the initiation of ROS production in mitochondria and lipid peroxidation in ER. We found that PC-PUFA2 rapidly accumulated upon free PUFA treatment, supporting their role in regulating membrane PUFA content and ferroptosis sensitivity. MUFA selectively reduced PC-PUFA2 synthesis that reversed the effect of free PUFA. We found that PC-PUFA2s specifically interact with the mitochondrial ETC, where they induce production of ROS that further induce massive lipid peroxidation in the ER. Mitochondria-targeted antioxidants were sufficient to block ferroptosis in response to PC-PUFA2 treatment. Hence, these results illuminate a critical and unstudied lipid class that acts as a key driver of ferroptosis, and help shed light on four longstanding aspects of ferroptosis—how mitochondria promote ferroptosis, how free PUFAs promote ferroptosis, why MUFAs suppress ferroptosis, and how ACSL4 is involved in fatty acid metabolism.
Results
PC-PUFA2s induce ferroptosis
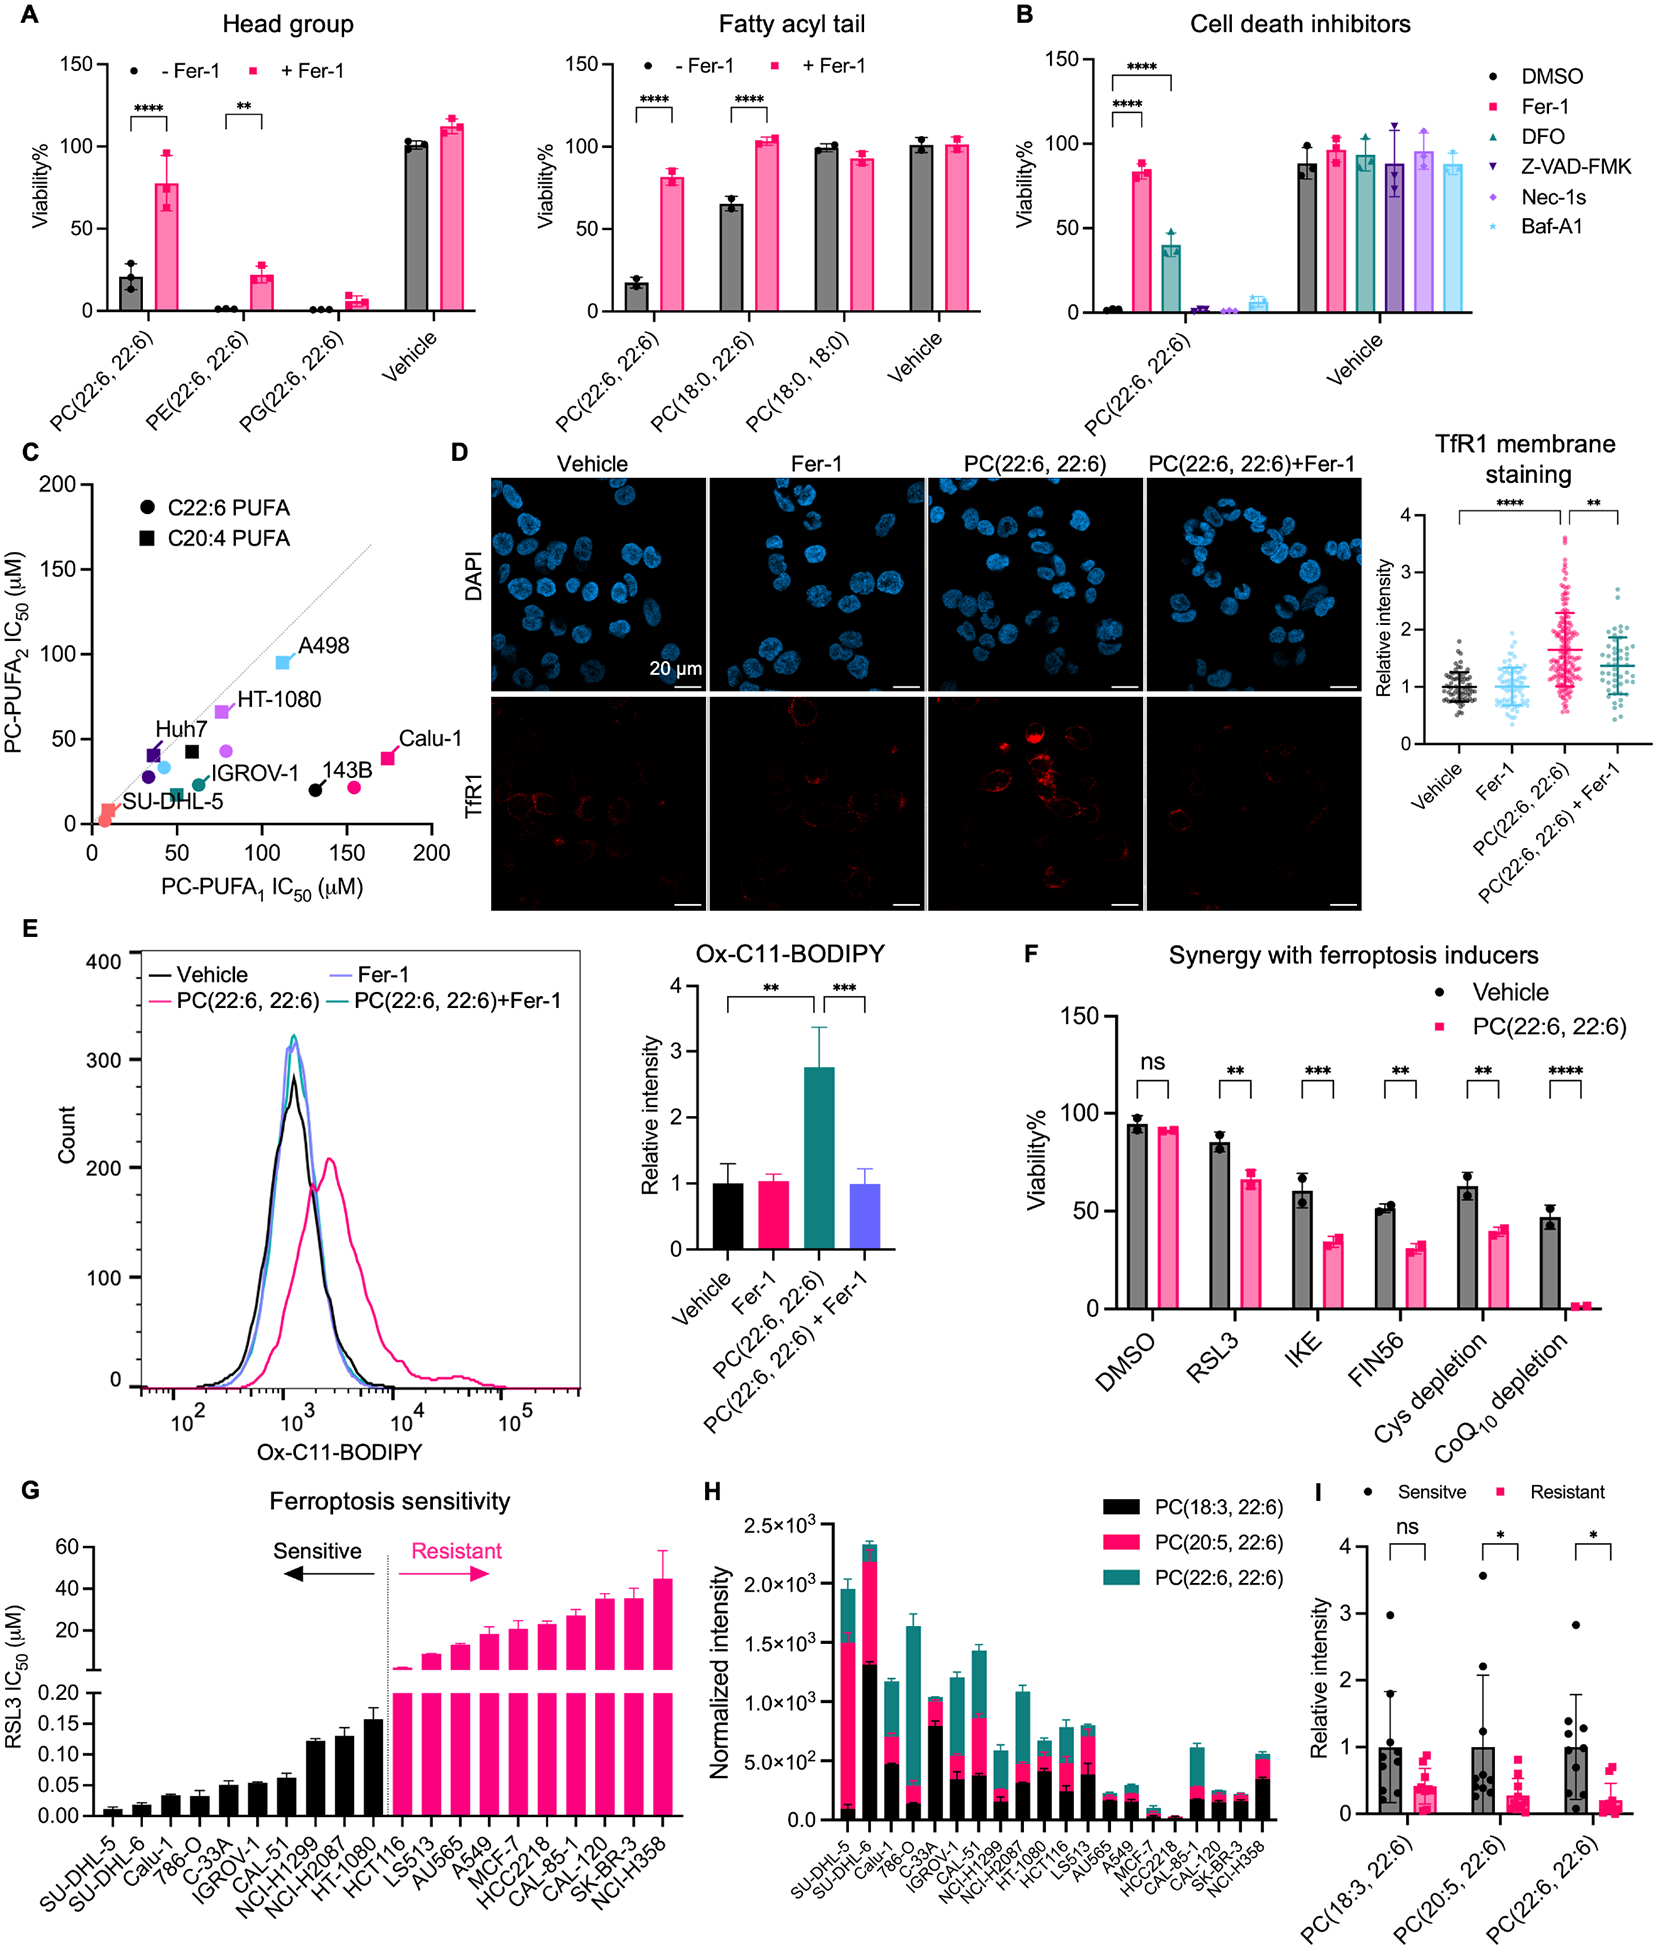
To investigate the mechanism of phospholipid-regulated ferroptosis, we supplemented multiple cancer cell lines in culture with different phospholipid species and measured the impact of each on cell viability. We observed a differential reduction in cell viability caused by phospholipid species that differ in head groups and fatty acyl tails (Figure 1A, S1A). Phosphatidylcholines had the highest potency and specificity for inducing ferroptosis compared to PEs, PGs, and PSs, indicated by a complete rescue in the presence of the ferroptosis inhibitor, ferrostatin-1. In comparison with PCs containing one PUFA tail (PC-PUFA1s), PCs with two PUFA tails (PC-PUFA2s) exhibited much higher potency for ferroptosis that could not be simply explained by the presence of two equivalents of PUFA (Figure 1C). Among the numerous cancer cell lines tested, the ovarian cancer cell line IGROV-1, the non-small cell lung cancer cell line Calu-1, and the fibrosarcoma cell line HT-1080 were particularly sensitive to PC-PUFA2s treatment and were selected for additional experiments.
Figure 1.
PC-PUFA2s induce ferroptosis.
A, Viability of A549 cells (left) and IGROV-1 cells (right) treated with 50 μM phospholipids with different head groups and fatty acyl tails with or without 10 μM ferrostatin-1 (Fer-1) for 24 hr. B, Viability of IGROV-1 cells co-treated with 50 μM PC(22:6, 22:6) and 10 μM Fer-1, 100 μM deferoxamine (DFO), 20 μM Z-VAD-FMK, 20 μM necrostatin-1s (Nec-1s), or 100 nM bafilomycin A1 (Baf-A1) for 24 hr. C, IC50 of PC-PUFA2 with two C22:6 or C20:4 tails versus PC-PUFA1 with one C18:0 tail and one of the C22:6 or C20:4 PUFA tail in multiple cancer cell lines. Each color represents a cell line. D, IGROV-1 cells treated with vehicle, 10 μM Fer-1 alone, or 100 μM PC(22:6, 22:6) with or without 10 μM Fer-1 for 4 hr were stained with TfR1 antibody. Immunofluorescent images showing nucleus DAPI and TfR1 stain. Scale bar is shown as 20 μm. The relative mean fluorescence intensity of TfR1 membrane staining compared to vehicle is plotted as mean ± SD. Each dot represents a cell. n=50–164 for all groups. E, Lipid peroxidation measured by C11-BODIPY581/591 in IGROV-1 cells treated with 100 μM PC(22:6, 22:6) with or without 20 μM ferrostatin-1 for 4 hr. The relative mean fluorescence intensity of oxidized C11-BODIPY581/591 compared to vehicle is plotted as mean ± SD of n=3 biological replicates. F, HT-1080 cells were co-treated with 12.5 μM PC(22:6, 22:6) and ferroptosis inducers (RSL3 15.6 nM, IKE 0.63 μM, FIN56 10 μM, media cystine concentration 6.25 μM, CoQ10 complete depletion) for 24 hr. Data plotted as mean ± SD of n=2 technical replicates. G, RSL3 IC50 in 20 cancer cell lines. Data plotted as mean ± SD of n=2 biological replicates. H, The signal intensity of PCs normalized to protein concentration of each cell sample is plotted as mean ± SD of n=3 biological replicates. I, Statistical analysis of PC abundances between ferroptosis-sensitive and resistant cells. Data plotted as mean ± SD of n=10 for each group. One-way and two-way ANOVA: p<0.03 (*), p<0.002 (**), p<0.0002 (***), p<0.0001 (****). See also Figure S1 and Table S1.
To investigate whether other forms of cell death were involved in the lethal effects of phospholipids, we co-treated cells with PC-PUFA2s and different cell death inhibitors, including the apoptosis inhibitor Z-VAD-FMK, the necroptosis inhibitor necrostatin-1s, the autophagy inhibitor bafilomycin A1, and the ferroptosis inhibitors ferrostatin-1 and deferoxamine; only the ferroptosis inhibitors prevented PC-PUFA2-induced cell death (Figure 1B, S1B). In addition, PC-PUFA2 treatment did not initiate caspase-3 cleavage or mixed lineage kinase domain-like protein (MLKL) phosphorylation, which are signatures of apoptosis and necroptosis, respectively (Figure S1E). In contrast, IGROV-1 cells treated with PC-PUFA2s displayed a significant increase of the ferroptosis marker, transferrin receptor-1 translocation to the plasma membrane, which was reversible upon ferrostatin-1 co-treatment (Figure 1D, S1C)26. PC-PUFA2 treatment also increased lipid peroxide accumulation in cells, measured by the fluorescent probe C11-BODIPY, that exhibited a shifted emission spectrum upon oxidation by lipid peroxides (Figure 1E, S1D). The lipid peroxidation induced by PC-PUFA2s was inhibited by co-treatment with ferrostatin-1. Moreover, co-treatment of PC-PUFA2s synergized with all ferroptosis inducers tested, including RSL3, IKE, FIN56, cysteine deprivation, and CoQ10 deprivation, except for FINO2 which may oxidize extracellular PC-PUFA2 before cellular uptake (Figure 1F, S1F)27. Together, these data support the notion that PL-PUFA2s, specifically PC-PUFA2s, act as potent ferroptosis-inducing phospholipids.
To further understand the physiological role of PC-PUFA2 in ferroptosis, we investigated the basal level of PC-PUFA2 in ferroptosis-sensitive and ferroptosis-resistant cancer cell lines. We collected 20 different cell lines and measured their sensitivity to RSL3. Ferroptosis-resistant cell lines showed a separation from ferroptosis-sensitive cell lines, reflected by >100-fold increases in RSL3 IC50 (Figure 1G). We measured the basal levels of diacyl-PUFA and monoacyl-PUFA phospholipids using LC-MS-based targeted lipidomics in these cell lines cultured in normal media. Without ferroptosis induction, we detected significantly higher abundance of PC-PUFA2s in sensitive cell lines compared with resistant cell lines (Figure 1H, I). The abundance of monoacyl-PUFA-PL abundance was not significantly different among these two groups (Figure S1G). Despite the difference in tissue-dependent expression of other ferroptosis regulators, the abundance of PC-PUFA2s strongly correlated with cell sensitivity to ferroptosis.
We further examined PC-PUFA2 as a diagnostic marker in aging and ferroptosis-related diseases. By reanalyzing published lipidomics dataset (DOI: 10.21228/M8C68D) from a study using aged mouse brain, we selected all annotated phospholipid species and compared the abundance of PC-PUFAs between 3-week-old (n=16) and 59-week-old mice (n=16)28. We found a strong depletion of diacyl-PUFA-PLs in the hippocampus of 59-week-old mice, while the changes in monoacyl-PUFA-PLs were not consistent (Figure S1I). In addition, lysophospholipid species increased in 59-week-old mice compared to 3-week-old mice, suggesting oxidation of PL-PUFAs, followed by cleavage of PUFA tails by phospholipases during ferroptosis (Figure S1H)29.
Ferroptosis has been implicated in aging-related neurodegenerative diseases30. In particular, the hippocampus, a major brain structure involved in learning and memory, has been shown to selectively accumulate iron during aging that increases the risk of ferroptosis31. Our analysis suggests that PC-PUFA2 are more sensitive to oxidation and may contribute to ferroptosis propagation and age-related diseases.
Furthermore, we performed targeted lipidomics on the caudate nucleus tissue from Huntington’s Disease (HD) patients (n=21) and age-matched control patients (n=25) (Table S1). The HD cases were selected based on the neuropathology of the brain during both gross and microscopic examinations. The brain tissues of control patients were unaffected. We detected a significant depletion of PL-PUFA2s in HD tissue compared to normal brain tissue, suggesting lipid dysregulation and oxidation associated with HD neuropathology (Figure S1J). Overall, we found strong relevance of diacyl-PUFA phospholipids for ferroptosis during both physiological and pathological conditions, which suggests the potential of PL-PUFA2s as ferroptosis biomarkers.
Dietary PC-PUFA2s are remodeled into the cell lipidome
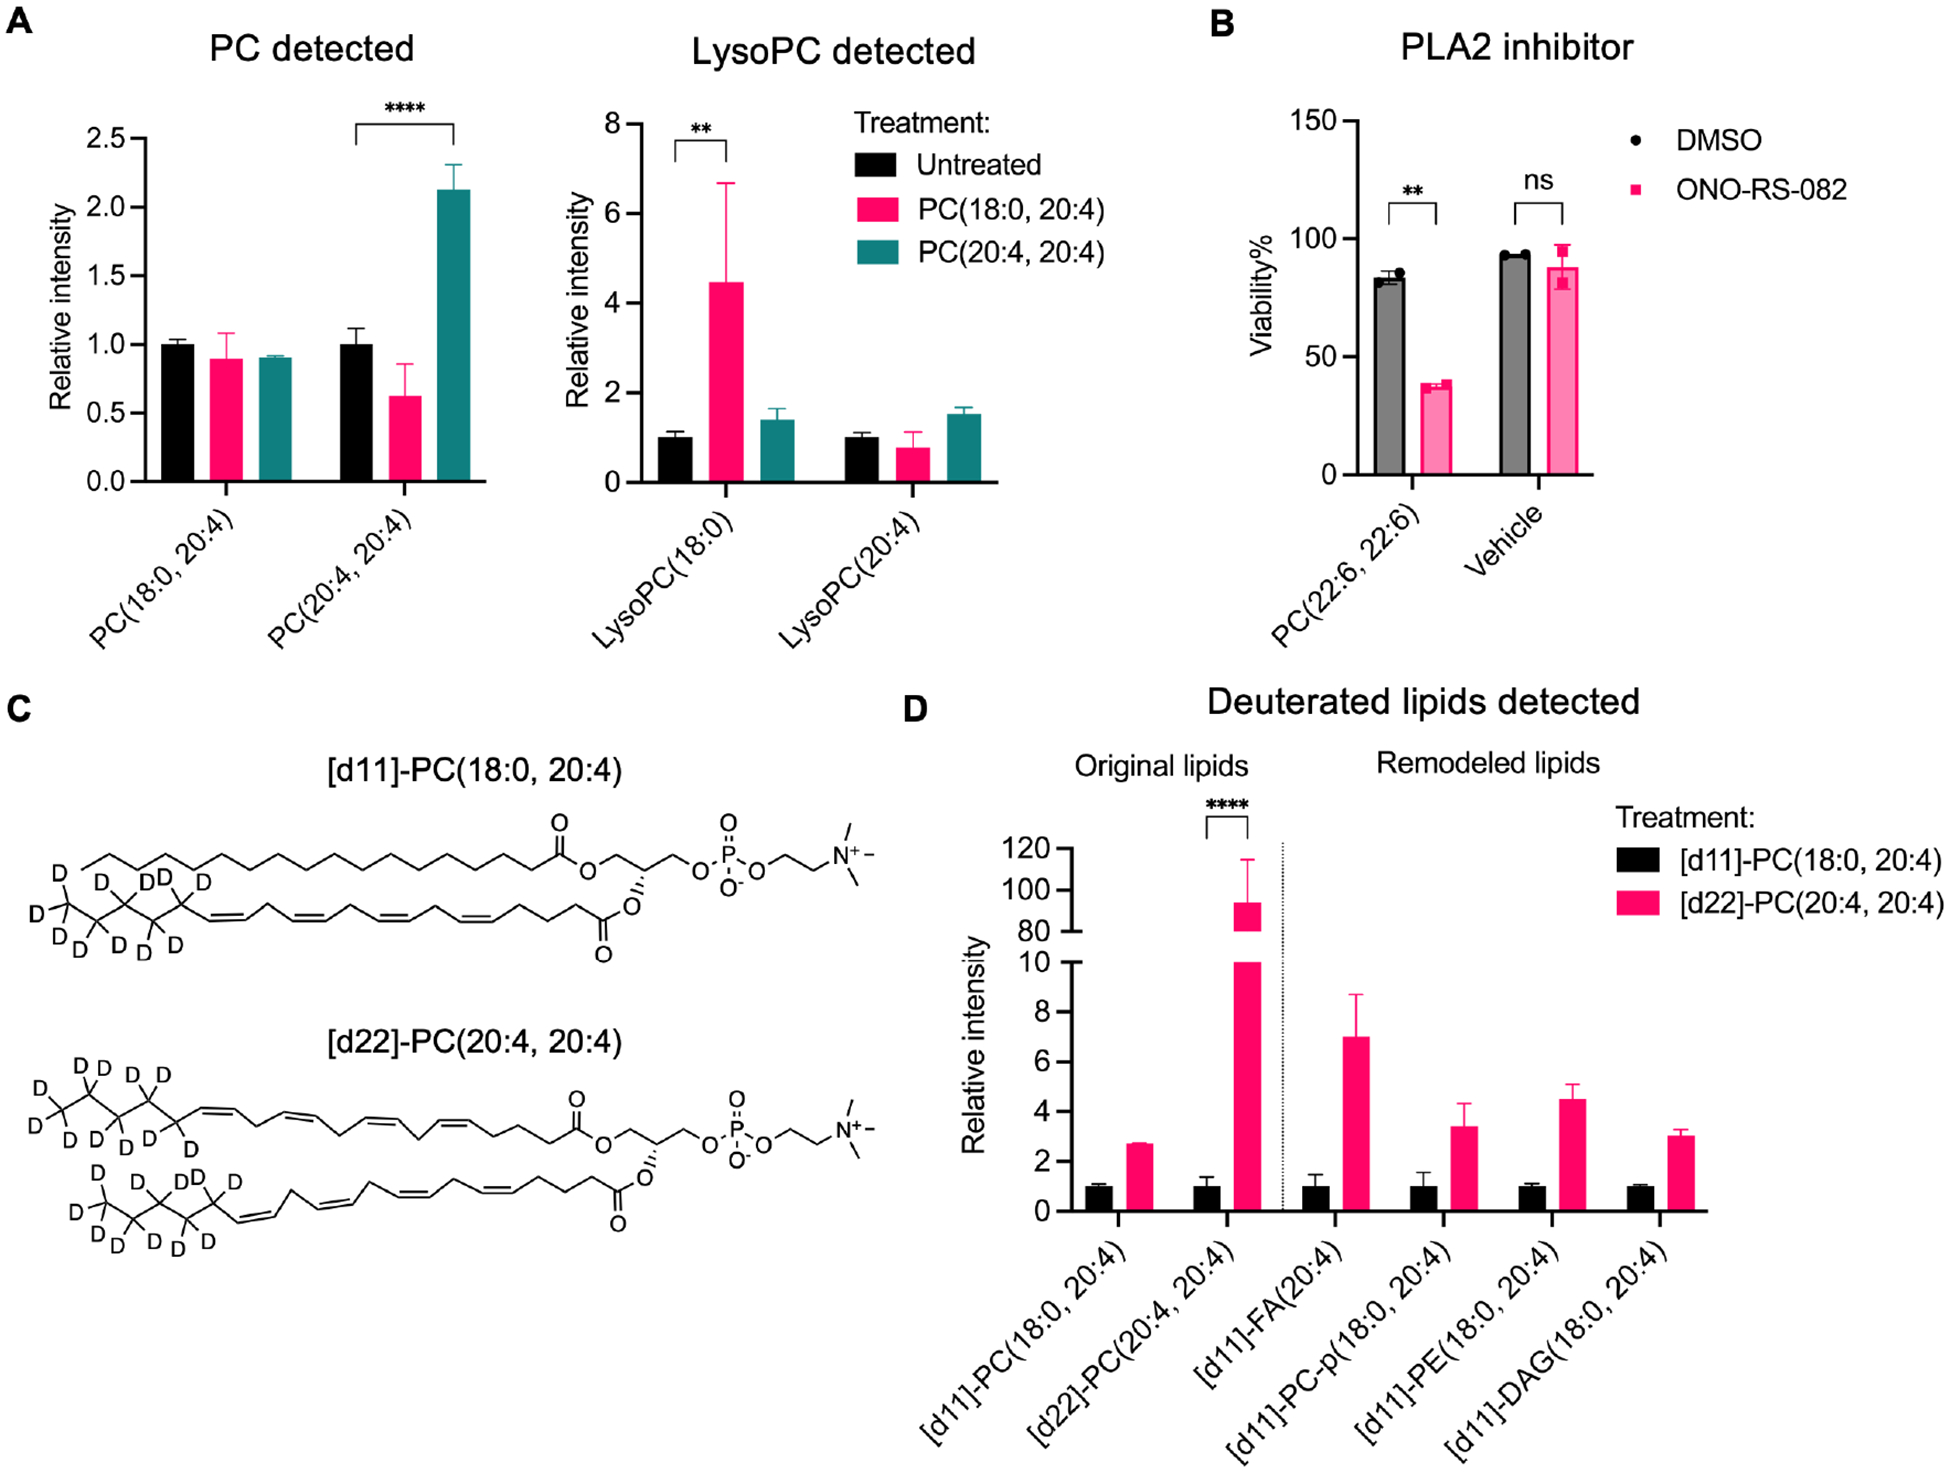
To investigate whether exogenous PC-PUFA2s, such as when consumed as dietary phospholipids, were incorporated into cells, we extracted lipids from IGROV-1 cells treated with sublethal amount of PC-PUFA2 and utilized LC-MS-based lipidomics to detect the accumulation of lipids. Cells treated with PL-PUFA1 such as PC(18:0, 20:4) had increased lysoPC(18:0) which was likely produced by cleavage of the PUFA tail at the sn2 position, while no significant accumulation of the original PC(18:0, 20:4) was observed (Figure 2A). In contrast, exogenous diacyl-PUFA phospholipids including PC, PS, and PG were maintained relatively intact in cells (Figure 2A, S2B). We observed a less accumulation of lysoPC(20:4) results in PC(20:4, 20:4) treatment than PC(18:0, 20:4) treatment, which could be due to either lower susceptibility of PC(20:4, 20:4) to cleavage by phospholipase A2s or rapid recycling of some lysoPC(20:4) to other lipid species. Treatment with phospholipase A2 inhibitor sensitized IGROV-1 cells to PC-PUFA2s, highlighting the rapid remodeling of PC-PUFA2s, but not lower reactivity with phospholipase A2s that accounted for lysoPC depletion (Figure 2B). We did not detect conversion to PE species after either PC-PUFA1 of PC-PUFA2 treatment (Figure S2A).
Figure 2.
Dietary PC-PUFA2s are remodeled into the cell lipidome.
A, A498 cells were treated with 25 μM PC(18:0, 20:4) or PC(20:4, 20:4) for 6 hr. The relative abundance of PCs and lysoPCs compared to untreated group is plotted as mean ± SD of n=3 biological replicates. B, Viability of IGROV-1 cells co-treated with 6.25 μM PC(22:6, 22:6) and 30 μM PLA2 inhibitor, ONO-RS-082 for 24 hr. Data plotted as mean ± SD of n=2 technical replicates. C, Structures of deuterated PCs. D, IGROV-1 cells were treated with 25 μM [d11]-PC(18:0, 20:4) or [d22]-PC(20:4, 20:4) for 6 hr. The relative abundance of original and remodeled deuterated lipid species compared to [d11]-PC(18:0, 20:4)-treated group is plotted as mean ± SD of n=4 biological replicates. Two-way ANOVA: p<0.03 (*), p<0.002 (**), p<0.0002 (***), p<0.0001 (****). See also Figure S2.
To elucidate the remodeling of PC-PUFA2s, we designed phospholipids deuterated in the fatty acyl tails, but not at the bis-allylic positions: these deuterium labels were thus for tracking purposes, but not inhibiting lipid peroxidation (Figure 2C)17. Cells treated with a deuterated PC-PUFA2, [d22]-PC(20:4, 20:4), exhibited significant accumulation of [d22]-PC(20:4, 20:4) species and greater incorporation of deuterium-labeled PUFAs in other lipid classes, including PEs and DAGs, in comparison with [d11]-PC(18:0, 20:4)-treated cells (Figure 2D). Of note, [d11]-PC(18:0, 20:4) treatment stimulated metabolism of non-labeled PC(18:0, 20:4) and lysoPC(18:0), which was, however, still not enough to compete with [d22]-PC(20:4, 20:4) potency (Figure S2C, D). Indeed, these results suggest that PC-PUFA2s were incorporated into the cell and sculpted a pro-ferroptosis lipid profile.
PC-PUFA2 is involved in dietary fatty acid remodeling
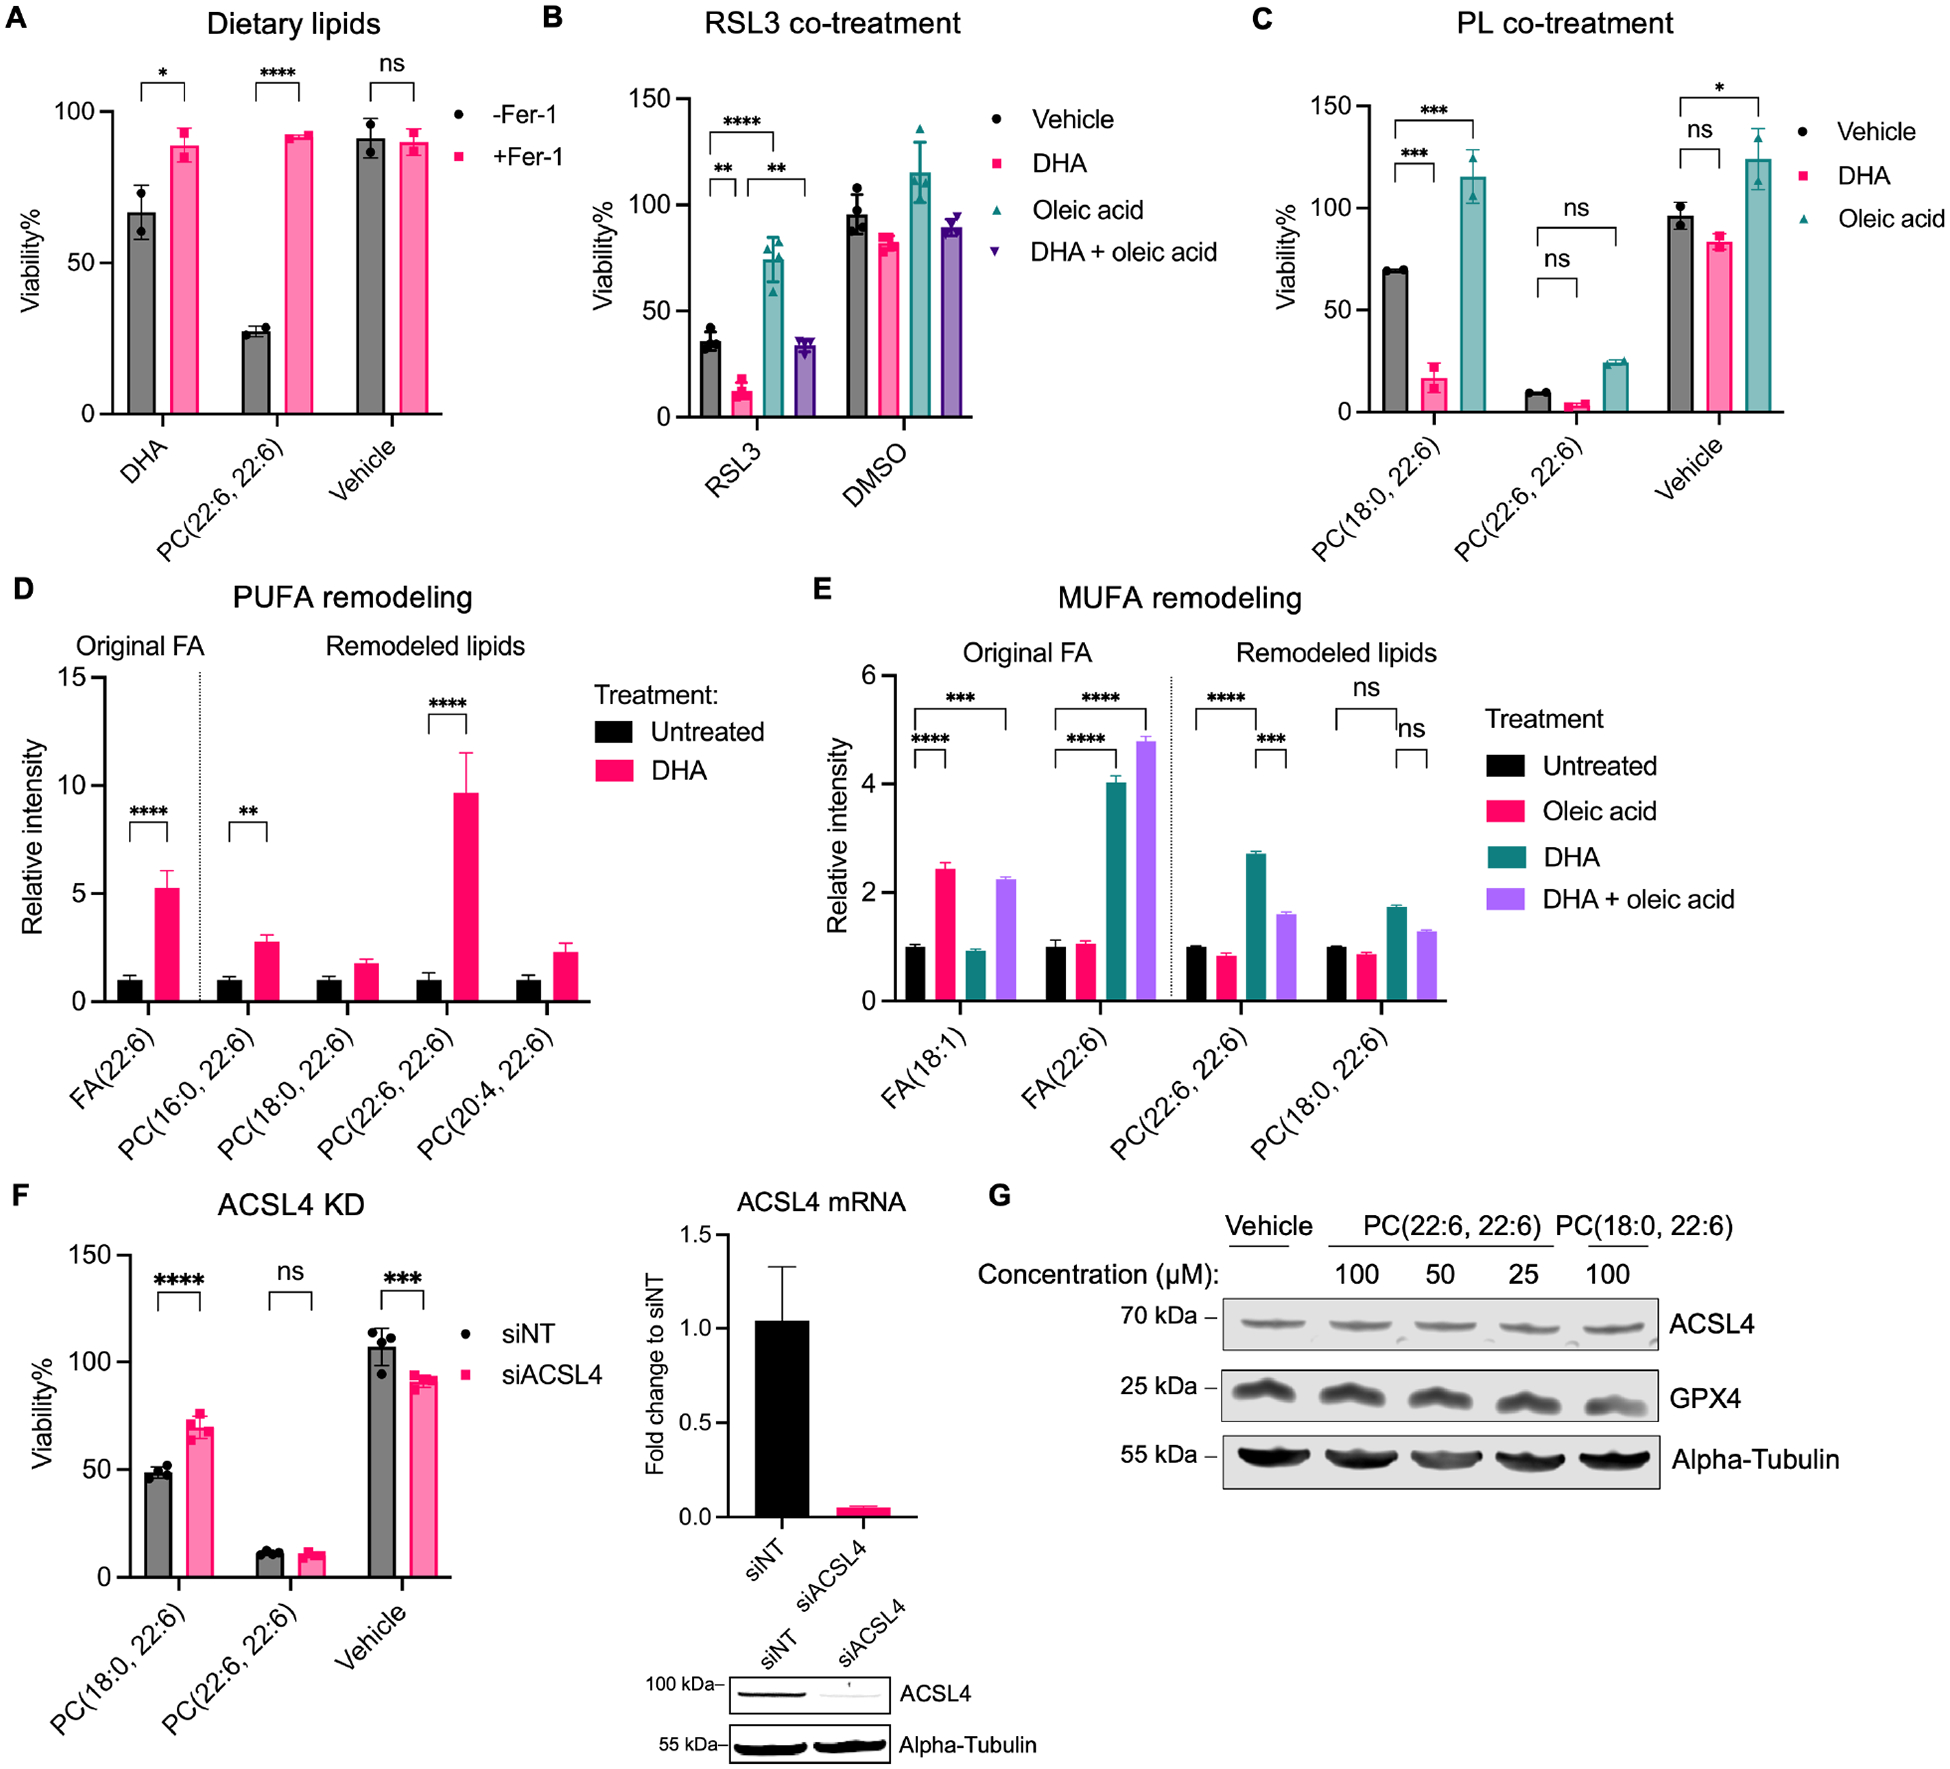
From the lipidomic analysis of phospholipid remodeling, we observed an increase in free PUFAs in PC-PUFA2-treated cells. We hypothesized that there might be an equilibrium between free PUFAs and PC-PUFA2s. Free PUFAs were less potent than PC-PUFA2s in inducing ferroptosis, but sensitized cells to RSL3-induced ferroptosis (Figure 3A, B). Co-treatment with free PUFAs had a larger synergistic effect with PC-PUFA1s than PC-PUFA2s in Calu-1 cells (Figure 3C). These results suggest that free PUFA and PC-PUFA1 may serve as precursors to form PC-PUFA2 that initiates ferroptosis.
Figure 3.
PC-PUFA2 is involved in dietary fatty acid remodeling.
A, Viability of IGROV-1 cells treated with 50 μM DHA or PC(22:6, 22:6) with or without 10 μM Fer-1 for 24 hr. Data plotted as mean ± SD of n=2 technical replicates. B, Viability of IGROV-1 cells pre-treated with 25 μM DHA, or 50 μM oleic acid, or both DHA and oleic acid for 24 hr and then treated with 31.3 nM RSL3 for 24 hr. Data plotted as mean ± SD of n=4 technical replicates. C, Viability of Calu-1 cells pre-treated with 25 μM DHA, or 50 μM oleic acid for 24 hr and then treated with 25 μM PC for 24 hr. Data plotted as mean ± SD of n=2 technical replicates. D, IGROV-1 cells were treated with 25 μM DHA for 6 hr. The relative abundance of lipids compared to untreated group is plotted as mean ± SD of n=3 biological replicates. E, IGROV-1 cells were treated with 25 μM DHA, or 50 μM oleic acid, or both DHA and oleic acid for 6 hr. The relative abundance of lipids compared to untreated group is plotted as mean ± SD of n=3 biological replicates. F, Calu-1 cells were knockdown using pooled siRNA containing 4 different sequences targeting ACSL4 and then treated with 50 μM PCs for 24 hr. Viability is compared to vehicle-treated group and is plotted as mean ± SD of n=4 technical replicates. The knockdown efficiency was confirmed by qPCR and western blot. G, IGROV-1 cells were treated with PCs or vehicle for 5 hr and whole-cell lysate was analyzed for western blot detection of GPX4 and ACSL4. Two-way ANOVA: p<0.03 (*), p<0.002 (**), p<0.0002 (***), p<0.0001 (****). See also Figure S3.
MUFA incorporation has been shown to protect cells from ferroptosis11. Oleic acid (C18:1) treatment fully prevented cell death induced by PC-PUFA1 and RSL3, but only partially protected from cell death induced by PC-PUFA2 (Figure 3B, C). When cells were co-treated with both DHA (C22:6) and oleic acid, the ferroptosis-sensitizing effect of DHA was compromised by oleic acid (Figure 3B).
To investigate the mechanism by which dietary free fatty acids, PUFA and MUFA, modulate ferroptosis, we conducted targeted lipidomic analysis on IGROV-1 cells treated with PUFA and MUFA. When cells were treated with PUFA alone, we observed a significant increase of PC-PUFA2s in both DHA-treated and ARA-treated cells (Figure 3D, S3A). PC-PUFA2s containing ARA (C20:4) tails—PC(20:4, 20:4) and PC(20:4, 22:6)—experienced fast cleavage, reflected by the further accumulation when co-treated with phospholipase A2 inhibitor, ONO-RS-082. PC-PUFA2 containing DHA (22:6) tails—PC(22:6, 22:6)—was relatively stable in cells (Figure S3A). This can be rationalized as exogenous PC(22:6, 22:6) being more potent for inducing ferroptosis than PC(20:4, 20:4). In contrast, PE-PUFA species were not significantly changed after PUFA treatment (Figure S3A). These results confirmed the enrichment of PC-PUFA2s upon free PUFA supplementation and highlighted their relevance to ferroptosis triggered by free PUFAs.
Next, we analyzed cells co-treated with MUFA and PUFA. Oleic acid slightly reduces PC(22:6, 22:6) levels when treated alone but more significantly when co-treated with DHA. This is consistent with cell viability data showing that oleic acid can mitigate the ferroptosis-sensitizing effect of DHA. PC-PUFA1—PC(18:0, 22:6)—was not significantly changed by dietary fatty acids. Both dietary fatty acids were detected in treated cells, suggesting effective intracellular fatty acid uptake (Figure 3D, E). In summary, we confirmed that PC-PUFA2 synthesis is required for the sensitizing effect of dietary PUFAs, and selective blocking of PC-PUFA2 synthesis is likely part of the ferroptosis-inhibitory effect of MUFAs such as oleic acid.
ACSL4 catalyzes the ligation of acyl-coenzyme A (acyl-CoA) to long-chain PUFAs, especially arachidonic acid and adrenic acid, which facilitates their incorporation into phospholipids13. Knockdown of ACSL4 by a pool of small interfering RNAs or by CRISPR partially protected cells from PC-PUFA1s but did not affect the lethality of PC-PUFA2s (Figure 3F, S3B). In addition, PC-PUFA2 treatment did not affect the protein levels of ferroptosis regulators, GPX4 and ACSL4 (Figure 3G). These data further support that PC-PUFA2s readily induce ferroptosis, downstream of lipid metabolism by ACSL4. Thus, PC-PUFA2s are downstream of necessary PUFA incorporation, implicating PC-PUFA2s as proximal mediators of ferroptotic cell death.
PL-PUFA2s exhibit interaction with mitochondrial electron transport chain
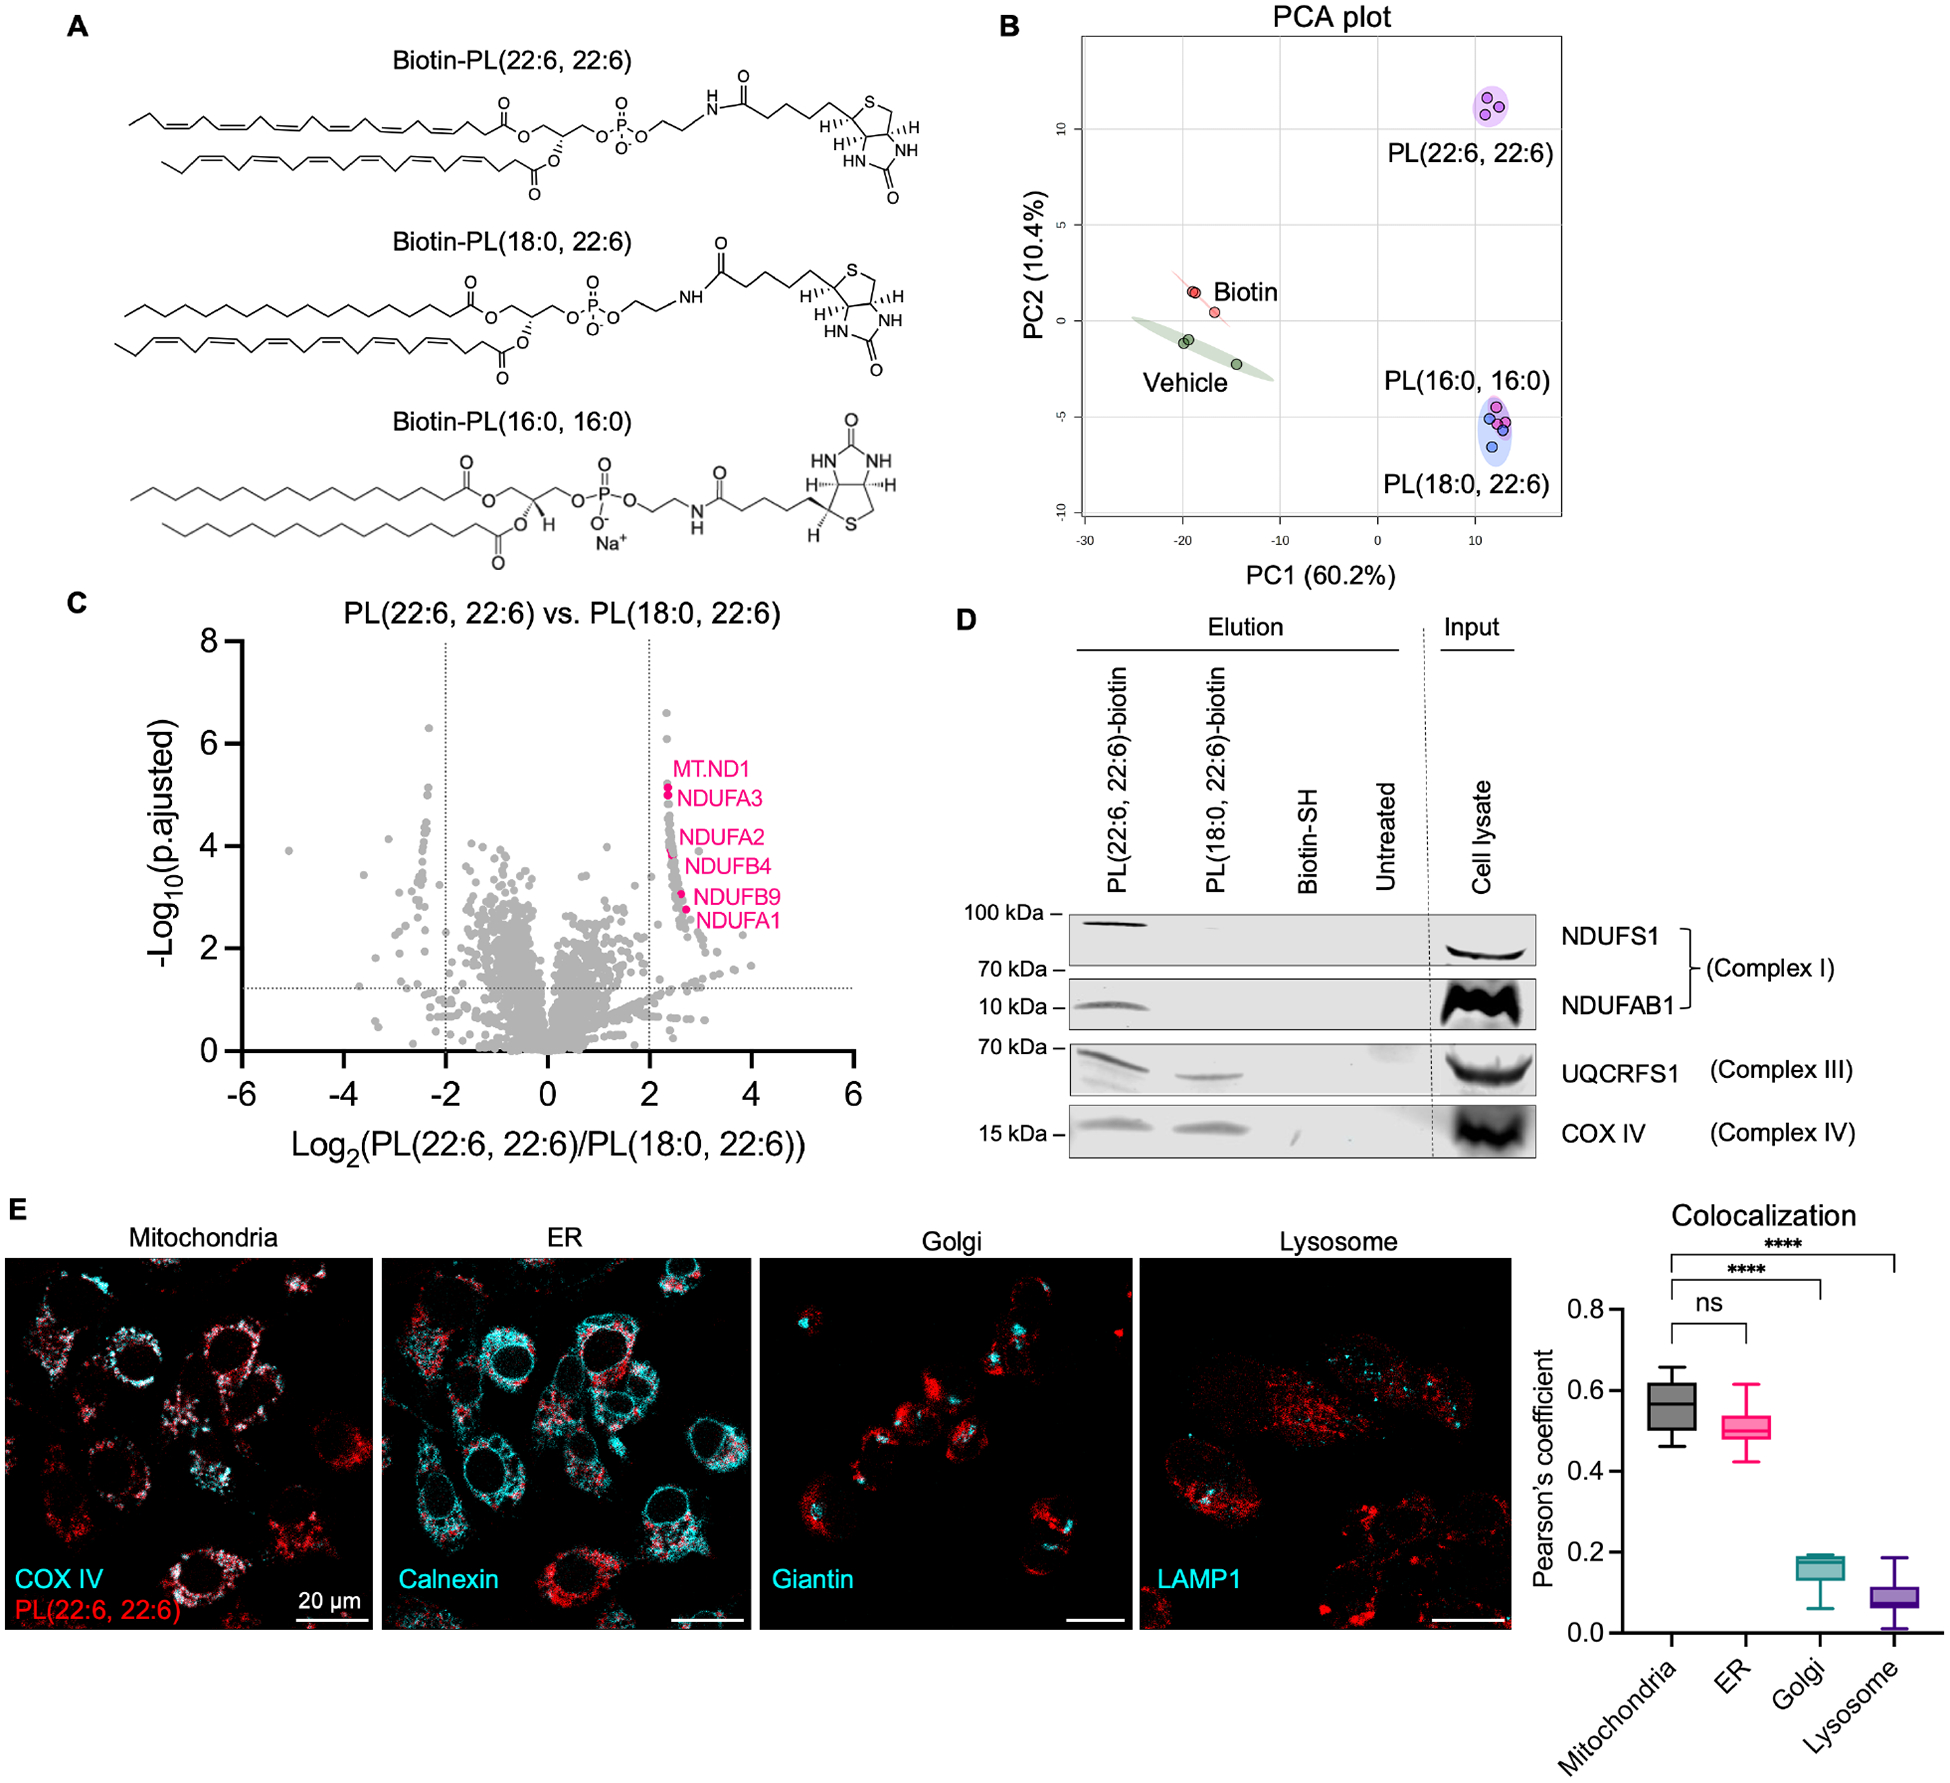
To decipher the effectors that mediate PL-PUFA2-induced ferroptosis, we conducted affinity pull-down assay combined with mass spectrometry (MS) to identify phospholipid-bound protein complexes. We designed phospholipids with biotinylated head groups that were subjected to pull-downs with streptavidin-coated beads to isolate specifically bound proteins (Figure 4A). A whole-cell lysate from HT-1080 cells was incubated with biotinylated PL-PUFA2, PL-PUFA1, or PL-SFA2, while negative control groups were incubated with vehicle and biotin. Target proteins were eluted and analyzed by MS-based proteomics for peptide identification. This workflow identified roughly 3,500 proteins from all samples and a principal components analysis revealed a clear separation of biotin-PL(22:6; 22:6) group from all other treatment groups and a tight clustering among biological triplicates (Figure 4B). The differentiation between proteins associated with biotinylated PL(18:0; 22:6) and PL(16:0; 16:0) was small, while the negative control groups were well-separated from all phospholipid groups.
Figure 4.
PL-PUFA2s exhibit interaction with mitochondrial electron transport chain.
A, Structures of biotinylated phospholipids. B, HT-1080 whole-cell lysate was incubated with biotinylated phospholipids, vehicle, or biotin, and phospholipid-bound proteins were identified by MS-based proteomics. 2-D plot of principle component analysis (PCA) of proteomic data of all groups. C, Volcano plot of genes differentially enriched in PL(22:6, 22:6) vs PL(18:0, 22:6) groups. Data cutoff at fold change >4 and FDR adjusted p <0.05. Significantly enriched mitochondrial complex I genes are labeled. D, Western blot analysis of mitochondrial complex proteins in pull-down samples. Empty lanes are cut and shown by the dotted line. E, HT-1080 cells were treated with 50 μM biotinylated PL(22:6, 22:6) or PL(18:0, 22:6) for 6 hr and immunostained with anti-COX IV, anti-Calnexin, anti-Giantin, and anti-LAMP1 antibodies. Composite fluorescent images are shown as PL in red and each antibody in pseudo-cyan. Scale bar is shown as 20 μm. Colocalization between PL and each subcellular organelle is represented by Pearson’s coefficient plotted as mean ± SD of n=6–8 images for all groups. One-way ANOVA: p<0.03 (*), p<0.002 (**), p<0.0002 (***), p<0.0001 (****). See also Figure S4.
A heatmap analysis revealed a cluster of proteins enriched in the biotin-PL(22:6; 22:6) group (Figure S4A, B). A volcano plot analysis comparing biotin-PL-PUFA2 and biotin-PL-PUFA1 revealed that mitochondrial electron transport chain (ETC) complex I proteins were specifically enriched in pull-downs using biotin-PL(22:6; 22:6) (Figure 4C). We detected ETC complex proteins in elution samples by western blotting and found that complex I proteins were present only in biotin-PL(22:6, 22:6)-treated samples, while complex III and IV were also present in biotin-PL(18:0, 22:6)-treated samples (Figure 4D). These data suggests that mitochondrial complex I is particularly involved in the mechanism of action of PL-PUFA2.
To further evaluate the connections of the identified genes potentially involved in PL-PUFA2 mechanism of action, we performed gene set enrichment analysis (GSEA) between PL-PUFA2 and PL-PUFA1. GSEA evaluates genes in the context of KEGG pathways and highlights the ones with significant p value and fold change. Top pathways involved the key genes that were either most significantly enriched or depleted in the PL-PUFA2 group. We found two pathways, non-alcoholic fatty liver disease and chemical carcinogenesis—reactive oxygen species, enriched in the PL-PUFA2 group, while the peroxisome pathway was enriched in the PL-PUFA1 group (Figure S4C). A part of the detailed view of the chemical carcinogenesis-reactive oxygen species pathway shows that complex I is the most enriched protein complex in the PL-PUFA2 group. Mitochondrial oxidative phosphorylation is a major source of reactive oxygen species, particularly produced from complex I and III. The chemical carcinogenesis—reactive oxygen species pathway is also frequently identified along with other ferroptosis related pathways in pathological contexts32. These data highlights that PL-PUFA2 involves in the function and assembly of mitochondrial ETC.
We further investigated the distribution of exogenous PL-PUFA2s in different subcellular organelles. We treated IGROV-1 cells with biotinylated PL(22:6, 22:6) or PL(18:0, 22:6) and stained cells with fluorophore-conjugated streptavidin for phospholipid detection. To determine the structures of subcellular organelles, cells were co-stained with an ER-marker anti-Calnexin antibody, a mitochondrial marker anti-COX IV antibody, a Golgi marker anti-Giantin antibody, and a lysosome marker anti-LAMP1 antibody. We observed a prominent accumulation of biotin-PL(22:6, 22:6) in the mitochondria and the ER, but no accumulation in the Golgi or lysosomes (Figure 4E). Negative controls using vehicle or biotin-treated cells had no staining with streptavidin-cy5, confirming the specificity of phospholipid labeling (Figure S4D).
In addition, we treated HT-1080 cells with sublethal amount of PC(22:6, 22:6) and isolated mitochondria from the rest of the cell compartments. Lipids in the mitochondria and other cellular structures were extracted and analyzed using LC-MS. We found PC(22:6, 22:6) in both mitochondria and the rest of cellular structures, while the increase of PC(22:6, 22:6) upon treatment was higher in the mitochondria (Figure S4E). Mitochondria appear to be an important site for PC-PUFA2 accumulation.
PC-PUFA2s induces mitochondrial stress
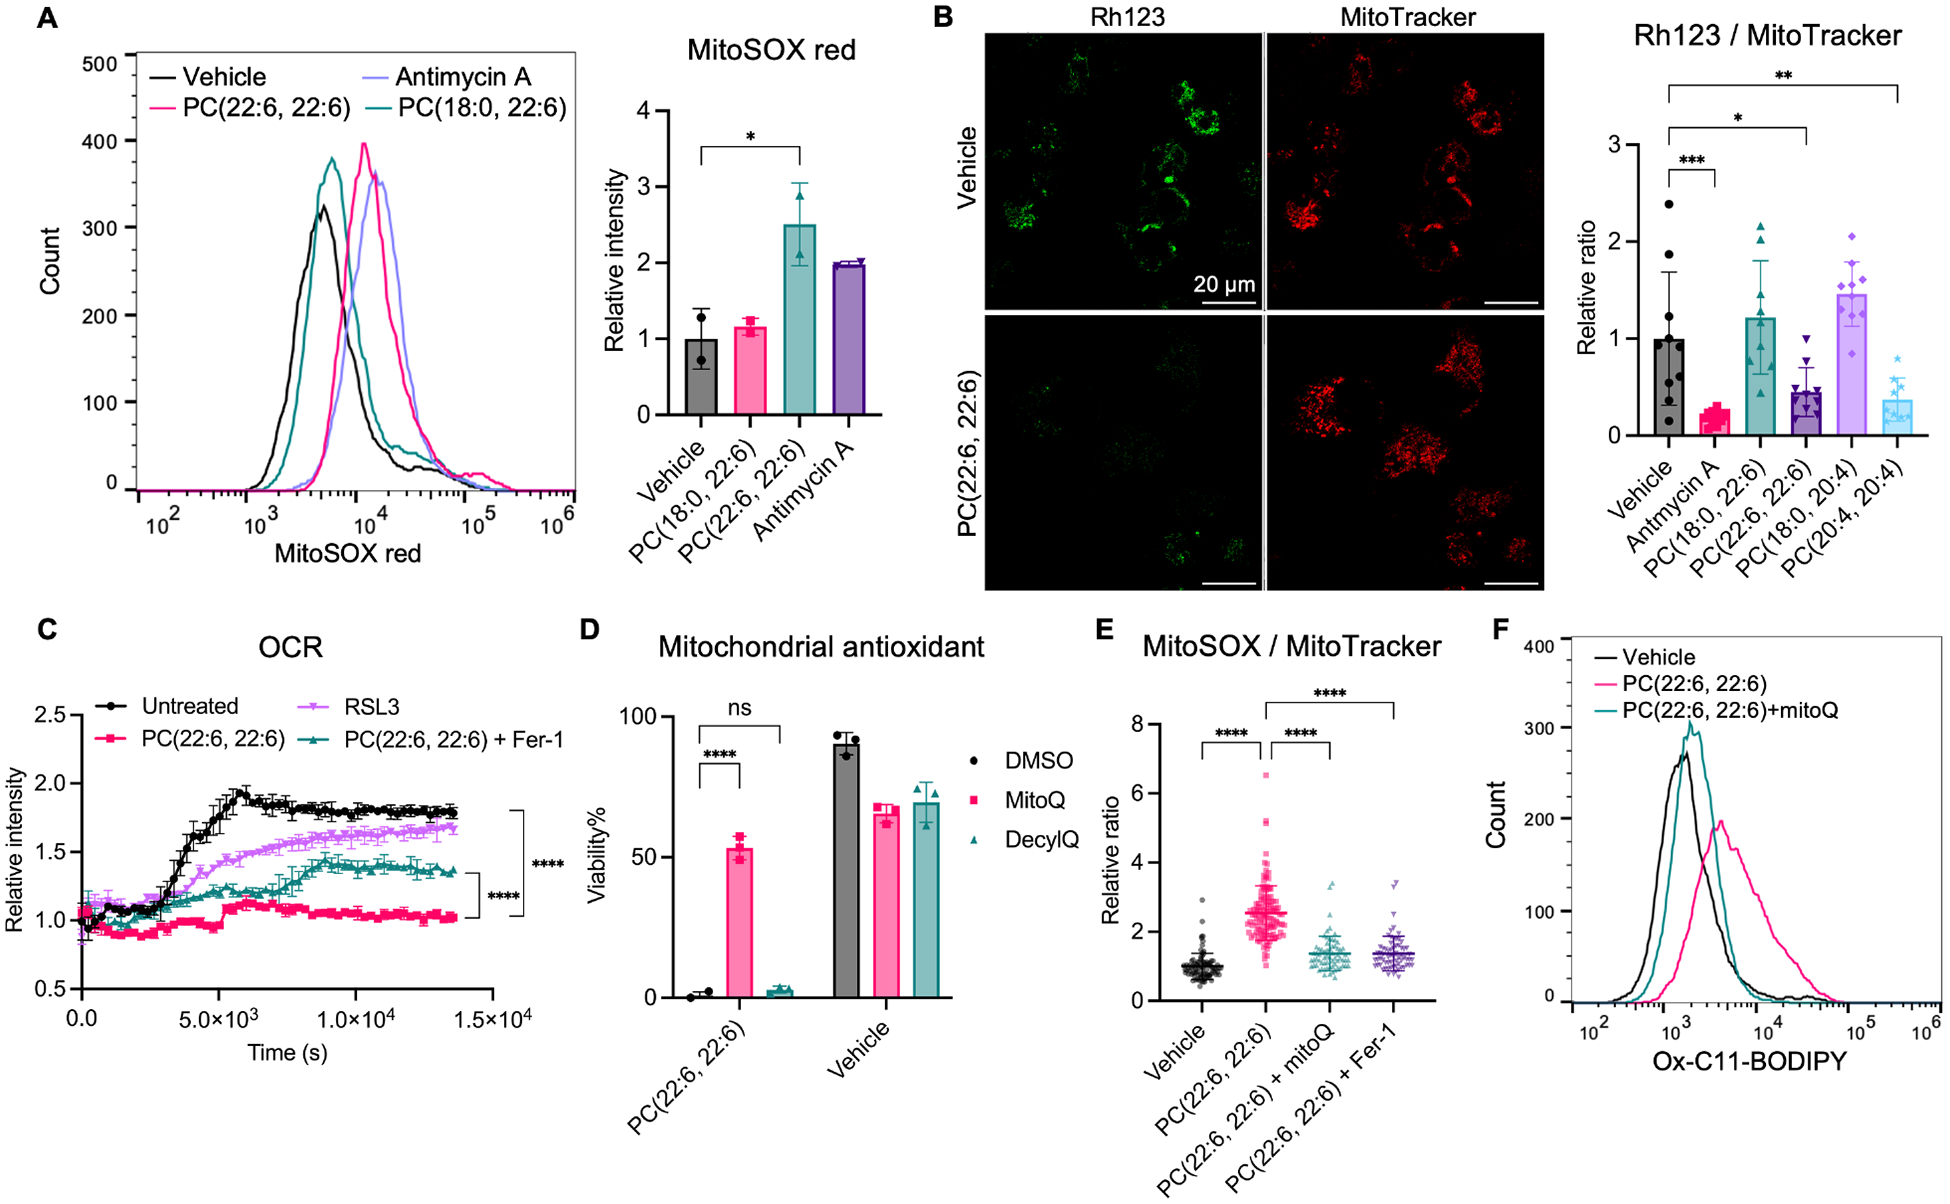
To investigate mitochondrial stress associated with PL-PUFA2 accumulation, we evaluated mitochondrial function from three different angles: mitochondrial reactive oxygen species, mitochondrial membrane potential, and mitochondrial oxidative phosphorylation. PC-PUFA2s induced an increase in mitochondrial superoxide production, measured by fluorescent probe, MitoSOX (Figure 5A). ROS produced by the mitochondrial ETC complex I has been reported to promote ferroptosis22,25. The accumulation of excess PC-PUFA2s may disrupt ETC complex I structure and affect electron flow, resulting in increased ROS production. Mitochondrial membrane potential was measured using a cationic fluorescent probe, rodamine123, which labeled normal polarized mitochondria. Treatment of PC-PUFA2s, including PC(22:6, 22:6) and PC(20:4, 20:4), significantly reduced mitochondrial membrane polarization compared with PC-PUFA1 or vehicle treatment, indicated by a reduction of rodamine123 labeling (Figure 5B, S5A). We then determined oxygen consumption rate to reflect mitochondrial respiration activity. PC(22:6, 22:6) treatment significantly halted oxygen consumption rate which is partially restored upon co-treatment with ferrostatin-1 (Figure 5C). RSL3 did not affect oxygen consumption rate, consistent with previous reports suggesting mitochondria is dispensible in the mechanism of RSL3-induced ferroptosis20. PC(22:6, 22:6)-treated cells did not change morphology during the assay, suggesting that the observed reduced oxygen consumption rate is due to inhibition on mitochondrial respiration rather than on cell viability (Figure S5B). Moreover, we evaluated other ETC complex inhibitors, including complex I inhibitor rotenone and complex III inhibitor antimycin A. These inhibitors induced mitochondrial stress but did not induce lipid peroxidation and ferroptosis (Figure S5D). Together, these data confirmed that mitochondria are essentially involved with PC-PUFA2-induced ferroptosis.
Figure 5.
PC-PUFA2s induces mitochondrial stress.
A, Mitochondrial superoxide accumulation measured by MitoSOX red in IGROV-1 cells treated with 100 μM PC or 5 μM antimycin A for 4 hr. The relative mean fluorescence intensity of MitoSOX compared to vehicle is plotted as mean ± SD of 2 biological replicates. B, Mitochondrial membrane potential measured by rhodamine123 in IGROV-1 cells treated with 100 μM PC or 10 μM antimycin A for 4 hr. Scale bar is shown as 20 μm. The relative ratio of rhodamine123 to MitoTracker compared to vehicle is plotted as mean ± SD of n=9–10 images. C, Oxygen consumption rate was measured kinetically for 4 hr in HT-1080 pre-treated with 100 μM PC(22:6, 22:6) with or without 20 μM Fer-1, or 1 μM RSL3 for 2 hr. D, Viability of IGROV-1 cells co-treated with 100 μM PC(22:6, 22:6) and 0.5 μM mitoquinone (MitoQ) or 0.5 μM decylubiquinone (DecylQ) for 24 hr. E, Mitochondrial superoxide accumulation measured by MitoSOX green in IGROV-1 cells treated with 100 μM PC(22:6, 22:6) with or without 10 μM Fer-1 or 0.2 μM mitoQ for 4 hr. Relative ratio of MitoSOX to MitoTracker compared to vehicle is plotted as mean ± SD. Each dot represents a cell. n=67–124 for all groups. F, Lipid peroxidation measured by C11-BODIPY581/591 in IGROV-1 cells co-treated with 100 μM PC(22:6, 22:6) and 0.5 μM mitoQ for 4 hr. One-way and two-way ANOVA: p<0.03 (*), p<0.002 (**), p<0.0002 (***), p<0.0001 (****). See also Figure S5.
Mitochondrial ROS is essential in PC-PUFA2-induced ferroptosis
To evaluate the role of mitochondria-induced ROS in PC-PUFA2 mechanism, we investigated the effect of mitochondria-targeted ROS scavengers on PC-PUFA2 treatment. Co-treatment with mitochondria-targeted antioxidant, mitoquinone (mitoQ), protected cells from PC-PUFA2 treatment (Figure 5D). The non-targeted counterpart of mitoQ, decylubiquinone, had a smaller effect compared to mitoQ. In addition, mitoQ can effectively reduce mitochondrial superoxide accumulation upon PC-PUFA2 treatment, confirming the mechanism of these antioxidants in scavenging mitochondrial ROS (Figure 5E, S5C). MitoQ can fully suppress lipid peroxidation induced by PC-PUFA2 (Figure 5F). These data suggests that mitochondrial ROS is essential during the mechanism of PC-PUFA2-induced ferroptosis and may facilitate lipid peroxidation initiation and propagation to other cellular membranes. Voltage-dependent anion channel (VDAC) localizes to the mitochondrial outer membrane and has various functions in regulating mitochondrial membrane potential, lipid transport, crosstalk with ER, and cell death33,34. Co-treatment of VDAC inhibitor DIDS partially suppressed the lethal effect of PC-PUFA2, although may through a broader effect on all VDAC family proteins because single knockdown of VDAC1–3 did not achieve the same effect (Figure S5E).
We evaluated PC-PUFA2 potency in mitochondrial depleted cells generated by parkin-directed mitophagy20,22. Parkin-overexpressing HT-1080 cells were induced mitophagy through treatment with the uncoupling agent carbonyl cyanide m-chlorophenyl hydrazone (CCCP), and we confirmed the depletion of mitochondrial content by staining with MitoTracker and quantification of mitochondrial DNA transcripts (Figure S5F). Compared to normal cells, mitochondrial-depleted cells were less sensitive to PC-PUFA2 treatment, suggesting that depletion of mitochondrial membrane and ROS reduces dietary PC-PUFA2 potency. The backup accumulation of PC-PUFA2 in other subcellular membranes such as ER when mitochondria are absent may still promote ferroptosis. Overall, our data support the notion that the potency of dietary PC-PUFA2 requires functional mitochondrial ETC structure and ROS production, which may be particularly beneficial when targeting cancer cells with hyperactive mitochondrial function.
PC-PUFA2s induce lipid peroxidation, but not an unfolded protein response in ER
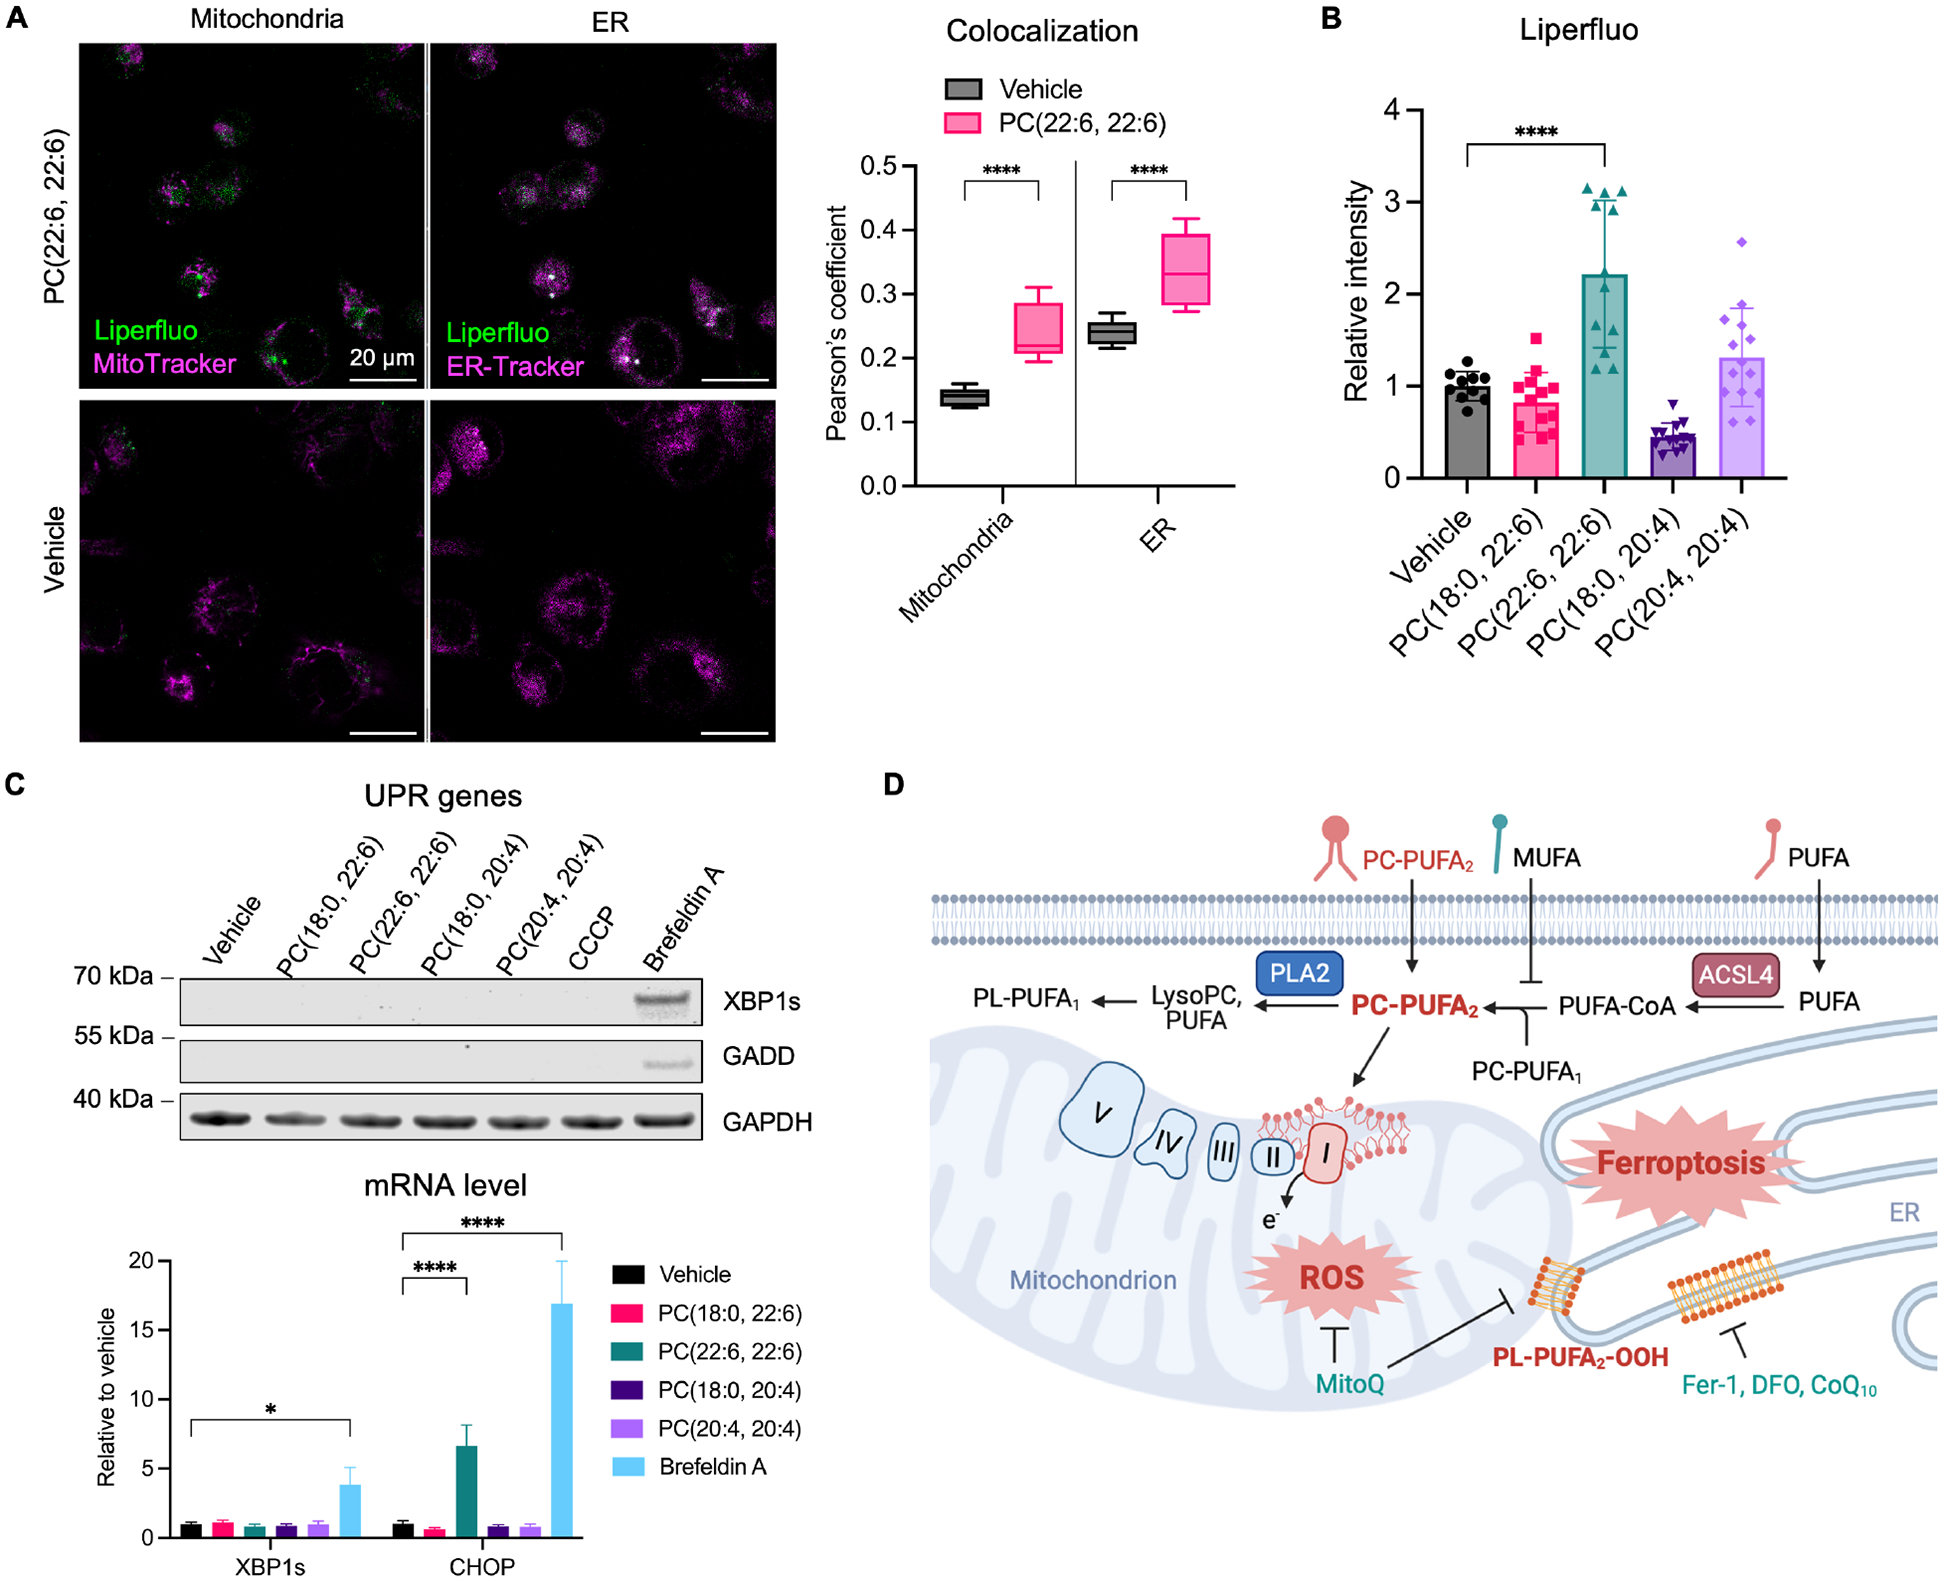
We recently reported that ER is a key site of lipid peroxidation that drives ferroptosis17. Interestingly, by co-staining cells with the fluorescent lipid hydroperoxide probe, Liperfluo, with MitoTracker and ER-Tracker, we observed a significant increase in lipid peroxidation in cells treated with PC-PUFA2s but not PC-PUFA1s (Figure 6B, S6A). The co-localization of Liperfluo signal with ER-Tracker was significantly higher than MitoTracker, indicating extensive lipid peroxidation in the ER that was consistent with this previous report (Figure 6A). In addition, we evaluated mitochondrial lipid peroxidation using a mitochondrial-targeting probe, mitoCLox. Although mitoCLox contains a mitochondrial-targeting structure, it showed major staining outside mitochondrial in cells treated with PC(22:6, 22:6), suggesting that mitochondria are not the major site for lipid peroxidation (Figure S6C).
Figure 6.
PC-PUFA2s induce lipid peroxidation, but not an unfolded protein response in ER.
A, Lipid peroxidation measured by Liperfluo in IGROV-1 cells treated with 100 μM PC(22:6, 22:6) for 4 hr. Cells were co-stained with ER-Tracker and MitoTracker. Composite fluorescent images are shown as Liperfluo in green and ER-Tracker or MitoTracker in pseudo-magenta. Scale bar is shown as 20 μm. Colocalization between Liperfluo and mitochondria or ER is represented by Pearson’s coefficient plotted as mean ± SD of n=9–11 images. B, Relative mean intensity of Liperfluo compared to vehicle is plotted as mean ± SD of n=10–14 images. C, Western blot analysis of UPR mediators, XBP1s and GADD in IGROV-1 cells treated with 100 μM PC, 10 μM CCCP, or 1 μM Brefeldin A for 4 hr. The transcript levels of XBP1s and CHOP were measured in same cells used for western blot. Data plotted as mean ± SD of n=3 technical triplicates. D, Schematics of the mechanism of PC-PUFA2-induced ferroptosis. See also Figure S6.
To evaluate ER stress upon PC-PUFA2 treatment, we measured the expression level of genes mediating the ER unfolded protein response (UPR). The protein level of GADD and XBP1s measured by western blot were increased in positive control cells treated with the UPR-inducing compounds, brefeldin A and thapsigargin, but neither was detected in cells treated with PC-PUFA2s for either 4 hours or 24 hours (Figure 6C, S6B). The transcript levels of XBP1s and GADD measured by quantitative PCR were consistent with western blot results. Cells treated with CCCP, which disrupted oxidative phosphorylation in mitochondrial, also failed to induce UPR, suggesting independent pathways regulating mitochondrial and ER stress.
Discussion
In this study, we identified a minor phospholipid species, PC-PUFA2s containing arachidonoyl or docosahexaenoyl tails that initiate ferroptosis. Due to low basal abundance in cells, diacyl-PUFA phospholipids have been neglected in studies and little is known about their functions in physiological and pathological contexts. PL-PUFA2s are implicated in ferroptosis, based on the observation that selective protection of PL-PUFA2s peroxidation is essential during GCH1-centered protection from ferroptosis16. Our study validates that PC-PUFA2 is a pro-ferroptosis lipid marker and has a mechanism of action involving mitochondrial ROS generation.
In the past, oxidized PEs with arachidonoyl and adrenoyl tails have been reported as a unique feature of ferroptotic cells14,35–37. In our study, supplementation with PE-PUFAs-induced cell death with low potency and specificity to ferroptosis in comparison with PC-PUFAs (Figure 1A, S1A, D). This may be due to the less efficient incorporation of PE-PUFAs into cells and more general PE-induced cytotoxicity. In contrast, PC-PUFA2 shows rapid incorporation into the cell lipidome, which is beneficial in dietary treatment. In addition, when we treated cells with non-lethal amount of PUFAs such as ARA and DHA, the abundance of PCs, particularly PC-PUFA2s, were significantly increased, while PE-PUFAs remained unchanged. The selective incorporation of PUFAs in the sn1 position of PC phospholipids was also reported in a previous study using α-linoleic acid38. This suggests that the PC-PUFA2 level is responsive to dietary PUFA supplementation and affects ferroptosis sensitivity. In addition, peroxisomes are reported to be involved with ether-phospholipid synthesis which contributes to ferroptosis39,40. We found that the protein-binding profile of biotinylated PL-PUFA1 but not PL-PUFA2 showed enrichment in peroxisome-related proteins, implying a mechanism involving peroxisomes for dietary PL-PUFA1 that is distinct from PL-PUFA2.
Here, we found that diacyl-PUFA phospholipids are key drivers of ferroptosis that involves initial mitochondrial ROS production and subsequent ER lipid peroxidation (Figure 6D). In this model, the intracellular level of diacyl-PUFA phospholipids, such as PC-PUFA2s, accumulate by either direct PC-PUFA2 uptake or free PUFA uptake followed by fatty acid remodeling to readily induce ferroptosis. A portion of dietary PC-PUFA2s were remodeled into other PUFA-containing lipid species. One phospholipid remodeling pathway, the Lands cycle, involves the phospholipase-A2-catalyzed cleavage of fatty acyl tails and the attachment of new fatty acyl chains by lysophospholipid acyltransferases. Phospholipase A2 facilitates the clearance of oxidized PL-PUFAs as a defense mechanism against ferroptosis41,42. Inhibition of fatty acid synthase (FASN) that regulates SFA and MUFA synthesis disrupts the Lands cycle in lung cancer and leads to the accumulation of PC-PUFA2s and lysoPC-PUFAs43. Lipid remodeling was also reported upon exogenous PUFA perturbation to restore membrane lipid homeostasis44. We observed that DHA-containing PC-PUFA2 experience less lipid remodeling compared with ARA-containing PC-PUFA2, which contributes to its higher potency to initiate ferroptosis. Therefore, the remodeling of exogenous PC-PUFA2s into other PUFA-containing lipid species may be a strategic mechanism to reduce the toxicity of PC-PUFA2s. Consistently, dietary MUFA and ACSL4 knockdown abolished cell-death induced by PC-PUFA1s but had less effect on PC-PUFA2s. This implies that PC-PUFA2s are the proximal lipid effector to execute ferroptosis and dietary MUFA and PUFA are affecting the synthesis of diacyl-PUFA phospholipids.
Critically, incorporation of PUFAs, at least arachidonic acid, into phospholipids via the Kennedy pathway or the Lands pathway has been shown to be a high-affinity but low-capacity pathway3. Thus, it is likely that the abundance of PL-PUFA1 species generated through CoA-PUFAs is limited and perhaps insufficient to support ferroptosis. Instead, formation of PL-PUFA2s as a mobile carrier of PUFAs that can support a transacylation mechanism such as that originally reported by Irvine and Dawson is likely essential to provide a sufficient capacity of PL-PUFA species to enable ferroptotic cell death45. PL-PUFA2s is thus highly responsive to intracellular PUFA pool and governs cell sensitivity to ferroptosis.
Mitochondria have been shown to play a potentiating role in ferroptosis in recent studies identifying the protective effect of mitochondria antioxidants and mitochondria-localized GPX4 overexpression on ferroptosis24,25. In our study, we found that PL-PUFA2s were transported to the mitochondria, implying that endogenous PL-PUFA2 trafficking systems are enriched in mitochondria. Mitochondria have been reported as the intracellular sink for short-chain di-unsaturated phospholipids in yeast, although the similar transport system has not been characterized in mammalian cells46. Besides, dietary PUFA such as DHA and has been shown to affect mitochondrial structure, oxidative phosphorylation, and unsaturated lipid content47–49. These studies demonstrate that dietary PUFA are effectively incorporated into mitochondrial membrane phospholipid and accompanied by mitochondrial stress including membrane depolarization and decreased activity of ETC complexes. This explains that when we supplemented cells with free PUFA, accumulation of PC-PUFA2 may occur in the mitochondria due to high regional concentration of PUFA most likely in the inner mitochondrial membrane and intermembrane space.
It has been reported that mitochondrial ROS produced by ETC complex I is responsible for mitochondrial lipid peroxidation and ferroptosis25,50. Based on our proteomic data, PL-PUFA2 had certain interactions with complex I protein that may directly or indirectly affect mitochondrial ROS (mtROS) homeostasis and induce mitochondrial membrane depolarization. We found that the lethal effect of PC-PUFA2 was protected by the mitochondria-targeted ROS-quencher such as mitoquinone, but not by ubiquitously localized decylubiquinone (Figure 5D). Mitoquinone was also sufficient to block mitochondrial ROS accumulation and lipid peroxidation that is essential during PC-PUFA2-induced ferroptosis.
Due to accumulation of PC-PUFA2 and mtROS, mitochondria act as an initiation site of ferroptosis, while propagation of lipid hydroperoxides occur mainly in the ER. ER is a central organelle for lipid metabolism and contains abundant labile PUFA phospholipids. Lipid hydroperoxides from mitochondria can communicate with ER membrane through mitochondria-ER contact sites51,52. We found that PC-PUFA2s induced lipid peroxide accumulation in the ER, consistent with the established model that ER is the primary site of lipid peroxidation17.
In summary, PC-PUFA2 is a critical pro-ferroptosis lipid class. We found that PC-PUFA2 is a potent downstream effector of dietary PUFA and modulates cellular oxidative stress by disruption of mitochondrial ROS homeostasis. The accumulation of PC-PUFA2s can rationalize the ferroptosis-promoting benefit of PUFA treatments during cancer therapy, the effects of MUFAs in suppressing ferroptosis, the role of mitochondria in contributing to ferroptosis, and impact our understanding of ACSL4 function during lipid remodeling. PC-PUFA2s therefore represent an important driver of ferroptosis, with implications for understanding the basic biology and chemistry of ferroptosis, as well as how ferroptosis can be detected and regulated in disease states. In this sense, the level of PC-PUFA2 may be a marker of ferroptosis-sensitivity, with implications for linking PUFA content of diet, aging, degenerative disease states, and cancer cell contexts to ferroptosis sensitivity.
Limitations of the study
Our findings indicate that PC-PUFA2 is an important ferroptosis-regulating lipids. We found interactions of PC-PUFA2 with mitochondrial ETC complex I that contribute to ROS production, essential for the initiation and propagation of lipid peroxidation that drives ferroptosis. Although these results suggest the involvement of the mitochondrial ETC in PC-PUFA2-induced ferroptosis, further structural analysis is needed to determine the exact binding site of PC-PUFA2 within the ETC complexes to fully understand the mechanism behind PC-PUFA2-induced ROS production.
Furthermore, our current data demonstrates that accumulation of PC-PUFA2 specifically drives ferroptosis, however a more comprehensive analysis of whether depletion of PC-PUFA2 blocks ferroptosis is limited by the current methods. Although we showed that MUFA treatment selectively reduced PC-PUFA2 concentration in cells in the presence of PUFA, future study on PC-PUFA2 biosynthetic pathway is important to identify enzymes that account for the accumulation of PC-PUFA2 in cells, so that blockage of these pathways can achieve complete depletion of PC-PUFA2.
STAR Methods
RESOURCE AVAILABILITY
Lead contact
Further information and requests for resources and reagents should be directed to and will be fulfilled by the lead contact, Brent R. Stockwell (bstockwell@columbia.edu).
Materials availability
All unique/stable reagents generated in this study are available from the Lead Contact with a completed Materials Transfer Agreement.
Data and code availability
Proteomics data are available via ProteomeXchange with identifier PXD041993. Lipidomics data including raw mass spectrometry data files, processed data, and annotated lipid features are available in the public repository, MetaboLights, under accession number MTBLS7772.
This paper does not report or use custom computer code.
Any additional information required to reanalyze the data reported in this paper is available from the lead contact upon request.
EXPERIMENTAL MODEL AND STUDY PARTICIPANT DETAILS
Cell lines
All mammalian cells were cultured following ATCC recommended protocols and in medium supplemented with 10% fetal bovine serum (FBS, Thermo Fisher Scientific 26400044) and 1% Penicillin-Streptomycin (Thermo Fisher Scientific 15140122). IGROV-1, CAL-85–1, MCF-7, CAL-120, CAL-51, A549, C-33A, and Huh7 cells were cultured in Dulbecco’s modified Eagle’s medium (DMEM) with high glucose (Corning-FISHER 10–013). HT-1080 cells were maintained in DMEM supplemented with additional 1% non-essential amino acids (Thermo Fisher Scientific 1140076). SU-DHL-5, SU-DHL-6, AU565, HCC2218, 786-O, LS513, NCI-H358, NCI-H2087, NCI-H1299 cells were cultured in RPMI-1640 medium (Cytiva SH30096). Calu-1, SK-BR-3, HCT116 cells were cultured in McCoy’s 5A medium (Thermo Fisher Scientific 16600108). 143B cells were cultured in Eagle’s minimum essential medium (VWR 10128). Mycoplasma tests were routinely performed to ensure cell culture quality and cells were passaged no more than 20 passages. Mcherry-Parkin overexpressing HT-1080 cells were generated previously by Gaschler et al.20. In brief, HT-1080 cells were retroviral transduced with mCherry-Parkin-IRES-zeocin plasmid and selected using 400 μg/mL zeocin. Mitophagy was induced in Mcherry-Parkin overexpressing HT-1080 cells by treatment of 12.5 μM CCCP for 48 hr before switching to original media for cell assays. Cas9 overexpressing HT-1080 cells were generated by lentiviral transduction of Lenti-iCas9-neo plasmid and viruses were made with third generation ecotropic packaging as previously described16. Cas9 overexpressing HT-1080 cells were cultured in normal medium supplemented with 1 μg/mL puromycin.
Human subject
Analysis on human brain samples were performed under the Institutional Review Board of Columbia University (AAAQ8027, approved 04/07/2016). The caudate nucleus region of the brain autopsy samples from Huntington’s disease and control patients were collected. All control patients were age-matched with HD patients obtained from the same tissue bank. Patient information related to age and sex are provided in Table S1. All samples are de-identified and other information outside the Table S1 is not available for the samples and are not relevant to the study.
METHOD DETAILS
Antibodies and chemicals
(1S,3R)-RSL3, IKE, FINO2 were synthesized by the Stockwell lab as previously described27,53,54. All commercially available phospholipids were purchased from Avanti Polar Lipids. Biotinylated phospholipids were synthesized by Avanti Polar Lipids and deuterated phospholipids were synthesized by Cayman Chemical. Fatty acids including arachidonic acid, docosahexaenoic acid, and oleic acid were purchased from Cayman Chemical. Other chemicals were purchased from certified vendors: ferrostatin-1 (Sigma-Aldrich SML0583), deferoxamine mesylate (Sigma-Aldrich D9533), Z-VAD-FMK (Selleck Chemicals S7023), necrostatin-1s (Cell Signaling Technology 17802S), bafilomycin A1 (Cayman Chemical 11038), FIN56 (Selleckchem S8254), ONO-RS-082 (Cayman Chemical 20243), CCCP (Cayman Chemical 25458), brefeldin A (Cayman Chemical 11861), thapsigargin (Cayman Chemical 10522), mitoquinone mesylate (Cayman Chemical 29317), decylubiquinone (Cayman Chemical 21027), DIDS sodium salt (Cayman Chemical 16125), rotenone (EMD Millipore 557368), antimycin A (Sigma-Aldrich A8674), zeocin (Thermo Fisher Scientific R25001), puromycin (Santa Cruz Biotechnology sc-108071A), biotin-PEG-SH (Polypure 41156–1095), 2-Hydroxypropyl-β-cyclodextrin (Cayman Chemical 16169), 4-chlorobenzoic acid (Sigma-Aldrich 135585). The following antibodies were used: anti-GPX4 (ab125066), anti-ACSL4 (clone F-4, Santa Cruz Biotechnology sc-365230), anti-phospho-MLKL Ser345 (clone D6E3G, Cell Signaling Technology 37333S), anti-Caspase-3 (Cell Signaling Technology 9662S), anti-cleaved Caspase-3 Asp175 (Cell Signaling Technology 9661S), anti-XBP1s (clone 143F, BioLegend 647501), anti-GADD (clone B-3, Santa Cruz Biotechnology sc-7351), anti-GAPDH (Abcam ab9485), anti-pan-Actin (clone D18C11, Cell Signaling Technology 8456S), anti-alpha-Tubulin (clone DM1A, Santa Cruz Biotechnology sc-32293), anti-Calnexin (Abcam ab22595), anti-COX IV (Abcam ab33985), anti-Giantin (clone 9B6, Abcam ab37266), anti-LAMP1 (clone D2D11, Cell Signaling Technology 9091T), anti-TfR1 (clone 3F3-FMA)26, anti-ETC complex sampler (anti-NDUFS1, anti-NDUFAB1, anti-UQCRFS1, anti-COX IV, Cell Signaling Technology 42642), anti-mouse IgG (H+L) Alexa Fluor 488 (Thermo Fisher Scientific A32723), anti-mouse IgG (H+L) Alexa Fluor 594 (Thermo Fisher Scientific A-11032), anti-rabbit IgG (H+L) Alexa Fluor 405 (Thermo Fisher Scientific A48254),anti-mouse IgG (H+L) IRDye 800CW (Biosciences 926–32210), anti-rabbit IgG (H+L) IRDye 680RD (Biosciences 926–68071).
Cell viability assay and phospholipid treatment
Cells were seeded in 384-well format culture plate (Thermo Fisher Scientific 164610) at 400 cells per well for adherent cells and 5,000 cells per well for suspension cells and incubated overnight. Before treatment, phospholipid stock solution in chloroform was dried under nitrogen flow, redissolved in vehicle containing 20% ethanol and 16% 2-Hydroxypropyl-β-cyclodextrin in phosphate buffered saline (PBS), and sonicated to get a clear solution. Phospholipids were further diluted in media to reach desired concentration and added to cell plates. The final vehicle concentration in cells was less than 0.02%. Cells were treated with phospholipids for 24 hr and cell viability was measured by CellTiter-Glo (Promega G7573) using a luminescent plate reader according to the manufacturer’s instructions. CoQ10-depleted media was prepared by filtering FBS through 15 kD protein filters before adding to culture media along with additional 1 mM 4-chlorobenzoic acid. Cells were cultured in CoQ10-depleted media for 48 hr and then treated with phospholipids and 10 μg/mL human holo-Transferrin (Sigma-Aldrich T0665). For cystine depletion, cells were cultured in DMEM without methionine and cystine (Thermo Fisher Scientific 21013024). Glutamate (Thermo Fisher Scientific 35050061), sodium pyruvate (Cytiva SH30239.01), and methionine (Sigma-Aldrich M9625) were added back to DMEM and cystine (Sigma-Aldrich C8755) was titrated in culture plates. Cell viability was measured after cystine depletion for 24 hr. For all cell viability assays, 2–4 technical replicates were used and at least 2 biological replications were performed.
Cytosolic and mitochondrial ROS measurement
For lipid ROS determination, cells were seeded in 10 cm dishes at 2 million cells per plate and incubated overnight. Cells were treated with 100 μM phospholipids for 4 hr and washed once with HBSS (Thermo Fisher Scientific 14025092). Cells were then incubated with HBSS containing 2 μM C11-BODIPY581/591 (Invitrogen D-3861) at 37 °C for 30 min in dark. Cells were trypsonized (Invitrogen 25200–114), washed once with HBSS, and resuspended in fresh HBSS for flow cytometry analysis. For mitochondrial superoxide detection using flow cytometry, cells were incubating with 5 μM MitoSOX red (Thermo Fisher Scientific M36008) at 37 °C for 30 min in dark. Samples were detected with excitation at 488 nm and emission at FITC channel with 525/40 nm bandpass filter for oxidized C11-BODIPY and PE channel with 585/42 nm bandpass filter for MitoSOX red and reduced C11-BODIPY. 10,000 events after gating were collected for each sample. Flow cytometry data were processed in FlowJo (version 10.8). Cells were gated for live cells in SSC-A vs FSC-A plot and for singlet cells in FSC-H vs FSC-A plot. The FITC-A and PE-A histogram of singlet cells were plotted and the mean intensity of each peak was quantified. For all flow cytometry assays, at least 2 biological replications were performed.
Transfection
Cells were transfected with Lipofectamine RNAiMAX Transfection Reagent (Thermo Fisher Scientific 13778075) by reverse transfection according to the manufacturer’s protocol. In brief, 20 pmol of siRNA SMARTpool (Dharmacon) and 2.5 μL Lipofectamine RNAiMAX was mixed in 500 μL Opti-MEM reduced serum medium (Life Technologies 31985) at room temperature for 30 min. Then 0.5 million cells in 1.5 mL media were mixed with transfection reagent and added to each well in 6-well plate. After 48 hr, cells were harvested for cell assay. For CRISPR knockdown, cas9-overexpressing HT-1080 cells were transfected with sgRNA targeting ACSL4 or non-targeted sgRNA using Lipofectamine for 48 hr.
Protein quantification
Protein amount in cell lysate was quantified using Pierce™ BCA Protein Assay Kit (Thermo Fisher Scientific 23225) following the manufacturer’s protocol. In brief, the standard curve was generated by serial dilutions of BSA standards. Both standards and samples were added in 96-well format clear assay plate (Greiner Bio-One 655101) in duplicates and incubated with the colorimetric working solution at 37 °C for 30 min at dark. The plate was measured using the plate reader and detected by absorbance at 562 nm. The concentration of sample is interpolated from the standard curve.
Targeted lipidomics
Sample preparation
Cells were seeded in 10 cm dishes at 2 million cells per plate overnight. Culture media was swapped with fresh media containing 25 μM deuterated, non-deuterated phospholipids, PUFAs or vehicle and cells were incubated for 6 hr. Cells were harvested for lipid extraction. For basal lipid measurement, 5 million cells were collected for each triplicate of each cell line and lipids were extracted from all cell pellet at the same time. Protein concentration was measure for each cell line and used to normalize lipid signal. For mitochondrial lipid measurement, mitochondria were isolated using the Mitochondria Isolation Kit (Thermo Fisher Scientific 89874) following manufacturer’s instructions. 20 million cells were collected for mitochondrial isolation for each triplicate. Oleic acid-d17 was added to both mitochondrial fraction and the rest cell fraction as internal standard to normalize extraction efficiency. Lipids were extracted as previously described16,17. In brief, cells were homogenized in methanol, and cell lysates were transferred into glass vials containing methyl tert-butyl ether. Mixture was vortexed and incubated in ice for 2 hr for lipid extraction, followed by phase separation by adding water. Top organic layer was dried and redissolved in isopropanol: acetonitrile: water 4:3:1 for LC-MS sample loading. The aqueous layer was dried and redissolved in RIPA buffer for protein concentration measurement. Lipid extraction from brain tissue followed the same method as cell extraction with additional step of tissue homogenization. For all lipidomics assays, 3–4 technical replicates were used.
Lipidomic analysis
Lipids were analyzed using LC-MS method as previously described16,17. Samples were analyzed using Acquity UPLC I-class PLUS interfaced with a Synapt G2-Si Mass spectrometer (Waters Corp.). Chromatographic separation was performed with a 20 min gradient elution profile on a Waters Acquity CSH C18 column (1.7 μm, 2.1 mm × 100 mm). Both positive and negative electrospray ionization (ESI) modes used the same mobile phase: (A) water: ACN (40:60; v/v) and (B) water: ACN: IPA (5:10:85; v/v/v). However, different mobile phase modifiers were used to improve lipid coverage. For the positive mode, 10 mM ammonium formate and 0.1% formic acid were used, while 10 mM ammonium acetate was used for the negative ESI mode. The following linear gradient at 400 μL/min flow rate with a column temperature at 55 °C was used: 0–2 min: 60%B, 2–2.3 min: 75% B, 2.3–10 min: 90%B, 10–17 min: 100%B, 17–20 min: 40%B. The Synapt G2-Si mass spectrometer was equipped with a LockSpray ion source and was operated in both ESI. modes over the mass range of 50–1600 m/z. Source voltages were set to ±2.5 kV, 30 V, and 5 V for capillary, sampling, and extraction cones, respectively. Moreover, the temperature was set to 120 °C for the source and 500 °C for sample desolvation. Gas flow rates were set at 900 L/hr and 50 L/hr for the desolvation gas and cone gas, respectively. Fragment ion spectra were generated using enhanced data-independent ion mobility (HDMSE) acquisition mode where data from mobility separation ions are collected in two channels with either low collision energy applied at 4 V or with an elevated collision energy ramp from 25 to 60 V for precursor and fragment ions, respectively. Nitrogen as the drift gas was held at a flow rate of 90 mL/min in the IMS cell with a wave velocity of 600 m/s and a wave height of 40 V.
Data analysis
All raw files acquired via MassLynx software (version 4.1, waters) were imported to Progenesis QI software (Waters, Non-linear Dynamics) and aligned against the QC reference, followed by peak extraction and retention time alignment. Identification of detected lipid features was initially obtained by searching monoisotopic masses against the available online databases such as METLIN, LipidMAPS, and HMDB with a mass tolerance of 5 ppm. Moreover, isotopic patterns and retention time of each lipid precursor ion were assessed. Structural elucidation of lipids was confirmed by inspecting the diagnostic fragment ions and corresponding acyl chain fragment information obtained by UPLC-HDMSE. The extracted lipid features were normalized by total protein concentrations, median normalization, and log-transformed within each sample before statistical analysis.
For analysis of public lipidomics dataset (DOI: 10.21228/M8C68D), all annotated diacyl-PUFA phospholipids, mono-acyl-PUFA phospholipids, and lysophospholipids with structural elucidation of acyl tails were selected and analyzed in MetaboAnalyst (version 5.0).
Quantitative proteomics
Sample preparation
Affinity pull-down assay was conducted using the Pierce MS-Compatible Magnetic IP Kits (Thermo Fisher Scientific 90408), following manufacturer’s instructions. In brief, HT-1080 cells were seeded in 15 cm round culture plates and cultured until confluent. Cells were washed once with cold PBS and scraped off the plate using 2 mL IP-MS Cell Lysis Buffer containing protease inhibitor cocktail (ApexBio K1007). Cells were incubated on ice for 10 min and spun at 17,000 xg for 15 min at 4 °C. Supernatant containing soluble proteins was collected and quantified for protein amount. Meanwhile, 0.5 mg biotinylated phospholipid in chloroform was dried under nitrogen stream and redissolved in 20 μL MeOH and 480 μL PBS. In each reaction sample, 500 ug protein was mixed with 10 ug lipid or an equal amount of vehicle or biotin-PEG-SH in 500 μL Cell Lysis Buffer. Mixture was incubated overnight at 4 °C. 0.25 mg of Pierce Streptavidin Magnetic Beads was washed and added to each reaction tube and mixed at 4 °C for 2 hr. Magnetic beads were collected on a magnetic stand and washed three times with wash buffer A and B. For proteomics assay, 3 technical replicates were used.
Proteomic analysis
Protein was eluted and analyzed by LC-MS method as previously described26. In brief, proteins were eluted from magnetic beads and followed by cysteine reduction in 10 mM tris(2-carboxyethyl)phosphine and 40 mM chloroacetamide at 45°C for 10 min and protein digestion in trypsin/LysC overnight at 37 °C. Peptides were added with ethyl acetate containing 1% trifluoroacetic acid and subjected to StageTip clean-up via SDB-RPS. Peptides were eluted with 50% ACN containing 1% ammonia and dried at 45 °C in SpeedVac. Samples were resuspended in 3% ACN and 0.1% formic acid and measured using NanoDrop. 200 ng of peptides were loaded for diaPASEF analysis on timsTOFPro (Bruker). Peptides were separated on a reversed-phase C18 column with an integrated CaptiveSpray Emitter (1.6 μm, 25 cm × 75 μm, IonOpticks) using mobile phase (A) 0.1% formic acid in water and (B) 0.1% formic acid in ACN at a flow rate of 400 nL/min. The fraction of B was linearly increased: 0–60 min, from 2% to 23%; 60–67 min: 23% to 35%; 67 min- the end, 35% to 90%. Data were acquired at defined 32 × 50 Th isolation windows from m/z 400 to 1,200. The collision energy was ramped linearly as a function of the mobility from 59 eV at 1/K0=1.6 (V·s)/cm2 to 20 eV at 1/K0=0.6 (Vb7s)/cm2. The recorded raw files were analyzed using the DIA-NN search engine to match with the UniProt Human proteome database (UP000005640) with a peptide identification false discovery rate <1%. The peak area of all unique peptides per protein was normalized to the protein quantifications.
Proteomics data processing
Statistical analysis was performed in MetaboAnalyst (version 5.0) including heatmaps, principal component analysis, and volcano plot. Log2 transformed abundance for each protein were used for heat map generation. Clustering method was set using the “Ward” method with distance measurement using “Euclidean distance” setting. Group differences were calculated using one-way ANOVA (Fisher’s LSD, p< 0.05) and a false discovery rate of 5% to control for multiple comparisons. GSEA was performed using DAVID (version 6.8) and clusterProfiler (version 4.6.2) on the output of the global proteomics data55–58. Briefly, gene IDs from each protein were converted to Entrez IDs and ranked by incorporating p-value and fold change using formula: −log10(p.value)*log2(FC). GSEA was performed on the ranked list utilizing KEGG database in FGSEA method59,60. Bar and cnet plots were generated using enrichplot package in R Studio (version 1.4).
Western blot
Approximately 3 million cells were collected and washed twice with PBS. Cell pellet was lysed in 40 μL RIPA buffer (Thermo Fisher Scientific 89901) containing protease inhibitor cocktail (Sigma-Aldrich 11697498001) and incubated on ice for 10 min. Lysate was centrifuged at 17,000 xg for 15 min 4 °C. The supernatant was collected, quantified, and diluted with 3x blue loading buffer containing 125 μM DTT (Cell Signaling Technology 7722S) and incubated at 80 °C for 10 min. An equal amount of protein in the range of 25–40 μg was loaded in each lane of the NuPAGE 4–12% Bis-tris gel (Fisher Scientific WG1401) and transferred onto nitrocellulose membranes (Thermo Fisher Scientific IB23002) using electrophoretic semi-dry western blot transfer system. Membranes were blocked with TBS blocking buffer (Thermo Fisher Scientific 37535) for 1 hr at room temperature and incubated with primary antibody diluted in TBS-T (TBS with 0.1% Tween20): blocking buffer 1:1 overnight at 4 °C. Membranes were washed three times in TBS-T and then incubated with secondary antibodies diluted at 1:10,000 in 1:1 TBS-T: blocking buffer for 1 hr at room temperature. Membrane was washed three times in TBS-T and imaged on LI-COR Odyssey infrared imaging system. Images were collected and optimized contrast settings using the Image Studio software. For affinity pull-down assay followed by western blot, 1 mg protein was mixed with 1 mg lipid or an equal amount of vehicle or biotin-PEG-SH in 1 mL Cell Lysis Buffer. After pull-down, proteins were eluted from beads in SDS buffer with DTT and all elution samples were loaded in NuPAGE gel.
Quantitative PCR
RNA from cells was isolated using RNeasy Mini Kit (Qiagen 74136) according to the manufacturer’s instructions. Extracted RNA was reverse transcribed to cDNA and qPCR reactions were performed using Power SYBR Green PCR Master Mix (Thermo Fisher Scientific 4368577) and analyzed on the ViiA 7 Real-Time PCR System (Thermo Fisher Scientific) according to the manufacturer’s instructions. TBP transcript was used as the housekeeping gene for the normalization of other target genes. The forward and reverse qPCR primers used in the study are listed in Table S2. For qPCR assays, 3 technical replicates were used.
Immunofluorescence
Cells were seeded on 8-well chambered slides (Celltreat 229168) at 0.05 million cells per well and cultured overnight. Cells were treated with 50 μM biotinylated phospholipids for 6 hr. Cells were fixed using 4% paraformaldehyde for 20 min and blocked using 10% normal goad serum for 1 hr as previously described17,26. Cells were co-stained with cy5 conjugated streptavidin (ApexBio K1080), anti-Calnexin antibody, anti-COX IV antibody, anti-Giantin antibody, and anti-LAMP1 antibody at 1:250 dilution overnight at 4 °C and then stained with secondary antibodies at 1:500 dilution at room temperature for 1 hour. Slides were finished by adding VECTASHIELD mounting medium (Vector Laboratories H-1900) and covered with clean cover glass. For immunofluorescent imaging of TfR1, cells were treated with 100 μM phospholipids for 4 hr and then fixed and stained with anti-TfR1 antibody at 1:250 dilution overnight. For all immunofluorescence assays, at least 2 biological replicates were performed.
Live-cell imaging
Cells were seeded in 8-chamber coverglass (Thermo Fisher Scientific 155411PK) at 0.05 million cells per well and cultured overnight. For measuring lipid ROS, cells were treated with serum-free culture medium containing 5 μM Liperfluo (Dojindo L248–10) for 30 min before treatment with 100 μM phospholipids for 4 hr. Cells were washed once with HBSS containing calcium and magnesium and then treated with HBSS containing 50 nM MitoTracker deep red (Invitrogen M22426) and 1 μM ER-Tracker blue-white (Invitrogen E12353) for 30 min at 37 °C. Cells were washed once with HBSS and imaged using confocal microscope. For measuring mitochondrial membrane potential, cells were treated with 100 μM phospholipids for 4 hr and stained with HBSS containing 250 nM rhodamine123 (Sigma-Aldrich 83702), 50 nM MitoTracker deep red, and NucBlue (Thermo Fisher Scientific R37605) for 30 min at 37 °C. For measuring mitochondrial superoxide, cells were stained with HBSS containing 5 μM MitoSOX green (Thermo Fisher Scientific M36006), 200 nM MitoTracker deep red, and NucBlue for 30 min at 37 °C. For measuring mitochondrial lipid ROS, cells were stained with HBSS containing 200 nM mitoCLox (Lumiprobe 3549), 50 nM MitoTracker deep red, and NucBlue for 30 min at 37 °C. For all live-cell imaging assays, at least 2 biological replicates were performed.
Image collection and processing
All slides were imaged by Zeiss LSM800 confocal microscope with 63x/1.40 Oil DIC objective. All imaging parameters including laser power, scanning speed, and scanning area remained constant for each experiment. Images were captured randomly across each well to ensure unbiased data collection. Quantification of the fluorescence intensity was performed using CellProfiler−4.0.7 (CellProfiler Image Analysis Software, RRID:SCR_007358). The mean fluorescent intensity in each channel image was measured and exported. The colocalization of channels was performed using the implemented MeasureColocalization tool in CellProfiler. Two selected channels were corrected using ImageThreshold tool to reduce the background and analyzed using colocalization metrics for pixels above a certain threshold which was set as 20% of the maximum intensity of the image. Pearson’s coefficient was used to represent the correlation of pixel intensity between the two channels. For cell identification, the implemented object identification tool was used to first identify nucleus in the DAPI channel and then identify cell region by propagation around the nucleus. Membrane was defined as the outer 5-pixel region of the cell boarder as previously described26.
Oxygen consumption rate (OCR)
OCR was measured using Oxygen Consumption Rate Assay Kit (Cayman Chemical Company 600800) following manufacturer’s instructions. IGROV-1 cells were seeded in 96-well black clear bottom plate at 0.5 million cells per well and pretreated with 100 μM phospholipids or 1 μM RSL3 in culture media for 2 hr. Media wad switched to HBSS containing each treatment and phosphorescent oxygen probe. Plate was immediately scanned using Tecan plate reader standard fluorescent measurement in kinetic mode for 4 hr. For OCR assays, 3 technical replicates and 2 biological replicates were performed.
QUANTIFICATION AND STATISTICAL ANALYSIS
Statistical analysis including unpaired t-test and ANOVA was performed using GraphPad Prism 9 in most figures unless otherwise stated in the figure legend. All data shown are representative data of at least two independent experiments with similar outcomes to ensure replication. Data are plotted as mean ± SD. No data or samples were excluded in the study.
Supplementary Material
Figure S1. PC-PUFA2s induce ferroptosis. Related to Figure 1.
A, Viability of HT-1080 cells treated with 100 μM phospholipids with different head groups with or without 10 μM ferrostatin-1 (Fer-1) for 24 hr. B, Viability of IGROV-1 cells co-treated with 50 μM PC(22:6, 22:6) or PC(20:4, 20:4) and 10 μM Fer-1, 100 μM DFO, 20 μM Z-VAD-FMK, 20 μM Nec-1s, or 100 nM Baf-A1 for 24 hr. C, IGROV-1 cells treated with 100 μM PC for 4 hr were immunostained with TfR1 antibody. Representative images showing TfR1 staining. Scale bar is shown as 20 μm. D, Lipid peroxidation measured by C11-BODIPY581/591 in HT-1080 cells treated with 100 μM PC and PE with or without 10 μM ferrostatin-1, or 1 μM RSL3 for 4 hr. E, IGROV-1 cells were treated with PC or vehicle for 5 hr and whole-cell lysate was analyzed for western blot detection of phospho-MLKL, pro and cleaved Caspase-3. F, Dose response of FINO2 in HT-1080 cells pre-treated with 15 μM PC(22:6, 22:6) for 8 hr. G, The signal intensity of monoacyl-PUFA-PLs normalized to protein concentration of each cell sample is plotted as mean ± SD of n=3 biological replicates. Statistical analysis of PC abundance between ferroptosis-sensitive and resistant cells. Data plotted as mean ± SD of n=10 for each group. H, Volcano plot of PLs and lysoPLs differentially enriched in the hippocampus of 59-week-old vs. 3-week-old mice. Data cutoff at fold change >1.5 and FDR adjusted p <0.05. Significantly depleted diacyl-PUFA-PLs and enriched lysoPLs are labeled. I, Heat maps (one-way ANOVA; FDR-corrected p-value <0.05) of diacyl-PUFA-PLs and monoacyl-PUFA-PLs in 59-week-old and 3-week-old mice. Top 14 differentially expressed lipids are shown. J, Lipids from brain tissue of Huntington’s disease (HD, n=21) and normal cases (control, n=25) were extracted and analyzed by LC-MS-based lipidomics. The relative signal intensity of annotated diacyl-PUFA-PLs compared to control samples is plotted as mean ± SD. Two-way ANOVA: p<0.03 (*), p<0.002 (**), p<0.0002 (***), p<0.0001 (****).
Figure S2. Dietary PC-PUFA2s are remodeled into the cell lipidome. Related to Figure 2.
A, A549 cells were treated with 25 μM PC(18:0, 20:4) or PC(20:4, 20:4) for 6 hr. The relative signal intensity compared to untreated-samples of PEs detected is plotted as mean ± SD of n=3 biological replicates. B, A549 cells were treated with 25 μM PS(20:4, 20:4) or PG(20:4, 20:4) for 6 hr. The relative signal intensity of PS(20:4, 20:4) and PG(20:4, 20:4) compared to vehicle are plotted as mean ± SD of n=3 biological replicates. C, Dose response of deuterated lipids with or without 10 μM Fer-1 in HT-1080 at 24 hr. D, IGROV-1 cells were treated with 25 μM [d11]-PC(18:0, 20:4) or [d22]-PC(20:4, 20:4) for 6 hr. The relative signal intensity of non-deuterated lipids compared to untreated-samples are plotted as mean ± SD of n=4 biological replicates. Unpaired t-test and two-way ANOVA: p<0.03 (*), p<0.002 (**), p<0.0002 (***), p<0.0001 (****).
Figure S3. PC-PUFA2 is involved in dietary fatty acid remodeling. Related to Figure 3.
A, IGROV-1 cells were treated with 25 μM DHA or ARA with or without co-treatment of 30 μM phospholipase A2 inhibitor (PLA2i) ONO-RS-082 for 6 hr. The relative signal intensity of PC and PE compared to untreated samples are plotted as mean ± SD of n=3 biological replicates. B, Cas9 overexpressing HT-1080 were transiently transfected with non-targeting or ACSL4-targeting sgRNA to achieve CRISPR knockdown. Viability is shown for knockdown cells treated with 1 μM RSL3 or 100 μM PC for 24 hr. The knockdown efficiency was confirmed by qPCR and western blot. Empty lanes are cut and indicated by the dotted line. One-way and two-way ANOVA: p<0.03 (*), p<0.002 (**), p<0.0002 (***), p<0.0001 (****).
Figure S4. PL-PUFA2s exhibit interaction with mitochondrial electron transport chain. Related to Figure 4.
A, HT-1080 whole-cell lysate was incubated with biotinylated phospholipids, vehicle, or biotin, and phospholipid-bound proteins were identified by MS-based proteomics. Heat map (one-way ANOVA; FDR-corrected p-value <0.05) showing the top 25 hits of differentially enriched genes among all groups. n=3 technical replicates are shown for each group. B, Dose response of PC(22:6, 22:6) in IGROV-1 cells transfected with pooled siRNAs targeting 11 proteins identified in the heat map. Relative viability is compared to vehicle-treated group and is plotted as mean ± SD of n=4 technical replicates. C, Gene set enrichment analysis of genes enriched and depleted in PL(22:6, 22:6) compared to PL(18:0, 22:6). Top pathways and related genes are shown with p.adjusted <0.1. A part of the detailed view of the chemical carcinogenesis—reactive oxygen species is shown. D, HT-1080 cells were treated with 50 μM biotinylated PL(22:6, 22:6) for 6 hr and immunostained with streptavidin-cy5. Representative images showing PL stain. Scale bar is shown as 20 μm. E, HT-1080 cells were treated with 25 μM PC(22:6, 22:6) for 6 hr. Mitochondria were isolated and lipids from mitochondria and the rest cell compartments were extracted. The signal intensity of PC(22:6, 22:6) is normalized to protein concentration of each sample and presented as fold change to untreated samples. Data are plotted as mean ± SD of n=3 biological replicates. Two-way ANOVA: p<0.03 (*), p<0.002 (**), p<0.0002 (***), p<0.0001 (****).
Figure S5. PC-PUFA2s induces mitochondrial stress. Related to Figure 5.
A, Representative images of rhodamine123 and MitoTracker deep red staining in IGROV-1 cells treated with 100 μM PC, vehicle, or 10 μM Antimycin A for 4 hr. Scale bar is shown as 20 μm. B, Bright field images of HT-1080 cells treated with 100 μM PC(22:6, 22:6) or 1 μM RSL3 after the course of OCR assay for 6 hr. Scale bar is shown as 200 μm. C, Representative images showing MitoSOX green and MitoTracker deep red staining in IGROV-1 cells treated with 100 μM PC(22:6, 22:6) with or without 10 μM Fer-1 and 0.2 μM mitoQ for 4 hr. D, Lipid peroxidation measured by C11-BODIPY581/591 in IGROV-1 cells treated with 10 μM Antimycin A or 5 μM rotenone for 4 hr. E, Viability of IGROV-1 cells co-treated with PC(22:6, 22:6) and VDAC1 inhibitor, DIDS for 24 hr (left). IGROV-1 cells were knockdown with pooled siRNA targeting VDAC1, VDAC2, or VDAC3 and then co-treated with PC(22:6, 22:6) for 24 hr (right). F, HT-1080 cells overexpressing mcherry-Parkin were treated with 12.5 μM CCCP for 48 hr to induce mitophagy. Fluorescent images of MitoTracker deep red are shown. Relative fluorescent intensity compared to control is plotted as mean ± SD of n=9–10 images. MT-DNA transcript was measure by qPCR. Dose response curve of PC(22:6, 22:6) in CCCP-treated cells. Un-paired t-test and two-way ANOVA: p<0.03 (*), p<0.002 (**), p<0.0002 (***), p<0.0001 (****), not significant (ns).
Figure S6. PC-PUFA2s induce lipid peroxidation, but not an unfolded protein response in ER. Related to Figure 6.
A, IGROV-1 cells were treated with 100 μM PCs for 4 hr. Representative images of cells co-stained with Liperfluo and MitoTracker and ER-Tracker. B, The transcript level measured by qPCR and protein level measured by western blot of UPR mediators, XBP1s, ATF4, and GADD in IGROV-1 cells treated with 25 μM PC, 1 μM Brefeldin A, or 1 μM thapsigargin (Tg) for 24 hr. C, Mitochondrial lipid peroxidation measured by mitoCLox in IGROV-1 cells treated with 100 μM PC(22:6, 22:6) for 4 hr. Cells were co-stained with ER-Tracker or MitoTracker. Fluorescent images are shown as composite of Liperfluo in green and ER-Tracker or MitoTracker in pseudo-magenta. Relative fluorescent intensity compared to control is plotted as mean ± SD of n=135–145 cells. Un-paired t-test and two-way ANOVA: p<0.03 (*), p<0.002 (**), p<0.0002 (***), p<0.0001 (****), not significant (ns).
Key resources table
| REAGENT or RESOURCE | SOURCE | IDENTIFIER |
|---|---|---|
| Antibodies | ||
| Rabbit monoclonal anti-GPX4 | Abcam | Cat#ab125066; RRID:AB_10973901 |
| Mouse monoclonal anti-ACSL4 (clone F-4) | Santa Cruz Biotechnology | Cat#sc-365230; RRID: AB_10843105 |
| Rabbit monoclonal anti-phospho-MLKL Ser345 (clone D6E3G) | Cell Signaling Technology | Cat#37333S |
| Rabbit polyclonal anti-Caspase-3 | Cell Signaling Technology | Cat#9662; RRID: RRID: AB_331439 |
| Rabbit polyclonal anti-cleaved Caspase-3 Asp175 | Cell Signaling Technology | Cat#9661; RRID: RRID:AB_2341188 |
| Mouse monoclonal anti-XBP1s (clone 143F) | BioLegend | Cat#647501; RRID: AB_2241744 |
| Mouse monoclonal anti-GADD (clone B-3) | Santa Cruz Biotechnology | Cat#sc-7351; RRID: AB_627411 |
| Rabbit polyclonal anti-GAPDH | Abcam | Cat#ab9485; RRID: AB_307275 |
| Rabbit monoclonal anti-pan-Actin (clone D18C11) | Cell Signaling Technology | Cat#8456S |
| Rabbit polyclonal anti-Calnexin | Abcam | Cat#ab22595; RRID: AB_2069006 |
| Mouse monoclonal anti-COX IV | Abcam | Cat#ab33985; RRID: AB_879754 |
| Mouse monoclonal anti-Giantin (clone 9B6) | Abcam | Cat#ab37266; RRID: AB_880195 |
| Rabbit monoclonal anti-LAMP1 (clone D2D11) | Cell Signaling Technology | Cat#9091T; RRID: AB_2687579 |
| Mouse monoclonal anti-TfR1 (clone 3F3-FMA) | Feng et al.26 | |
| Mouse monoclonal anti-alpha-Tubulin (clone DM1A) | Santa Cruz Biotechnology | Cat#sc-32293; RRID: AB_628412 |
| Rabbit monoclonal anti-ETC complex sampler (anti-NDUFS1, anti-NDUFAB1, anti-UQCRFS1, anti-COX IV) | Cell Signaling Technology | Cat#42642 |
| Goat polyclonal anti-mouse IgG (H+L) Alexa Fluor 488 | Thermo Fisher Scientific | Cat#A32723; RRID: AB_2633275 |
| Goat polyclonal anti-rabbit IgG (H+L) Alexa Fluor 405 | Thermo Fisher Scientific | Cat#A48254; RRID: AB_2890548 |
| Goat polyclonal anti-mouse IgG (H+L) Alexa Fluor 594 | Thermo Fisher Scientific | Cat#A-11032; RRID: AB_2534091 |
| Goat polyclonal IRDye 800CW anti-mouse IgG (H+L) | Biosciences | Cat#926-32210; RRID: AB_621842 |
| Goat polyclonal IRDye 680RD anti-rabbit IgG (H+L) | Biosciences | Cat#926-68071; RRID: AB_10956166 |
| Chemicals, peptides, and recombinant proteins | ||
| (1S,3R)-RSL3 | Yang et al.53 | CAS: 1219810-16-8 |
| Ferrostatin-1 | Sigma-Aldrich | Cat#SML0583; CAS: 347174-05-4 |
| Deferoxamine mesylate | Sigma-Aldrich | Cat#D9533; CAS: 138-14-7 |
| Z-VAD-FMK | Selleck Chemicals | Cat#S7023; CAS: 634911-81-9 |
| Necrostatin-1s | Cell Signaling Technology | Cat#17802S; CAS: 852391-15-2 |
| Bafilomycin A1 | Cayman Chemical | Cat#11038; CAS: 88899-55-2 |
| ONO-RS-082 | Cayman Chemical | Cat#20243; CAS: 99754-06-0 |
| FIN56 | Selleckchem | Cat#S8254; CAS: 942285-55-4 |
| IKE | Zhang et al.54 | CAS: 1801530-11-9 |
| FINO2 | Gaschler et al.27 | CAS: 869298-31-7 |
| CCCP | Cayman Chemical | Cat#25458; CAS: 555-60-2 |
| Brefeldin A | Cayman Chemical | Cat#11861; CAS: 20350-15-6 |
| Thapsigargin | Cayman Chemical | Cat#10522; CAS: 67526-95-8 |
| Zeocin | Thermo Fisher Scientific | Cat#R25001; CAS: 11006-33-0 |
| Mitoquinone mesylate | Cayman Chemical | Cat#29317; CAS: 845959-50-4 |
| Decylubiquinone | Cayman Chemical | Cat#21027; CAS: 55486-00-5 |
| 2-Hydroxypropyl-β-cyclodextrin | Cayman Chemical | Cat#16169; CAS: 128446-35-5 |
| 4-chlorobenzoic acid | Sigma-Aldrich | Cat#135585; CAS: 74-11-3 |
| DIDS sodium salt | Cayman Chemical | Cat#16125; CAS: 67483-13-0 |
| Rotenone | EMD Millipore | Cat#557368; CAS: 83-79-4 |
| Antimycin A | Sigma-Aldrich | Cat#A8674; CAS: 1397-94-0 |
| Biotin PEG thiol | Polypure | Cat#41156-1095 |
| PC(18:0, 20:4) | Avanti Polar Lipids | Cat#850469C |
| PC(18:0, 22:6) | Avanti Polar Lipids | Cat#850472C |
| PC(18:0, 18:0) | Avanti Polar Lipids | Cat#850365C |
| PC(20:4, 20:4) | Avanti Polar Lipids | Cat#850397 |
| PC(22:6, 22:6) | Avanti Polar Lipids | Cat#850400C |
| PE(18:0, 22:6) | Avanti Polar Lipids | Cat#850806C |
| PE(22:6, 22:6) | Avanti Polar Lipids | Cat#850797C |
| PE(20:4, 20:4) | Avanti Polar Lipids | Cat#850800C |
| PG(20:4, 20:4) | Avanti Polar Lipids | Cat#840490C |
| PS(20:4, 20:4) | Avanti Polar Lipids | Cat#840066C |
| Biotin-PL(18:0, 22:6) | Avanti Polar Lipids | N/A |
| Biotin-PL(22:6, 22:6) | Avanti Polar Lipids | N/A |
| Biotin-PL(16:0, 16:0) | Avanti Polar Lipids | Cat#870285P |
| [d11]-PC(18:0, 20:4) | Cayman Chemical | N/A |
| [d22]-PC(20:4, 20:4) | Cayman Chemical | N/A |
| Arachidonic acid | Cayman Chemical | Cat#90010; CAS: 506-32-1 |
| Docosahexaenoic acid | Cayman Chemical | Cat#90310; CAS: 6217-54-5 |
| Oleic acid | Cayman Chemical | Cat#90260; CAS: 112-80-1 |
| Splash Lipidomics Mass Spec Standard | Avanti Polar Lipids | Cat#330707 |
| Butylated Hydroxytoluene | Sigma-Aldrich | Cat#W218405; CAS: 128-37-0 |
| Methanol, Optima LC-MS grade | Fisher Scientific | Cat#A456; CAS: 67-56-1 |
| Methyl tert-butyl ether | Fisher Scientific | Cat#E127; CAS: 1634-04-4 |
| Isopropanol, Optima LC-MS grade | Fisher Scientific | Cat#A461; CAS: 6763-0 |
| Water, Optima LC-MS grade | Fisher Scientific | Cat#W6500; CAS: 7732-18-5 |
| Acetonitrile, Optima LC-MS grade | Fisher Scientific | Cat#A955; CAS: 7505-8 |
| Ammonium acetate, Optima LC-MS grade | Fisher Scientific | Cat#A11450; CAS: 631-61-8 |
| Acetic acid, Optima LC-MS grade | Fisher Scientific | Cat#A11350; CAS: 64-19-7 |
| Tris (2-Carboxyethyl) Phosphine Hydrochloride | Goldbio | Cat#TCEP25; CAS: 51805-45-9 |
| Chloroacetamide | Sigma-Aldrich | Cat#C0267; CAS: 79-07-2 |
| Ethyl acetate | Sigma-Aldrich | Cat#34858; CAS: 141-78-6 |
| Trifluoroacetic acid | Thermo Fisher Scientific | Cat#85183; CAS: 76-05-1 |
| Ammonia | Thermo Fisher Scientific | Cat#984766; CAS: 7664-41-7 |
| Formic acid, Optima LC-MS grade | Fisher Scientific | Cat#A117-50; CAS: 64-18-6 |
| Paraformaldehyde | Electron Microscopy Sciences | Cat#50-00-0; CAS: 30525-89-4 |
| Triton X-100 | Sigma-Aldrich | Cat#X100PC; CAS: 9036-19-5 |
| Dimethyl sulfoxide | Sigma-Aldrich | Cat#276855; CAS: 67-68-5 |
| MgCl2 | New England Biolabs | Cat#B9021S; CAS: 7786-30-3 |
| Critical commercial assays | ||
| Pierce BCA Protein Assay Kit | Thermo Fisher Scientific | Cat#23225 |
| Pierce MS-Compatible Magnetic IP Kits | Thermo Fisher Scientific | Cat#90408 |
| Mitochondria Isolation Kit | Thermo Fisher Scientific | Cat#89874 |
| NuPAGE 4–12% Bis-tris gel | Fisher Scientific | Cat#WG1401 |
| iBIot™ 2 Transfer Stacks, nitrocellulose | Thermo Fisher Scientific | Cat#IB23002 |
| RNeasy Mini Kit | Qiagen | Cat#74136 |
| Deposited data | ||
| Proteomics data | ProteomeXchange | PXD041993 |
| Lipidomics data | MetaboLights | MTBLS7772 |
| Experimental models: Cell lines | ||
| IGROV-1 | This lab | N/A |
| Huh7 | This lab | N/A |
| HT-1080 | This lab | N/A |
| SU-DHL-5 | This lab | N/A |
| Calu-1 | This lab | N/A |
| A498 | This lab | N/A |
| 143B | This lab | N/A |
| CAL-85-1 | This lab | N/A |
| MCF-7 | This lab | N/A |
| CAL-120 | This lab | N/A |
| CAL-51 | This lab | N/A |
| C-33A | This lab | N/A |
| SU-DHL-6 | This lab | N/A |
| AU565 | This lab | N/A |
| HCC2218 | This lab | N/A |
| 786-O | This lab | N/A |
| LS513 | This lab | N/A |
| NCI-H358 | This lab | N/A |
| NCI-H2087 | This lab | N/A |
| NCI-H1299 | This lab | N/A |
| SK-BR-3 | This lab | N/A |
| HCT116 | This lab | N/A |
| Cas9 overexpressing HT-1080 | Kraft et al.16 | N/A |
| Mcherry-Parkin overexpressing HT-1080 | Gaschler et al.20 | N/A |
| Oligonucleotides | ||
| Primers for qPCR | Table S2 | N/A |
| siRNAs | Table S3 | N/A |
| Software and algorithms | ||
| GraphPad Prism 9 | GraphPad | https://www.graphpad.com/ |
| FlowJo, v10.8 | FlowJo, LLC | https://imagei.nih.gov/ij/ |
| MetaboAnalyst, v5.0 | MetaboAnalyst | https://www.metaboanalyst.ca/ |
| MassLynx, v4.1 | Waters | http://www.waters.com/waters/en_US/MassLynx-MS-Software/ |
| Progenesis QI | Waters | https://www.nonlinear.com/progenesis/qi/ |
| DAVID, v6.8 | LHRI | https://david.ncifcrf.gov |
| clusterProfiler, v4.6.2 | Bioconductor | https://bioconductor.org/packages/release/bioc/html/clusterProfiler.html |
| RStudio, v1.4 | Posit | https://support--rstudio-com.netlify.app/products/rstudio/ |
| CellProfiler, v4.0.7 | CellProfiler | https://cellprofiler.org/ |
| Fiji: ImageJ, v4.0.7 | Fiji | https://fiji.sc/ |
| Other | ||
| Dulbecco’s modified Eagle’s medium | Corning-FISHER | Cat#10-013 |
| DMEM without methionine and cystine | Thermo Fisher Scientific | Cat#21013024 |
| McCoy’s 5A medium | Thermo Fisher Scientific | Cat#16600108 |
| RPMI-1640 medium | Cytiva | Cat#SH30096 |
| Eagle’s minimum essential medium | VWR | Cat#10128 |
| Opti-MEM reduced serum medium | Life Technologies | Cat#31985 |
| HBSS containing calcium and magnesium | Thermo Fisher Scientific | Cat#14025092 |
| Fetal bovine serum | Thermo Fisher Scientific | Cat#26400044 |
| Penicillin-Streptomycin | Thermo Fisher Scientific | Cat#15140122 |
| Puromycin dihydrochloride | Santa Cruz Biotechnology | Cat#sc-108071; CAS: 58-58-2 |
| Non-essential amino acids | Thermo Fisher Scientific | Cat#1140076 |
| Glutamate | Thermo Fisher Scientific | Cat#35050061 |
| Sodium pyruvate | Cytiva | Cat#SH30239.01 |
| Methionine | Sigma-Aldrich | Cat#M9625 |
| Cystine | Sigma-Aldrich | Cat#C8755 |
| Human holo-Transferrin | Sigma-Aldrich | Cat#T0665 |
| Lipofectamine RNAiMAX | Thermo Fisher Scientific | Cat#13778075 |
| Protease inhibitor cocktail | ApexBio | Cat#K1007 |
| RIPA buffer | Thermo Fisher Scientific | Cat#89901 |
| Protease inhibitor cocktail tablet | Sigma-Aldrich | Cat#11697498001 |
| Blue loading buffer with DTT | Cell Signaling Technology | Cat#7722S |
| TBS blocking buffer | Thermo Fisher Scientific | Cat#37535 |
| PCR buffer | Thermo Fisher Scientific | Cat#N8080129 |
| dNTP mix | Thermo Fisher Scientific | Cat#4303441 |
| Oligo d(T)16 | Thermo Fisher Scientific | Cat#N8080128 |
| Rnase inhibitor | New England Biolabs | Cat#M0303S |
| MultiScribe reverse transcriptase | Thermo Fisher Scientific | Cat#4311235 |
| Power SYBR Green PCR Master Mix | Thermo Fisher Scientific | Cat#4368577 |
| VECTASHIELD mounting medium | Vector Laboratories | Cat#H-1900 |
| CellTiter-Glo | Promega | Cat#G7573 |
| C11-BODIPY581/591 | Invitrogen | Cat#D-3861 |
| MitoSOX Red | Thermo Fisher Scientific | Cat#M36008 |
| MitoSOX green | Thermo Fisher Scientific | Cat#M36006 |
| MitoCLox | Lumiprobe | Cat#3549 |
| Liperfluo | Dojindo | Cat#L248-10 |
| MitoTracker deep red | Invitrogen | Cat#M22426 |
| ER-Tracker blue-white | Invitrogen | Cat#E12353 |
| Rhodamine123 | Sigma-Aldrich | Cat#83702 |
| NucBlue | Thermo Fisher Scientific | Cat#R37605 |
| Streptavidin-cy5 | ApexBio | Cat#K1080 |
| Normal goat serum | Thermo Scientific | Cat#50062Z |
| Trypsin/Lys-C Mix | Fisher Scientific | Cat#PRV5071 |
Highlights.
Dietary PC-PUFA2s induce ferroptosis in various cancer cell lines
Dietary PUFA selectively increases PC-PUFA2 accumulation in cells
PL-PUFA2s exhibit interaction with mitochondrial ETC complex I
PC-PUFA2s induce mitochondrial ROS production essential for ferroptosis
Acknowledgements
This research of B.R.S. was supported by NCI grant R35CA209896. We thank our providers of the Huntington’s disease and control human brain samples including the Brain Endowment Bank at University of Miami, Human Brain and Spinal Fluid Resource Center, NIH NeuroBioBank’s Brain and Tissue repository at the University of Maryland, Harvard Brain Tissue Resource Center at Harvard Medical School Teaching Hospital, New York Brain Bank at Columbia University, and Mount Sinai NBTR NeuroBioBank.
Footnotes
Publisher's Disclaimer: This is a PDF file of an unedited manuscript that has been accepted for publication. As a service to our customers we are providing this early version of the manuscript. The manuscript will undergo copyediting, typesetting, and review of the resulting proof before it is published in its final form. Please note that during the production process errors may be discovered which could affect the content, and all legal disclaimers that apply to the journal pertain.
Declaration of interests
B.R.S. is an inventor on patents and patent applications involving ferroptosis; co-founded and serves as a consultant to ProJenX, Inc. and Exarta Therapeutics; holds equity in Sonata Therapeutics; serves as a consultant to Weatherwax Biotechnologies Corporation and Akin Gump Strauss Hauer & Feld LLP. C.B. is now the associate scientific director at Virgo Health. The remaining authors declare no competing interests.
References
- 1.Dai Y, Tang H, and Pang S (2021). The crucial roles of phospholipids in aging and lifespan regulation. Front Physiol 12, 775648. 10.3389/fphys.2021.775648. [DOI] [PMC free article] [PubMed] [Google Scholar]
- 2.Wang B, and Tontonoz P (2019). Phospholipid remodeling in physiology and disease. Annu. Rev. Physiol 81, 165–188. 10.1146/annurev-physiol-020518-114444. [DOI] [PMC free article] [PubMed] [Google Scholar]
- 3.Chilton FH, Fonteh AN, Surette ME, Triggiani M, Winkler JD (1996). Control of arachidonate levels within inflammatory cells. BBA-Lipid Lipid Met 1299, 1–15. 10.1016/0005-2760(95)00169-7. [DOI] [PubMed] [Google Scholar]
- 4.Siegel MI, McConnell RT, Brent DA, Chandrasurin PISAL, Macfarlane RD, McNeal CJ (1982). The formation of diarachidonyl diglyceride by rat neutrophils. Mol. Pharmacol 21, 688–693. [PubMed] [Google Scholar]
- 5.Blank ML, Cress EA, Robinson M and Snyder F (1985). Metabolism of unique diarachidonoyl and linoleoylarachidonoyl species of ethanolamine and choline phosphoglycerides in rat testes. BBA-Lipid Lipid Met 833, 366–371. 10.1016/0005-2760(85)90092-X. [DOI] [PubMed] [Google Scholar]
- 6.Chilton FH, and Murphy RC (1987). Stimulated production and natural occurrence of 1,2-diarachidonoylglycerophosphocholine in human neutrophils. Biochem. Biophys. Res. Commun 145, 1126–1133. 10.1016/0006-291X(87)91554-3. [DOI] [PubMed] [Google Scholar]
- 7.Werlein A, Peters A, Ngoune R, Winkler K, and Putz G (2015). Interference of phosphatidylcholines with in-vitro cell proliferation - no flock without black sheep. Biochim Biophys Acta 1848, 1599–1608. 10.1016/j.bbamem.2015.04.010. [DOI] [PubMed] [Google Scholar]
- 8.Yuan H, Li X, Zhang X, Kang R, and Tang D (2016). Identification of ACSL4 as a biomarker and contributor of ferroptosis. Biochem Biophys Res Commun 478, 1338–1343. 10.1016/j.bbrc.2016.08.124. [DOI] [PubMed] [Google Scholar]
- 9.Shan K, Feng N, Zhu D, Qu H, Fu G, Li J, Cui J, Chen H, Wang R, Qi Y, and Chen YQ (2022). Free docosahexaenoic acid promotes ferroptotic cell death via lipoxygenase dependent and independent pathways in cancer cells. Eur J Nutr 61, 4059–4075. 10.1007/s00394-022-02940-w. [DOI] [PubMed] [Google Scholar]
- 10.Liang D, Minikes AM, and Jiang X (2022). Ferroptosis at the intersection of lipid metabolism and cellular signaling. Mol Cell 82, 2215–2227. 10.1016/j.molcel.2022.03.022. [DOI] [PMC free article] [PubMed] [Google Scholar]
- 11.Magtanong L, Ko PJ, To M, Cao JY, Forcina GC, Tarangelo A, Ward CC, Cho K, Patti GJ, Nomura DK, et al. (2019). Exogenous monounsaturated fatty acids promote a ferroptosis-resistant cell state. Cell Chem Biol 26, 420–432. 10.1016/j.chembiol.2018.11.016. [DOI] [PMC free article] [PubMed] [Google Scholar]
- 12.Dixon SJ, Winter GE, Musavi LS, Lee ED, Snijder B, Rebsamen M, Superti-Furga G, and Stockwell BR (2015). Human haploid cell genetics reveals roles for lipid metabolismgenes in nonapoptotic cell death. ACS Chem Biol 10, 1604–1609. 10.1021/acschembio.5b00245. [DOI] [PMC free article] [PubMed] [Google Scholar]
- 13.Doll S, Proneth B, Tyurina YY, Panzilius E, Kobayashi S, Ingold I, Irmler M, Beckers J, Aichler M, Walch A, et al. (2017). ACSL4 dictates ferroptosis sensitivity by shaping cellular lipid composition. Nat Chem Biol 13, 91–98. 10.1038/nchembio.2239. [DOI] [PMC free article] [PubMed] [Google Scholar]
- 14.Kagan VE, Mao G, Qu F, Angeli JP, Doll S, Croix CS, Dar HH, Liu B, Tyurin VA, Ritov VB, et al. (2017). Oxidized arachidonic and adrenic PEs navigate cells to ferroptosis. Nat Chem Biol 13, 81–90. 10.1038/nchembio.2238. [DOI] [PMC free article] [PubMed] [Google Scholar]
- 15.Stockwell BR (2022). Ferroptosis turns 10: Emerging mechanisms, physiological functions, and therapeutic applications. Cell 185, 2401–2421. 10.1016/j.cell.2022.06.003. [DOI] [PMC free article] [PubMed] [Google Scholar]
- 16.Kraft VAN, Bezjian CT, Pfeiffer S, Ringelstetter L, Muller C, Zandkarimi F, Merl-Pham J, Bao X, Anastasov N, Kossl J, et al. (2020). GTP cyclohydrolase 1/tetrahydrobiopterin counteract ferroptosis through lipid remodeling. ACS Cent Sci 6, 41–53. 10.1021/acscentsci.9b01063. [DOI] [PMC free article] [PubMed] [Google Scholar]
- 17.von Krusenstiern AN, Robson RN, Qian N, Qiu B, Hu F, Reznik E, Smith N, Zandkarimi F, Estes VM, Dupont M, et al. (2023). Identification of essential sites of lipid peroxidation in ferroptosis. Nat Chem Biol. 10.1038/s41589-022-01249-3. [DOI] [PMC free article] [PubMed] [Google Scholar]
- 18.Li Y, Wang X, Huang Z, Zhou Y, Xia J, Hu W, Wang X, Du J, Tong X, and Wang Y (2021). CISD3 inhibition drives cystine-deprivation induced ferroptosis. Cell Death Dis 12, 839. 10.1038/s41419-021-04128-2. [DOI] [PMC free article] [PubMed] [Google Scholar]
- 19.Li Y, Xia J, Shao F, Zhou Y, Yu J, Wu H, Du J, and Ren X (2021). Sorafenib induces mitochondrial dysfunction and exhibits synergistic effect with cysteine depletion by promoting HCC cells ferroptosis. Biochem Biophys Res Commun 534, 877–884. 10.1016/j.bbrc.2020.10.083. [DOI] [PubMed] [Google Scholar]
- 20.Gaschler MM, Hu F, Feng H, Linkermann A, Min W, and Stockwell BR (2018). Determination of the subcellular localization and mechanism of action of ferrostatins in suppressing ferroptosis. ACS Chem Biol 13, 1013–1020. 10.1021/acschembio.8b00199. [DOI] [PMC free article] [PubMed] [Google Scholar]
- 21.Chen X, Kang R, Kroemer G, and Tang D (2021). Organelle-specific regulation of ferroptosis. Cell Death Differ 28, 2843–2856. 10.1038/s41418-021-00859-z. [DOI] [PMC free article] [PubMed] [Google Scholar]
- 22.Gao M, Yi J, Zhu J, Minikes AM, Monian P, Thompson CB, and Jiang X (2019). Role of mitochondria in ferroptosis. Mol Cell 73, 354–363 e353. 10.1016/j.molcel.2018.10.042. [DOI] [PMC free article] [PubMed] [Google Scholar]
- 23.Mbah NE, and Lyssiotis CA (2022). Metabolic regulation of ferroptosis in the tumor microenvironment. J Biol Chem 298, 101617. 10.1016/j.jbc.2022.101617. [DOI] [PMC free article] [PubMed] [Google Scholar]
- 24.Oh SJ, Ikeda M, Ide T, Hur KY, and Lee MS (2022). Mitochondrial event as an ultimate step in ferroptosis. Cell Death Discov 8, 414. 10.1038/s41420-022-01199-8. [DOI] [PMC free article] [PubMed] [Google Scholar]
- 25.Lyamzaev KG, Panteleeva AA, Simonyan RA, Avetisyan AV, and Chernyak BV (2023). Mitochondrial lipid peroxidation is responsible for ferroptosis. Cells 12, 611. 10.3390/cells12040611. [DOI] [PMC free article] [PubMed] [Google Scholar]
- 26.Feng H, Schorpp K, Jin J, Yozwiak CE, Hoffstrom BG, Decker AM, Rajbhandari P, Stokes ME, Bender HG, Csuka JM, et al. (2020). Transferrin receptor is a specific ferroptosis marker. Cell Rep 30, 3411–3423. 10.1016/j.celrep.2020.02.049. [DOI] [PMC free article] [PubMed] [Google Scholar]
- 27.Gaschler MM, Andia AA, Liu H, Csuka JM, Hurlocker B, Vaiana CA, Heindel DW, Zuckerman DS, Bos PH, Reznik E, et al. (2018). FINO(2) initiates ferroptosis through GPX4 inactivation and iron oxidation. Nat Chem Biol 14, 507–515. 10.1038/s41589-018-0031-6. [DOI] [PMC free article] [PubMed] [Google Scholar]
- 28.Ding J, Ji J, Rabow Z, Shen T, Folz J, Brydges CR, Fan S, Lu X, Mehta S, Showalter MR, et al. (2021). A metabolome atlas of the aging mouse brain. Nat Commun 12, 6021. 10.1038/s41467-021-26310-y. [DOI] [PMC free article] [PubMed] [Google Scholar]
- 29.Chen D, Chu B, Yang X, Liu Z, Jin Y, Kon N, Rabadan R, Jiang X, Stockwell BR, and Gu W (2021). iPLA2beta-mediated lipid detoxification controls p53-driven ferroptosis independent of GPX4. Nat Commun 12, 3644. 10.1038/s41467-021-23902-6. [DOI] [PMC free article] [PubMed] [Google Scholar]
- 30.Stockwell BR, Friedmann Angeli JP, Bayir H, Bush AI, Conrad M, Dixon SJ, Fulda S, Gascon S, Hatzios SK, Kagan VE, et al. (2017). Ferroptosis: A Regulated Cell Death Nexus Linking Metabolism, Redox Biology, and Disease. Cell 171, 273–285. 10.1016/j.cell.2017.09.021. [DOI] [PMC free article] [PubMed] [Google Scholar]
- 31.Jakaria M, Belaidi AA, Bush AI, and Ayton S (2021). Ferroptosis as a mechanism of neurodegeneration in Alzheimer’s disease. J Neurochem 159, 804–825. 10.1111/jnc.15519. [DOI] [PubMed] [Google Scholar]
- 32.Dong L, Zhou S, Bai X, and He X (2023). Construction of a prognostic model for HCC based on ferroptosis-related lncRNAs expression and its potential to predict the response and irAEs of immunotherapy. Front Pharmacol 14, 1090895. 10.3389/fphar.2023.1090895. [DOI] [PMC free article] [PubMed] [Google Scholar]
- 33.Sassano ML, Felipe-Abrio B, and Agostinis P (2022). ER-mitochondria contact sites; a multifaceted factory for Ca(2+) signaling and lipid transport. Front Cell Dev Biol 10, 988014. 10.3389/fcell.2022.988014. [DOI] [PMC free article] [PubMed] [Google Scholar]
- 34.Niu B, Lei X, Xu Q, Ju Y, Xu D, Mao L, Li J, Zheng Y, Sun N, Zhang X, et al. (2022). Protecting mitochondria via inhibiting VDAC1 oligomerization alleviates ferroptosis in acetaminophen-induced acute liver injury. Cell Biol Toxicol 38, 505–530. 10.1007/s10565-021-09624-x. [DOI] [PubMed] [Google Scholar]
- 35.Wiernicki B, Dubois H, Tyurina YY, Hassannia B, Bayir H, Kagan VE, Vandenabeele P, Wullaert A, and Vanden Berghe T (2020). Excessive phospholipid peroxidation distinguishes ferroptosis from other cell death modes including pyroptosis. Cell Death Dis 11, 922. 10.1038/s41419-020-03118-0. [DOI] [PMC free article] [PubMed] [Google Scholar]
- 36.Wenzel SE, Tyurina YY, Zhao J, St Croix CM, Dar HH, Mao G, Tyurin VA, Anthonymuthu TS, Kapralov AA, Amoscato AA, et al. (2017). PEBP1 wardens ferroptosis by enabling lipoxygenase generation of lipid death signals. Cell 171, 628–641. 10.1016/j.cell.2017.09.044. [DOI] [PMC free article] [PubMed] [Google Scholar]
- 37.Zhao J, O’Donnell VB, Balzar S, St Croix CM, Trudeau JB, and Wenzel SE (2011). 15-Lipoxygenase 1 interacts with phosphatidylethanolamine-binding protein to regulate MAPK signaling in human airway epithelial cells. Proc Natl Acad Sci 108, 14246–14251. 10.1073/pnas.1018075108. [DOI] [PMC free article] [PubMed] [Google Scholar]
- 38.Defries D, Curtis K, Petkau JC, Shariati-Ievari S, Blewett H, and Aliani M (2022). Patterns of alpha-linolenic acid incorporation into phospholipids in H4IIE cells. J Nutr Biochem 106, 109014. 10.1016/j.jnutbio.2022.109014. [DOI] [PubMed] [Google Scholar]
- 39.Cui W, Liu D, Gu W, and Chu B (2021). Peroxisome-driven ether-linked phospholipids biosynthesis is essential for ferroptosis. Cell Death Differ 28, 2536–2551. 10.1038/s41418-021-00769-0. [DOI] [PMC free article] [PubMed] [Google Scholar]
- 40.Lee H, Zhuang L, and Gan B (2021). Ether phospholipids govern ferroptosis. J Genet Genomics 48, 517–519. 10.1016/j.jgg.2021.05.003. [DOI] [PMC free article] [PubMed] [Google Scholar]
- 41.Sun WY, Tyurin VA, Mikulska-Ruminska K, Shrivastava IH, Anthonymuthu TS, Zhai YJ, Pan MH, Gong HB, Lu DH, Sun J, et al. (2021). Phospholipase iPLA(2)beta averts ferroptosis by eliminating a redox lipid death signal. Nat Chem Biol 17, 465–476. 10.1038/s41589-020-00734-x. [DOI] [PMC free article] [PubMed] [Google Scholar]
- 42.Lu B, Chen XB, Hong YC, Zhu H, He QJ, Yang B, Ying MD, and Cao J (2019). Identification of PRDX6 as a regulator of ferroptosis. Acta Pharmacol Sin 40, 1334–1342. 10.1038/s41401-019-0233-9. [DOI] [PMC free article] [PubMed] [Google Scholar]
- 43.Bartolacci C, Andreani C, Vale G, Berto S, Melegari M, Crouch AC, Baluya DL, Kemble G, Hodges K, Starrett J, et al. (2022). Targeting de novo lipogenesis and the Lands cycle induces ferroptosis in KRAS-mutant lung cancer. Nat Commun 13, 4327. 10.1038/s41467-022-31963-4. [DOI] [PMC free article] [PubMed] [Google Scholar]
- 44.Levental KR, Malmberg E, Symons JL, Fan YY, Chapkin RS, Ernst R, and Levental I (2020). Lipidomic and biophysical homeostasis of mammalian membranes counteracts dietary lipid perturbations to maintain cellular fitness. Nat Commun 11, 1339. 10.1038/s41467-020-15203-1. [DOI] [PMC free article] [PubMed] [Google Scholar]
- 45.Irvine RF, Dawson RM (1979). Transfer of arachidonic acid between phospholipids in rat liver microsomes. Biochem. Biophys. Res. Commun 91, 1399–1405. 10.1016/0006-291X(79)91222-1. [DOI] [PubMed] [Google Scholar]
- 46.Renne MF, Bao X, Hokken MW, Bierhuizen AS, Hermansson M, Sprenger RR, Ewing TA, Ma X, Cox RC, Brouwers JF, et al. (2022). Molecular species selectivity of lipid transport creates a mitochondrial sink for di-unsaturated phospholipids. EMBO J 41, e106837. 10.15252/embj.2020106837. [DOI] [PMC free article] [PubMed] [Google Scholar]
- 47.Sullivan EM, Pennington ER, Green WD, Beck MA, Brown DA, and Shaikh SR (2018). Mechanisms by which dietary fatty acids regulate mitochondrial structure-function in health and disease. Adv Nutr 9, 247–262. 10.1093/advances/nmy007. [DOI] [PMC free article] [PubMed] [Google Scholar]
- 48.Herbst EA, Paglialunga S, Gerling C, Whitfield J, Mukai K, Chabowski A, Heigenhauser GJ, Spriet LL, and Holloway GP (2014). Omega-3 supplementation alters mitochondrial membrane composition and respiration kinetics in human skeletal muscle. J Physiol 592, 1341–1352. 10.1113/jphysiol.2013.267336. [DOI] [PMC free article] [PubMed] [Google Scholar]
- 49.Malis CD, Weber PC, Leaf A, and Bonventre JV (1990). Incorporation of marine lipids into mitochondrial membranes increases susceptibility to damage by calcium and reactive oxygen species: Evidence for enhanced activation of phospholipase A2 in mitochondria enriched with n-3 fatty acids. Proc Natl Acad Sci USA 87, 8845–8849. [DOI] [PMC free article] [PubMed] [Google Scholar]
- 50.Basit F, van Oppen LM, Schockel L, Bossenbroek HM, van Emst-de Vries SE, Hermeling JC, Grefte S, Kopitz C, Heroult M, Hgm Willems P, and Koopman WJ (2017). Mitochondrial complex I inhibition triggers a mitophagy-dependent ROS increase leading to necroptosis and ferroptosis in melanoma cells. Cell Death Dis 8, e2716. 10.1038/cddis.2017.133. [DOI] [PMC free article] [PubMed] [Google Scholar]
- 51.Simoes ICM, Morciano G, Lebiedzinska-Arciszewska M, Aguiari G, Pinton P, Potes Y, and Wieckowski MR (2020). The mystery of mitochondria-ER contact sites in physiology and pathology: A cancer perspective. Biochim Biophys Acta Mol Basis Dis 1866, 165834. 10.1016/j.bbadis.2020.165834. [DOI] [PubMed] [Google Scholar]
- 52.Vecellio Reane D, Rizzuto R, and Raffaello A (2020). The ER-mitochondria tether at the hub of Ca2+ signaling. Curr. Opin. Physiol 17, 261–268. 10.1016/j.cophys.2020.08.013. [DOI] [Google Scholar]
- 53.Yang WS, SriRamaratnam R, Welsch ME, Shimada K, Skouta R, Viswanathan VS, Cheah JH, Clemons PA, Shamji AF, Clish CB, et al. (2014). Regulation of ferroptotic cancer cell death by GPX4. Cell 156, 317–331. 10.1016/j.cell.2013.12.010. [DOI] [PMC free article] [PubMed] [Google Scholar]
- 54.Zhang Y, Tan H, Daniels JD, Zandkarimi F, Liu H, Brown LM, Uchida K, O’Connor OA, and Stockwell BR (2019). Imidazole Ketone Erastin Induces Ferroptosis and Slows Tumor Growth in a Mouse Lymphoma Model. Cell Chem Biol 26, 623–633 e629. 10.1016/j.chembiol.2019.01.008. [DOI] [PMC free article] [PubMed] [Google Scholar]
- 55.Huang da W, Sherman BT, and Lempicki RA (2009). Systematic and integrative analysis of large gene lists using DAVID bioinformatics resources. Nat Protoc 4, 44–57. 10.1038/nprot.2008.211. [DOI] [PubMed] [Google Scholar]
- 56.Sherman BT, Hao M, Qiu J, Jiao X, Baseler MW, Lane HC, Imamichi T, and Chang W (2022). DAVID: a web server for functional enrichment analysis and functional annotation of gene lists (2021 update). Nucleic Acids Res 50, W216–221. 10.1093/nar/gkac194. [DOI] [PMC free article] [PubMed] [Google Scholar]
- 57.Wu T, Hu E, Xu S, Chen M, Guo P, Dai Z, Feng T, Zhou L, Tang W, Zhan L, et al. (2021). clusterProfiler 4.0: A universal enrichment tool for interpreting omics data. The Innovation 2, 100141. 10.1016/j.xinn.2021.100141. [DOI] [PMC free article] [PubMed] [Google Scholar]
- 58.Yu G, Wang LG, Han Y, and He QY (2012). clusterProfiler: an R package for comparing biological themes among gene clusters. OMICS 16, 284–287. 10.1089/omi.2011.0118. [DOI] [PMC free article] [PubMed] [Google Scholar]
- 59.Kanehisa M, and Goto S (2000). KEGG: kyoto encyclopedia of genes and genomes. Nucleic Acids Res. 28, 27–30. 10.1093/nar/28.1.27. [DOI] [PMC free article] [PubMed] [Google Scholar]
- 60.Korotkevich G, Sukhov V, Budin N, Shpak B, Artyomov MN, and Sergushichev A (2021). Fast gene set enrichment analysis. BioRxiv. 10.1101/060012. [DOI] [Google Scholar]
Associated Data
This section collects any data citations, data availability statements, or supplementary materials included in this article.
Supplementary Materials
Figure S1. PC-PUFA2s induce ferroptosis. Related to Figure 1.
A, Viability of HT-1080 cells treated with 100 μM phospholipids with different head groups with or without 10 μM ferrostatin-1 (Fer-1) for 24 hr. B, Viability of IGROV-1 cells co-treated with 50 μM PC(22:6, 22:6) or PC(20:4, 20:4) and 10 μM Fer-1, 100 μM DFO, 20 μM Z-VAD-FMK, 20 μM Nec-1s, or 100 nM Baf-A1 for 24 hr. C, IGROV-1 cells treated with 100 μM PC for 4 hr were immunostained with TfR1 antibody. Representative images showing TfR1 staining. Scale bar is shown as 20 μm. D, Lipid peroxidation measured by C11-BODIPY581/591 in HT-1080 cells treated with 100 μM PC and PE with or without 10 μM ferrostatin-1, or 1 μM RSL3 for 4 hr. E, IGROV-1 cells were treated with PC or vehicle for 5 hr and whole-cell lysate was analyzed for western blot detection of phospho-MLKL, pro and cleaved Caspase-3. F, Dose response of FINO2 in HT-1080 cells pre-treated with 15 μM PC(22:6, 22:6) for 8 hr. G, The signal intensity of monoacyl-PUFA-PLs normalized to protein concentration of each cell sample is plotted as mean ± SD of n=3 biological replicates. Statistical analysis of PC abundance between ferroptosis-sensitive and resistant cells. Data plotted as mean ± SD of n=10 for each group. H, Volcano plot of PLs and lysoPLs differentially enriched in the hippocampus of 59-week-old vs. 3-week-old mice. Data cutoff at fold change >1.5 and FDR adjusted p <0.05. Significantly depleted diacyl-PUFA-PLs and enriched lysoPLs are labeled. I, Heat maps (one-way ANOVA; FDR-corrected p-value <0.05) of diacyl-PUFA-PLs and monoacyl-PUFA-PLs in 59-week-old and 3-week-old mice. Top 14 differentially expressed lipids are shown. J, Lipids from brain tissue of Huntington’s disease (HD, n=21) and normal cases (control, n=25) were extracted and analyzed by LC-MS-based lipidomics. The relative signal intensity of annotated diacyl-PUFA-PLs compared to control samples is plotted as mean ± SD. Two-way ANOVA: p<0.03 (*), p<0.002 (**), p<0.0002 (***), p<0.0001 (****).
Figure S2. Dietary PC-PUFA2s are remodeled into the cell lipidome. Related to Figure 2.
A, A549 cells were treated with 25 μM PC(18:0, 20:4) or PC(20:4, 20:4) for 6 hr. The relative signal intensity compared to untreated-samples of PEs detected is plotted as mean ± SD of n=3 biological replicates. B, A549 cells were treated with 25 μM PS(20:4, 20:4) or PG(20:4, 20:4) for 6 hr. The relative signal intensity of PS(20:4, 20:4) and PG(20:4, 20:4) compared to vehicle are plotted as mean ± SD of n=3 biological replicates. C, Dose response of deuterated lipids with or without 10 μM Fer-1 in HT-1080 at 24 hr. D, IGROV-1 cells were treated with 25 μM [d11]-PC(18:0, 20:4) or [d22]-PC(20:4, 20:4) for 6 hr. The relative signal intensity of non-deuterated lipids compared to untreated-samples are plotted as mean ± SD of n=4 biological replicates. Unpaired t-test and two-way ANOVA: p<0.03 (*), p<0.002 (**), p<0.0002 (***), p<0.0001 (****).
Figure S3. PC-PUFA2 is involved in dietary fatty acid remodeling. Related to Figure 3.
A, IGROV-1 cells were treated with 25 μM DHA or ARA with or without co-treatment of 30 μM phospholipase A2 inhibitor (PLA2i) ONO-RS-082 for 6 hr. The relative signal intensity of PC and PE compared to untreated samples are plotted as mean ± SD of n=3 biological replicates. B, Cas9 overexpressing HT-1080 were transiently transfected with non-targeting or ACSL4-targeting sgRNA to achieve CRISPR knockdown. Viability is shown for knockdown cells treated with 1 μM RSL3 or 100 μM PC for 24 hr. The knockdown efficiency was confirmed by qPCR and western blot. Empty lanes are cut and indicated by the dotted line. One-way and two-way ANOVA: p<0.03 (*), p<0.002 (**), p<0.0002 (***), p<0.0001 (****).
Figure S4. PL-PUFA2s exhibit interaction with mitochondrial electron transport chain. Related to Figure 4.
A, HT-1080 whole-cell lysate was incubated with biotinylated phospholipids, vehicle, or biotin, and phospholipid-bound proteins were identified by MS-based proteomics. Heat map (one-way ANOVA; FDR-corrected p-value <0.05) showing the top 25 hits of differentially enriched genes among all groups. n=3 technical replicates are shown for each group. B, Dose response of PC(22:6, 22:6) in IGROV-1 cells transfected with pooled siRNAs targeting 11 proteins identified in the heat map. Relative viability is compared to vehicle-treated group and is plotted as mean ± SD of n=4 technical replicates. C, Gene set enrichment analysis of genes enriched and depleted in PL(22:6, 22:6) compared to PL(18:0, 22:6). Top pathways and related genes are shown with p.adjusted <0.1. A part of the detailed view of the chemical carcinogenesis—reactive oxygen species is shown. D, HT-1080 cells were treated with 50 μM biotinylated PL(22:6, 22:6) for 6 hr and immunostained with streptavidin-cy5. Representative images showing PL stain. Scale bar is shown as 20 μm. E, HT-1080 cells were treated with 25 μM PC(22:6, 22:6) for 6 hr. Mitochondria were isolated and lipids from mitochondria and the rest cell compartments were extracted. The signal intensity of PC(22:6, 22:6) is normalized to protein concentration of each sample and presented as fold change to untreated samples. Data are plotted as mean ± SD of n=3 biological replicates. Two-way ANOVA: p<0.03 (*), p<0.002 (**), p<0.0002 (***), p<0.0001 (****).
Figure S5. PC-PUFA2s induces mitochondrial stress. Related to Figure 5.
A, Representative images of rhodamine123 and MitoTracker deep red staining in IGROV-1 cells treated with 100 μM PC, vehicle, or 10 μM Antimycin A for 4 hr. Scale bar is shown as 20 μm. B, Bright field images of HT-1080 cells treated with 100 μM PC(22:6, 22:6) or 1 μM RSL3 after the course of OCR assay for 6 hr. Scale bar is shown as 200 μm. C, Representative images showing MitoSOX green and MitoTracker deep red staining in IGROV-1 cells treated with 100 μM PC(22:6, 22:6) with or without 10 μM Fer-1 and 0.2 μM mitoQ for 4 hr. D, Lipid peroxidation measured by C11-BODIPY581/591 in IGROV-1 cells treated with 10 μM Antimycin A or 5 μM rotenone for 4 hr. E, Viability of IGROV-1 cells co-treated with PC(22:6, 22:6) and VDAC1 inhibitor, DIDS for 24 hr (left). IGROV-1 cells were knockdown with pooled siRNA targeting VDAC1, VDAC2, or VDAC3 and then co-treated with PC(22:6, 22:6) for 24 hr (right). F, HT-1080 cells overexpressing mcherry-Parkin were treated with 12.5 μM CCCP for 48 hr to induce mitophagy. Fluorescent images of MitoTracker deep red are shown. Relative fluorescent intensity compared to control is plotted as mean ± SD of n=9–10 images. MT-DNA transcript was measure by qPCR. Dose response curve of PC(22:6, 22:6) in CCCP-treated cells. Un-paired t-test and two-way ANOVA: p<0.03 (*), p<0.002 (**), p<0.0002 (***), p<0.0001 (****), not significant (ns).
Figure S6. PC-PUFA2s induce lipid peroxidation, but not an unfolded protein response in ER. Related to Figure 6.
A, IGROV-1 cells were treated with 100 μM PCs for 4 hr. Representative images of cells co-stained with Liperfluo and MitoTracker and ER-Tracker. B, The transcript level measured by qPCR and protein level measured by western blot of UPR mediators, XBP1s, ATF4, and GADD in IGROV-1 cells treated with 25 μM PC, 1 μM Brefeldin A, or 1 μM thapsigargin (Tg) for 24 hr. C, Mitochondrial lipid peroxidation measured by mitoCLox in IGROV-1 cells treated with 100 μM PC(22:6, 22:6) for 4 hr. Cells were co-stained with ER-Tracker or MitoTracker. Fluorescent images are shown as composite of Liperfluo in green and ER-Tracker or MitoTracker in pseudo-magenta. Relative fluorescent intensity compared to control is plotted as mean ± SD of n=135–145 cells. Un-paired t-test and two-way ANOVA: p<0.03 (*), p<0.002 (**), p<0.0002 (***), p<0.0001 (****), not significant (ns).
Data Availability Statement
Proteomics data are available via ProteomeXchange with identifier PXD041993. Lipidomics data including raw mass spectrometry data files, processed data, and annotated lipid features are available in the public repository, MetaboLights, under accession number MTBLS7772.
This paper does not report or use custom computer code.
Any additional information required to reanalyze the data reported in this paper is available from the lead contact upon request.