

SUMMARY
Severe forms of malaria are associated with systemic inflammation and host metabolism disorders; however, the interplay between these outcomes is poorly understood. Using a Plasmodium chabaudi (Pc) model of malaria, we demonstrate that IFNγ boosts glycolysis in splenic monocyte-derived dendritic cells (MODCs), leading to itaconate accumulation and disruption in the TCA cycle. Increased itaconate levels reduces mitochondrial functionality which correlates with organellar nucleic acid release and MODC restraint. We hypothesize that dysfunctional mitochondria releases degraded DNA into the cytosol. Once mitochondrial DNA is sensitized, activation of IRF3 and IRF7 promotes expression of interferon-stimulated genes and checkpoint markers. Indeed, depletion of the STING-IRF3/IRF7 axis reduces PD-L1 expression, enabling activation of CD8+ T cells that controls parasite proliferation. In summary, mitochondrial disruption caused by itaconate in MODCs leads to a suppressive effect in CD8+ T cells which enhances parasitemia. We provide evidence that ACOD1 and itaconate are potential targets for adjunct anti-malarial therapy.
eBLOC BLURBS
Ramalho et al. unveils that splenic monocyte-derived dendritic cells (MODCs) accumulate TCA cycle-derived itaconate in experimental malaria. Itaconate-induced mitochondrial disruption releases nucleic acids, which activate STING-IRF3/IRF7-mediated expression of PD-L1. In such state, MODCs expressing PD-L1 impair cytotoxic control of Plasmodium by limiting the activation of CD8+ lymphocytes.
Graphical Abstract

INTRODUCTION
Every year, approximately 200 million people are infected by Plasmodium and around 400,000 children die of infection, contributing to social and economic instability in the developing world1. Malaria is a complex multisystemic disorder in which multiple parasite and host factors contribute to disease severity2. Many studies have documented the role of pro-inflammatory cytokines in malaria pathogenesis2. In addition, host metabolic changes, such as hypoglycemia and lactate accumulation (lactic acidosis), are often associated with severe forms of disease3. Thus, understanding the metabolic mechanisms that mediate host resistance or susceptibility to infection is critical to improving the clinical management of individuals with malaria.
In the last few years, major advances have been made in associating the metabolic stage of immune cells and their function. Metabolites derived from the tricarboxylic acid (TCA) cycle synthesized in myeloid cells have immune-modulatory properties4. The TCA cycle consists of a series of mitochondrial enzymatic reactions in aerobic organisms to generate ATP via oxidation of acetyl-CoA derived from glucose/pyruvate, fatty acid oxidation, and anaplerosis from amino acids5. In eukaryotes, the intermediates of the TCA cycle are retained in mitochondria. During cell stress, the mitochondrial membranes are destabilized, allowing the release of TCA cycle metabolites and danger signals into the cytosol, extracellular matrix, and/or plasma6. When released, metabolites such as succinate, citrate, fumarate, and itaconate activate antioxidant pathways and exert post-translational modifications, which balances activation of immune cells7.
Recent studies demonstrated that alterations in host carbohydrate, lipid, protein, and heme metabolism are features of host susceptibility to P. vivax and P. falciparum. In the context of hypoglycemia, glucose intake in monocytes impairs mitochondrial functionality and reactive oxygen species production during the proliferative phase of P. vivax8. Yet, systemic glutaminolysis is closely associated with impaired humoral immunity and exacerbated systemic inflammation in severe cases and models of malaria9,10. Similarly, evidence of lipid catabolism is often observed in individuals acutely infected with P. falciparum or P. vivax11,12,13. Regardless of the original carbon source, the cellular metabolism of the malaria host contributes to an immunological state that favors Plasmodium proliferation14,15. It determining which products generated from cellular metabolism in the hypoglycemic host support susceptibility, and understanding this process is critical to understanding malaria pathogenesis and developing prevention and treatment strategies.
By employing a metabolic compartmentalization approach, we observed enhanced glycolysis and accumulation of the TCA-cycle derivative itaconate in splenic monocyte-derived dendritic cells (MODCs) from Plasmodium chabaudi (Pc)-infected mice. During Pc infection, endogenous itaconate limits the release of pro-inflammatory cytokines by MODCs and shrinks lymphocyte activation, impairing parasite clearance. We hypothesize that mitochondrial dysfunction caused by itaconate in MODCs releases degraded mitochondrial DNA (mtDNA) and possibly double-stranded RNA (mtdsRNA). Once in cytosol, mtDNA activates cytosolic nucleic acid sensors and downstream transcription factors IRF3 and IRF7. In addition to induction of interferon-stimulated genes (ISGs) in MODCs, IRF3 and IRF7 induce PD-L1 expression in our model, which limits CD8+ T cell activation and impairs parasite clearance. Thus, in this mouse model of malaria, itaconate accumulation subverts MODC metabolism, which confers advantageous escape of Pc from host immunity.
RESULTS
1. Enhanced glycolysis in differentiated MODCs from Pc-infected mice
Studies performed in our laboratory demonstrate that in mice acutely infected with Pc, IFNγ drives the differentiation of MODCs that produce high levels of tumor necrosis factor (TNF). We found that TNF enhances glucose processing in the spleen and liver, which culminates in a hypoglycemic state, control of parasite replication, and increased disease severity16. Herein, we characterized the metabolism of differentiated MODCs during Pc-infection and asked how their metabolic state affects the pathophysiology of experimental malaria.
To determine the metabolic state of MODCs from Pc-infected mice, we performed ex vivo and in vivo experiments with spleens and splenic MODCs from wild-type (WT) C57BL/6 and LysM/CRE-IFNγR knockout mice by employing flow cytometry, western blot, and Seahorse analysis (Figure 1A). We observed high glucose uptake by splenocytes from Pc-infected compared to non-infected WT mice (Figure 1B, Figure S1A). Consistently, the population of CD11b+ splenocytes (MODCs predominantly) showed an increased extracellular acidification rate (ECAR) (Figure 1C), suggesting increased glycolysis. As previously described, we confirmed the role of IFNγ in mediating MODC differentiation during Plasmodium infection (Figure 1D, Figure S1B–E) 17, 18. The absence of IFNγR in myeloid cells resulted in decreased expression of MHC II and DCSign (Figure 1D–F, Figure S1C and D). Importantly, we observed an IFNγ-dependent increase of GLUT1 expression on MODCs from Pc-infected mice, both in vivo (Figure 1G and H, Figure S1E) and in vitro (Figure 1I–K, Figure S1F). Together, our results indicate that once differentiated, MODCs require glucose as a substrate for their metabolism and that IFNγ directly impacts glucose metabolism.
Figure 1. IFNγ enhances glucose metabolism during differentiation of monocyte-derived dendritic cells in P. chabaudi-infected mice.

Schematic of techniques used to assess MODCs in the mouse spleen (A). Glucose uptake with 2DG radioisotope in total splenocytes of Pc-infected and non-infected (NI) mice (B); data are from three experiments with a pool of 3 animals per group in each experiment. Extracellular acidification rate (ECAR) in CD11b+ splenocytes from Pc-infected mice compared to NI mice ex vivo (C); data are from a pool of two experiments with n=5 NI mice and n=10 infected mice. Detection of MODC frequency (D), MFI of dendritic cell (DC) markers DCSign (E), MHCII (F), and GLUT1 (G) expression in total spleen of WT or IFNγRLysMCre mice, Pc-infected or NI; data are from a pool of two experiments with n=3 NI mice and n=5 infected mice. GLUT1 expression in CD11b+ splenocytes from Pc-infected and NI mice (H); the uncropped image is in Data S1. Detection of DC markers DCSign and MHCII (I) for determination of MODC frequency (J), and GLUT1 MFI (K) under IFNγ stimuli; data are from a pool of two experiments with n=4 uninfected mice. All experiments were repeated 2 or 3 times yielding similar results. * p < 0.001–0.05 by Student’s t-test performed between two groups; One-way ANOVA followed by Tukey’s post-hoc test was performed among three or more groups.
2. Differentiated MODCs from Pc-infected mice accumulate itaconate which branches the TCA cycle
We have previously shown that hypoglycemia is associated with an increased expression of genes related to the TCA cycle in the spleen and liver from Pc-infected mice16. We hypothesized that the enhanced glycolysis increases the synthesis of TCAs in the mitochondria of splenic MODCs. To address this hypothesis, we sorted splenic MODCs from acutely infected mice and quantified untargeted metabolites through ultra-high-resolution mass spectrometry. In addition, we performed a transcriptomic analysis of spleens from infected mice and monocytes from patients with malaria (Figure 2A). Here, we report that the high expression of the TCA cycle-related genes in the spleen of infected mice depends on IFNγ (Figure 2B and C, Tables S1). Among the genes, Aconitate dehydrogenase (Acod1), also known as Immune-Responsive Gene 1 (Irg1) was the most induced gene (Figure 2B, Figure S2B). Acod1 encodes an enzyme that converts aconitate into itaconate. As expected, MODCs of infected mice showed increased levels of most of the tricarboxylic acids derived from the TCA cycle (Figure 2D and E, Table S2). Among all the metabolites detected in our metabolome, the dicarboxylic acid itaconate was the most abundant (Figure 2D and E). Consistently, in a dataset of mice infected with Pc, the signature of itaconate was elevated during Plasmodium proliferation in the acute phase of infection (Figure 2F). As itaconate is a potent immunoregulator19, we speculated that it may undermine innate and acquired immunity during malaria.
Figure 2. Glucose oxidation disrupts the TCA cycle in monocyte-derived dendritic cells of P. chabaudi-infected mice.

Schematic of techniques used to assess metabolites and transcripts in MODCs from infected mice (A). Fold change of differentially expressed genes (DGEs) in Pc-infected WT mice relative to non-infected (NI) WT mice (B), and fold change of DGEs in Pc-infected IFNγ−/− mice relative to Pc-infected WT mice (C); data are from two experiments pooled with n=3 mice in each group. Volcano plot showing the fold change and p-values in metabolite intensity values of Pc-infected WT mice relative to NI WT mice; data are from two experiments pooled with n=3 samples in NI mice, and n=4 samples in the infected group, with 5 mice pooled per sample (D). A cross-analysis of the metabolome and transcriptome established the metabolic phenotype of MODCs (E). Itaconate levels in the plasma of Pc-infected mice; two experiments pooled with n=5 mice in the infected group (F). The ratio of itaconate/fumarate was calculated from intensity values of each metabolite in the metabolome of Pc-infected or NI mice (G); data are from two experiments pooled with n=3 samples from the NI group and n=4 samples from the infected group, with 5 mice pooled per sample. Experiments in B–D, F, and G were repeated 2 or 3 times yielding similar results. RNA-seq performed in monocytes from NI individuals (n=5) or individuals infected with P. vivax (n=5). Fold change in gene expression of P. vivax-infected relative to NI individuals (H). Identification of the itaconate signature in the plasma from P. vivax-infected individuals (I) n=15 in each experimental group, or ACOD1 expression in monocytes stimulated or not with P. falciparum-infected erythrocytes; data are from n=4 samples in non-stimulated monocytes and n=8 samples in monocytes stimulated with iRBCs (J). * p < 0.001–0.05 by Student’s t-test performed between two groups.
Itaconate inhibits the activity of succinate dehydrogenase (SDH)20, an enzyme that converts succinate to fumarate. We found that the expression of Acod1, but not Sdh, was enhanced in MODCs from infected mice (Figure S2C and D). As a consequence, the synthesis of fumarate in MODCs is limited, as shown by the high itaconate/fumarate ratio (Figure 2G). These findings were validated in monocytes from patients with malaria compared to non-infected individuals. The expression of genes related to mitochondrial metabolism is increased in peripheral monocytes from patients infected with P. vivax (Figure 2H, Table S3). Among those genes, Acod1 showed the highest expression. Furthermore, while evaluating human datasets, the itaconate signature was also found in the plasma of patients infected with P. vivax (Figure 2I). In addition, ACOD1 expression is upregulated when human monocytes are exposed to P. falciparum-infected red blood cells (iRBC) in vitro (Figure 2J). Considering that itaconate disrupts the TCA cycle while reducing SDH activity, we next evaluated mitochondrial functionality in differentiated MODCs from Pc-infected mice.
3. The branched TCA cycle in MODCs from Pc-infected mice is associated with mitochondrial disruption
On one hand, the accumulation of TCA cycle metabolites may be an important determinant of the new transcriptional program of differentiated MODCs. On the other hand, the inherited mitochondria from monocytes may be insufficient for the high energetic demands of newly differentiated MODCs.
Our non-targeted lipidome shows that MODCs from Pc-infected mice have lower levels of triglycerides (Figure 3A, Table S5), which indicates lipid utilization by mitochondria in MODCs. Also, MODCs increase the levels of different classes of membrane phospholipids, which is commonly observed in newly differentiated cells (Figure 3A, Table S4). Among the phospholipids, the accumulation of ceramides and phosphatidylserines indicates cell stress and programmed cell death in MODCs21,22 and the accumulation of phosphatidylethanolamine and cardiolipins strongly suggests alterations in mitochondrial structure (Figure 3A, Table S4). The composition of cardiolipins found in our metabolome shows elongation and additional saturated bonds — which are both signs of modulation of the electron transport chain (ETC)23 (Figure 3A, Table S4). Indeed, we observed that MODCs accumulate more ADP than ATP (Figure 3B and C), indicating a disturbance in the ETC and ATP synthesis. Furthermore, MODCs express low protein levels of the complex II subunit SDHB (Figure 3D), corroborating the hypothesis of immature ETC machinery in differentiated MODCs. Consistently, MODCs from infected (or IFNγ-induced) mice have a lower frequency of functional mitochondria compared to monocytes (Figure 3E). When we enforce mitochondrial activity with galactose-derived substrates, the frequency of functional mitochondria is even more reduced (Figures S3A–C). This functional assay indicates that substrates utilized by mitochondrial respiration contribute to mitochondrial dysfunction, which reflects compromised ATP synthesis and structural changes in mitochondria. Together, these results show that differentiated MODCs are in a metabolic state that accumulates intermediates of the TCA cycle and disrupts mitochondrial functionality.
Figure 3. Mitochondria functionality is compromised in monocyte-derived dendritic cells from P. chabaudi-infected mice.

Volcano plot of the fold change and p-values of lipid intensity values of Pc-infected (Pc) WT mice relative to non-infected (NI) WT mice (A). Intensity values of ADP (B) and ATP (C) in the metabolome of MODCs from infected or NI WT mice. Results from the lipidome and metabolome were pooled from two experiments with n=3 samples in the NI group and n=4 samples in the infected group, with five mice pooled per sample. SDHB expression in CD11b+ splenocytes selected from Pc-infected or NI mice; uncropped images are in Data S1 (D). Mitochondrial functionality in MODCs of Pc-infected or MO (monocytes) in NI mice (E). Maximal respiration (G) and aconitate levels (H) in CD11b+ splenocytes isolated from Pc-infected mice treated with UK5099 or DMSO from two experiments pooled with n=7 mice per group. Maximal respiration and aconitate levels in CD11b+ splenocytes isolated from Pc-infected mice treated with Etomoxir (G) or DMSO (H) from two experiments pooled with n=6 mice per group. Itaconate levels in the supernatant of CD11b+ splenocytes treated with UK5099 or Etomoxir from two experiments pooled with n=7 mice per group* p < 0.001–0.05 by Student’s t-test performed between two groups. Experiments were repeated 2 or 3 times yielding similar results.
Compromised mitochondrial functionality results in impaired oxygen consumption by the cell. Because substrates used by mitochondrial respiration contribute to the loss of mitochondrial functionality in MODCs, we next evaluated which substrates impair respiration and the TCA cycle in these cells (Figure 3F). Indeed, we observed that MODCs from infected mice have impaired oxygen consumption (Figure S3D). When pyruvate availability to mitochondria was limited using UK5099, maximal oxygen consumption was improved (Figure 3G, Figure S3E) and aconitate levels were restored (Figure 3H). Aconitate is an intermediate metabolite synthesized from citrate that is the substrate for itaconate synthesis. Hence, when itaconate is synthesized, aconitate levels are reduced. Importantly, we observed that Etomoxir, an inhibitor of fatty acid oxidation also improves mitochondrial maximal capacity and partially recovers aconitate levels (Figure 3I and J, Figure S3F), while anaplerosis from glutamate did not reverse the disturbance in oxygen consumption by MODCs (Figure S3G). We observed a discrete reduction in itaconate levels when cells were treated with either UK5099 or Eto (Figure 3K). Either treatment restored aconitate levels, indicating that both metabolic pathways are needed to convert aconitate from citrate and decrease itaconate accumulation. Altogether, these results indicate that pyruvate generated from glucose or fatty acids, but not amino acids, enhanced the TCA cycle activity and contributed to itaconate accumulation and mitochondrial maladaptation in MODCs from Pc-infected mice. We next explored how the activation of a transcription factor that classically induces lipid and glucose metabolism sustains the metabolic status found in MODCs of Plasmodium-infected mice.
4. PPARγ activation sustains MODC differentiation and its metabolic state in Plasmodium-infected mice
We previously determined that the expression of PPARγ follows glucose and parasite synchronization both in the liver and spleen from Pc-infected mice, suggesting the potential role of PPARγ as a mediator of glucose metabolism in host cells16. PPARγ is a nuclear receptor commonly activated in different subsets of differentiated dendritic cells. PPARγ is known to promote glucose uptake by different cell types. For this reason, it is a molecular target of thiazolidinediones that are used to normalize the levels of circulating glucose in individuals with diabetes24. In addition to inducing glucose uptake, PPARγ induces oxidation of fatty acids and mitochondrial biogenesis. Thus, the PPARγ pathway may be an important factor for itaconate accumulation in MODCs from Pc-infected mice.
Various genes involved in the PPARγ pathway are upregulated in MODCs from Plasmodium-infected mice (Figure 4A, Table S5). Most of these PPARγ-related genes are involved in fatty acid and glucose metabolism (Table S5). An activated PPARγ transcriptional signature was also observed in monocytes from individuals with P. falciparum malaria, and in monocytes stimulated with infected red blood cells (Figure S4A and B). Importantly, we determined that IFNγ signaling induced the expression of PPARγ protein in MODCs (Figure 4B and C). Yet, protein expression of GLUT1 (Figure 4D) and ACOD1 (Figure 4E) are increased downstream of PPARγ activation. Accordingly, GLUT1 expression is not increased, and mitochondrial functionality is recovered in MODCs when splenocytes are incubated ex vivo with GW9662, an irreversible antagonist of PPARγ (Figure S4C and D). While GW9662 treatment also improves maximal oxygen consumption in MODCs of infected mice (Figure S4E). These results are consistent with the hypothesis that once PPARγ is activated during MODC differentiation by IFNγ stimuli, increased glucose uptake increases substrate availability for itaconate synthesis. Indeed, ex vivo PPARγ inhibition recovers aconitate levels (Figure 4F), while reducing itaconate levels (Figure 4G).
Figure 4. PPARγ activation sustains the differentiation and metabolic state of monocyte-derived dendritic cells.

Heatmap showing the relative expression of markers of the PPARγ pathway in MODCs from Plasmodium berghei Anka (PbA)-infected or non-infected (NI) mice (A); results shown were pooled from two experiments with n=2 NI mice and n=3 infected mice. Western blots to analyze PPARγ in CD11b+ splenocytes from WT or IFNγRLysMCre mice that were Pc-infected or NI (B, C). GLUT (D) and ACOD1 (E) expression in CD11b+ splenocytes from NI or Pc-infected WT or PPARγLysMCre mice; uncropped images are in Data S1. Aconitate (F) and itaconate (G) levels in CD11b+ splenocytes from Pc-infected mice treated ex vivo with GW9662; data are from two experiments pooled with n=7 mice per group. Frequency of MODCs in CD11b+ splenocytes from NI or Pc-infected WT or PPARγLysMCre mice (H); data are from two experiments pooled with n=8 mice in each group. Expression of PD-L1 in MODCs (I) from two experiments pooled with n=3 NI mice and n=6 infected mice, and systemic levels of IFNγ in WT or PPARγLysMCre mice that were NI or Pc-infected (J); data are from two experiments pooled with n=4 mice per group. Parasitemia in WT or PPARγLysMCre mice (K) from two experiments pooled with n=6 mice per group. Model showing IFNγ-induced differentiation of MODCs in vivo and in vitro leads to enhanced PPARγ expression and function, promoting itaconate synthesis that culminates in the expression of GLUT1 and PD-L1 by MODCs from Pc-infected mice (L). Experiments were repeated 2 or 3 times yielding similar results. * p < 0.001–0.05 by Student’s t-test performed between two groups. One-way ANOVA followed by Tukey’s post-hoc test was performed among three or more groups.
We also found that PPARγ mediates the increase of MHCII expression, and, thus, the differentiation of MODCs (Figure 4H, Figures S4F–H), which is consistent with the decreased secretion of CCL5 when CD11b+ splenocytes from Pc-infected mice are treated ex vivo with GW9662 (Figure S4I). Due to PPARγ effects on MODC maturation and previously reported effects of itaconate on macrophage activation, we evaluated if PD-L1 expression was enhanced on MODCs. PD-L1 is a co-inhibitory ligand often expressed by activated antigen-presenting cells. When expressed, PD-L1 promotes exhaustion in CD8+ T cell activation25. We found less PD-L1 secreted by MODCs from Pc-infected LysM-PPARγ−/− mice compared to WT (Figure 4I). Not surprisingly, IFNγ levels are elevated in the plasma of LysM-PPARγ−/− mice compared to WT mice infected with Pc (Figure 4J). Consistently, LysM-PPARγ−/− mice have better control of Plasmodium proliferation (Figure 4K). Altogether, these results suggest that PPARγ activation in differentiated MODCs contributes to a metabolic state that leads to the accumulation of the TCA cycle-derived itaconate. In this scenario, PPARγ mediated PD-L1 seems to limit the activation of lymphocytes systemically (Figure 4L).
5. Itaconate derived from MODCs regulates systemic inflammation in Plasmodium infection
Itaconate is an immune regulator induced in myeloid cells in conditions of experimental systemic inflammation, such as tuberculosis, sepsis, psoriasis, myocarditis, and gout19. Similarly, PPARγ is considered an immune regulator, because it limits the activation of nuclear factor kappa B (NFκB) in macrophages26. In our model, PPARγ activation contributes to MODC maturation and itaconate synthesis; thus, we hypothesized that itaconate could regulate the immune response in malaria by limiting MODC activation.
Our targeted metabolome showed that when MODCs from infected mice are incubated in vitro for 4 h, they release high levels of itaconate and succinate (Figure 5A and B). Interestingly, succinate release is ACOD1-dependent (Figure 5B), corroborating the hypothesis that itaconate reduces the processing of succinate into fumarate (Figure 2E), leading to succinate accumulation in the supernatant. Hence, we hypothesize that itaconate directly regulates the function of MODCs and, as a consequence, the immune response. We observed that MODCs of infected mice also release mesaconate into the supernatant (Figure 5C). Mesaconate is an immunoregulatory metabolite generated from itaconate conversion27,28. Importantly, in an itaconate-free system, MODCs from infected mice secrete more TNF and IL-6 (Figure 5D and E), while IL-10 secretion is reduced (Figure 5F). Furthermore, the levels of both itaconate and mesaconate are increased in the plasma of infected mice (Figure 5G and H). As the levels of itaconate are greater compared to mesaconate, we hypothesized that the partial conversion of itaconate into mesaconate in MODCs (Figure 5C) is reflected systemically in the peripheral plasma. Thus, the high itaconate/mesaconate ratio in the plasma also suggests that mesaconate can act as an adjuvant to the regulatory effects of itaconate. Consistently, in Plasmodium-infected Acod1−/− mice, the levels of circulating IFNγ and IL-6 are increased (Figure 5I and J), whereas the IL-10 levels in plasma are lower (Figure 5K).
Figure 5. Endogenous itaconate regulates immune responses in P. chabaudi-infected mice.

CD11b+ splenocytes from WT or Acod1−/− mice that were P. chabaudi (Pc)-infected or non-infected (NI), were incubated ex vivo, and the supernatant harvested after 4 h. The changes in itaconate (A), succinate (B), and mesaconate (C) levels were assessed by ultra-high resolution mass spectrometry from two experiments pooled with n=5 NI mice and n=10 infected mice. The levels of TNFα (D), IL-6 (E), and IL-10 (F) were measured by cytometric bead array from two experiments pooled with n=5 NI mice and n=10 infected mice. In the plasma of WT or Acod1−/− mice that were Pc-infected or NI, itaconate (G) and mesaconate (H) levels were assessed by mass spectrometry from two experiments pooled with n=3 for the NI group and n=6 for the infected group. The IFNγ (I), IL-6 (J), and IL-10 (K) levels were quantified by cytometric bead array from two experiments pooled with n=3 for the NI group and n=6 for the infected group. Experiments were repeated 2 or 3 times yielding similar results. * p < 0.001–0.05 by Student’s t-test performed between two groups. One-way ANOVA followed by Tukey’s post-hoc test was performed among three or more groups.
6. Endogenous itaconate induces the expression of PD-L1 in a STING-IRF3/IRF7-dependent pathway
Next, we evaluated the expression of co-inhibitory and co-stimulatory ligands on MODCs, which are important for (de)activation of lymphocytes. We observed that MODCs of Acod1−/− mice have reduced expression of the co-inhibitory factor PD-L1 (Figure 6A, Figure S5A). Consistently, the increased levels of PD-L1 in the plasma of Pc-infected mice relied on itaconate (Figure 6B). Not surprisingly, the expression of CD274, which transcribes PD-L1 in humans (PD1L1 protein), is increased when human monocytes are stimulated with P. falciparum-infected red blood cells (Figure 6C). Additionally, individuals acutely infected with P. falciparum have increased expression of CD274 in monocytes, which is sustained in convalescent individuals (Figure S5B). We found no evidence that itaconate affects the expression of the co-stimulatory receptors CD80 or CD86 (Figure S5C and D).
Figure 6. PD-L1 expression on MODCs is induced by STING-IRF3/IRF7.
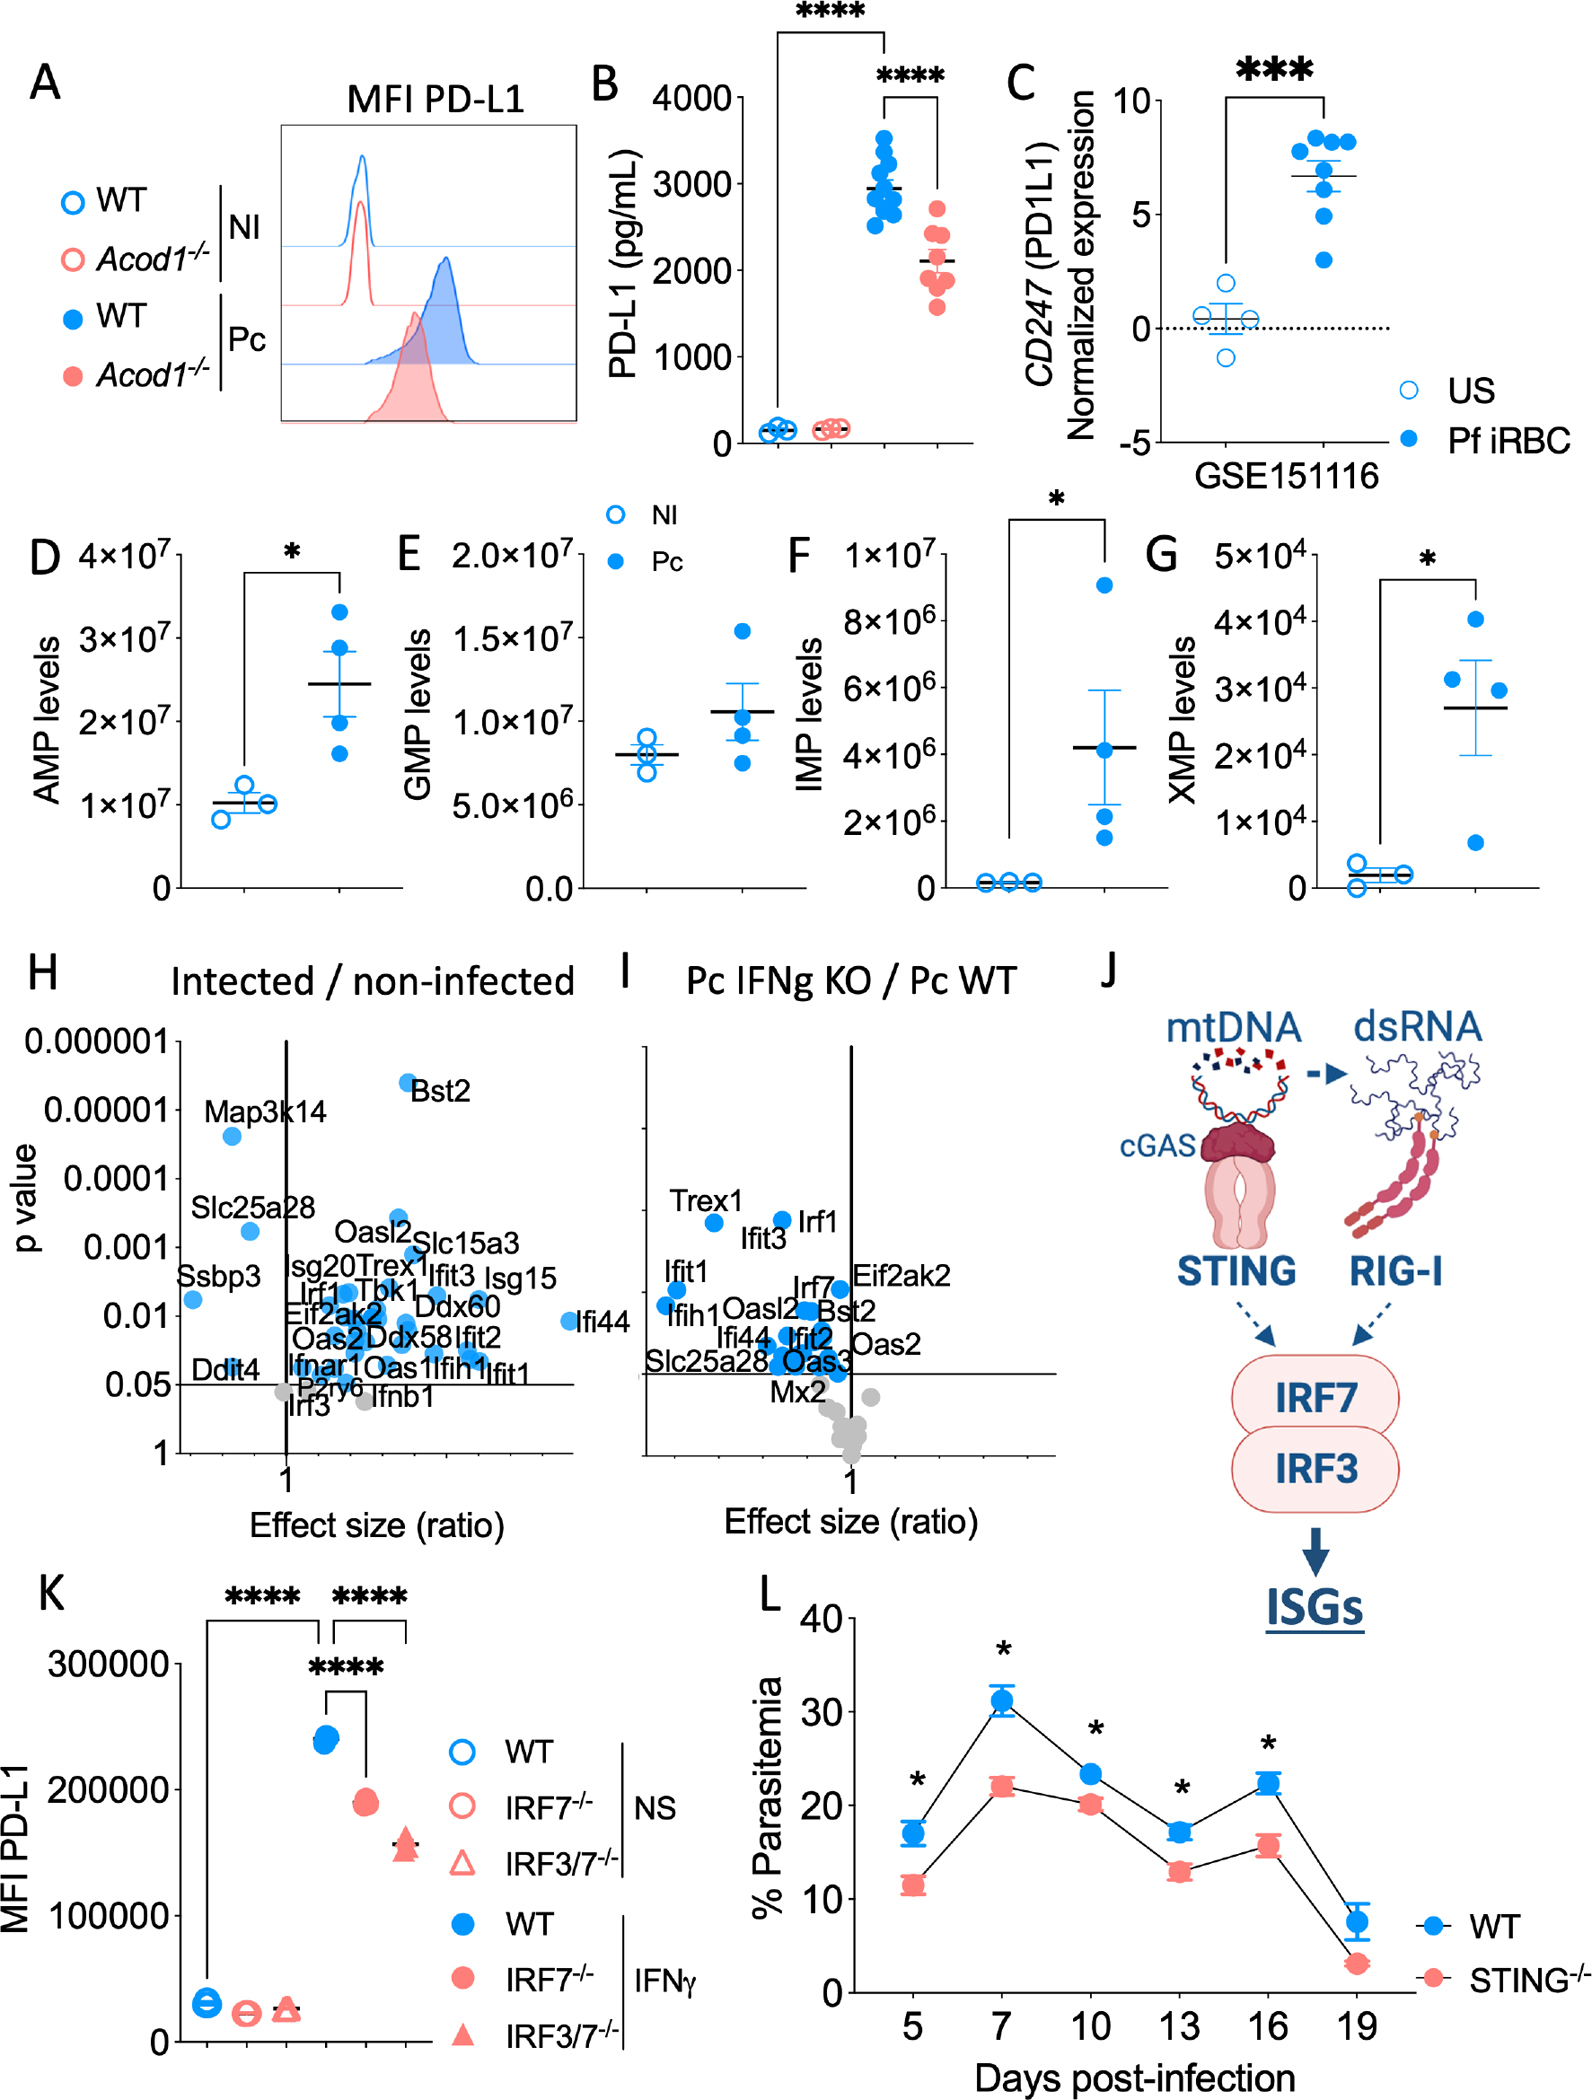
Expression of PD-L1 by MODCs of P. chabaudi (Pc)-infected and non-infected (NI) WT or Acod1−/− mice (A). Quantification of PD-L1 in the plasma of P. chabaudi (Pc)-infected or non-infected (NI) WT or Acod1−/− mice from two experiments pooled with n=3 in the NI group and n=6 in the infected group (B). Human monocytes stimulated with Pf-iRBCs (C); data are from n=4 unstimulated samples and n=8 Pf-stimulated samples. Levels of AMP (D), GMP (E), IMP (F), and XMP (G) in the metabolome of MODCs from Pc-infected and NI mice from two experiments pooled with n=3 samples in the NI group and n=4 samples in the infected group, with 5 mice pooled per sample. Volcano plot showing the fold change and p values in gene expression values of Pc-infected relative to NI WT mice (H), and fold change and p values in gene expression values of Pc-infected IFNγ−/− relative to Pc-infected WT mice (I); data are from two experiments pooled with n=3 in each group. Schematic showing IRF3 and IRF7 activation by STING and RIG-I (J). Expression of PD-L1 in non-stimulated iBMDMs and in IFNγ-stimulated WT, IRF3−/−, IRF7−/−, and IRF3/IRF7 double knockout mice (K); data are from three experiments pooled with n=3 per group. Parasitemia from WT and STING−/− mice infected with Pc (L); data are from two experiments pooled with n=6 per group. Experiments were repeated 2 or 3 times yielding similar results. * p < 0.001–0.05 by Student’s t-test performed between two groups. One-way ANOVA followed by Tukey’s post-hoc test was performed among three or more groups.
Recent in vitro studies have shown that exogenous itaconate exerts mechanistic anti-inflammatory effects by promoting nuclear factor erythroid 2-related factor 2 (NRF2) and/or activating transcription factor 3 (ATF3) pathways29. We did not observe increased expression of NRF2 in CD11b+ cells from Pc-infected WT mice. In addition, the itaconate derivative 4-octyl-itaconate (4-OI) was unable to induce NRF2 by CD11b+ cells from Pc-infected Acod1−/− mice (Figure S5E). ATF3 deactivates IκBζ, which induces the transcription of IL-6 and TNF. IκBζ is downregulated in cells from Pc-infected WT mice, but not in the Acod1−/− mice, suggesting that ATF3 is activated in MODCs from Pc-infected mice. Consistently, 4-OI treatment inhibited the expression of IκBζ in CD11b+ Acod1−/− cells (Figure S5F). However, 4-OI did not induce ATF3 expression in CD11b+ from Acod1−/− cells of Pc-infected mice (Figure S5E). Hence, we suggest that the lower levels of TNFα and IL-6 secreted by CD11b+ from WT MODCs (Figure 5D and E), as compared to Acod1−/− MODCs from Pc-infected mice, explain the negative effects of endogenous itaconate on IκBζ, although the ATF3 pathway was not enriched in our omics data analysis.
To further evaluate the autocrine effect of itaconate on PD-L1 expression, we decided to investigate if other signaling pathways that are concomitantly enriched in our omics analysis could integrate the itaconate/PD-L1 axis. In MODCs from Pc-infected WT mice, we found increased levels of products from cyclic nucleotide metabolism, such as AMP, GMP, IMP, XMP, ADP, and GDP (Figure 6D–G, Figure S5G, Table S2), indicating that the metabolism of nucleoside tri- and diphosphates is enhanced. Furthermore, the transcriptome of MODCs from infected mice shows increased expression of transcripts that promote mtDNA degradation and leakage (Figure S5H). Yet, the lower expression of transcripts related to mtDNA synthesis was found in our analysis (Figure S5I).
Importantly, we found that RIG-I (Ddx58), MDA5 (Ifih1), TBK1, and the transcription factors IRF1, IRF3, and IRF7 are differentially expressed in splenocytes from Pc-infected WT mice, but not in the IFNγ−/− mice (Figures 6H and I, Table S1). We hypothesize that IFNγ induces the synthesis and accumulation of itaconate leading to a brake in the TCA cycle and accumulation of succinate. Mitochondria dysfunction potentially results in leakage of mtDNA and mtdsRNA into the MODC cytosol. We hypothesized that cGAS senses fragments of the mitochondrial genome30 and activates STING30, whereas RIG-I and MDA5 sense mtdsRNA and activate MAVS31,32. STING and MAVS activate TBK1 to induce IRF3 and IRF7 expression and upregulate the expression of PD-L1 (Figure 6J). Indeed, our results show that in IFNγ-primed immortalized bone marrow-derived macrophages (iBMDMs), STING1−/−, IRF7−/−, or IRF3/IRF7 double knockout cells express lower levels of PD-L1 compared to WT iBMDMs cultured in similar conditions (Figure 6K). Importantly, a study proposed that the overexpression of Lon, a multiple-function protein that has proteolytic, chaperone, and DNA-binding activities, promotes mtDNA leakage in tumor cells33. Interestingly, when we treated IFNγ-stimulated iBMDMs with CDDO (2-cyano-3,12-dioxooleana-1,9-dien-28-oic acid), a specific Lon inhibitor, the expression of PD-L1 was downregulated (Figure S5J).
Therefore, in IFNγ-induced MODCs from Pc-infected mice, accumulation of itaconate results in a Lon-dependent leakage of mtDNA fragments to the cytosol, activating cGAS and STING and leading to enhanced PD-L1 expression mediated by IRF3 and IRF7. It is possible that mtdsRNA also plays a role in this process by activating RIGI/MDA5, MAVS, and TBK1, as these factors are highly induced in MODCs from infected mice (Figure 6H and 6I, Table S5). Importantly, STING−/− mice show an enhanced resistance to Pc infection (Figure 6L). As we identified a close correlation between increased expression of ACOD1 and regulatory genes in monocytes of Plasmodium-infected subjects, we suggest that the accumulation of itaconate on MODCs in our murine model corresponds to malaria susceptibility.
7. Endogenous itaconate limits the activated state of CD8+ T cells leading to Pc proliferation
Although the frequency of CD4+Tbet+ T lymphocytes was significantly increased in Acod1−/− mice (Figure 7A), the absence of itaconate only marginally increased the expression of IFNγ and CXCR3 expression by CD4+ T cells (Figure 7B and C, Figure S6A–D). Yet, the activation of CD8+ T cells is clearly downregulated by itaconate, as we observed increased frequencies of CD8+T-bet+CXCR3+IFNγ+ T cells in itaconate-free mice (Figure 7D–F and Figure S6A and E–G). The limited activation of T cells is consistent with limited levels of IFNγ found in the plasma of Pc-infected WT mice (Figure 5I). We also found increased expression of programmed cell death protein 1 (PD1) encoded by the PDCD1 gene in lymphocytes of individuals infected with P. falciparum (Figure 7G). Accordingly, the improved immune response in the absence of itaconate results in lower parasitemia in Acod1−/− mice (Figure 7H). Lastly, to validate the relevance of CD8+ T cell activation in host resistance to Plasmodium, we depleted CD8+ T cells by treating Pc-infected Acod1−/− mice with an anti-CD8 monoclonal antibody. Importantly, Acod1−/− mice treated with anti-CD8 were no longer able to control parasitemia (Figure 7I). Altogether, our results indicate that itaconate synthesized by MODCs limits the activation of CD8+ T cell function through STING-IRF3/IRF7-induced PD-L1 expression, impairing immune control of parasitemia in the Pc malaria model.
Figure 7. Endogenous itaconate limits the activation of CD8+ T cells and enhances susceptibility to P. chabaudi infection.

Detection of T-bet (A), IFNγ (B), and CXCR3 (C) in splenic CD4+ T cells from WT or Acod1−/− mice infected or not with P. chabaudi (Pc). The expression of the same activation markers was also evaluated in CD8+ T cells (D, E, and F); data are from two experiments pooled with n=4 in the non-infected group and n=10 in the infected group. Human dataset ID GSE174791 from the Gene Expression Omnibus was used to evaluate the expression of PDCD1 in T cells from P. falciparum-infected individuals (n=10) compared to non-infected individuals (n=10) (G). Parasitemia levels calculated from the blood smears of Pc-infected WT and Acod1−/−mice (H). Parasitemia levels calculated from the blood smears of Pc-infected Acod1−/− mice treated or not with anti-alpha-CD8 antibodies (I); data are from two experiments pooled with n=6 infected mice per group. Experiments were repeated 2 or 3 times yielding similar results. * p < 0.001–0.05 by Student’s t-test performed between two groups. One-way ANOVA followed by Tukey’s post-hoc test was performed among three or more groups.
DISCUSSION
Monocytes are highly plastic cells that differentiate and specialize in different functions such as tissue repair, sensing invasive microorganisms, and initiating protective immune responses. Monocyte-derived dendritic cells (MODCs) are specialized in antigen presentation and shaping T-cell-mediated immunity, but also release bulk amounts of proinflammatory cytokines and display phagocytic function to destroy pathogens. We have described in experimental malaria models that MODCs transiently become the main DC population in spleens and inflamed non-lymphoid tissues during acute disease. When differentiated, MODCs promote inflammation and tissue damage, in experimental models of cerebral malaria17 and acute respiratory distress syndrome34. In this study, we examined how energy metabolism affects the differentiation and activation of MODCs. We observed that, during an acute infection with Plasmodium, glycolysis is enhanced in MODCs. Importantly, glucose metabolism sustains a mitochondrial adaptation that triggers the accumulation of TCA cycle-derived metabolites with immunoregulatory properties. From these metabolites, the dicarboxylic acid itaconate derived from aconitate is the most abundant in MODCs and plasma of infected mice. While limiting cytokine release, itaconate promotes PD-L1 expression by MODCs via the STING/IRF3/IRF7 pathway, making CD8+ T cells less responsive and enhancing host susceptibility to Pc infection.
In malaria, CD4+ T and CD8+ T lymphocytes, as well as NK cells, release IFNγ that primes monocytic cells. Upon stimulation of TLRs and cytosolic sensors by parasite components (e.g., DNA, RNA, and hemozoin), primed monocytes release high levels of pro-inflammatory cytokines35,36,37, leading to systemic inflammation and signs of disease38. Here, we report that, while inducing the differentiation of MODCs, IFNγ promotes glycolysis, leading to a mitochondrial state that accumulates TCA cycle-derived itaconate. IFNγ signaling also induces PPARγ expression in MODCs of infected mice. PPARγ activation promotes fatty acid oxidation and glucose uptake — both of which are relevant pathways for MODC differentiation and maturation39,40,41. It is unclear whether PPARγ is directly induced by transcriptional factors of the IFNγ pathway, or if enhanced expression of PPARγ is a consequence of the gene signature in differentiated MODCs. Nevertheless, our results indicate an important role of PPARγ on the energy state of MODCs. Although PPARγ is known for its properties in mitochondrial biogenesis, we found that mitochondria are disrupted in MODCs, which may be a product of itaconate’s effects on mitochondrial metabolism. Thus, we hypothesize that PPARγ activation contributes to the availability of glucose/pyruvate and fatty acids that feed the synthesis of derivatives of the TCA cycle, as aconitate and itaconate affect mitochondria viability42. In fact, we have previously described an association between disrupted mitochondrial metabolism in monocytes and symptomatic infection in humans and mice43,44. Accordingly, previous studies showed that P. falciparum- and P. vivax-infected patients have impaired DC maturation and antigen presentation to T cells45,38,46. Consistently, He et al. demonstrated that in vitro exogenous treatment of lipopolysaccharide (LPS)-stimulated macrophages with itaconate limits antigen presentation and lymphocyte activation27.
When itaconate accumulates intra- and extracellularly, it exerts different roles in the interactions between the host and pathogen: (1) itaconate can be an antimicrobial metabolite47; (2) it has stimulatory effects on host enzymes that can detrimental to the pathogen19,47; or (3) it has immunoregulatory properties that can promote host susceptibility to infection19. To our knowledge, there is no evidence of a direct or indirect detrimental effect of itaconate synthesis on the Plasmodium parasite48. Importantly, we found that the itaconate-free Acod1−/− mice show enhanced levels of pro-inflammatory cytokines, low levels of PD-L1 expression, and enhanced resistance to Pc-infection relative to WT mice. Thus, we hypothesize that the itaconate immunoregulatory effects on the host are the most relevant for disease development in this model. Recently, a report demonstrated that itaconate can generate secondary metabolites. Mesaconate derived from itaconate phenocopies the immunoregulatory effects of itaconate27. Here, for the first time, we demonstrated that mesaconate can be synthesized in vivo and ex vivo by myeloid cells in a pathological context. In our analysis, we found that itaconate and mesaconate are the only TCA cycle-derived metabolites that accumulate in the plasma of infected mice, and they may act together to regulate host immune responses. However, the concentration of mesaconate was around one fourth of the itaconate concentration, suggesting an adjuvant immunoregulatory role.
Exogenous itaconate regulates macrophage activation through direct engagement of the NRF2 and ATF3 regulatory pathways that limit the production of type I IFN from LPS-stimulated macrophages7,29 while promoting IL-10 release49. In the same in vitro model, itaconate treatment delays NLRP3 inflammasome activation in macrophages50,51. Yet, in alternatively activated macrophages (IL-4-induced), exogenous itaconate inhibits JAK1 phosphorylation52, which might reduce the activation of cytokines that signal through JAK1, such as IL-6, TNF, and IFNγ53. We found, however, that NRF2 expression was inhibited, whereas ATF3 expression was not altered in CD11b+ cells from Pc-infected mice. Nevertheless, we found that IκBζ, which promotes the release of IL-6 and TNF by monocytes, is inhibited by itaconate in MODCs of infected mice. Thus, we speculate whether suppressive effects of itaconate on MODCs could protect the host from deleterious systemic inflammation in models of lethal malaria.
Importantly, immune suppression in malaria can be induced by IRF7 activation and type I IFN signaling 54. The recognition of nucleic acids by cytosolic sensors activates IRF3 and IRF7 which sustains the expression of ISGs and type I IFN signaling. In studies performed by our group and elsewhere, it was shown that Plasmodium nucleic acids are sensed by cGAS and other cytosolic receptors in macrophages55,30,56,57. Nonetheless, recent findings show that mitochondrial damage can release mtDNA in cytosol, which induce the expression of check-point markers in IRF3/7-dependent way32,33. In addition, there is an extensive literature showing the importance of IFNγ in priming monocytes during Plasmodium infection17,38,58, corroborating the hypothesis that IFNγ signaling initiates the expression of ISGs in MODCs, which is sustained by cytosolic sensing of mtDNA. Our data of mitochondria damage suggest that during Plasmodium infection, itaconate accumulation induced by IFNγ/PPARγ axis disrupts the TCA cycle in MODCs, damaging mitochondria and causing release of mitochondrial genome fragments into the cytosol. Once sensed by a cytosolic innate immune receptor, potentially cGAS, the fragments of the mitochondrial genome trigger PD-L1 expression via the STING/IRF3/IRF7 pathway. This hypothesis is consistent with the findings that accumulation of fumarate due to deficiency of the TCA enzyme fumarate hydratase, as well as inhibition of de novo synthesis of nucleotides, lead to cytosolic leakage of mtDNA and activation of cGAS-STING-TBK159,60. Alternatively, we found that expression of RIG-I and MDA5 is augmented in MODCs, suggesting that mtdsRNA may also contribute to IRF3/IRF7-induced PD-L1 expression via MAVS activation. Furthermore, we found that in vitro priming of MODCs with IFNγ recapitulates the phenotype of MODCs with damaged mitochondria induced during in vivo Pc infection. We hypothesize that in our model, nucleic acid cytosolic sensors, which ultimately trigger PD-L1 expression on MODCs, are activated by self-mtDNA (or mtdsRNA). Accordingly, CD8+ T cells display an exhausted phenotype induced by PD-L1 resulting in uninhibited growth of blood-stage malaria. Consistently, PD-L1 blockade enhances parasitemia clearance in rodent malaria 61. So far, most studies indicate that itaconate’s effects on lymphocytes are due to an indirect effect in myeloid cells62–66. Although we did not evaluate the direct effect of endogenous itaconate on CD8+ T cells, ACOD1 is expressed only by myeloid cells. Thus, we assume that the effects of itaconate on CD8+ T cells in our model are indirect due to induction of PD-L1 in MODCs.
In summary, for the first time, we show the importance of itaconate in regulating the immune response and enhanced susceptibility to a parasitic infection. MODCs have an important role in the pathogenesis of both human disease and experimental models of malaria 38,67. We now present evidence that the status of activation of these cells is intrinsically linked to mitochondrial function. Consistently, our results show that itaconate promotes host susceptibility to infection. Thus, targeting ACOD1 and limiting itaconate availability could boost immune response against Plasmodium, which could improve the efficacy of conventional antimalarial therapies.
LIMITATIONS OF THE STUDY
In our model, cGAS is a prime candidate for sensing mtDNA and activating the STING-IRF3/IRF7 pathway. While we detected high levels of intermediary metabolites that are part of cGAMP generation, our untargeted metabolomic approach did not detect cGAMP within MODCs. This raises the question regarding the sensitivity of our assay to detect dinucleotides, in particular cGAMP. We also noticed that the proteins RIG-I and MDA5 that sense mtdsRNA show enhanced expression in MODCs from Pc-infected mice. Furthermore, different studies indicate that Plasmodium infection activates various nucleic acid-sensing cytosolic receptors67. Hence, despite the robust data generated by multiple approaches that indicate a key role for STING, IRF3, and IRF7 in inducing PD-L1, the contribution of RIG-I and MDA5 in promoting PD-L1 expression needs further investigation.
The immune response is a double-edged sword during malaria. CD8 T cells are implicated in host resistance to the blood stage of P. vivax malaria in humans and in other malaria mouse model 68,69. However, CD8 T cells can also be pathogenic, for instance in the cerebral experimental malaria 70 71. Our results show that itaconate impairs control of parasitemia by limiting CD8 T cell function during the acute phase of infection. It remains to be defined whether the immune regulatory role of itaconate on systemic inflammation and CD8 T cell function mediates tolerance to disease in the different models of malaria. Thus, as the host condition influences immunity and pathology, further investigation of the effects of endogenous itaconate in vivo may provide new insights to intervene in patients with malaria.
STAR Methods
Resource availability
Lead contact.
Further information and requests for resources and reagents should be directed to Ricardo Gazzinelli and will be fulfilled by the corresponding authors Theresa Ramalho (theresa.ramalho@umassmed.edu) and Ricardo Gazinelli (ricardo.gazzinelli@umassmed.edu).
Materials availability.
This study did not generate new unique reagents.
Experimental model and subject details
Ethics for animal experiments and human samples.
Experiments with mice were conducted according to institutional guidelines for animal ethics and approved by the Institutional Ethics from UMass Chan Medical School (IACUC/202100027). Experiments with human samples followed the protocol reviewed and approved by the Ethical Committees on Human Experimentation from Instituto René Rachou, Fiocruz, and the National Ethical Council (CAAE: 59902816.7.0000.5091).
Experimental infections.
The following mouse lineages generated by our laboratory were used in this study: PPARγLysMCre KO, IFNγRLysMCre KO, IFNγ−/−, and Acod1−/− lineages were purchased from The Jackson Laboratory (Bar Harbor, ME). The Acod1−/− lineage was backcrossed for at least ten generations into the C57BL/6NJ, and the other lineages were backcrossed with C57BL/6J. All mouse lineages were bred and maintained in microisolators at UMass Chan on a 12 h dark/light cycle, controlled temperature at 68 to 79 °C, and humidity between 30 and 70%. Female and male mice, between 6 and 10 weeks were used in this study. The Plasmodium chabaudi chabaudi (Pc) strain was utilized to induce experimental malaria in mice. The strain was maintained in weekly passages between infected C57BL/6 mice. Passages and experimental infections used 105 infected red blood cells diluted in PBS at room temperature. Parasitemia, body weight, and blood glycemia were monitored during the acute phase of the disease. Blood and spleen samples were collected from infected mice 7 days after the infection. Samples from non-infected mice were also collected for control groups.
Monocyte-derived dendritic cells (MODCs).
Spleens from infected and non-infected mice were macerated on a 100 μm nylon cell strainer with cell culture media. After centrifuging the macerated sample, erythrocytes were lysed, and total splenocytes were washed. Total splenocytes were used for galactose assay, flow cytometry, and glucose uptake assays. A positive selection for CD11b splenocytes was performed to enrich MODC frequency in splenocyte samples. In some experiments, CD11b+ splenocytes were incubated ex vivo for 4h for collection of supernatants. Incubation ex vivo for 1h was also performed for real-time evaluation of extracellular parameters. In parallel, CD11b+ cells were stained for MODC sorting and were also processed for protein and RNA extraction. Alternatively, MODCs were differentiated in vitro. Total splenocytes from non-infected mice were plated at a density of 4×10⁶. The cells were stimulated with recombinant IFNγ (100 ng/mL) for 24h. After incubation, the cells were collected and analyzed by flow cytometry. For some ex vivo experiments, total splenocytes from infected and non-infected mice were plated on glucose media (regular complete DMEM) or galactose media, in which 25 mM of galactose is used in a DMEM glucose-free media. The splenocytes were incubated overnight, and then MODCs were stained with antibodies to analyze mitochondria functionality. For in vitro experiments, total splenocytes from non-infected mice were stimulated with recombinant IFNγ (100 ng/mL) in glucose or galactose media and then analyzed by flow cytometry.
Stimulation of immortalized bone marrow-derived macrophages with IFNγ.
Immortalized bone marrow-derived macrophages were plated at a density of 4×10⁶. The cells were stimulated with recombinant IFNγ (100 ng/mL) for 24h. After incubation, the cells were collected and stained for flow cytometry.
Method details
Glucose uptake in total splenocytes.
Total splenocytes from non-infected and infected mice were aliquoted and incubated with the substrate 3H-2DG at room temperature. After 30 min, a stop solution was added to each sample to stop substrate uptake, cells were lysed with 3% perchloric acid, and radioactivity was detected by scintillation counting.
Flow cytometry in total splenocytes.
Total splenocytes were stained with antibodies specific for surface and intracellular markers in MODCs and lymphocytes. Four different antibody panels were used in this work. The three panels used to localize the MODC population in the spleen had the following antibodies: Live/Dead Ghost Aqua V510, Anti-F480 (clone BM8) PE-Cy5, -CD11b (clone M1/70) PE-Cy7, -DCSign (clone MMD3) APC, -MHCII (clone AF6–120.1) PE. To sort MODCs out, we added the anti-CD3 (17A2) FITC to exclude CD3+ cells. MODCs that were CD3neg were collected from the BD FACS Aria Fusion. Sorted cells were processed for further omic analysis. To detect mitochondrial functionality in MODCs, we added the probes Mitotracker Green (60 nM) and Mitotracker Red (70 nM). To evaluate the expression of co-stimulatory markers in MODCs, we added the following antibodies: Anti-CD80 (clone 16–10A1) FITC, -CD86 (clone GL1) Super Bright 702, and -PDL1 (clone MIH5) Super Bright 600. Fixation and permeabilization steps were added to the protocol for intracellular staining with Anti-GLUT1 (clone EPR3915) Alexa Fluor 405 in MODCs. The panel to localize lymphocytes in the spleen included the following antibodies for surface markers: Live/Dead Green, Anti-CD3 (clone 17A2) PE-eFluor610, -CD4 (clone GK1.5) Alexa Fluor 700, -CD8 (clone 53–6.7) APC-Cy7, -CXCR3 (clone 178) Brilliant Violet 421 or -PD1 (clone J43) Brilliant Violet 421. For intracellular staining of lymphocytes, fixation and permeabilization were performed for staining with anti-T-bet (clone 4B10) PE, and anti-IFNγ (clone XMG1.2) APC. All the panels included anti-mouse CD16/32 (clone 93). The acquisition of samples with panels for mitochondrial functionality, co-stimulatory markers, and lymphocyte activation was performed on the Cytek Aurora Spectral Cytometer. All the panels included FMO samples to ensure the precise selection of positive populations. The analysis of the FSC files of experimental and compensation samples was performed on FlowJo.
Cytokine detection in plasma and supernatant samples.
The detection of cytokines in the supernatant of MODCs and plasma was performed with the BD CBA Mouse Inflammation Kit and ELISA. All procedures followed directions recommended by the manufacturer.
Western Blotting.
CD11b+ splenocytes from infected and non-infected mice were processed for protein extraction with NP40 supplemented with protease and phosphatase inhibitors. After protein quantification, the samples were prepared to be loaded on SDS-PAGE 10% gel. Then, the protein samples were transferred to PVDF or nitrocellulose membranes. The membranes were incubated with primary antibodies anti-GLUT1 (mouse), anti-PPARγ (mouse), and anti-ACOD1 (rabbit). Anti-actin was used as an endogenous control. Secondary antibodies anti-mouse or -rabbit conjugated with HRP were incubated after washing the primary antibody. HRP chemiluminescence of each target was revealed with the addition of substrates. The signal of the bands was detected with the ChemiDoc Imaging System (BioRad).
Pharmacological inhibitors.
For inhibition pre-differentiation, total splenocytes from non-infected mice were incubated in vitro with recombinant IFNγ (100 ng/mL) or only DMEM for 24 h (period for MODC differentiation). IFNγ- or non-stimulated cells were simultaneously treated with GW9662 (GW, 10 μM). After the incubation, splenocytes were collected and stained for further flow cytometry analysis to determine the differentiation and mitochondrial status of MODCs. For pharmacologic intervention post-MODC differentiation, CD11b+ splenocytes from infected and non-infected mice were incubated ex vivo with the following individual treatments: UK5099 (UK) 10 μM to inhibit Mitochondrial Pyruvate Carrier 1 (MPC-1), Etomoxir (Eto, 3 μM) to inhibit Carnitine Palmitoyl Transferase 1 alpha (CPT1a), 2-Deoxy-D-Glucose (2-DG, 2 mM) to inhibit hexokinase (HK) and consequent pyruvate synthesis from glycolysis, 6-Diazo-5-oxo-L-norleucine (DON, 50 μM_ to inhibit glutamate synthesis, or GW (10 μM) to inhibit PPARγ. The cells were incubated for 1h with the inhibitors in adequate media for extracellular rate assays. To collect supernatants, CD11b+ cells were incubated for 4 h ex vivo with inhibitors in DMEM supplemented with penicillin, streptomycin, and 10% FBS.
Transcriptomes in total splenocytes.
Total splenocytes collected from P. chabaudi-infected and non-infected WT and IFNγ−/− mice at day 6 post-infection were processed for analysis of gene expression using a gene chip from Affymetrix (23,000) transcripts. The expression values of each gene were determined by the average of differences in intensity (perfect match intensity minus mismatch intensity) between its probe pairs. We plotted the fold-change vs. p-value of the genes related to the TCA cycle and its derivatives comparing Pc-infected mice with non-infected WT mice and comparing Pc-infected IFNγ−/− mice with Pc-infected WT mice.
Untargeted and targeted metabolome of MODCs.
An untargeted metabolome analysis was performed in sorted monocytes from non-infected and in sorted MODCs from P. chabaudi-infected mice. To determine the relative abundance of polar metabolites in the cells, extracts from the cells were prepared and analyzed by ultra-high-resolution mass spectrometry (HRMS). Metabolites were extracted using ice-cold 0.1% Ammonium hydroxide in 80/20 (v/v) methanol/water. Extracts were centrifuged at 17,000g for 5 min at 4 °C, and supernatants were transferred to clean tubes, followed by evaporation to dryness under nitrogen. Dried extracts were reconstituted in deionized water, and 5 μL was injected for analysis by ion chromatography (IC)-mass spectrometry (MS). IC mobile phase A was water, and mobile phase B was water containing 100 mM KOH. A Thermo Scientific Dionex ICS-5000+ System included a Thermo IonPac AS11 column (4 μm particle size, 250 × 2 mm) with the column compartment kept at 30 °C. The autosampler tray was chilled to 4 °C. The mobile phase was 250 μL/min and a gradient from 1 mM to 100 mM KOH was used. The total run time was 60 min. To assist the desolvation for better sensitivity, methanol was delivered by an external pump and combined with the eluant via a low dead volume mixing tee. Data were acquired using a Thermo Orbitrap Fusion Tribid Mass Spectrometer under ESI negative ionization mode at a resolution of 240,000. The peak area of each compound was normalized using the total peak area of the respective sample. The total peak area of each sample is defined as the sum of the peak area intensity for all the compounds in that sample. Additionally, for internal standards, acetic acid-13C2, butyric acid-13C4, pentanoic acid-13C2, and propionic acid 13-C3 were also introduced in data which were used for normalization of respective compounds prior to total peak area normalization. Next-Generation Clustered Heat Map software was used for clustering analysis. Normalized data was median transformed before generating clustering analysis. Metabolite extraction and analysis for metabolomics and lipidomic analysis (next subsection) were performed at the Metabolic Core Facility, at the MD Anderson Cancer Center of the University of Texas, under the grants supported by NIH grants S10OD012304–01 and P30CA016672.
Untargeted lipidome of MODCs.
The lipid extraction solvent consisted of ethanol containing 1% 10 mM butylated hydroxytoluene in methanol and 2% Avanti SPLASH® LIPIDOMIX® Mass Spec Standards. We added 200 μL extraction solvent to cell pellets, samples were vortexed for 10 min, placed on ice for 10 min, and then centrifuged at 4 °C for 10 min at 17,000g. Supernatants were then collected for LC-MS analysis. For the Reverse Phase Liquid Chromatography, the injection volume was 15 μL. Mobile phase A (MPA) was 60:40 acetonitrile:water with 0.1% formic acid in 10 mM ammonium formate. Mobile phase B (MPB) was 90:9:1 isopropanol:acetonitrile:water with 0.1% formic acid in 10 mM ammonium formate. The chromatographic method included a Thermo Fisher Scientific Accucore C30 column (2.6 μm, 150 × 2.1 mm) maintained at 40 °C, a mobile phase flow rate of 0.200 mL/min, and a gradient elution program as follows: 0–3 min, 30% MPB; 3–13 min, 30–43% MPB; 13.1–33 min, 50–70% MPB; 33–48 min, 70–99% MPB; 48–55 min, 99% MPB; 55.1–60 min, 30% MPB. A Thermo Fisher Scientific Orbitrap Fusion Lumos Tribrid mass spectrometer with a heated electrospray ionization source was operated in data-dependent acquisition mode, in both positive and negative ionization modes, with scan ranges of 150 – 827 and 825 – 1500 m/z. Orbitrap resolution of 120,000 (FWHM) was used for MS1 acquisition, and spray voltages of 3,600 and −2900 V were used for positive and negative ionization modes, respectively. For MS2 and MS3 fragmentation, a hybridized HCD/CID approach was used. Each sample was analyzed using 4 × 15 μL injections making use of the two aforementioned scan ranges and ionization modes. Data were analyzed using Thermo Scientific LipidSearch software (version 5.0.63) and processed further using in-house R scripts.
Transcriptome profiling of monocytes from patients infected with P. vivax.
Patients from the Tropical Medicine Center in Porto Velho (Brazil) were diagnosed with malaria by clinical symptoms and thick blood smear. Five individuals between 18 and 60 years old who did not fit one or more of the exclusion criteria (chronic inflammatory or infectious diseases, pregnancy, and breastfeeding) were selected and had their blood collected by venipuncture. The infection by Plasmodium vivax was confirmed by qPCR. Briefly, DNA extraction was done using the QIAamp DNA Blood mini kit (QIAGEN). The individuals were treated with a combination of chloroquine and primaquine, according to the recommended schedule and doses of the Brazilian Ministry of Health. Forty-five days after the diagnosis, the same patients (who were now symptom-free) had their blood collected again to confirm by qPCR that they were no longer infected by P. vivax. All patients were informed about the procedures and objectives of the study and agreed to participate by written consent.
Human peripheral blood mononuclear cells (PBMCs) were isolated using Ficoll-Paque reagent (GE Healthcare) according to the manufacturer’s protocol. Then, the PBMCs were enriched for monocytes using immunomagnetic separation. Briefly, PBMCs were incubated with magnetic CD14 microbeads for 15 minutes and then loaded in an LS MACS® column which was placed in a magnet (MACS® separator). The cells were washed 3 times with PBS (pH 7.2) containing 0.5% bovine serum albumin (BSA) and 2 mM EDTA. Then, the column was removed from the separator and the CD14+ cells magnetically retained on the column were eluted. The microbeads, columns, and magnets were all purchased from Miltenyi Biotec.
Total mRNA from the monocytes was extracted using TRIzol reagent (Thermo Fisher Scientific), quantified in a fluorometer (Qubit 2.0®, Thermo Fisher Scientific), and analyzed by capillary electrophoresis (Bioanalyzer®, Agilent) to certify its quality. Libraries were prepared from the mRNAs using the TruSeq Stranded mRNA Kit (Illumina) according to the manufacturer’s protocol. The sequencing reaction was performed in a NextSeq 500 system using the NextSeq 500/550 High Output Kit v2.5 for 75 cycles (both from Illumina). The sequencing FASTQ files were processed with the Trimmomatic software to exclude bases with quality scores below 25 and remove adaptor sequences and short reads (less than 55 bases). The processed reads were then aligned to Homo sapiens genome reference (release 38) using STAR. DESeq2 software was used to obtain differentially expressed genes by a paired analysis in the contrast between the monocytes collected in the acute phase of the disease and those collected post-treatment for the same patients.
Public metabolomics and transcriptomics analyses.
Normalized liquid chromatography-mass spectrometry (LC-MS) metabolomics data from the plasma of C57BL/6 mice infected with P. chabaudi were retrieved from the Metabolomics Workbench database under accession ID ST001775. Metabolomics data from the plasma of human volunteers experimentally infected with P. vivax were acquired from the MetaboLights repository under accession ID MTBLS665. The pre-processed feature table of negative mode LC-MS was log2 transformed before statistical analysis and identification of itaconate was obtained via comparison of accurate mass (10 ppm) and retention time to that of the chemical reference standard. Transcriptomics data were acquired at the Gene Expression Omnibus (GEO) repository. We downloaded RNA sequencing (RNAseq) raw gene count tables of monocytes isolated from children, which were later stimulated with P. falciparum-infected red blood cells (iRBC) in vitro (GSE151116); of monocytes isolated from children during acute and convalescence phase of malaria caused by P. falciparum (GSE154317); and of effector memory CD4+ T cells sorted from adult volunteers experimentally infected with P. falciparum before infection (baseline) and 6 days after drug treatment (GSE174791). Data were filtered, normalized to counts per million reads (CPM), and log-transformed using the EdgeR package for R. Statistical analyses of target metabolites or genes were performed with T-test or Mann–Whitney U test for categorical or Kruskal-Wallis test followed by Dunn’s multiple comparison test for longitudinal comparisons. Significance is given as * p < 0.05, ** p < 0.01, and *** p < 0.001.
Oxygen consumption rate and extracellular acidification in MODCs:
After positive selection, CD11b+ splenocytes from infected and non-infected mice were plated on an xFe96 plate. The plates were previously coated with poly-D-lysine. The cells were incubated for 1 h with the appropriate treatment (UK5099, Etomoxir, DON, or GW9662). After the treatment, the media was changed, the treatment was replaced, and cells were incubated for 1 h in an incubator without carbon dioxide. After incubation, the cells were placed in the Seahorse XFe96 Analyzer for MitoStress Assay. During the assay, the first three quantification measures the basal oxygen consumption. Three quantifications were performed after each injection with Oligomycin 1.5 mM, FCCP 1.5 mM, and Rotenone/Antimycin 0.5 mM. The parameter of maximal respiration was obtained from the average quantification after FCCP treatment minus the average of measurements after Rotenone and Antimycin treatments. The basal levels of extracellular acidification were quantified before the injection with Oligomycin.
Quantification and statistical analysis
Results are presented as mean± SEM. All graphs were generated by GraphPad Prism 9.0 (GraphPad Software, La Jolla, CA, USA). The sample distribution was determined by a Kolmogorov-Smirnov normality test. For statistical comparisons, one-way ANOVA tests were used to compare normally distributed variables. Non-normally distributed data were compared using the Kruskal-Wallis test. The analysis of untargeted metabolomics, untargeted lipidomics, and transcriptomes is described in the subsection that respectively describes each omic data.
Supplementary Material
Data S1. Unprocessed data underlying the display items in the manuscript, related to Figures 1 to 7, and supplementary figures 1 to 6.
Supplementary table 4. Lipidome data in splenic MODCs isolated from P. chabaudi-infected mice compared to monocytes from non-infected mice. Related to figure 3 (A).
| REAGENT or RESOURCE | SOURCE | IDENTIFIER |
|---|---|---|
| Antibodies | ||
| Anti-F480 (clone BM8) – PE-Cy5 | Thermo Fischer | 15–4801-82 |
| Anti-CD11b (clone M1/70) - PE-Cy7 | Invitrogen | 25–0112-81 |
| Anti-CD209a (clone MMD3) - eFluor660 | eBioscience | 50–2094-82 |
| Anti-MHCII I-A(b) PE (clone AF6–120.1) - PE | BD | 553552 |
| Anti-CD86 (B7–2) (clone GL1) - Super Bright 702 | eBioscience | 67–0862-82 |
| Anti-CD80 (B7–1) (clone 16–10A1) - FITC | eBioscience | 11–0801-82 |
| anti-CD274 (PD-L1) (clone MIH5) - Super Bright 600 | eBioscience | 63–5982-82 |
| Anti-CD11c (clone N418) - Alexa Fluor 700 | Invitrogen | 56–0114-82 |
| Anti-Tbet (clone eBio4B10) - PE | Thermo Fischer | 12–5825-82 |
| Anti-CD3 (clone 17A2) - PE-eFluor619 | eBioscience | 61–0032-82 |
| Anti-IFNg (clone XMG1.2) - eFluor660 | eBioscience | 17–7311-82 |
| Anti-CD4 (clone GK1.5) - Alexa Fluor700 | eBioscience | 56–0041-82 |
| Anti-CD8 mouse (clone 53–6.7) - APC-Cy7 | Biolegend | 100714 |
| Anti-CXCR3 (clone CXCR3–173) BV421 | BD | 566283 |
| Anti-GLUT1 (clone EPR3915) - Alexa Fluor 405 | Abcam | ab210438 |
| Anti-GLUT1 Rat (clone SPM498) | Abcam | Ab40084 |
| Anti-ATF3 mouse (clone 44c3a) | Santa Cruz | sc-81189 |
| Anti-IkBz mouse | Cell signaling | 93726 |
| Anti-NRF2 Rabbit (clone D1Z9C) | Cell signaling | 12721 |
| Anti-PPARg mouse (E-8) | Santa Cruz | SC-7273 |
| Anti-ACOD1 mouse (IRG1) | Cell Signaling | 17805 |
| Bacterial and virus strains | ||
| Chemicals, peptides, and recombinant proteins | ||
| GW9662 | Sigma | M6191 |
| Etomoxir | Sigma | E1905 |
| Recombinant mouse IFNg | Biolegend | 575308 |
| 2-cyano-3, 12-dioxooleana-1,9-dien-28-oic acid (CDDO) | Cayman | 11883 |
| 4-octyl itaconate | Sigma | SML2338 |
| UK-5099 | Sigma | PZ0160 |
| Cell Stimulation Cocktail 500x | Thermo Fischer | 00–4975-03 |
| D-galactose | Sigma | G5388 |
| 6-diazo-5-oxo-L-norleucine (DON) | Sigma | D2141 |
| 2-deoxy-D-glucose | Sigma | D8375 |
| Critical commercial assays | ||
| FIX&PERM kit | Thermo Fischer | GAS001S100 |
| CBA mouse inflammation kit | BD | 552364 |
| MitoStress Kit | Agilent | 103015–100 |
| Mouse PD-L1 DuoSet ELISA | R&D | DY1019 |
| Mouse CCL5/RANTES DuoSet ELISA | R&D | DY478 |
| Deposited data | ||
| RNAseq in monocytes from children during acute malaria caused by P. falciparum | NCBI GEO Datasets | GSE154317 |
| RNAseq in human monocytes stimulated with P. falciparum-infected red blood cells (iRBC) | NCBI GEO Datasets | GSE151116 |
| RNAseq in MODCs from non-infected and PbA-infected mice | NCBI GEO Datasets | GSE126381 |
| RNAseq in monocytes from non-infected and P. vivax-infected individuals | Zenodo.org (openaire) | 7683361 |
| Non-targeted metabolomics in plasma from mice infected with P. chabaudi | Metabolomics Workbench | ST001775 |
| Non-targeted metabolomics in plasma from human infected with P. vivax | MetaboLights | MTBLS665 |
| Non-targeted metabolomics/lipimodomics in MODC from Pc-infected mice | Zenodo.org (openaire) | 7608255 |
| Unprocessed data for graphs in main figures | This paper | Data S1 |
| Unprocessed data for graphs in supplementary figures | This paper | Data S1 |
| Uncropped western blot images | This paper | Data S1 |
| Experimental models: Cell lines | ||
| iBMDM from WT mice | Prof. Douglas Golenbock | This paper |
| iBMDM from IRF7−/− mice | Prof. Douglas Golenbock | This paper |
| iBMDM from IRF3/7−/− mice | Prof. Douglas Golenbock | This paper |
| Experimental models: Organisms/strains | ||
| Mouse: PPARg−/− LysM-cre | Prof. Ricardo Gazzinelli | This paper |
| Mouse: IFNgR−/− LysM-cre | Prof. Ricardo Gazzinelli | This paper |
| Mouse: ACOD1−/− | The Jackson Laboratory | 029340 |
| Mouse: C57BL/6NJ WT | The Jackson Laboratory | 005304 |
| Mouse: C57BL/6 WT | Prof. Ricardo Gazzinelli | This paper |
| Mouse: STING−/− | Prof. Katherine Fitzgerald | This paper |
| Software and algorithms | ||
| FlowJo | FlowJo LLC | flowjo.com |
| Graphpad Prism | Graphpad Software | graphpad.com |
| Morpheus | Broad Institute | software.broadinstitute.org/morpheus/ |
| R studio | Posit | rstudio.com |
| Other | ||
| MitoTracker Green FM | Invitrogen | M7514 |
| MitoTracker Red FM | Invitrogen | M22425 |
| Ghost Dye Violet 510 (1:250) | Tonbo Biosciences | 13–0870-T100 |
| LIVE/DEAD Green fixable | Invitrogen | L23101 |
HIGHLIGHTS.
Pc-induced IFNγ boosts glycolysis in MODCs and itaconate accumulation in vivo
Itaconate disrupts mitochondria leading to nucleic acid release and MODC restraint
mtDNA-induced STING-IRF3/IRF7 pathway mediates PD-L1 expression in MODCs
PD-L1 expression by MODCs impairs CD8+ T cell activation and control of parasitemia
ACKNOWLEDGEMENTS
This work was supported by the US NIH (R01NS098747, R01AI079293, and R21 AI150546), Brazilian National Institute of Science and Technology for Vaccines (INCT/CNPq), Fundação de Pesquisa do Estado de Minas Gerais (465293/2014-0), and Fundação de Amparo de Pesquisa do Estado de Sao Paulo (2016/23618-8). Our sorting assays were supported by the grant NIH S10 S10OD028576. Hira Goel kindly performed the Western blots showing the expression of ATF3 and NRF2 (Figure S5E and F). iBMDMs were previously generated by Rosane de Oliveira while working in the Golenbock laboratory. Gail Germain and Heather Farineau maintained the mice lineages used in this study. Kristen Halmen managed all the orders for the materials used in this work. Melanie Trombly kindly edited the text.
INCLUSION AND DIVERSITY
We support inclusive, diverse, and equitable conduct of research.
Footnotes
DECLARATION OF INTEREST
The authors no competing interests.
Publisher's Disclaimer: This is a PDF file of an unedited manuscript that has been accepted for publication. As a service to our customers we are providing this early version of the manuscript. The manuscript will undergo copyediting, typesetting, and review of the resulting proof before it is published in its final form. Please note that during the production process errors may be discovered which could affect the content, and all legal disclaimers that apply to the journal pertain.
Data and code availability
The metabolome and lipidome in splenic MODCs from Pc-infecetd mice generated in this study can be accessed on zenodo.org with the code # 7608255. Metabolomics data from the plasma of C57BL/6 mice infected with P. chabaudi were retrieved from the Metabolomics Workbench database under accession ID ST001775. Metabolomics data from the plasma of human volunteers experimentally infected with P. vivax were acquired from the MetaboLights repository under accession ID MTBLS665. The RNAseq in monocytes from individuals infected with P. vivax can be found on zenodo.org with the code #7683361. The RNAseq in splenic MODCs from P. beghei Anka can be obtained on GEO with the code GSE126381, platform GPL19057. RNAseq in monocytes isolated from children, which were later stimulated with P. falciparum-infected with red blood cells (iRBC) in vitro is GSE151116. RNAseq in monocytes isolated from children during acute and convalescence phase of malaria caused by P. falciparum is GSE154317. RNAseq in effector memory CD4+ T cells sorted from adult volunteers experimentally infected with P. falciparum before infection (baseline) and 6 days after drug treatment is GSE174791. Uncropped scans of all western blots and all raw data used to generate graphs are included in Data S1. Further information and requests for resources and reagents should be directed to the corresponding authors.
REFERENCES
- 1.Monroe A, Williams NA, Ogoma S, Karema C, and Okumu F (2022). Reflections on the 2021 World Malaria Report and the future of malaria control. Malar J 21, 154. 10.1186/s12936-022-04178-7. [DOI] [PMC free article] [PubMed] [Google Scholar]
- 2.Schofield L, and Grau GE (2005). Immunological processes in malaria pathogenesis. Nat Rev Immunol 5, 722–735. 10.1038/nri1686. [DOI] [PubMed] [Google Scholar]
- 3.Clark IA, Budd AC, Alleva LM, and Cowden WB (2006). Human malarial disease: a consequence of inflammatory cytokine release. Malar J 5, 85. 10.1186/1475-2875-5-85. [DOI] [PMC free article] [PubMed] [Google Scholar]
- 4.Pålsson-McDermott EM, and O’Neill LAJ (2020). Targeting immunometabolism as an anti-inflammatory strategy. Cell Res 30, 300–314. 10.1038/s41422-020-0291-z. [DOI] [PMC free article] [PubMed] [Google Scholar]
- 5.Martínez-Reyes I, and Chandel NS (2020). Mitochondrial TCA cycle metabolites control physiology and disease. Nat Commun 11, 102. 10.1038/s41467-019-13668-3. [DOI] [PMC free article] [PubMed] [Google Scholar]
- 6.Choi I, Son H, and Baek J-H (2021). Tricarboxylic Acid (TCA) Cycle Intermediates: Regulators of Immune Responses. Life (Basel) 11, 69. 10.3390/life11010069. [DOI] [PMC free article] [PubMed] [Google Scholar]
- 7.Mills EL, Ryan DG, Prag HA, Dikovskaya D, Menon D, Zaslona Z, Jedrychowski MP, Costa ASH, Higgins M, Hams E, et al. (2018). Itaconate is an anti-inflammatory metabolite that activates Nrf2 via alkylation of KEAP1. Nature 556, 113–117. 10.1038/nature25986. [DOI] [PMC free article] [PubMed] [Google Scholar]
- 8.Diniz SQ, Teixeira-Carvalho A, Figueiredo MM, Costa PAC, Rocha BC, Martins-Filho OA, Gonçalves R, Pereira DB, Tada MS, Oliveira F, et al. (2021). Plasmodium vivax Infection Alters Mitochondrial Metabolism in Human Monocytes. mBio 12, e0124721. 10.1128/mBio.01247-21. [DOI] [PMC free article] [PubMed] [Google Scholar]
- 9.Vijay R, Guthmiller JJ, Sturtz AJ, Surette FA, Rogers KJ, Sompallae RR, Li F, Pope RL, Chan J-A, de Labastida Rivera F, et al. (2020). Infection-induced plasmablasts are a nutrient sink that impairs humoral immunity to malaria. Nat Immunol 21, 790–801. 10.1038/s41590-020-0678-5. [DOI] [PMC free article] [PubMed] [Google Scholar]
- 10.Gordon EB, Hart GT, Tran TM, Waisberg M, Akkaya M, Kim AS, Hamilton SE, Pena M, Yazew T, Qi C-F, et al. (2015). Targeting glutamine metabolism rescues mice from late-stage cerebral malaria. Proc Natl Acad Sci U S A 112, 13075–13080. 10.1073/pnas.1516544112. [DOI] [PMC free article] [PubMed] [Google Scholar]
- 11.Cordy RJ, Patrapuvich R, Lili LN, Cabrera-Mora M, Chien J-T, Tharp GK, Khadka M, Meyer EV, Lapp SA, Joyner CJ, et al. (2019). Distinct amino acid and lipid perturbations characterize acute versus chronic malaria. JCI Insight 4, e125156, 125156. 10.1172/jci.insight.125156. [DOI] [PMC free article] [PubMed] [Google Scholar]
- 12.Gardinassi LG, Cordy RJ, Lacerda MVG, Salinas JL, Monteiro WM, Melo GC, Siqueira AM, Val FF, Tran V, Jones DP, et al. (2017). Metabolome-wide association study of peripheral parasitemia in Plasmodium vivax malaria. Int J Med Microbiol 307, 533–541. 10.1016/j.ijmm.2017.09.002. [DOI] [PMC free article] [PubMed] [Google Scholar]
- 13.Pappa V, Seydel K, Gupta S, Feintuch CM, Potchen MJ, Kampondeni S, Goldman-Yassen A, Veenstra M, Lopez L, Kim RS, et al. (2015). Lipid metabolites of the phospholipase A2 pathway and inflammatory cytokines are associated with brain volume in paediatric cerebral malaria. Malar J 14, 513. 10.1186/s12936-015-1036-1. [DOI] [PMC free article] [PubMed] [Google Scholar]
- 14.Colvin HN, and Joice Cordy R (2020). Insights into malaria pathogenesis gained from host metabolomics. PLoS Pathog 16, e1008930. 10.1371/journal.ppat.1008930. [DOI] [PMC free article] [PubMed] [Google Scholar]
- 15.Antonelli LRV, Leoratti FMS, Costa PAC, Rocha BC, Diniz SQ, Tada MS, Pereira DB, Teixeira-Carvalho A, Golenbock DT, Gonçalves R, et al. (2014). The CD14+CD16+ inflammatory monocyte subset displays increased mitochondrial activity and effector function during acute Plasmodium vivax malaria. PLoS Pathog 10, e1004393. 10.1371/journal.ppat.1004393. [DOI] [PMC free article] [PubMed] [Google Scholar]
- 16.Hirako IC, Assis PA, Hojo-Souza NS, Reed G, Nakaya H, Golenbock DT, Coimbra RS, and Gazzinelli RT (2018). Daily Rhythms of TNFα Expression and Food Intake Regulate Synchrony of Plasmodium Stages with the Host Circadian Cycle. Cell Host Microbe 23, 796–808.e6. 10.1016/j.chom.2018.04.016. [DOI] [PMC free article] [PubMed] [Google Scholar]
- 17.Hirako IC, Ataide MA, Faustino L, Assis PA, Sorensen EW, Ueta H, Araújo NM, Menezes GB, Luster AD, and Gazzinelli RT (2016). Splenic differentiation and emergence of CCR5+CXCL9+CXCL10+ monocyte-derived dendritic cells in the brain during cerebral malaria. Nat Commun 7, 13277. 10.1038/ncomms13277. [DOI] [PMC free article] [PubMed] [Google Scholar]
- 18.Assis PA, Fernandes Durso D, Chacon Cavalcante F, Zaniratto R, Carvalho-Silva AC, Cunha-Neto E, Golenbock DT, Rodrigues Pinto Ferreira L, and Tostes Gazzinelli R (2020). Integrative analysis of microRNA and mRNA expression profiles of monocyte-derived dendritic cells differentiation during experimental cerebral malaria. J Leukoc Biol 108, 1183–1197. 10.1002/JLB.1MA0320-731R. [DOI] [PMC free article] [PubMed] [Google Scholar]
- 19.Peace CG, and O’Neill LA (2022). The role of itaconate in host defense and inflammation. J Clin Invest 132, e148548. 10.1172/JCI148548. [DOI] [PMC free article] [PubMed] [Google Scholar]
- 20.Lampropoulou V, Sergushichev A, Bambouskova M, Nair S, Vincent EE, Loginicheva E, Cervantes-Barragan L, Ma X, Huang SC-C, Griss T, et al. (2016). Itaconate Links Inhibition of Succinate Dehydrogenase with Macrophage Metabolic Remodeling and Regulation of Inflammation. Cell Metab 24, 158–166. 10.1016/j.cmet.2016.06.004. [DOI] [PMC free article] [PubMed] [Google Scholar]
- 21.Pettus BJ, Chalfant CE, and Hannun YA (2002). Ceramide in apoptosis: an overview and current perspectives. Biochim Biophys Acta 1585, 114–125. 10.1016/s1388-1981(02)00331-1. [DOI] [PubMed] [Google Scholar]
- 22.Nagata S, Suzuki J, Segawa K, and Fujii T (2016). Exposure of phosphatidylserine on the cell surface. Cell Death Differ 23, 952–961. 10.1038/cdd.2016.7. [DOI] [PMC free article] [PubMed] [Google Scholar]
- 23.Pizzuto M, and Pelegrin P (2020). Cardiolipin in Immune Signaling and Cell Death. Trends Cell Biol 30, 892–903. 10.1016/j.tcb.2020.09.004. [DOI] [PubMed] [Google Scholar]
- 24.Picard F, and Auwerx J (2002). PPARγ AND G LUCOSE H OMEOSTASIS. Annu. Rev. Nutr. 22, 167–197. 10.1146/annurev.nutr.22.010402.102808. [DOI] [PubMed] [Google Scholar]
- 25.Barber DL, Wherry EJ, Masopust D, Zhu B, Allison JP, Sharpe AH, Freeman GJ, and Ahmed R (2006). Restoring function in exhausted CD8 T cells during chronic viral infection. Nature 439, 682–687. 10.1038/nature04444. [DOI] [PubMed] [Google Scholar]
- 26.Hou Y, Moreau F, and Chadee K (2012). PPARγ is an E3 ligase that induces the degradation of NFκB/p65. Nat Commun 3, 1300. 10.1038/ncomms2270. [DOI] [PubMed] [Google Scholar]
- 27.He W, Henne A, Lauterbach M, Geißmar E, Nikolka F, Kho C, Heinz A, Dostert C, Grusdat M, Cordes T, et al. (2022). Mesaconate is synthesized from itaconate and exerts immunomodulatory effects in macrophages. Nat Metab 4, 524–533. 10.1038/s42255-022-00565-1. [DOI] [PMC free article] [PubMed] [Google Scholar]
- 28.Wang SF, Adler J, and Lardy HA (1961). The pathway of itaconate metabolism by liver mitochondria. J Biol Chem 236, 26–30. 10.1016/S0021-9258(18)64421–7. [DOI] [PubMed] [Google Scholar]
- 29.Bambouskova M, Gorvel L, Lampropoulou V, Sergushichev A, Loginicheva E, Johnson K, Korenfeld D, Mathyer ME, Kim H, Huang L-H, et al. (2018). Electrophilic properties of itaconate and derivatives regulate the IκBζ–ATF3 inflammatory axis. Nature 556, 501–504. 10.1038/s41586-018-0052-z. [DOI] [PMC free article] [PubMed] [Google Scholar]
- 30.Sun L, Wu J, Du F, Chen X, and Chen ZJ (2013). Cyclic GMP-AMP synthase is a cytosolic DNA sensor that activates the type I interferon pathway. Science 339, 786–791. 10.1126/science.1232458. [DOI] [PMC free article] [PubMed] [Google Scholar]
- 31.Dhir A, Dhir S, Borowski LS, Jimenez L, Teitell M, Rötig A, Crow YJ, Rice GI, Duffy D, Tamby C, et al. (2018). Mitochondrial double-stranded RNA triggers antiviral signalling in humans. Nature 560, 238–242. 10.1038/s41586-018-0363-0. [DOI] [PMC free article] [PubMed] [Google Scholar]
- 32.Tigano M, Vargas DC, Tremblay-Belzile S, Fu Y, and Sfeir A (2021). Nuclear sensing of breaks in mitochondrial DNA enhances immune surveillance. Nature 591, 477–481. 10.1038/s41586-021-03269-w. [DOI] [PubMed] [Google Scholar]
- 33.Cheng AN, Cheng L-C, Kuo C-L, Lo YK, Chou H-Y, Chen C-H, Wang Y-H, Chuang T-H, Cheng S-J, and Lee AY-L (2020). Mitochondrial Lon-induced mtDNA leakage contributes to PD-L1-mediated immunoescape via STING-IFN signaling and extracellular vesicles. J Immunother Cancer 8, e001372. 10.1136/jitc-2020-001372. [DOI] [PMC free article] [PubMed] [Google Scholar]
- 34.Galvão-Filho B, de Castro JT, Figueiredo MM, Rosmaninho CG, Antonelli L.R. do V., and Gazzinelli RT (2019). The emergence of pathogenic TNF/iNOS producing dendritic cells (Tip-DCs) in a malaria model of acute respiratory distress syndrome (ARDS) is dependent on CCR4. Mucosal Immunol 12, 312–322. 10.1038/s41385-018-0093-5. [DOI] [PMC free article] [PubMed] [Google Scholar]
- 35.Ataide MA, Andrade WA, Zamboni DS, Wang D, Souza M. do C., Franklin BS, Elian S, Martins FS, Pereira D, Reed G, et al. (2014). Malaria-induced NLRP12/NLRP3-dependent caspase-1 activation mediates inflammation and hypersensitivity to bacterial superinfection. PLoS Pathog 10, e1003885. 10.1371/journal.ppat.1003885. [DOI] [PMC free article] [PubMed] [Google Scholar]
- 36.Hirako IC, Gallego-Marin C, Ataide MA, Andrade WA, Gravina H, Rocha BC, de Oliveira RB, Pereira DB, Vinetz J, Diamond B, et al. (2015). DNA-Containing Immunocomplexes Promote Inflammasome Assembly and Release of Pyrogenic Cytokines by CD14+ CD16+ CD64high CD32low Inflammatory Monocytes from Malaria Patients. mBio 6, e01605–01615. 10.1128/mBio.01605-15. [DOI] [PMC free article] [PubMed] [Google Scholar]
- 37.Kalantari P, DeOliveira RB, Chan J, Corbett Y, Rathinam V, Stutz A, Latz E, Gazzinelli RT, Golenbock DT, and Fitzgerald KA (2014). Dual engagement of the NLRP3 and AIM2 inflammasomes by plasmodium-derived hemozoin and DNA during malaria. Cell Rep 6, 196–210. 10.1016/j.celrep.2013.12.014. [DOI] [PMC free article] [PubMed] [Google Scholar]
- 38.Hirako IC, Assis PA, Galvão-Filho B, Luster AD, Antonelli LR, and Gazzinelli RT (2019). Monocyte-derived dendritic cells in malaria. Curr Opin Microbiol 52, 139–150. 10.1016/j.mib.2019.08.002. [DOI] [PMC free article] [PubMed] [Google Scholar]
- 39.Szatmari I, Gogolak P, Im JS, Dezso B, Rajnavolgyi E, and Nagy L (2004). Activation of PPARgamma specifies a dendritic cell subtype capable of enhanced induction of iNKT cell expansion. Immunity 21, 95–106. 10.1016/j.immuni.2004.06.003. [DOI] [PubMed] [Google Scholar]
- 40.Szatmari I, Töröcsik D, Agostini M, Nagy T, Gurnell M, Barta E, Chatterjee K, and Nagy L (2007). PPARgamma regulates the function of human dendritic cells primarily by altering lipid metabolism. Blood 110, 3271–3280. 10.1182/blood-2007-06-096222. [DOI] [PubMed] [Google Scholar]
- 41.Nencioni A, Grünebach F, Zobywlaski A, Denzlinger C, Brugger W, and Brossart P (2002). Dendritic cell immunogenicity is regulated by peroxisome proliferator-activated receptor gamma. J Immunol 169, 1228–1235. 10.4049/jimmunol.169.3.1228. [DOI] [PubMed] [Google Scholar]
- 42.Adamik J, Munson PV, Hartmann FJ, Combes AJ, Pierre P, Krummel MF, Bendall SC, Argüello RJ, and Butterfield LH (2022). Distinct metabolic states guide maturation of inflammatory and tolerogenic dendritic cells. Nat Commun 13, 5184. 10.1038/s41467-022-32849-1. [DOI] [PMC free article] [PubMed] [Google Scholar]
- 43.Diniz SQ, Teixeira-Carvalho A, Figueiredo MM, Costa PAC, Rocha BC, Martins-Filho OA, Gonçalves R, Pereira DB, Tada MS, Oliveira F, et al. (2021). Plasmodium vivax Infection Alters Mitochondrial Metabolism in Human Monocytes. mBio 12, e0124721. 10.1128/mBio.01247-21. [DOI] [PMC free article] [PubMed] [Google Scholar]
- 44.Dos Santos LI, Torres TA, Diniz SQ, Gonçalves R, Caballero-Flores G, Núñez G, Gazzinelli RT, Maloy KJ, and Ribeiro do V Antonelli, L. (2021). Disrupted Iron Metabolism and Mortality during Co-infection with Malaria and an Intestinal Gram-Negative Extracellular Pathogen. Cell Rep 34, 108613. 10.1016/j.celrep.2020.108613. [DOI] [PMC free article] [PubMed] [Google Scholar]
- 45.Costa PAC, Leoratti FMS, Figueiredo MM, Tada MS, Pereira DB, Junqueira C, Soares IS, Barber DL, Gazzinelli RT, and Antonelli LRV (2015). Induction of Inhibitory Receptors on T Cells During Plasmodium vivax Malaria Impairs Cytokine Production. J Infect Dis 212, 1999–2010. 10.1093/infdis/jiv306. [DOI] [PMC free article] [PubMed] [Google Scholar]
- 46.Wykes MN, and Good MF (2008). What really happens to dendritic cells during malaria? Nat Rev Microbiol 6, 864–870. 10.1038/nrmicro1988. [DOI] [PubMed] [Google Scholar]
- 47.Luan HH, and Medzhitov R (2016). Food Fight: Role of Itaconate and Other Metabolites in Antimicrobial Defense. Cell Metab 24, 379–387. 10.1016/j.cmet.2016.08.013. [DOI] [PMC free article] [PubMed] [Google Scholar]
- 48.Olszewski KL, Mather MW, Morrisey JM, Garcia BA, Vaidya AB, Rabinowitz JD, and Llinás M (2013). Retraction: Branched tricarboxylic acid metabolism in Plasmodium falciparum. Nature 497, 652. 10.1038/nature12164. [DOI] [PMC free article] [PubMed] [Google Scholar]
- 49.Sun Q, Hu T, Zhang Y, Wang X, Liu J, Chen W, Wei C, Liu D, Wu W, Lan T, et al. (2022). IRG1/itaconate increases IL-10 release to alleviate mechanical and thermal hypersensitivity in mice after nerve injury. Front Immunol 13, 1012442. 10.3389/fimmu.2022.1012442. [DOI] [PMC free article] [PubMed] [Google Scholar]
- 50.Hooftman A, Angiari S, Hester S, Corcoran SE, Runtsch MC, Ling C, Ruzek MC, Slivka PF, McGettrick AF, Banahan K, et al. (2020). The Immunomodulatory Metabolite Itaconate Modifies NLRP3 and Inhibits Inflammasome Activation. Cell Metab 32, 468–478.e7. 10.1016/j.cmet.2020.07.016. [DOI] [PMC free article] [PubMed] [Google Scholar]
- 51.Bambouskova M, Potuckova L, Paulenda T, Kerndl M, Mogilenko DA, Lizotte K, Swain A, Hayes S, Sheldon RD, Kim H, et al. (2021). Itaconate confers tolerance to late NLRP3 inflammasome activation. Cell Reports 34, 108756. 10.1016/j.celrep.2021.108756. [DOI] [PMC free article] [PubMed] [Google Scholar]
- 52.Runtsch MC, Angiari S, Hooftman A, Wadhwa R, Zhang Y, Zheng Y, Spina JS, Ruzek MC, Argiriadi MA, McGettrick AF, et al. (2022). Itaconate and itaconate derivatives target JAK1 to suppress alternative activation of macrophages. Cell Metab 34, 487–501.e8. 10.1016/j.cmet.2022.02.002. [DOI] [PubMed] [Google Scholar]
- 53.Schindler C, Levy DE, and Decker T (2007). JAK-STAT signaling: from interferons to cytokines. J Biol Chem 282, 20059–20063. 10.1074/jbc.R700016200. [DOI] [PubMed] [Google Scholar]
- 54.Edwards CL, Best SE, Gun SY, Claser C, James KR, de Oca MM, Sebina I, Rivera F. de L., Amante FH, Hertzog PJ, et al. (2015). Spatiotemporal requirements for IRF7 in mediating type I IFN-dependent susceptibility to blood-stage Plasmodium infection. Eur J Immunol 45, 130–141. 10.1002/eji.201444824. [DOI] [PubMed] [Google Scholar]
- 55.Wu J, Tian L, Yu X, Pattaradilokrat S, Li J, Wang M, Yu W, Qi Y, Zeituni AE, Nair SC, et al. (2014). Strain-specific innate immune signaling pathways determine malaria parasitemia dynamics and host mortality. Proc Natl Acad Sci U S A 111, E511–520. 10.1073/pnas.1316467111. [DOI] [PMC free article] [PubMed] [Google Scholar]
- 56.He X, Xia L, Tumas KC, Wu J, and Su X-Z (2020). Type I Interferons and Malaria: A Double-Edge Sword Against a Complex Parasitic Disease. Front Cell Infect Microbiol 10, 594621. 10.3389/fcimb.2020.594621. [DOI] [PMC free article] [PubMed] [Google Scholar]
- 57.Yu X, Cai B, Wang M, Tan P, Ding X, Wu J, Li J, Li Q, Liu P, Xing C, et al. (2016). Cross-Regulation of Two Type I Interferon Signaling Pathways in Plasmacytoid Dendritic Cells Controls Anti-malaria Immunity and Host Mortality. Immunity 45, 1093–1107. 10.1016/j.immuni.2016.10.001. [DOI] [PMC free article] [PubMed] [Google Scholar]
- 58.Crabtree JN, Caffrey DR, de Souza Silva L, Kurt-Jones EA, Dobbs K, Dent A, Fitzgerald KA, and Golenbock DT (2022). Lymphocyte crosstalk is required for monocyte-intrinsic trained immunity to Plasmodium falciparum. J Clin Invest 132, e139298. 10.1172/JCI139298. [DOI] [PMC free article] [PubMed] [Google Scholar]
- 59.Zecchini V, Paupe V, Herranz-Montoya I, Janssen J, Wortel IMN, Morris JL, Ferguson A, Chowdury SR, Segarra-Mondejar M, Costa ASH, et al. (2023). Fumarate induces vesicular release of mtDNA to drive innate immunity. Nature 615, 499–506. 10.1038/s41586-023-05770-w. [DOI] [PMC free article] [PubMed] [Google Scholar]
- 60.Sprenger H-G, MacVicar T, Bahat A, Fiedler KU, Hermans S, Ehrentraut D, Ried K, Milenkovic D, Bonekamp N, Larsson N-G, et al. (2021). Cellular pyrimidine imbalance triggers mitochondrial DNA-dependent innate immunity. Nat Metab 3, 636–650. 10.1038/s42255-021-00385-9. [DOI] [PMC free article] [PubMed] [Google Scholar]
- 61.Butler NS, Moebius J, Pewe LL, Traore B, Doumbo OK, Tygrett LT, Waldschmidt TJ, Crompton PD, and Harty JT (2011). Therapeutic blockade of PD-L1 and LAG-3 rapidly clears established blood-stage Plasmodium infection. Nat Immunol 13, 188–195. 10.1038/ni.2180. [DOI] [PMC free article] [PubMed] [Google Scholar]
- 62.Jaiswal AK, Yadav J, Makhija S, Mazumder S, Mitra AK, Suryawanshi A, Sandey M, and Mishra A (2022). Irg1/itaconate metabolic pathway is a crucial determinant of dendritic cells immune-priming function and contributes to resolute allergen-induced airway inflammation. Mucosal Immunol 15, 301–313. 10.1038/s41385-021-00462-y. [DOI] [PMC free article] [PubMed] [Google Scholar]
- 63.Zhao H, Teng D, Yang L, Xu X, Chen J, Jiang T, Feng AY, Zhang Y, Frederick DT, Gu L, et al. (2022). Myeloid-derived itaconate suppresses cytotoxic CD8+ T cells and promotes tumour growth. Nat Metab 4, 1660–1673. 10.1038/s42255-022-00676-9. [DOI] [PMC free article] [PubMed] [Google Scholar]
- 64.Chen Y-J, Li G-N, Li X-J, Wei L-X, Fu M-J, Cheng Z-L, Yang Z, Zhu G-Q, Wang X-D, Zhang C, et al. (2023). Targeting IRG1 reverses the immunosuppressive function of tumor-associated macrophages and enhances cancer immunotherapy. Sci Adv 9, eadg0654. 10.1126/sciadv.adg0654. [DOI] [PMC free article] [PubMed] [Google Scholar]
- 65.Roberts LM, Leighton I, Schwarz B, Wehrly TD, Evans TJ, and Bosio CM (2022). Itaconate indirectly influences expansion of effector T cells following vaccination with Francisella tularensis live vaccine strain. Cell Immunol 373, 104485. 10.1016/j.cellimm.2022.104485. [DOI] [PubMed] [Google Scholar]
- 66.Sohail A, Iqbal AA, Sahini N, Chen F, Tantawy M, Waqas SFH, Winterhoff M, Ebensen T, Schultz K, Geffers R, et al. (2022). Itaconate and derivatives reduce interferon responses and inflammation in influenza A virus infection. PLoS Pathog 18, e1010219. 10.1371/journal.ppat.1010219. [DOI] [PMC free article] [PubMed] [Google Scholar]
- 67.Gazzinelli RT, Kalantari P, Fitzgerald KA, and Golenbock DT (2014). Innate sensing of malaria parasites. Nat Rev Immunol 14, 744–757. 10.1038/nri3742. [DOI] [PubMed] [Google Scholar]
- 68.Hojo-Souza NS, de Azevedo PO, de Castro JT, Teixeira-Carvalho A, Lieberman J, Junqueira C, and Gazzinelli RT (2020). Contributions of IFN-γ and granulysin to the clearance of Plasmodium yoelii blood stage. PLoS Pathog 16, e1008840. 10.1371/journal.ppat.1008840. [DOI] [PMC free article] [PubMed] [Google Scholar]
- 69.Junqueira C, Barbosa CRR, Costa PAC, Teixeira-Carvalho A, Castro G, Sen Santara S, Barbosa RP, Dotiwala F, Pereira DB, Antonelli LR, et al. (2018). Cytotoxic CD8+ T cells recognize and kill Plasmodium vivax-infected reticulocytes. Nat Med 24, 1330–1336. 10.1038/s41591-018-0117-4. [DOI] [PMC free article] [PubMed] [Google Scholar]
- 70.Riggle BA, Manglani M, Maric D, Johnson KR, Lee M-H, Neto OLA, Taylor TE, Seydel KB, Nath A, Miller LH, et al. (2020). CD8+ T cells target cerebrovasculature in children with cerebral malaria. J Clin Invest 130, 1128–1138. 10.1172/JCI133474. [DOI] [PMC free article] [PubMed] [Google Scholar]
- 71.Belnoue E, Kayibanda M, Vigario AM, Deschemin J-C, van Rooijen N, Viguier M, Snounou G, and Rénia L (2002). On the pathogenic role of brain-sequestered alphabeta CD8+ T cells in experimental cerebral malaria. J Immunol 169, 6369–6375. 10.4049/jimmunol.169.11.6369. [DOI] [PubMed] [Google Scholar]
Associated Data
This section collects any data citations, data availability statements, or supplementary materials included in this article.
Supplementary Materials
Data S1. Unprocessed data underlying the display items in the manuscript, related to Figures 1 to 7, and supplementary figures 1 to 6.
Supplementary table 4. Lipidome data in splenic MODCs isolated from P. chabaudi-infected mice compared to monocytes from non-infected mice. Related to figure 3 (A).
Data Availability Statement
The metabolome and lipidome in splenic MODCs from Pc-infecetd mice generated in this study can be accessed on zenodo.org with the code # 7608255. Metabolomics data from the plasma of C57BL/6 mice infected with P. chabaudi were retrieved from the Metabolomics Workbench database under accession ID ST001775. Metabolomics data from the plasma of human volunteers experimentally infected with P. vivax were acquired from the MetaboLights repository under accession ID MTBLS665. The RNAseq in monocytes from individuals infected with P. vivax can be found on zenodo.org with the code #7683361. The RNAseq in splenic MODCs from P. beghei Anka can be obtained on GEO with the code GSE126381, platform GPL19057. RNAseq in monocytes isolated from children, which were later stimulated with P. falciparum-infected with red blood cells (iRBC) in vitro is GSE151116. RNAseq in monocytes isolated from children during acute and convalescence phase of malaria caused by P. falciparum is GSE154317. RNAseq in effector memory CD4+ T cells sorted from adult volunteers experimentally infected with P. falciparum before infection (baseline) and 6 days after drug treatment is GSE174791. Uncropped scans of all western blots and all raw data used to generate graphs are included in Data S1. Further information and requests for resources and reagents should be directed to the corresponding authors.