

Summary
The classic view of the lysosome as a static recycling center has been replaced with one of a dynamic and mobile hub of metabolic regulation. This revised view raises new questions about how dysfunction of this organelle causes pathology in inherited lysosomal disorders. Here we provide evidence for increased lysosomal exocytosis in the developing cartilage of three lysosomal disease zebrafish models with distinct etiologies. Dysregulated exocytosis was linked to altered cartilage development, increased activity of multiple cathepsin proteases, and cathepsin- and TGFβ-mediated pathogenesis in these models. Moreover, inhibition of cathepsin activity or direct blockade of exocytosis with small molecule modulators improved the cartilage phenotypes, reinforcing a connection between excessive extracellular protease activity and cartilage pathogenesis. This study highlights the pathogenic consequences in early cartilage development arising from uncontrolled release of lysosomal enzymes via exocytosis, and suggests that pharmacological enhancement of this process could be detrimental during tissue development.
Subject areas: Cell biology, Developmental biology, Molecular biology
Graphical abstract
Highlights
-
•
Loss of neuraminidase 1 increases lysosomal exocytosis in neu1-deficient zebrafish chondrocytes
-
•
Lysosomal exocytosis expels cathepsins outside cells, increasing their activity
-
•
Increased extracellular cathepsin activity disrupts TGFβ signaling and chondrogenesis
-
•
Inhibiting cathepsin or exocytosis improved phenotypes in neu1-deficient cartilage
Cell biology; Developmental biology; Molecular biology
Introduction
With the identification and characterization of numerous metabolic and homeostatic signaling pathways that localize to lysosomes, the long-standing view of this organelle as a static hub for degradation has been revised in recent years. It has been replaced with a broader view of the lysosome as a dynamic and highly mobile compartment that integrates cellular metabolism with changes in nutrient flux.1,2,3 This revised view has ignited a renewed interest in defining how genetic and pharmacological disruption of lysosomal function impacts cellular homeostasis and tissue development. The need to fully understand how lysosomal function impacts tissue development is underscored by the number of proposed therapies that target this organelle. Efforts to understand the impact of lysosomal function on tissue development have been aided by several cell and animal models of lysosomal storage disorders (LSDs) now available to investigate pathophysiology. As the mechanisms driving clinical features in these diseases continue to be uncovered, the view of lysosome as more than an endpoint compartment for the turnover of macromolecules is reinforced. Work over the last decade has revealed pathogenic processes that extend beyond intralysosomal storage, including mechanisms involving other organelles like mitochondria or disruptions in the associated pathways of oxidative stress, autophagy, inflammation, and growth factor signaling.4,5
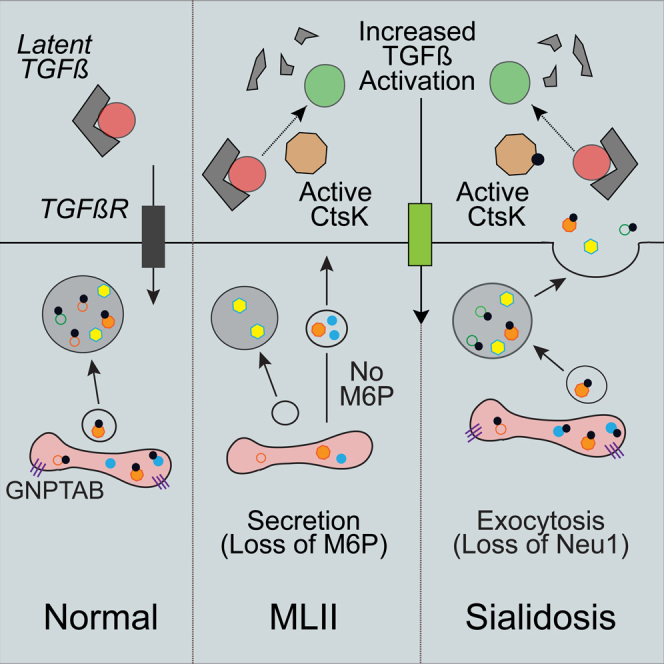
In the severe genetic disorder, mucolipidosis II (MLII), lysosomal storage arises from defects in the carbohydrate-dependent, mannose-6-phosphate (M6P) targeting pathway.6,7,8,9 Failure to generate M6P residues on the N-glycans of soluble acid hydrolases impairs their trafficking to the lysosome. In MLII, the untagged hydrolases are still made and folded but many are mislocalized outside the cell. Despite the more neutral pH in the extracellular space several enzymes, including the cathepsin proteases, retain partial activity and can act on multiple substrates.10,11 Previous studies in MLII zebrafish showed that mislocalizing cathepsin proteases outside cells increases in their activity and disrupts the balance of growth factor signals that regulate tissue development, establishing a pathogenic mechanism distinct from the impact of lysosomal storage.11,12
Acid hydrolases can be released from the cell by additional carbohydrate-dependent and independent mechanisms, including the regulated release of lysosomal contents by lysosomal exocytosis. Regulated exocytosis is essential for the normal development and function of tissues like bone and cartilage.13,14,15,16 This process, mediated via the fusion of lysosomes with the plasma membrane, remains poorly understood in the context of cartilage development. Excessive lysosomal exocytosis has however been linked to the pathogenesis of multiple LSDs, including sialidosis.13,17 In sialidosis, defects in the lysosomal neuraminidase Neu1 cause lysosomes to fuse with plasma membrane in a LAMP1-mediated process. This enhanced lysosomal exocytosis has been connected to the disruption of numerous physiological processes, including muscle regeneration.17,18 The extent to which exocytosis is increased in other LSDs and its contribution to pathology is not fully appreciated, and our understanding of how dysregulated exocytosis can impact tissue development remains limited.
Using zebrafish models for three LSDs with skeletal abnormalities (MLII, sialidosis, and MPSIVA), we addressed whether increased lysosomal exocytosis disrupts chondrogenesis in developing animals. Surprisingly, we found evidence of increased lysosomal exocytosis in the chondrocytes of all three models that correlated with distinct pathologies, indicating that mechanisms that enhance exocytosis can arise from different genetic causes of lysosomal dysfunction. The increase in lysosomal exocytosis was most striking in the MLII and sialidosis zebrafish. In those models, abnormal cartilage development could be attributed to cathepsin-mediated alterations in TGFβ signaling that occur when the cathepsin proteases are mislocalized outside the cell. Inhibiting exocytosis improved the cellular and molecular phenotypes in the cartilage of each model, reinforcing the connection between dysregulated exocytosis and pathogenesis. The implications of these findings with regard to cartilage development, LSD pathogenesis and the use of therapies aimed at enhancing exocytosis are discussed.
Results
Reduced expression of neu1 alters craniofacial cartilage development
To address how lysosomal dysfunction can impact cartilage development, we first asked how inhibiting expression of neu1 in developing zebrafish alters craniofacial morphology. Antisense morpholinos targeting the 5′ splice junction of exon 2 (Figure 1A) were injected at the one-cell stage and neu1 transcripts analyzed by RT-PCR. Analyses of animals 2–4 dpf showed that 0.3 μM morpholino generates two novel transcripts (Figure 1B), one in which a 321 bp deletion removes all of exon 2 and part of exon 3 but maintains frame and another where a 190 bp deletion introduces a premature stop codon causing a shift in frame (Figure 1C). Appearance of these abnormal transcripts was associated with a substantial reduction in the level of wild-type (WT) neu1 transcript. Western blots of control and neu1 morphants show Neu1 protein levels were also significantly lower 2–5 dpf (Figures 1D, 1E and S1A), which reduced the total acidic neuraminidase activity up to 84% (Figure 1F). This was the maximal level of reduction achievable by morpholino injection. Notably, neutral neuraminidase activity was also significantly reduced in neu1 morphants 5 dpf (78%, Figure S1B). Western blots do show a small amount of residual Neu1 enzyme, likely explaining the residual acidic neuraminidase activity. However, since even higher doses of morpholino do not fully eliminate Neu1 or neuraminidase activity, we suspect the residual protein detected may be maternally derived. Alternatively, the residual acidic activity detected could stem from one of the other neuraminidases (neu3.1-neu13.5 and neu4) expressed in zebrafish, with Neu4 the most likely candidate due to its demonstrated presence in the lysosome.19,20,21 Neu3 localization is more variable, with multiple studies suggesting it predominantly resides in the caveoli of endosomal and plasma membranes.22,23,24
Figure 1.

Loss of Neu1 disrupts development of craniofacial cartilage
(A) Schematic of neu1 gene indicates position of the splice blocking morpholino (red bar, MO) and position of the primers used to amplify splice products.
(B) RT-PCR of neu1 amplicons from 2 to 4 dpf showing the: (1) wild type product and (2 and 3) two alternate splice products resulting from morpholino inhibition.
(C) Sequence analyses of gel isolated splice products show 2 novel transcripts resulting from the splice blocking morpholino, one of which introduces an in frame non-sense codon.
(D and E) Western blot analyses show the morpholino significantly reduces Neu1 protein levels 2–5 dpf. n = 3 biological replicates with samples of 15 larvae per genotype. Error = SEM. Student’s t test, ∗p < 0.05 ∗∗p < 0.01.
(F) Analyses of acidic neuraminidase levels in 5 dpf embryonic lysates show activity is reduced ∼84%. n = 3 biological replicates with 15 larvae per sample per genotype. Error = SEM. Student’s t test, ∗∗∗∗p < 0.0001.
(G) Alcian blue stains of 5 dpf animals show loss of Neu1 disrupts craniofacial cartilage formation similar to loss of gnptab. Percent values indicate the number of scored embryos exhibiting pictured phenotype. Scale bar: 20 μm.
(H) Schematic indicate structures measured (M, Meckel’s cartilage length; CH, ceratohyal length; CH°, ceratohyal angle). Graphs compare measurements from wild type, neu1, and gnptab deficient animals. n = 15–20 embryos per genotype from 3 independent experiments. Error = SEM. Dunnet’s t test, ∗∗p < 0.01, ∗∗∗∗p < 0.0001.
(I) Confocal images of gnptab and neu1 morphants show abnormal chondrocyte shape and organization. Scale bar: 10 μm.
(J) Quantitation of chondrocyte intercalation or stacking and (K) cell shape. Error = SEM. Dunnet’s t test, ∗∗∗∗p < 0.0001.
(L) Schematic illustrating two potential open reading frames (ORF), with ORF1 disrupted using the crisper guide shown and ORF1 and potential ORF2 both disrupted using two TALEN pairs shown.
(M) Alcian blue stain of wild type and neu1ggc10d/ggc10d CRISPR generated mutant show eliminating ORF1 reduced size but causes minimal morphological alterations. Percent values indicate the number of scored animals exhibiting pictured phenotype (see also Figure S1).
Consistent with the fact that coarse facial features and dysostosis multiplex are associated with sialidosis,25 Alcian blue staining of larvae 5 dpf showed that reducing neu1 expression impairs craniofacial cartilage development. Morphant cartilages were dysmorphic with the Meckel’s and ceratohyal structures measuring 40–50% smaller than WT structures (Figures 1G and 1H). The ceratohyal cartilage of neu1 morphants was also consistently inverted such that its measured angle was greater than 180° compared to the 90° angle typical of controls (Figure 1H). The impact of neu1 deficiency on developing cartilage was reminiscent of another LSD, MLII, where reduced gnptab expression is also associated with smaller misshapen cartilages (Figures 1G and 1H).10,26 Like MLII, loss of neu1 also altered chondrocyte shape and organization (Figures 1I–1K). Confocal analyses of fli1a:EGFP-labeled cartilages show unlike WT chondrocytes, which by 5 dpf have elongated and intercalated to form a single row of cells, both gnptab and neu1-deficient cells are round and disorganized.11,26,27 The validity of each of these phenotypes was confirmed in both models using a second morpholino (see key resources table). Morpholino induced effects were also controlled for using a sequence randomized control morpholino (see STAR Methods for details). Unless otherwise stated, control data represent control injected animals. Despite differences in etiology, the similarity of phenotypes between gnptab-deficient and neu1-deficient larvae raises the possibility that certain pathogenic mechanisms are shared between sialidosis and MLII.
neu1 F0 knockout larvae also exhibit craniofacial anomalies
A recent study by Okada et al. (2020) described later stage bone and cartilage phenotypes in CRISPR-generated neu1 mutants. However, this study did not address whether loss of neu1 affected early aspects of cartilage development.28 Therefore, to ask whether early cartilage development was also altered in a neu1 genetic mutant, we used the CRISPR-Cas9 system to generate a similar neu1 mutant with a guide RNA (gRNA) targeting the same region of exon 1 (Figure 1L). Surprisingly, neu1 mutant larvae (neu1ggc10d) carrying a comparable 10 bp frame shifting deletion in exon 1 were smaller, but did not show any obvious craniofacial cartilage abnormalities 5–7 dpf (Figure 1M, 5 dpf shown and Figure S1C). Of note, acidic sialidase activity was only reduced 14%, and the neutral activity was increased 46% in neu1ggc10d 5dpf homozygous mutants (Figures S1D and S1E). Parallel qPCR analyses of the neu3 and neu4 neuraminidases do indicate each transcript is variably, but not significantly, increased in the mutant (and also morphant) larvae 5 dpf (Figures S1F and S1G). Given this observation, and the fact that neu4 localizes to lysosomes, we asked whether increased Neu4 activity could account for the high degree of residual activity. Morpholino-based reduction of neu4 expression did not, however, further reduce sialidase activity or cause craniofacial phenotypes in neu1 mutants (Figures S1H–S1J). These data suggest increased neu4 expression likely does not compensate for loss of neu1, but we cannot rule out the possibility that it partially contributes to lack of phenotypic onset.
Due to the presence of another potential open reading frame (ORF) containing the entire catalytic domain that initiates in exon 2, we hypothesized that the neu1ggc10d/ggc10d homozygous mutants might express a smaller form of Neu1 that retains partial enzymatic activity. RT-PCR analyses of the neu1ggc10d/ggc10d mutants showed reduced abundance of the longer amplicon (primed from exon 1 to exon 5) in WT animals which was matched by increased abundance of a smaller amplification product (primed from exon 2 to exon 5) that includes this alternate ORF (Figure S1K). This alone does not indicate the presence of another transcript, but given the residual activity reported by Okada et al., these data support the possibility that both our neu1ggc10d mutant and the previously reported CRISPR generated mutant (zf3377) are Neu1 hypomorphs and not nulls. To ask if inducing an indel in a region predicted to eliminate all potential neu1 transcripts does cause craniofacial defects, we created two TALEN pairs targeting exon 2. The region targeted was expected to abolish both potential ORFs encompassing the catalytic domain. As was seen in the neu1 morphants, Alcian blue analyses of F0 larvae injected with either of the exon 2 targeting TALEN pairs exhibit dysmorphic craniofacial cartilages. Of the 93 F0 larvae analyzed, 46% showed craniofacial abnormalities similar to neu1 morphants 5 dpf (Figures S1L and S1M). Unlike the neu1ggc10d CRISPR-generated mutant, acidic sialidase activity was reduced 44% in the mosaic F0 TALEN-targeted larvae (Figure S1N). To explore whether this alternate ORF could account for the differences in activity or alternatively if compensatory mechanisms that develop over multiple generations affect sialidase activity, we also measured the sialidase activity in F0 mosaic mutants created by combining three different CRISPR guides targeting multiple regions of neu1. Sialidase activity was only reduced 24% in these CRISPR generated F0 mutants. Although both F0 approaches are expected to target all potential reading frames, the reduction in sialidase activity from CRISPR generated mutants is nearly 2-fold less than the reduction achieved with the TALENs (Figure S1O). Like the neu1ggc10d mutants, F0 CRISPR mutants were slightly smaller than their WT siblings but did not exhibit craniofacial abnormalities (Figure S1P). Together with findings in the neu1 morphants (which lack both of these transcripts), these data support the possibility that more substantially reducing Neu1 expression does disrupt early aspects of craniofacial chondrogenesis. This is consistent with the observation that complete loss of neu1 in both humans and mice causes severe phenotypes, many of which manifest neonatally and, depending on the specific mouse model considered, are lethal.25 We still cannot rule out the possibility that compensation by another unidentified molecular pathway compensates for loss of Neu1 in the neu1ggc10d animals. The likelihood that differences in phenotype stem from the level of residual Neu1 activity is further supported by the fact that morphant larvae with lower levels of neu1 knockdown and higher residual sialidase activity also do not exhibit craniofacial defects (Figures S1Q and S1R), with early craniofacial phenotypes only noted in animals with less than 45–50% sialidase activity. While our data support the possibility that a smaller form of Neu1 contributes enough residual activity to prevent early phenotypes, definitively proving the alternate ORF produces a semi-functional protein would require additional expression studies.
Lysosomal exocytosis is increased in the cartilage of neu1 and gnptab deficient larvae
Studies in Neu1 knockout mice demonstrated that loss of this neuraminidase causes the lysosomal integral membrane protein Lamp1 to become hypersialylated.13 Hypersialylation increases the half-life of LAMP1, in turn promoting exocytosis of the pool of lysosomes proximal to the membrane. To ask if Lamp1 abundance and lysosomal exocytosis are also increased during development in neu1 deficient cartilage, we utilized a transgenic line that expresses a LAMP1-mCherry fusion protein under the control of a heat shock promoter (Figure 2A).29 WT and morphant transgenic zebrafish were heat shocked at 3 dpf and harvested 0.5–24 h post-shock (hps). Western blot analyses of Lamp1-mCherry show that although the same amount of protein is initially produced, by 3 hps Lamp1 abundance is substantially increased in neu1 morphants (Figures 2B, 2C, and S2A). qRT-PCR analyses indicate this increase does not stem from differences in transcript abundance of the Lamp1-mCherry transgene (Figure S2B). Based on these data and previous studies in cells,13 increased abundance of Lamp1 in neu1 deficient animals is consistent with its increased stability. However, without directly measuring Lamp1 half-life using cycloheximide treatment, we cannot rule out other explanations for the increase in Lamp1 abundance.
Figure 2.

Lysosomal exocytosis is increased in cartilage of multiple models of lysosomal storage
(A) Schematic of heat shock inducible Lamp1 protein and experimental procedure to assay Lamp1 abundance and subcellular localization.
(B) Western blots probed for Lamp1 transgene in heat shocked animals suggest Lamp1 abundance is altered when neu1, gnptab, or galns expression is reduced, but not in those injected with a control morpholino (rc, random control).
(C–F) Graphs quantitating the protein abundance of Lamp1-mCherry transgene in larvae harvested at various times post-heat shock. The level present at each time point is normalized to the amount of Lamp1 present 0.5 h post heat shock. n = 3 biological replicates of samples containing 10 larvae per genotype per time point. Error = SEM, Student’s t test ∗p < 0.05, ∗∗p < 0.01, ∗∗∗p < 0.001.
(G) Live confocal images of Lamp1-mCherry (red) in fli1a:EGFP (green) positive chondrocytes show increased cell surface abundance indicating increased exocytosis in neu1, gnptab, and galns deficient animals. Images performed 8–10 h post-heat shock. Boxed regions, yellow asterisks. Scale bar: 10 μm.
(H) The number of cells with high or moderate levels of Lamp1 (relative to total number of chondrocytes) was scored for each genotype. n = 10 larvae imaged and scored per genotype. See also Figure S2. Error = SEM, Student’s t test ∗∗∗p < 0.001 or Dunnet’s t test ∗∗p < 0.01, ∗∗∗p < 0.001.
Since Neu1 uses the gnptab-dependent mannose-6-phosphate pathway to traffic to the lysosome, we predicted that reducing the level of mannose-6-phosphate on the N-linked glycans of the enzyme would cause it to be hypersecreted outside MLII cells. Without lysosomal Neu1, Lamp1 is expected to also be hypersialylated and exocytosis increased in gnptab-deficient MLII larvae. To test this possibility gnptab expression was inhibited in the Lamp1-mCherry transgenic line. As an added control we also examined whether inhibiting galns (N-acetylgalactosamine-6-sulfatase) impacted lysosomal exocytosis. Galns encodes a GAG-degrading lysosomal enzyme whose loss is also associated with bone and cartilage defects. Although Galns has been shown to occasionally interact with the Neu1 enzyme complex, its loss was not expected to affect Lamp1 abundance or lysosomal exocytosis.30,31,32 For these experiments gnptab was knocked down as previously described26 and galns expression reduced by injecting 0.26 μM of a morpholino targeting the 5′ junction of exon 1 and intron 1 (Figure S2C). Western blot analyses show Lamp1 abundance is indeed significantly increased in gnptab deficient animals (Figures 2B–2D and S2D). Like shown for neu1-deficient animals, no significant differences in transcript abundance of the Lamp1-mCherry transgene were noted in gnptab morphants following heat shock (Figure S2E). Unexpectedly, we also detected a small but significant increase in Lamp1 abundance in galns deficient animals (Figures 2B–2E and S2F). Importantly, no increase was detected when a random control morpholino was injected into the Lamp1-mCherry transgenic line (Figures 2B–2F and S2G). Live confocal analyses of fli1a:EGFP positive cartilages expressing the Lamp1-mCherry transgene confirm that the increase in Lamp1 corresponds with its enhanced presence on the surface of neu1 and gnptab deficient chondrocytes (Figures 2G and 2H). Quantitation of the number of cells exhibiting a high versus moderate level of cell surface Lamp1 suggest exocytosis is substantially increased in both the neu1 and gnptab deficient chondrocytes (Figure 2H), with lower levels evident in galns deficient cartilage.
In cells exocytosis is often also analyzed by measuring the level of extracellular lysosomal enzymes, but isolating extracellular pools of enzyme from larvae is not experimentally feasible. Therefore, as an additional measure of exocytosis control and neu1 morphant cartilage sections were stained with the BMV019 activity-based probe (ABP) (Figure S2H). BMV109, whose efficacy was previously validated in developing zebrafish,12 contains a Cy5 moiety whose fluorescence is quenched until the probe binds an active cysteine cathepsin.33,34 BMV109 covalently binds active protease, providing a stable means to either biochemically or visually monitor multiple cathepsins. The location of active cathepsin proteases was assayed confocally using fli1a:EGFP to label the intracellular compartment (Figure S2H). Intense BMV109 staining that primarily overlapped with intracellular GFP was noted in WT chondrocytes. In contrast, lower levels of BMV109 staining were noted in the majority of neu1 deficient chondrocytes, with several cells also exhibiting pericellular BMV109 staining. The reduction in intracellular BMV109 reactivity combined with the observed pericellular localization is consistent with enhanced lysosomal exocytosis releasing these enzymes outside chondrocytes (Figure S2H, white arrows). Taken together the biochemical and microscopic data support the likelihood that exocytosis is substantially increased in both neu1-deficient and gnptab-deficient larvae, and to a lesser degree in galns deficient animals. The extracellular location of lysosomal enzymes in gnptab morphants was previously demonstrated.11,12
Loss of M6P was previously shown in cultured cells to cause Neu1 and its chaperone protective protein cathepsin A (PPCA) to be secreted outside the cell.35 To address in MLII larvae whether the high level of exocytosis correlates with a reduction in lysosome-localized Neu1, we asked if Neu1 is also secreted from gnptab-deficient cells in vivo. The amount of Neu1 protein present in whole WT or gnptab-deficient larvae was compared to the level present inside cells isolated from dissociated animals. If Neu1 is synthesized in gnptab-deficient cells but secreted, we would expect to see similar levels in whole animals with less present in isolated cell populations. Live fli1a:EGFP WT and gnptab morphant larvae were dissociated into single cells and the GFP-positive and -negative populations isolated using fluorescence-activated cell sorting (FACS) as previously described (Figure S2I).11 Western blot analyses showed that although whole gnptab morphants contain more Neu1 than WT animals, less was present inside both GFP-positive and negative cell populations isolated from gnptab-deficient cells (Figures S2I–S2L). Like previously shown for many lysosomal enzymes in GNPTAB-deficient cells, these data suggest least a portion of Neu1 is also secreted in MLII animals.12 MLII cells were not completely devoid of intracellular Neu1, but it is unclear if this stems from newly made enzyme that has not traversed the secretory pathway, or if some enzyme remains inside the cell but is not in the lysosome. Notably, it is also currently unclear to what degree increased Lamp1 abundance and enhanced exocytosis stem from Neu1 secretion, or whether other aspects of lysosomal dysfunction or compromised cellular health also contribute to this phenomenon. The likelihood that lysosomal dysfunction itself increases the occurrence of lysosomal exocytosis is supported by the finding that enhanced exocytosis was also noted in galns deficient cartilage.
neu1 and gnptab deficiency differentially affect activity of other enzymes in a multienzyme complex
The Neu1 sialidase functions as part of a lysosomal multienzyme complex (termed LMC) that includes the β-galactosidase and Neu1 enzymes, as well as PPCA (Figure 3A). Several reports have suggested the Galns (N-acetylgalactosamine-6-sulfatase) enzyme may also occasionally associate with the LMC.30,31,32 Therefore, to ask if the phenotypic and biochemical affects noted in neu1 deficient larvae stem primarily from a reduction in sialidase activity and increased lysosomal exocytosis, we determined whether Neu1 deficiency also affected the activity of other enzymes in this complex (Figures 3B–3E). As expected, inhibiting neu1 expression had the largest effect on sialidase activity, reducing it to ∼25% of control (Figures 3B and S3A). Ppca activity was also reduced 29% in neu1 morphants and although not significant up to 13% in mutants (Figures 3C and S3B). Given this, it is possible that differential effects on Ppca activity contribute to the differences in sialidase activity noted between morphants and mutants. β-Galactosidase activity was also partially reduced in the absence of Neu1, but Galns activity was unaffected (Figures 3D, 3E, S3C, and S3D). Similarly, loss of gnptab expression reduced sialidase activity but did not appreciably alter either β-galactosidase or Galns activity (Figures 3D, 3E, S3C, and S3D). The reduction in Neu1 activity was surprising in gnptab morphants, given the increased abundance noted on western blots of whole larvae and the fact that neu1 transcript abundance was slightly increased in gnptab-deficient animals (Figures S2I and S2J). Since Neu1 is likely less active in the pH of the extracellular environment, these data further suggest the enzyme is either secreted or mislocalized in gnptab-deficient animals. Unlike neu1 and gnptab, galns inhibition did not impact any of the tested enzymes other than Galns itself, which was reduced more than 50% (Figures 3B–3E and S3A–S3D).
Figure 3.

Enzymes in the lysosomal multienzyme complex (LMC) are differentially affected in the neu1, gnptab, and galns deficient larvae
(A) Schematic of the LMC complex and the diseases each enzyme deficiency causes.
(B) Acidic neuraminidase, (C) PPCA, (D) β-galactosidase, and (E) N-acetylgalactosamine 6-sulfatase in neu1, gnptab, and galns deficient animals. n = 3 independent experiments with samples of 15 larvae per genotype. Error = SEM, significance was assessed using the Dunnet’s test, where ∗p < 0.05, ∗∗p < 0.01, ∗∗∗p < 0.001, ∗∗∗∗p < 0.0001.
Enhanced exocytosis is associated with increased activity of multiple cathepsin proteases
Previous studies in gnptab mutant and morphant MLII zebrafish demonstrated that when the cathepsin proteases are inappropriately localized outside the cell their activity is significantly increased.11,12 In MLII, mislocalization occurs because the N-glycans present on the cathepsins lack the mannose-6-phosphate modification necessary to target them to the lysosome.10,12 Since lysosomal exocytosis also expels the lysosomal contents outside neu1-deficient chondrocytes, we hypothesized that cathepsin activity may be similarly increased in neu1 morphants. Given marked differences in the level of exocytosis and the severity of the cartilage phenotypes, analyses of cathepsin activity in galns-deficient animals will be presented elsewhere. The global activity of cysteine cathepsins was assayed by injecting the BMV109 ABP into the hearts of neu1 and gnptab larvae 3 dpf (Figure 4A). Gel analyses of larval lysates indicate that the activities of multiple cathepsin proteases are increased in neu1-deficient animals, consistent with prior observations in gnptab-deficient MLII animals. In particular, the activities of Ctsb, Ctsl, and Ctsk were increased relative to controls (Figures 4A, 4B, S3E, and S3F). Comparison with BMV109-labeled MLII larvae show that loss of either gnptab or neu1 significantly increases the activities of Ctsk and Ctsl, but the activity of Ctsb was specifically increased in neu1-deficient animals (Figures 4B, S3E, and S3F). qRT-PCR analyses confirm the noted increases in activity are not related to increased transcript abundance (Figure S3G). Transcript levels of ctsk and one isoform of ctsl were unaffected, with ctsl1a transcript abundance actually reduced in neu1 morphants (Figure S3G). These findings are consistent with previous studies, which show that CTSB is a natural substrate for NEU136 that is capable of processing TGFβ and increasing its signaling under normal and pathogenic conditions.37 Together with studies of BMV109 stained cartilages (see Figure S2H), which show neu1-deficient chondrocytes contain less intracellular cathepsin activity than control chondrocytes, these data support the likelihood that when cathepsin proteases are inappropriately expelled outside neu1-deficient chondrocytes their activity is increased. Since it is not currently clear to what degree the cathepsins are mislocalized in neu1 morphants nor how the specific composition of the extracellular matrix affects cathepsin activity, the broad impact of this phenomenon in other tissues and across other disorders warrants additional study.
Figure 4.

Increased cathepsin activity and altered TGFβ signaling are associated with enhanced exocytosis
(A) In gel analyses of embryos labeled with the BMV109 activity based probed show activity of several cysteine cathepsins is increased in both neu1 and gnptab deficient animals.
(B) Graph shows Ctsk activity is increased in both genotypes relative to wild type. See Figure S3 for Ctsl and Ctsb. Error = SEM, significance was assessed Dunnet’s test (red stars), where ∗p < 0.05, ∗∗p < 0.01.
(C) Confocal images of cartilage sections from fli1a:EGFP positive larvae immunohistochemically stained for pSmad2 (red) show TGFβ signaling is increased in neu1 and gnptab deficient chondrocytes. Percent values represent number of embryos exhibiting the pictured phenotype.
(D) Graph show percent of chondrocytes with nuclear pSmad2, indicative of transcriptional activity.
(E) Confocal images of 4dpf fli1a:EGFP positive cartilage sections stained for type 2 collagen (red) show increased abundance in neu1 and gnptab deficient cells.
(F) qRT-PCR analyses of col2a1 transcript abundance show it is increased in neu1 deficient animals. n = 3 biological replicates with samples of 10 larvae per genotype. SEM, significance was assessed using the Student’s t test where ∗p < 0.05, ∗∗p < 0.01.
(G) Alcian blue stains of neu1 larvae treated with 50 nM odanacatib show inhibiting Ctsk improves phenotypes in 77% of embryos analyzed. Percent values represent number of animals exhibiting the pictured phenotype. n = 25–30 embryos per condition.
(H and I) Graphs illustrate several parameters measured in odanacatib treated larvae. Error = SEM, significance was assessed using Dunnet’s test (red stars), where ∗∗∗p < 0.001, and ∗∗∗∗p < 0.0001.
(J) Confocal analyses of pSmad2 stained fli1a:EGFP positive cartilage sections after odanacatib treatment show inhibiting Ctsk reduces activation of TGFβ signaling.
(K) Graph of the number of chondrocytes with nuclear pSmad2. n = ∼20 larvae per condition. Error = SEM, significance was assessed using Dunnet’s test (red stars), where ∗∗∗∗p < 0.0001.
(L) Confocal images of sections from odanacatib treated animals stained for type 2 collagen. n = 25 larvae per condition from 2 to 3 biological replicates.
(M) qRT-PCR of col2a1 transcript abundance in odanacatib treated animals. n = 3–5 biological replicates with 10 animals per sample per condition. All scale bars on confocal images: 10 μm. Scale bar on Alcian blue: 20 μm. Error = SEM, significance was assessed using the either the Student’s t test (black stars), where ∗∗p < 0.01, ∗∗∗p < 0.001. See also Figure S3.
TGFß-related Smad signaling is increased in neu1 morphant cartilages
Studies in gnptab deficient larvae demonstrated that extracellular Ctsk activity disrupts the TGFβ-related growth factor pathways that control cartilage development.11,12 Disrupted growth factor signaling has also been demonstrated in Neu1 knockout mice, where increased TGFβ signaling was suggested to drive fibrosis in muscle.18 To ask if enhancing lysosomal exocytosis also disrupts TGFβ signaling in the cartilage of neu1 deficient animals, fli1a:EGFP positive cartilages were immunohistochemically stained for the active form of the TGFβ effector Smad2 (Figure 4C). Confocal analyses showed the level of phosphorylated Smad2 (pSmad2) was ∼2.5 higher in neu1 morphant chondrocytes, with nearly 80% of the cellular nuclei pSmad2-positive. This is similar to pSmad2 levels in gnptab morphants but significantly higher than control chondrocytes where only 30% of the nuclei were pSmad2-positive (Figure 4D).11 As noted in gnptab-deficient cells, increased activation of Smad2 in neu1-deficient chondrocytes was accompanied by increased expression of the TGFβ regulated matrix protein type II collagen. This was evident in confocal images of immunohistochemical stained cartilages and also by qPCR analyses of col2a1a transcript abundance (Figure 4E and 4F). Previous analyses of cartilage in odancatib treated WT animals show low level modulation of normally localized Ctsk has little effect on pSmad levels or type II collagen expression.11,12
Inhibiting cathepsin activity reduces TGFß activity and improves cartilage pathology
Using the Ctsk-specific inhibitor odanacatib, we asked if increased TGFβ signaling stems from abnormally high levels of Ctsk, which our data suggest is mislocalized outside neu1-deficient chondrocytes.11,12,38 A single 50 nM dose of odanacatib was introduced into the embryo media at 72 hpf and animals analyzed 24 h later. Alcian blue stains of treated and untreated neu1 morphants showed inhibiting Ctsk effectively restores multiple aspects of cartilage pathology in 77% of the larvae assayed (Figure 4G). Rescue was scored by measuring either the length or angle of articulation of the Meckel’s and ceratohyal cartilages (Figure 4H and 4I). Confocal analyses of immunohistochemically stained fli1a:EGFP positive animals further show odanacatib treatment decreases pSmad2 levels in neu1-deficient chondrocytes (Figure 4J and 4K) and this corresponds with a reduction in type II collagen (Figure 4L). qPCR analyses demonstrate that the reduction in type II collagen is further associated with decreased abundance of the col2a1a transcript (Figure 4M). In addition to restoring normal levels of TGFβ signaling, inhibiting Ctsk improved the shape and organization of neu1-deficient cells. By 4–5 dpf, chondrocytes typically become elongated and arranged in a single row (see Figure 1I). In 5dpf neu1-deficient larvae, however, the cells remain round and disorganized, a phenotype that was regionally improved following odanacatib treatment (Figures 4J and 4L). Short term odanacatib treatment of WT animals had been previously shown to have little effect on any of these parameters.11
Global analyses of cysteine cathepsin activity using the BMV109 ABP indicated that the activities of Ctsb, Ctsl, and Ctsk were all increased in neu1-deficient larvae (see Figure 4A). Since the pan-reactive cysteine cathepsin inhibitor E64d (also known as aloxistatin) inhibits all 3 enzymes, we asked whether broadly inhibiting cathepsins with E64d similarly ameliorated the cartilage phenotypes in either neu1 or gnptab morphants. For this, animals were treated at 72 hpf with a single dose of either 25 nM or 50 nM E64d and cartilage morphology analyzed 24 h later by Alcian blue staining (Figure 5A). Rescue was assessed as previously described for odanacatib treatment. Like Ctsk-specific inhibition, broadly inhibiting cathepsin activity also ameliorated multiple cartilage phenotypes at both doses tested, with the 50 nM dose performing slightly better in the neu1 morphants (Figures 5A–5D). In both models, E64d treatment increased the length of Meckel’s cartilage and reduced the angle between the ceratohyal cartilages.
Figure 5.

Treatment with the pan cathepsin inhibitor E64d rescues cartilage phenotypes in neu1 and gnptab deficient larvae
(A) Alcian blue staining of larvae treated with either 25 nM or 50 nM E64d show inhibiting multiple cathepsin proteases substantially improves cartilage phenotypes in both neu1 and gnptab deficient animals. Percent values represent number of animals exhibiting the pictured phenotype. n = 25–30 larvae per condition from 3 independent experiments. Scale bar: 20 μm.
(B) Graphs of Meckel’s length in untreated (graph 1) or E64 treated neu1 (graph 2) or gnptab (graph 3) deficient embryos.
(C) Graphs of ceratohyal angle, and (D) Meckel’s distance past the eyes. n = 25–30 embryos per condition from 3 independent experiments. In all cases error = SEM and significance was assessed using the Dunnet’s test (red stars), where ∗p < 0.05, ∗∗p < 0.01, ∗∗∗p < 0.001, and ∗∗∗∗p < 0.0001.
Inhibiting lysosomal exocytosis improves cartilage pathology in neu1 and gnptab morphants
To assess whether increased lysosomal exocytosis enhances cathepsin activity and contributes to cartilage pathology in neu1-deficient animals, the pharmacological inhibitor vacuolin-1 was injected into the hearts of 3 dpf larvae (Figure 6A). Vacuolin has been shown to inhibit Ca+2 dependent fusion of lysosomes with the plasma membrane.39 The ability of vacuolin to reduce lysosomal exocytosis was confirmed using animals expressing the fli1a:EGFP and hsp70:Lamp1-mCherry transgenes. The Lamp1-mCherry transgene was induced by heat shock 24 h post-treatment and the location of Lamp1 monitored confocally (Figure 6B). Vacuolin treatment reduced the number of chondrocytes with Lamp1-mCherry on their cell surface by 30% (Figure 6C). Additionally, when the number of cells with high versus moderate levels of surface localized Lamp1-mCherry were quantitated, we found more of the cells express a low level of cell surface Lamp1 after vacuolin treatment, with fewer exhibiting the intense level of surface localized Lamp1 (Figure S4A). Alcian blue staining of treated and untreated neu1-deficient larvae showed that inhibiting lysosomal exocytosis also improved cartilage pathology (Figures 6D and 6E). Given the suspected increase in exocytosis, we asked whether vacuolin treatment also improved cartilage pathology in gnptab-deficient animals. In this case vacuolin treatment was beneficial, but not as effective as observed when neu1-deficient larvae were treated with the drug (Figures 6D–6F and S4B–S4E). For both neu1 and gnptab-deficient animals this was evidenced by improvement in the length and angle of articulation of both the Meckel’s and ceratohyal cartilages (Figures 6E and 6F). It is possible that vacuolin treatment impacts other lysosomal fusion events, including fusion with late endosomes or autophagic vesicles. Since Lamp1 is essential for lysosomes to dock at the plasma membrane, reducing its expression or blocking its cytosolic domain with antibodies, has been shown to inhibit exocytosis.40,41 Zebrafish contain two lamp1 isoforms (lamp1a and lamp1b), both expressed in multiple tissues throughout development. Using morpholinos targeting either lamp1a or lamp1b, we asked if reducing lamp1 expression also improved cartilage pathology in neu1-deficient larvae. Alcian blue analyses confirm that morpholino mediated reduction of either isoform substantially improved cartilage phenotypes in >50% of neu1 morphants 5 dpf, with lamp1b modulation slightly more effective (Figures 6G and S4F–S4H). Confocal analyses of animals expressing the hsp70:lamp1-mCherry transgene show modulating lamp1 expression reduces cell surface abundance of Lamp1-mCherry in neu1-deficient larvae, supporting the likelihood that exocytosis was indeed attenuated (Figure 6H and 6I only lamp1b images shown).
Figure 6.

Inhibiting exocytosis improves cartilage phenotypes in neu1 and gnptab deficient larvae
(A) Schematic illustrates experimental workflow including histological stains, BMV109 labeling and analyses of heat shock induced Lamp1-mCherry transgene.
(B) Live confocal analyses of Lamp1-mCherry (red) location in fli1a:EGFP positive neu1 deficient cartilages treated with either DMSO or 35 nM vacuolin. Boxed areas shown in red only in panels to the right. Percent values represent number of animals exhibiting the pictured phenotype. n = 10 larvae per condition.
(C) Graph shows the percent of cells with cell surface localized Lamp1 in each condition. See Figure S4 for additional quantitation. Error = SEM, significance was assessed using an ANOVA, where ∗∗p < 0.01.
(D) Alcian blue stained larvae show vacuolin treatment improves cartilage morphology in both neu1 and gnptab deficient animals. Percent values represent number of animals exhibiting the pictured phenotype. Scale bar: 20 μm.
(E and F) Cartilage measurements in neu1 (E) and gnptab (F) morphants treated with either DMSO or vacuolin. n = 10–20 larvae per condition from 3 independent experiments. Error = SEM, significance was assessed using the Dunnet’s test (red stars), where ∗∗∗p < 0.001 and ∗∗∗∗p < 0.0001.
(G) Alcian blue stained control and neu1 morphant larvae co-injected with lamp1a or lamp1b morpholinos show Lamp1 modulation improves phenotypes (see also Figure S4). Percent values represent number of embryos exhibiting the pictured phenotype. n = 10 larvae per condition. Scale bar: 20 μm.
(H) Live confocal images of Lamp1-mCherry (red) in fli1a:EGFP (green) positive chondrocytes suggest Lamp1 modulation reduces cell surface lysosomal localization in neu1 morphants.
(I) Quantitation of chondrocytes exhibiting cell surface localization. n = 15 larvae per condition. Error = SEM, significance was assessed using an ANOVA or the Dunnet’s test (red stars), where ∗∗∗∗p < 0.0001.
Co-injection of BMV109 and vacuolin into neu1 and gnptab morphants confirmed that vacuolin treatment also reduces the activity of Ctsb, Ctsk, and Ctsl (Figures 7A–7C). In neu1-deficient larvae limiting exocytosis reduced the activities of both Ctsk and Cstb, but had little effect on Ctsl (Figure 7B). In contrast, inhibiting exocytosis in gnptab-deficient animals had a greater impact on the activity of Ctsl (Figure 7C) with less on effect on both Ctsb and Ctsk. The differential effect of vacuolin treatment on Ctsb, Ctsk, and Ctsl in animals lacking gnptab may reflect the role of the mannose-6-phosphate modification. In particular, Ctsk is highly dependent on the modification for lysosomal targeting and is therefore likely still hypersecreted in gnptab morphants regardless of vacuolin treatment. It is not clear why Ctsl activity is reduced following vacuolin treatment in gnptab, but not neu1, morphants. Since vacuolin only partially reduces exocytosis, and the degree of exocytosis is greater in neu1-deficient animals, it is possible that the level of extracellular Ctsl remains sufficiently high to sustain its increased activity. Despite its differential impact on the activity of each cathepsin, vacuolin treatment did reduce abnormally high levels of TGFβ signaling in both the neu1- and gnptab-deficient animals. Confocal analyses of immunohistochemically stained larvae show limiting exocytosis reduced the number of cells with pSmad2 positive nuclei (Figures 7D–7F). Lastly, the observed reduction in TGFβ signaling was associated with improved shape and organization of cartilage in both neu1- and gnptab-deficient animals (Figure 7D).
Figure 7.

Vacuolin-mediated inhibition of exocytosis normalizes cathepsin activity and restored TGFß signaling in neu1 and gnptab deficient larvae
(A) In gel analyses of embryos labeled with the BMV109 activity-based probe show vacuolin treatment primarily reduces Ctsk activity in neu1 deficient animals and Ctsl in gnptab deficient animals. n = 3 independent experiments with 12 embryos per condition.
(B) Graph shows quantitation of Ctsk and Ctsl activities in neu1 deficient animals. Error = SEM, significance was assessed using the Dunnet’s test (red stars), where ∗p < 0.05, ∗∗p < 0.01, ∗∗∗p < 0.001, and ∗∗∗∗p < 0.0001.
(C) Graph shows quantitation of Ctsk and Ctsl activities in gnptab deficient embryos. Error = SEM, significance was assessed using the Dunnet’s test (red stars), where ∗∗∗p < 0.001.
(D) Confocal analyses of pSmad2 staining in fli1a:EGFP positive neu1 and gnptab deficient cartilages treated with either DMSO or 35 nM vacuolin. Boxed areas shown as red only in panels to the right. For reference chondrocytes are outlined with dashed white lines. Percent values represent number of embryos exhibiting the pictured phenotype. n = 15 embryos per condition.
(E and F) Graphs quantitating the percent of chondrocytes in neu1 or gnptab deficient larvae with nuclear localized pSmad2. Error = SEM, significance was assessed using the Dunnet’s test (red stars), where ∗p < 0.05, ∗∗p < 0.01, ∗∗∗p < 0.001, and ∗∗∗∗p < 0.0001. See also Figure S4.
Discussion
Here we uncover increased lysosomal exocytosis within the cartilage of three different LSD zebrafish models, linking the dysregulation of exocytosis to abnormal cathepsin-mediated TGFβ-dependent pathogenesis in the sialidosis and MLII models. We show that inhibiting either cathepsin activity or exocytosis alleviates cartilage pathology in both neu1- and gnptab-deficient zebrafish animals, indicating that the excessive secretion and activity of cathepsin proteases via different mechanisms converges on a common pathogenic outcome. This work highlights the value of the zebrafish system to explore developmental disease mechanisms associated with lysosomal disorders. The parallels and differences observed within the three models, and the implications of these findings for the use of exocytosis inducers to treat LSDs, are discussed.
All three of the lysosomal models surveyed showed an increase in lysosomal exocytosis during cartilage development. As judged by a combination of the abundance of the LAMP1-mCherry fusion protein and the amount of cell surface LAMP1 staining, differences in the extent to which lysosomal exocytosis is increased are evident. The robust increase in exocytosis in the neu1-deficient larvae is consistent with established, sialic acid-dependent effects of this enzyme deficiency on lysosomal exocytosis.13 Additionally, the increase in lysosomal exocytosis noted in the gnptab-deficient animals is also consistent with the observation that Neu1 is hypersecreted from MLII cells and its activity reduced when M6P-dependent sorting is impaired. Our data in sorted cells suggest that mislocalizing Neu1 outside cells also increases the abundance of Lamp1 similar to globally reducing enzyme levels, presumably by slowing overall degradation of its glycans. It is well established that Neu1 and its trafficking partners, β-galactosidase and PPCA, are modified by M6P residues. This supports the likelihood that each of these enzymes is secreted in the context of MLII. Previous work on MLII zebrafish confirmed β-galactosidase is indeed secreted from gnptab-deficient chondrocytes, and in the present study we show that Neu1 is also secreted. This Neu1-dependent increase in lysosomal exocytosis creates two distinct carbohydrate-dependent mechanisms that displace hydrolytic enzymes outside the cell in MLII. The basis for the moderate increase in exocytosis in the galns-deficient zebrafish is still under investigation. Since this sulfatase has been proposed to be part of a lysosomal multienzyme complex along with Neu1, PPCA, and β-galactosidase, it is possible that variable deficiency of intracellular Neu1 drives enhanced exocytosis in all three models.31,32 Alternatively, in galns-deficient animals lysosomal storage may impair Neu1 activity, inhibiting its ability to modify Lamp1. Further investigation into the molecular basis underlying the dysregulation of exocytosis in the galns-deficient zebrafish may uncover other Neu1-independent mechanisms that also trigger lysosomal exocytosis. These data support the need for future studies aimed at understanding the degree to which increased lysosomal exocytosis contributes to the disease process in multiple LSDs, particularly those associated with skeletal abnormalities.
Inhibiting either cathepsin activity or lysosomal exocytosis in the neu1- and gnptab-deficient zebrafish normalized the enhanced TGFβ signaling and improved the cartilage phenotypes that accompany increased cathepsin activity. Phenotypic improvement had not been anticipated in gnptab-deficient animals following vacuolin treatment since reducing exocytosis should not appreciably block the release of lysosomal enzymes when M6P-dependent sorting is also impaired. Blocking exocytosis may, however, impact the release of other lysosomal components such as GAG fragments that drive maximal cathepsin activation and activity outside the cell.12 Regardless of mechanism, the demonstration that inhibiting exocytosis (either pharmacologically with vacuolin or by lamp1 modulation) improves cartilage phenotypes at both the molecular and cellular level reinforces the idea that extracellular events may largely dictate pathogenesis during early development of this tissue. In light of this observation, strategies aimed at stimulating exocytosis as a means to relieve storage should be carefully considered. The need for caution is underscored by the fact that dysregulated exocytosis may also contribute to pathology in other LSDs,17 as well as more common neurodegenerative disorders like Parkinson’s disease (PD).42,43 For example, in the lysosomal disorder MLIV, defects in ion transport have also been shown to stimulate exocytosis, which can be reversed through inhibition of TPC2. In fact, modulating TPC2 function and limiting lysosomal exocytosis was shown to be beneficial in multiple cell models, supporting this as general strategy for therapy. Increased exocytosis also contributes to PD pathology where releasing pathogenic forms of a-synuclein from neurons can seed the formation of larger aggregates.44 Equally concerning is the demonstrated role regulated exocytosis plays in cancer progression40 combined with the finding that NEU1 haploinsufficiency is associated with increased occurrence of rhabdomyosarcoma in mice.45 These studies stress the importance of defining the disease- and tissue-specific consequences of enhanced exocytosis, particularly as more inducers or inhibitors of exocytosis are considered for therapy.
The present study also demonstrates a common role for cathepsin proteases in LSD cartilage pathogenesis, contributing to disease in both the MLII and sialidosis models. The finding that cathepsin K drives cartilage pathology in a neu1-deficient zebrafish model of sialidosis is consistent with prior work on Neu1-knockout mice, which also implicated altered cathepsin activity in the disease process. Small molecule inhibition of extracellular cathepsin activity should therefore be viewed as a viable therapeutic strategy that may be further aided by the design or use of highly specific cathepsin exosite inhibitors that target the GAG binding sites of the enzyme.46,47 Elaborating how cathepsin activation and activity are modulated by the presence of specific GAGs will be a key factor in determining to what degree extracellular cathepsins contribute to pathology in other LSDs.
Limitations of the study
This study utilizes zebrafish models of two different LSDs associated with impaired lysosomal function. In sialidosis and mucolipidosis II, cathepsin proteases are mislocalized outside cells via two different carbohydrate-dependent mechanisms (loss of GNPTAB-dependent mannose phosphorylation and Neu1-dependent increased exocytosis). The relocalization of LAMP1 to the plasma membrane of the chondrocytes strongly supports a mechanism whereby increased lysosomal exocytosis arises from altered LAMP1 stability. However, our attempts to directly monitor LAMP1 half-life were technically difficult. Further, analyzing lysosomal exocytosis and TGFβ signaling in real-time within the developing zebrafish was also challenging. This limited our ability to directly tie exocytosis, mislocalized cathepsins and altered TGFβ signaling together.
STAR★Methods
Key resources table
| REAGENT or RESOURCE | SOURCE | IDENTIFIER |
|---|---|---|
| Antibodies | ||
| Rabbit monoclonal anti-psmad2(Ser465/467)/Smad3 (Ser423/425) (D27F4) | Cell Signaling Technology | Cat#8828S; RRID:AB_2631089 |
| collagen type II (II-II6B3) | Developmental Studies Hybridoma Bank (DSHB) | Cat#II-II6B3 |
| Anti-mCherry | Abcam | Cat#ab167453; RRID:AB_2571870 |
| Anti-Neu1 | Gift from Alessandra d’Azzo lab | N/A |
| Anti-Col2a1 | Developmental Studies Hybridoma Bank | Clone#II-II6B3 |
| Anti-pSmad2 | Cell Signaling Technology | Cat#8828S; RRID:AB_2631089 |
| Anti-γ-Tubulin | Sigma-Aldrich | Cat#T6557; RRID: AB_477584 |
| Chemicals, peptides, and recombinant proteins | ||
| Odanacatib(MK-0822) | MedChemExpress(MCE) | Cat#HY-10042 |
| Vacuolin-1 | APEXBIO | Cat#C4084 |
| BMV109 ABP | Gift from Matthew Bogyo (33) | N/A |
| E64d | Santa Cruz Biotechnology | Cat#sc-201280 |
| 2′-(4-Methylumbelliferyl)-α-D-N-acetylneuraminic acid sodium salt hydrate | Sigma-Aldrich | Cat#M8639 |
| Protease inhibitor | ThermoFisher Scientific | Cat#A32965 |
| Na-Acetate | Sigma-Aldrich | Cat#2889 |
| NaCl | Fisher scientific | Cat#BP358 |
| BSA | Sigma-Aldrich | Cat#A4503 |
| Na-Azide | Sigma-Aldrich | Cat#S2002 |
| 2-[N-Morpholino]ethane sulfonic acid | Sigma-Aldrich | Cat#M8250 |
| N-carbobenzoxy-L-phenylalanyl-L-alanine | Sigma-Aldrich | Cat#SCP0262 |
| L-Alanine | Sigma-Aldrich | Cat#W381829 |
| O-phthaldialdehyde | Sigma-Aldrich | Cat#P0657 |
| 2-mercaptoethanol | VWR | Cat#M131 |
| Na-Carbonate | Sigma-Aldrich | Cat#222321 |
| Critical commercial assays | ||
| qScript™ cDNA SuperMix | Quanta Biosciences™ | Cat#95048 |
| PerfeCta SYBR Green FastMix | Quanta Biosciences™ | Cat#95072-250 |
| Platinum™ Taq DNA polymerase | Invitrogen™ | Cat#10966018 |
| E.Z.N.A. Gel Extraction kit | Omega BIO-TEK | Cat#D2500 |
| TOPO TA Cloning Kits | Invitrogen™ | Cat#K457502 |
| Micro BCA™ Protein Assay Kit | ThermoFisher Scientific | Cat#23235 |
| TURBO DNA-free™ Kit | Invitrogen™ | Cat#AM1907 |
| DNA sequencing | Eton Bioscience Inc. | N/A |
| Amplex™ Red Neuraminidase (Sialidase) Assay Kit | Invitrogen™ | Cat#A22178 |
| Experimental models: Organisms/strains | ||
| hsp70: Lamp1-RFP | Gift from M. Bagnat (29) | ZDB-ALT-130409-7 |
| fli1a:EGFP | Zebrafish International Resource Center (27) | ZDB-ALT-130122-1 |
| TLAB wild type strain (hybrid of the TL and AB strains obtained from ZIRC) | Zebrafish International Resource Center | N/A |
| Oligonucleotides | ||
| Morpholino: neu1 i1e2sb GCGGATCAAT CTGTGGCAAGTAAAA (primarily used in this study) |
Gene Tools | N/A |
| Morpholino: neu1-TB TCCATTGCAACGATAAACCAGATGA |
Gene Tools | N/A |
| Morpholino: Galns e2i2sb ACAGTGTAGAAGCAGCACTTACATG |
Gene Tools | N/A |
| Morpholino: Gnptab-TB TTAACGACCAACATGACTCCGGCC (primarily used in this study) |
Gene Tools | N/A |
| Morpholino: Gnptab-SB TAAACATTTGTAGAGCCAACCTGGT |
Gene Tools | N/A |
| Morpholino: Neu4e2i2SB TGTCTATGTTGACTCGTCTTACTTC |
Gene Tools | N/A |
| Morpholino: Lamp1a201SBi3e4 TCTGTGGAGGAGCAGAGACGTCAAC |
Gene Tools | N/A |
| Morpholino: Lamp1bTB5’UTR CACGCTCGATAAAAACAGATGATGT |
Gene Tools | N/A |
| Morpholino: CtsA e2i2 AAAGTGAGGCCATCCTGCTGACCAG |
Gene Tools | N/A |
| Morpholino: Random control NNNNNNNNNNNNNNNNNNNNNNNNN |
Gene Tools | N/A |
| Neu1 Guide RNA GACAAATTGGAATTTTACTG(GGG) |
Synthego | N/A |
| TALEN pr.1 Forward: GCGTTCTCTGAAGGCCAGG Reverse: TGAACTTTGCCCCAATGT |
ThermoFisher Scientific | N/A |
| TALEN pr.2 Forward: TGGCGTTCTCTGAGGCCA Reverse: AACTTTGCCCCAATGTCA |
ThermoFisher Scientific | N/A |
| Primer: neu1-RTPCR Forward: cgacaaattggaattttactcg Reverse: tggttgtaagggatactcttcaga |
Eton Bioscience Inc | N/A |
| Primer: galns-RTPCR Forward: cgatggggggatttgggagtatt Reverse: ggatttaatcgcagggagcatacag |
Eton Bioscience Inc | N/A |
| Primer:M13 Forward: gtaaaacgacggccag Reverse caggaaacagctatgac |
Eton Bioscience Inc | N/A |
| Primer: neu4e1e3-RTPCR Forward: tagagcgtgtcctgcctgtt Reverse: gtcctggtgagatctgtagcg |
Eton Bioscience Inc | N/A |
| Primer: lamp1ae3e8-RTPCR Forward: gtgtgcagtctgtgatggcg Reverse: gttccctgcctcaaacacaa |
Eton Bioscience Inc | N/A |
| Primer: neu1ggc10de1e5-RTPCR Forward: cgtgccgacaagactcagatt Reverse: gctgctacaactgggtcgat |
Eton Bioscience Inc | N/A |
| Primer: neu1ggc10de2e5-RTPCR Forward: ctatgggtcagtggtggagc Reverse: gctgctacaactgggtcgat |
Eton Bioscience Inc | N/A |
| Primer: neu1-qRTPCR Forward: ttcatctggtttatcgttgcaatgg Reverse: agtcttgtcggcacgcgcgc |
Eton Bioscience Inc | N/A |
| Primer: col2a-qRTPCR Forward: gaacttcctcaggctgctgt Reverse: tgtaagccacgctgttcttg |
Eton Bioscience Inc (10) | N/A |
| Primer: mCherry-qRTPCR Forward: ctgaaggtgaccaagggtgg Reverse: tagtcggggatgtcggcggg |
Eton Bioscience Inc | N/A |
| Primer: neu3-qRTPCR Forward: ctaggagtttacttgaataag Reverse: ccacactccatgaggcag |
Eton Bioscience Inc | N/A |
| Primer: neu4-qRTPCR Forward: cagctccgaggtctccaaag Reverse: ggtctcgaggcagaagactg |
Eton Bioscience Inc | N/A |
| Primer: CtsK-qRTPCR Forward: ggatcagcagtgtgcctaca Reverse: tggactgcatggcatctatg |
Eton Bioscience Inc (10) | N/A |
| Primer: CtsL1a-qRTPCR Forward: ggagggtcagatgttcagga Reverse:cagtccaccaggttctgctc |
Eton Bioscience Inc (12) | N/A |
| Primer: CtsL1b-qRTPCR Forward: ttggtggactgttccagacc Reverse: aacatactggaaggcctggtc |
Eton Bioscience Inc (10) | N/A |
| Primer: rpl4-qRTPCR Forward: aagagctgttgcccgtatcc Reverse: ccaccacgacacatatttccg |
Eton Bioscience Inc | N/A |
| Software and algorithms | ||
| ImageJ | https://imagej.nih.gov/ij/download.html | Version 1.53K |
| Prism | ||
| CFX Maestro 1.1 | BioRad | Version 1.1 |
| Creative Suite Photoshop | Adobe | Version 25.0.0 |
| Creative Suite Illustrator | Adobe | Version 28.2.0 |
| BioTek Gen5 | Agilent | Version 3.11 |
Resource availability
Lead contact
Further information and requests for resources and reagents should be directed to and will be fulfilled by the lead contact, Heather Flanagan-Steet (heatherfs@ggc.org).
Materials availability
New fish lines generated in this study will be available upon request. All other reagents, including morpholinos, are available commercially. Sequence and product details are provided in the key resources table.
Data and code availability
No large-scale data were generated in this study. All other data types presented in this paper will be shared by the lead contact upon request. No original code was generated in this study. Any additional information required to reanalyze the data reported in this paper is available from the lead contact upon request.
Experimental model and study participant details
Zebrafish strains and husbandry
Animals were maintained according to standard protocols. The hybrid TLAB line used in this study was generated from TL and AB strains acquired from the Zebrafish International Resource Center (ZIRC, Eugene, OR). Tg(fli1a:EGFP)y1.27 was also acquired from ZIRC. The Tg(hsp701:lamp-mCherry) line was provided by Dr. Michel Bagnat (Duke University) 29 . Staging was according to established criteria.48 In some cases, 0.003% 1-phenyl 2-thiourea (PTU) was added to embryo medium to block pigmentation. Handling and euthanasia of fish for all experiments complied with the Greenwood Genetic Center policies, as approved by the GGC Institutional Animal Care and Use Committee (permit #A2022 01-003-Y1).
Generation of neu1 CRIPSR and TALEN mutants
For the neu1 CRISPR line, a gRNA sequence was designed using the online tool CRISPRscan to target the first exon of neu1 gene (ENSDARG00000008832) (protospacer adjacent motif site in parentheses): GACAAATTGGAATTTTACTC(GGG). Synthesis of gRNA and Cas9 mRNA as well as embryo microinjection was performed as described previously.49 The neu1 F0 analyses of TALEN generated mutants was performed by injecting either 25 or 50ng of RNA from one of two TALEN pairs (sequence listed in key resources table and Figure S1). For experiments involving F0 CRISPR mutants 3 additional Neu1-specific guide RNAs (gRNA) were designed using the online tool CRISPRscan (http://www.crisprscan.org/). Three guide RNAs (gRNAs) were used against 3 exons of interest (exon 2: CAGUUACUAUGGGGUCAGUGG; exon 3: CACGAUGAUGGUGCAAAGUC; exon 4: UGGCACCAUUGCUGGCGAUG). Synthesis of gRNAs and of Cas9 mRNA was performed as described.50 Zebrafish wild-type embryos were microinjected with a 1 nL drop of a mix of 100 ng/μL of Cas9 mRNA and 100 ng/μL of gRNA neu1 exon 2, 30 ng/μL of gRNA neu1 exon 3, 30 ng/μL of gRNA neu1 exon 4 was injected into one-cell stage embryos using a Picospritzer III pressure ejector. Our control groups included wild-type and Cas9-injected larvae. Genotype was confirmed via high-resolution melting (HRM) as previously described.49
Morpholinos and inhibition of gene expression
Morpholino knockdown of Glc-NAc-1-phosphotransferase was performed and assessed as previously described.10,26 Unless otherwise specified for most experiments the concentration of morpholino chosen represented the minimal amount of morpholino needed to maximally reduce protein abundance or enzyme activity. As such, morpholino knockdown of neu1 expression was performed by injecting 0.35 μM of a splice blocking morpholino targeting the 5’ junction of exon2-intron2 (5′- GCGGATCAATCTGTGGCAAGTAAAA -3′)(Gene Tools LLC, Eugene, OR) into one cell stage embryos. The level of Neu1 knockdown was monitored by RT-PCR and Western blot. For RT-PCR, total RNA was isolated from larvae and cDNA generated as described below. Primers flanking the point mutation (see key resources table) were used to amplify neu1 transcripts, which were isolated from agarose gels and TA-cloned using the pCR4-TOPO vector system (Thermo Fisher). Individual clones were isolated for each transcript and sequenced to determine the impact of the morpholino. For both neu1 and gnptab a second unique morpholino was also validated and all phenotypes confirmed using both. The data presented throughout the manuscript only represent one of the two morpholinos (see key resources table). Morpholino induced effects were also controlled for using a randomized control morpholino. Unless otherwise stated control data represent mock injected animals and data labeled WT represent genotypically homozygous wild type animals.
Method details
Morpholinos and inhibition of gene expression
Morpholino knockdown of Glc-NAc-1-phosphotransferase was performed and assessed as previously described.10,26 Unless otherwise specified for most experiments the concentration of morpholino chosen represented the minimal amount of morpholino needed to maximally reduce protein abundance or enzyme activity. As such, morpholino knockdown of neu1 expression was performed by injecting 0.35 μM of a splice blocking morpholino targeting the 5’ junction of exon2-intron2 (5′- GCGGATCAATCTGTGGCAAGTAAAA -3′)(Gene Tools LLC, Eugene, OR) into one cell stage embryos. The level of Neu1 knockdown was monitored by RT-PCR and Western blot. For RT-PCR, total RNA was isolated from larvae and cDNA generated as described below. Primers flanking the point mutation (see key resources table) were used to amplify neu1 transcripts, which were isolated from agarose gels and TA-cloned using the pCR4-TOPO vector system (Thermo Fisher). Individual clones were isolated for each transcript and sequenced to determine the impact of the morpholino. For both neu1 and gnptab a second unique morpholino was also validated and all phenotypes confirmed using both. The data presented throughout the manuscript only represent one of the two morpholinos (see key resources table). Morpholino induced effects were also controlled for using a randomized control morpholino. Unless otherwise stated control data represent mock injected animals and data labeled WT represent genotypically homozygous wild type animals.
Reverse transcriptase PCR and qRT-PCR analyses
Primer pairs were validated for specificity and efficiency prior to use. Sequences for all primers used are listed in the key resources table.
TRIzol Reagent (Ambion, Thermo Fisher Scientific) was used according to manufacturer’s instructions to isolate total RNA from embryos or larvae at stages indicated in the results section. An additional DNAse digestion was performed to remove contaminating gDNA. cDNA was synthesized using the qScript cDNA synthesis kit with 500 ng RNA input (95048-025, Quanta Biosciences; Beverly, MA). gDNA contamination was checked in control samples lacking reverse transcription. Ribosomal protein L4 (rpl4) was used as a normalization control as described previously (see key resources table for primer sequences).10 qRT-PCRs were performed using PerfeCTa SYBR Green FastMix (cat#95072-250 Quanta Biosciences, Beverly, MA) on a BioRad CFX96 Real Time System (C1000) and data analysis performed using the CFX Maestro 1.1 (version 4.1.2433.1219) software.
SDS-PAGE and Western blotting
Animals were manually deyolked and harvested at time points indicated. For western blot sample preparation, lysis was done by first incubating 15 animals per sample for 30 minutes on ice in a Tris-Triton buffer (2% SDS, 20 mM Tris, pH 7.4, 150 mM NaCl, 1 mM EDTA, 2% Triton X-100, 10% glycerol,0.5% deoxycholate, 2mM DTT) containing protease inhibitor (Catalog# A32965, Thermo Scientific™). Lysates were subsequently homogenized on ice by probe sonication and centrifuged at 4°C. Protein concentration was determined by the Micro-BCA protein assay (cat# 23235 Thermo Scientific) and equal amounts of protein loaded on SDS-PAGE gels. Blots were probed using an anti-Neu1 antibody (kindly provided by Dr. Alessandra d’Azzo, St. Jude’s Hopsital) or an anti-mCherry (1;1000, Cat# ab167453, AbCAM). Appropriate HRP-labeled secondary antibodies were used and blots analyzed using the Bio-Rad MP Chemidoc system. To analyze the Lamp1-mCherry transgene half-life its expression was induced by treating 4dpf larvae with pre-warmed 37°C embryo medium for 30 min in a 37°C bath. Animals were subsequently harvested at multiple times post-heat shock and lysates prepared as described above.
Analyses of lysosomal enzyme activity
Lysosomal enzyme activities were performed as previously described.26,51 Briefly, 5dpf larvae were harvested and manually deyolked and samples of 20 larvae lysed in a Tris/HCl buffer containing protease inhibitors and homogenized by sonication. 20 μL homogenized cells was incubated with 80 μL substrate (0.69 mM 4-MU-N-acetyl-α-D-neuraminic acid, pH 4.4) for 30 minutes at 37°C. Reaction is stopped with 3.9 mL 2-amino-2-methyl-1-propanol (0.1 M, pH 10.3) before reading fluorescence. 4-MU released by the reaction is calculated using a standard curve. Enzyme activity is reported as nmol/hr/mg protein. The neutral activity was measured using the Amplex Red Neuramindase Assay Kit and its referenced protocol. Briefly 50μl of larval lysate was mixed with 50μl of working solution containing 50μM Amplex red reagent. A no-neuraminidase negative control, a neuraminidase positive control and H202 positive control were included with each experimental assay. PPCA activity was measured as previously described.52 Briefly, 15ug of larval lysate was diluted in enzyme dilution buffer with or without substrate 1.5 mM N-carbobenzoxy-L-phenylalanyl-L-alanine (see key resources table for detailed constituents. A dilution series of L-Alanine was used as a standard to assign measured unit (nmol/min/mg).
Histochemistochemical and immunohistochemical analysis
Alcian blue staining was performed as previously described.26 Stained animals were photographed on an Olympus SZ16 stereoscope outfitted with an Olympus DP73 Camera. Cartilage structural were measured using either Adobe Photoshop (CS6, Version 13.0). or CellSens software (Olympus). To account for differences in embryonic size, all measurements were normalized to the distance between the eyes. For immunohistochemical stains, the primary antibodies used included anti-Col2a1 (1;100, clone# II-II6B3, Developmental Studies Hybridoma Bank), anti-pSmad2 (1:100, cat#8828S, Cell Signaling), and an anti-Cherry (Cat# ab167453, AbCAM). Whole mount immunohistochemistry was performed as described previously.53 Briefly, embryos were fixed at 4°C for 4-6 hours with 4% paraformaldehyde. Fixed embryos were then stained with the indicated primary anti-bodies described in the key resources table, followed by appropriate fluorophore-conjugated secondary antibodies. Animals older than 24 hpf were permeabilized by immersion in acetone for 7 minutes at –20°C, after fixation and before immunostaining. Confocal images were acquired on an Olympus FV3000 laser-scanning microscope and images subsequently processed using both NIH Image J (Java 64-bit 1.52K) and Adobe Photoshop (CS6, Version 13.0).
Pharmacological treatments
To specifically or globally inhibit different cysteine cathepsins, larvae were treated as indicated with either the cathepsin K inhibitor odanacatib (cat# MK-0822, MedChemExpress) or the pan inhibitor E64d (Santa Cruz Biotechnology, cat#SC-201280). Odanacatib and E64 were introduced into the embryos media as previously described.11,51 To modulate lysosomal exocytosis, embryos were treated with vacuolin-1 (cat#C4084, APEXBIO, Houston, TX) by injecting the drug into the pericardial space of embryos 3dpf.
Heat shock and Lamp1 transgene analyses
For analyses of Lamp-mCherry half-life and cellular location, transgene expression was induced by heat shock. Briefly, embryos were exposed to embryo medium prewarmed to 39°C. Animals were incubated for 30min. in a 39°C water bath. For Western blot analyses, 10 4dpf embryos per sample were harvested at 30min, 3hr, 5hr, 10hr and 24hr post heat shock and lysates prepared as described above. For live confocal microscopy, larvae were mounted as previously described53 5h post heat shock and imaging performed at room temperature.
BMV109 analyses
Both global and local analyses of cathepsin activity with the BMV109 activity-based probe was performed as previously described.12 Briefly, 1nl of a 10μM solution of the BMV109 ABP was microinjected periardially into embryos at the time points indicated. For egg stage and younger embryos this equates to an approximated final global concentration of 10nM. Local concentration in specific tissues is unclear. Unless otherwise noted probe was circulated over night at the normal growth temperature (28.8°C) and embryos harvested 15h post-injection. 25 embryos per condition were collected and lysed in citrate buffer (50mM citrate buffer pH5.5, 5mM DTT, 0.5% CHAPS, 0.75% Triton X-100) by brief sonication. Samples were centrifuged for 15 minutes at 15,000g and the supernatant collected. Protein concentration was determined via a micro BCA assay (cat#23235, Thermo Fisher, Rockford, IL) and cathepsin activity analyzed in SDS Page gels by Cy5 fluorescence.
Quantification and statistical analysis
All experiments involving analyses of phenotypic rescue were single blinded such that the person acquiring and analyzing the measurements was unaware of the experimental condition. Rescue of cartilage phenotypes were assessed as previously described.10,11,12 All results are expressed as mean ±SEM. Statistical analyses were performed on Graphpad Prism (Version 7.0a) software. For paired comparison of two groups, a two-tailed paired student’s-test was performed. For other parametric data, a one-way ANOVA was performed, followed by Dunnett’s multiple comparisons test.
Additional resources
(See key resources table).
Acknowledgments
We would like to thank the staff of the Allin Aquaculture Facility, especially Chelsi Jeter and Kali Wiggins, for expert care of the animals used in this study. We also thank Dr. Andrei Alexandrov from the Clemson Center for Human Genetics for his expert assistance with FACS isolation.
Funding: The work was supported by NIH R01 NS128907 to R.S. and a grant to HFS from the National MPS Society (Durham, North Carolina).
Author contributions
T.W., J.-J.L., K.W., and P.N.L. performed experiments and assisted with data interpretation and manuscript preparation. C.U. and K.O. performed experiments. L.M.P. and E.S. assisted with experiments and data interpretation. H.F.-S. and R.S. conceived the study, interpreted data and wrote the manuscript.
Declaration of interests
E.S. is a co-founder of DanioDesign Inc.
Published: February 21, 2024
Footnotes
Supplemental information can be found online at https://doi.org/10.1016/j.isci.2024.109293.
Contributor Information
Heather Flanagan-Steet, Email: heatherfs@ggc.org.
Richard Steet, Email: rsteet@ggc.org.
Supplemental information
References
- 1.Jain A., Zoncu R. Organelle transporters and inter-organelle communication as drivers of metabolic regulation and cellular homeostasis. Mol. Metabol. 2022;60 doi: 10.1016/j.molmet.2022.101481. [DOI] [PMC free article] [PubMed] [Google Scholar]
- 2.Zoncu R., Perera R.M. Built to last: lysosome remodeling and repair in health and disease. Trends Cell Biol. 2022;32:597–610. doi: 10.1016/j.tcb.2021.12.009. [DOI] [PMC free article] [PubMed] [Google Scholar]
- 3.Lawrence R.E., Zoncu R. The lysosome as a cellular centre for signalling, metabolism and quality control. Nat. Cell Biol. 2019;21:133–142. doi: 10.1038/s41556-018-0244-7. [DOI] [PubMed] [Google Scholar]
- 4.Fiorenza M.T., Moro E., Erickson R.P. The pathogenesis of lysosomal storage disorders: beyond the engorgement of lysosomes to abnormal development and neuroinflammation. Hum. Mol. Genet. 2018;27:R119–R129. doi: 10.1093/hmg/ddy155. [DOI] [PubMed] [Google Scholar]
- 5.Marques A.R.A., Saftig P. Lysosomal storage disorders - challenges, concepts and avenues for therapy: beyond rare diseases. J. Cell Sci. 2019;132 doi: 10.1242/jcs.221739. [DOI] [PubMed] [Google Scholar]
- 6.Kollmann K., Pohl S., Marschner K., Encarnação M., Sakwa I., Tiede S., Poorthuis B.J., Lübke T., Müller-Loennies S., Storch S., Braulke T. Mannose phosphorylation in health and disease. Eur. J. Cell Biol. 2010;89:117–123. doi: 10.1016/j.ejcb.2009.10.008. [DOI] [PubMed] [Google Scholar]
- 7.Kornfeld S., Mellman I. The biogenesis of lysosomes. Annu. Rev. Cell Biol. 1989;5:483–525. doi: 10.1146/annurev.cb.05.110189.002411. [DOI] [PubMed] [Google Scholar]
- 8.Reitman M.L., Kornfeld S. Lysosomal enzyme targeting. N-Acetylglucosaminylphosphotransferase selectively phosphorylates native lysosomal enzymes. J. Biol. Chem. 1981;256:11977–11980. [PubMed] [Google Scholar]
- 9.Tiede S., Muschol N., Reutter G., Cantz M., Ullrich K., Braulke T. Missense mutations in N-acetylglucosamine-1-phosphotransferase alpha/beta subunit gene in a patient with mucolipidosis III and a mild clinical phenotype. Am. J. Med. Genet. 2005;137A:235–240. doi: 10.1002/ajmg.a.30868. [DOI] [PubMed] [Google Scholar]
- 10.Petrey A.C., Flanagan-Steet H., Johnson S., Fan X., De la Rosa M., Haskins M.E., Nairn A.V., Moremen K.W., Steet R. Excessive activity of cathepsin K is associated with cartilage defects in a zebrafish model of mucolipidosis II. Dis. Model. Mech. 2012;5:177–190. doi: 10.1242/dmm.008219. [DOI] [PMC free article] [PubMed] [Google Scholar]
- 11.Flanagan-Steet H., Aarnio M., Kwan B., Guihard P., Petrey A., Haskins M., Blanchard F., Steet R. Cathepsin-Mediated Alterations in TGFss-Related Signaling Underlie Disrupted Cartilage and Bone Maturation Associated With Impaired Lysosomal Targeting. J. Bone Miner. Res. 2016;31:535–548. doi: 10.1002/jbmr.2722. [DOI] [PMC free article] [PubMed] [Google Scholar]
- 12.Flanagan-Steet H., Christian C., Lu P.N., Aarnio-Peterson M., Sanman L., Archer-Hartmann S., Azadi P., Bogyo M., Steet R.A. TGF-ss Regulates Cathepsin Activation during Normal and Pathogenic Development. Cell Rep. 2018;22:2964–2977. doi: 10.1016/j.celrep.2018.02.066. [DOI] [PMC free article] [PubMed] [Google Scholar]
- 13.Yogalingam G., Bonten E.J., van de Vlekkert D., Hu H., Moshiach S., Connell S.A., d'Azzo A. Neuraminidase 1 is a negative regulator of lysosomal exocytosis. Dev. Cell. 2008;15:74–86. doi: 10.1016/j.devcel.2008.05.005. [DOI] [PMC free article] [PubMed] [Google Scholar]
- 14.Iwayama T., Okada T., Ueda T., Tomita K., Matsumoto S., Takedachi M., Wakisaka S., Noda T., Ogura T., Okano T., et al. Osteoblastic lysosome plays a central role in mineralization. Sci. Adv. 2019;5 doi: 10.1126/sciadv.aax0672. [DOI] [PMC free article] [PubMed] [Google Scholar]
- 15.Yang D.Q., Feng S., Chen W., Zhao H., Paulson C., Li Y.P. V-ATPase subunit ATP6AP1 (Ac45) regulates osteoclast differentiation, extracellular acidification, lysosomal trafficking, and protease exocytosis in osteoclast-mediated bone resorption. J. Bone Miner. Res. 2012;27:1695–1707. doi: 10.1002/jbmr.1623. [DOI] [PMC free article] [PubMed] [Google Scholar]
- 16.Bastow E.R., Last K., Golub S., Stow J.L., Stanley A.C., Fosang A.J. Evidence for lysosomal exocytosis and release of aggrecan-degrading hydrolases from hypertrophic chondrocytes, in vitro and in vivo. Biol. Open. 2012;1:318–328. doi: 10.1242/bio.2012547. [DOI] [PMC free article] [PubMed] [Google Scholar]
- 17.Park S., Ahuja M., Kim M.S., Brailoiu G.C., Jha A., Zeng M., Baydyuk M., Wu L.G., Wassif C.A., Porter F.D., et al. Fusion of lysosomes with secretory organelles leads to uncontrolled exocytosis in the lysosomal storage disease mucolipidosis type IV. EMBO Rep. 2016;17:266–278. doi: 10.15252/embr.201541542. [DOI] [PMC free article] [PubMed] [Google Scholar]
- 18.van de Vlekkert D., Demmers J., Nguyen X.X., Campos Y., Machado E., Annunziata I., Hu H., Gomero E., Qiu X., Bongiovanni A., et al. Excessive exosome release is the pathogenic pathway linking a lysosomal deficiency to generalized fibrosis. Sci. Adv. 2019;5 doi: 10.1126/sciadv.aav3270. [DOI] [PMC free article] [PubMed] [Google Scholar]
- 19.Seyrantepe V., Canuel M., Carpentier S., Landry K., Durand S., Liang F., Zeng J., Caqueret A., Gravel R.A., Marchesini S., et al. Mice deficient in Neu4 sialidase exhibit abnormal ganglioside catabolism and lysosomal storage. Hum. Mol. Genet. 2008;17:1556–1568. doi: 10.1093/hmg/ddn043. [DOI] [PubMed] [Google Scholar]
- 20.Seyrantepe V., Landry K., Trudel S., Hassan J.A., Morales C.R., Pshezhetsky A.V. Neu4, a novel human lysosomal lumen sialidase, confers normal phenotype to sialidosis and galactosialidosis cells. J. Biol. Chem. 2004;279:37021–37029. doi: 10.1074/jbc.M404531200. [DOI] [PubMed] [Google Scholar]
- 21.Okun S., Peek A., Igdoura S.A. Neuraminidase 4 (NEU4): new biological and physiological player. Glycobiology. 2023;33:182–187. doi: 10.1093/glycob/cwad008. [DOI] [PubMed] [Google Scholar]
- 22.Miyagi T., Yamamoto K. Sialidase NEU3 and its pathological significance. Glycoconj. J. 2022;39:677–683. doi: 10.1007/s10719-022-10067-7. [DOI] [PubMed] [Google Scholar]
- 23.Paolini L., Orizio F., Busatto S., Radeghieri A., Bresciani R., Bergese P., Monti E. Exosomes Secreted by HeLa Cells Shuttle on Their Surface the Plasma Membrane-Associated Sialidase NEU3. Biochemistry. 2017;56:6401–6408. doi: 10.1021/acs.biochem.7b00665. [DOI] [PubMed] [Google Scholar]
- 24.Cirillo F., Ghiroldi A., Fania C., Piccoli M., Torretta E., Tettamanti G., Gelfi C., Anastasia L. NEU3 Sialidase Protein Interactors in the Plasma Membrane and in the Endosomes. J. Biol. Chem. 2016;291:10615–10624. doi: 10.1074/jbc.M116.719518. [DOI] [PMC free article] [PubMed] [Google Scholar]
- 25.Khan A., Sergi C. Sialidosis: A Review of Morphology and Molecular Biology of a Rare Pediatric Disorder. Diagnostics. 2018;8 doi: 10.3390/diagnostics8020029. [DOI] [PMC free article] [PubMed] [Google Scholar]
- 26.Flanagan-Steet H., Sias C., Steet R. Altered chondrocyte differentiation and extracellular matrix homeostasis in a zebrafish model for mucolipidosis II. Am. J. Pathol. 2009;175:2063–2075. doi: 10.2353/ajpath.2009.090210. [DOI] [PMC free article] [PubMed] [Google Scholar]
- 27.Lawson N.D., Weinstein B.M. In vivo imaging of embryonic vascular development using transgenic zebrafish. Dev. Biol. 2002;248:307–318. doi: 10.1006/dbio.2002.0711. [DOI] [PubMed] [Google Scholar]
- 28.Okada K., Takase R., Hamaoka Y., Honda A., Ikeda A., Hokazono Y., Maeda Y., Hayasaka O., Kotani T., Komatsu M., Shiozaki K. Establishment and characterization of Neu1-knockout zebrafish and its abnormal clinical phenotypes. Biochem. J. 2020;477:2841–2857. doi: 10.1042/BCJ20200348. [DOI] [PubMed] [Google Scholar]
- 29.Ellis K., Bagwell J., Bagnat M. Notochord vacuoles are lysosome-related organelles that function in axis and spine morphogenesis. J. Cell Biol. 2013;200:667–679. doi: 10.1083/jcb.201212095. [DOI] [PMC free article] [PubMed] [Google Scholar]
- 30.Ostrowska H., Krukowska K., Kalinowska J., Orłowska M., Lengiewicz I. Lysosomal high molecular weight multienzyme complex. Cell. Mol. Biol. Lett. 2003;8:19–24. [PubMed] [Google Scholar]
- 31.Pshezhetsky A.V., Ashmarina M. Lysosomal multienzyme complex: biochemistry, genetics, and molecular pathophysiology. Prog. Nucleic Acid Res. Mol. Biol. 2001;69:81–114. doi: 10.1016/s0079-6603(01)69045-7. [DOI] [PubMed] [Google Scholar]
- 32.Pshezhetsky A.V., Potier M. Association of N-acetylgalactosamine-6-sulfate sulfatase with the multienzyme lysosomal complex of beta-galactosidase, cathepsin A, and neuraminidase. Possible implication for intralysosomal catabolism of keratan sulfate. J. Biol. Chem. 1996;271:28359–28365. doi: 10.1074/jbc.271.45.28359. [DOI] [PubMed] [Google Scholar]
- 33.Oresic Bender K., Ofori L., van der Linden W.A., Mock E.D., Datta G.K., Chowdhury S., Li H., Segal E., Sanchez Lopez M., Ellman J.A., et al. Design of a highly selective quenched activity-based probe and its application in dual color imaging studies of cathepsin S activity localization. J. Am. Chem. Soc. 2015;137:4771–4777. doi: 10.1021/jacs.5b00315. [DOI] [PMC free article] [PubMed] [Google Scholar]
- 34.Verdoes M., Oresic Bender K., Segal E., van der Linden W.A., Syed S., Withana N.P., Sanman L.E., Bogyo M. Improved quenched fluorescent probe for imaging of cysteine cathepsin activity. J. Am. Chem. Soc. 2013;135:14726–14730. doi: 10.1021/ja4056068. [DOI] [PMC free article] [PubMed] [Google Scholar]
- 35.Markmann S., Krambeck S., Hughes C.J., Mirzaian M., Aerts J.M.F.G., Saftig P., Schweizer M., Vissers J.P.C., Braulke T., Damme M. Quantitative Proteome Analysis of Mouse Liver Lysosomes Provides Evidence for Mannose 6-phosphate-independent Targeting Mechanisms of Acid Hydrolases in Mucolipidosis II. Mol. Cell. Proteomics. 2017;16:438–450. doi: 10.1074/mcp.M116.063636. [DOI] [PMC free article] [PubMed] [Google Scholar]
- 36.Zanoteli E., van de Vlekkert D., Bonten E.J., Hu H., Mann L., Gomero E.M., Harris A.J., Ghersi G., d'Azzo A. Muscle degeneration in neuraminidase 1-deficient mice results from infiltration of the muscle fibers by expanded connective tissue. Biochim. Biophys. Acta. 2010;1802:659–672. doi: 10.1016/j.bbadis.2010.04.002. [DOI] [PMC free article] [PubMed] [Google Scholar]
- 37.Zhang X., Zhou Y., Yu X., Huang Q., Fang W., Li J., Bonventre J.V., Sukhova G.K., Libby P., Shi G.P. Differential Roles of Cysteinyl Cathepsins in TGF-beta Signaling and Tissue Fibrosis. iScience. 2019;19:607–622. doi: 10.1016/j.isci.2019.08.014. [DOI] [PMC free article] [PubMed] [Google Scholar]
- 38.Lu P.N., Moreland T., Christian C.J., Lund T.C., Steet R.A., Flanagan-Steet H. Inappropriate cathepsin K secretion promotes its enzymatic activation driving heart and valve malformation. JCI Insight. 2020;5 doi: 10.1172/jci.insight.133019. [DOI] [PMC free article] [PubMed] [Google Scholar]
- 39.Cerny J., Feng Y., Yu A., Miyake K., Borgonovo B., Klumperman J., Meldolesi J., McNeil P.L., Kirchhausen T. The small chemical vacuolin-1 inhibits Ca(2+)-dependent lysosomal exocytosis but not cell resealing. EMBO Rep. 2004;5:883–888. doi: 10.1038/sj.embor.7400243. [DOI] [PMC free article] [PubMed] [Google Scholar]
- 40.Machado E., White-Gilbertson S., van de Vlekkert D., Janke L., Moshiach S., Campos Y., Finkelstein D., Gomero E., Mosca R., Qiu X., et al. Regulated lysosomal exocytosis mediates cancer progression. Sci. Adv. 2015;1 doi: 10.1126/sciadv.1500603. [DOI] [PMC free article] [PubMed] [Google Scholar]
- 41.Reddy A., Caler E.V., Andrews N.W. Plasma membrane repair is mediated by Ca(2+)-regulated exocytosis of lysosomes. Cell. 2001;106:157–169. doi: 10.1016/s0092-8674(01)00421-4. [DOI] [PubMed] [Google Scholar]
- 42.Stykel M.G., Humphries K.M., Kamski-Hennekam E., Buchner-Duby B., Porte-Trachsel N., Ryan T., Coackley C.L., Bamm V.V., Harauz G., Ryan S.D. alpha-Synuclein mutation impairs processing of endomembrane compartments and promotes exocytosis and seeding of alpha-synuclein pathology. Cell Rep. 2021;35 doi: 10.1016/j.celrep.2021.109099. [DOI] [PubMed] [Google Scholar]
- 43.Bae E.J., Choi M., Kim J.T., Kim D.K., Jung M.K., Kim C., Kim T.K., Lee J.S., Jung B.C., Shin S.J., et al. TNF-alpha promotes alpha-synuclein propagation through stimulation of senescence-associated lysosomal exocytosis. Exp. Mol. Med. 2022;54:788–800. doi: 10.1038/s12276-022-00789-x. [DOI] [PMC free article] [PubMed] [Google Scholar]
- 44.Xie Y.X., Naseri N.N., Fels J., Kharel P., Na Y., Lane D., Burré J., Sharma M. Lysosomal exocytosis releases pathogenic alpha-synuclein species from neurons in synucleinopathy models. Nat. Commun. 2022;13:4918. doi: 10.1038/s41467-022-32625-1. [DOI] [PMC free article] [PubMed] [Google Scholar]
- 45.Machado E.R., van de Vlekkert D., Sheppard H.S., Perry S., Downing S.M., Laxton J., Ashmun R., Finkelstein D.B., Neale G.A., Hu H., et al. Haploinsufficiency of the lysosomal sialidase NEU1 results in a model of pleomorphic rhabdomyosarcoma in mice. Commun. Biol. 2022;5:992. doi: 10.1038/s42003-022-03968-8. [DOI] [PMC free article] [PubMed] [Google Scholar]
- 46.Panwar P., Søe K., Guido R.V., Bueno R.V.C., Delaisse J.M., Brömme D. A novel approach to inhibit bone resorption: exosite inhibitors against cathepsin K. Br. J. Pharmacol. 2016;173:396–410. doi: 10.1111/bph.13383. [DOI] [PMC free article] [PubMed] [Google Scholar]
- 47.Panwar P., Xue L., Søe K., Srivastava K., Law S., Delaisse J.M., Brömme D. An Ectosteric Inhibitor of Cathepsin K Inhibits Bone Resorption in Ovariectomized Mice. J. Bone Miner. Res. 2017;32:2415–2430. doi: 10.1002/jbmr.3227. [DOI] [PubMed] [Google Scholar]
- 48.Kimmel C.B., Ballard W.W., Kimmel S.R., Ullmann B., Schilling T.F. Stages of embryonic development of the zebrafish. Dev. Dynam. 1995;203:253–310. doi: 10.1002/aja.1002030302. [DOI] [PubMed] [Google Scholar]
- 49.Samarut É., Lissouba A., Drapeau P. A simplified method for identifying early CRISPR-induced indels in zebrafish embryos using High Resolution Melting analysis. BMC Genom. 2016;17:547. doi: 10.1186/s12864-016-2881-1. [DOI] [PMC free article] [PubMed] [Google Scholar]
- 50.Moreno-Mateos M.A., Vejnar C.E., Beaudoin J.D., Fernandez J.P., Mis E.K., Khokha M.K., Giraldez A.J. CRISPRscan: designing highly efficient sgRNAs for CRISPR-Cas9 targeting in vivo. Nat. Methods. 2015;12:982–988. doi: 10.1038/nmeth.3543. [DOI] [PMC free article] [PubMed] [Google Scholar]
- 51.Flanagan-Steet H., Matheny C., Petrey A., Parker J., Steet R. Enzyme-specific differences in mannose phosphorylation between GlcNAc-1-phosphotransferase alphabeta and gamma subunit deficient zebrafish support cathepsin proteases as early mediators of mucolipidosis pathology. Biochim. Biophys. Acta. 2016;1860:1845–1853. doi: 10.1016/j.bbagen.2016.05.029. [DOI] [PMC free article] [PubMed] [Google Scholar]
- 52.Cadaoas J., Hu H., Boyle G., Gomero E., Mosca R., Jayashankar K., Machado M., Cullen S., Guzman B., van de Vlekkert D., et al. Galactosialidosis: preclinical enzyme replacement therapy in a mouse model of the disease, a proof of concept. Mol. Ther. Methods Clin. Dev. 2021;20:191–203. doi: 10.1016/j.omtm.2020.11.012. [DOI] [PMC free article] [PubMed] [Google Scholar]
- 53.Flanagan-Steet H., Fox M.A., Meyer D., Sanes J.R. Neuromuscular synapses can form in vivo by incorporation of initially aneural postsynaptic specializations. Development. 2005;132:4471–4481. doi: 10.1242/dev.02044. [DOI] [PubMed] [Google Scholar]
Associated Data
This section collects any data citations, data availability statements, or supplementary materials included in this article.
Supplementary Materials
Data Availability Statement
No large-scale data were generated in this study. All other data types presented in this paper will be shared by the lead contact upon request. No original code was generated in this study. Any additional information required to reanalyze the data reported in this paper is available from the lead contact upon request.