

Abstract
Objective
Ensuring proper respirator fit for individuals remains a persistent challenge in occupational environments, yet there is limited knowledge about how respirators interact with the face to “‘fit.” Previous studies have attempted to understand the association between face dimensions and respirator fit using traditional head/face anthropometry not specifically tailored for respirators. The purpose of this study was to assess and compare the ability of filtering facepiece respirator (FFR)-specific face anthropometry with traditional head/face anthropometry in exploring the relationship between facial dimensions and the fit of FFR.
Methods
The study utilized 3D face scans and quantitative fit factor scores from 56 participants to investigate the relationship between face anthropometry and FFR fit. Both FFR-specific and traditional anthropometric measurements were obtained through 3D anthropometric software. Intra-correlation of anthropometry was analyzed to evaluate the efficiency and effectiveness of FFR-specific and traditional anthropometry respectively. Principal component analysis (PCA) was conducted to test the usefulness of the PCA method for investigating various facial features. Logistic regression was used to develop fit association models by estimating the relationship between each face measurement set and the binary outcome of the fit test result. The prediction accuracy of the developed regression models was tested.
Results
FFR-specific face anthropometry consists of a set of measurements that can inform the detailed facial shape associated with the FFRs more effectively than traditional head/face anthropometry. While PCA may have been effective in reducing the variable dimensions for the relatively large parts of the human body such as upper and lower bodies in previous literature, PCA results of FFR-specific and traditional anthropometry were inconsistent and insufficient to describe face dimensions with complex anatomy in a small-detailed area, suggesting that facial shape should be understood through a variety of approaches including statistical methods. Logistic regression analysis results confirmed that the association models of FFR-specific face anthropometry were significant with higher prediction accuracy and had a better model’s goodness of fit than those of traditional head/face anthropometry in 3 conditions inputting all measurements, all PC scores, or top 5 measurements from PCA.
Conclusions
The findings showed that the FFR fit association model enables an understanding of the detailed association between face and respirator fit and allows for the development of a system to predict respirator fit success or failure based on facial dimensions. Future research would include testing the validity of the model and FFR-specific measurement set on different respirator types, expanding the population set, and developing an integrated approach using automated and machine learning technologies to inform FFR selection for occupation workers and the general population.
Keywords: face anthropometry, regression analysis, respirator fit, respirator fit prediction
What’s Important About This Paper?
To address the challenge of respirator fit, this study developed a novel set of facial anthropometry for filtering facepiece respirator fit and tested it with a respirator model. The suggested anthropometric measurements and methodology to develop an association model may improve the design of respirators so as to increase the number of workers that experience a good fit, and thus receive effective respiratory protection.
Introduction
Adequate filtering facepiece respirator (FFR) fit ensures protection in occupational settings where workers are exposed to airborne hazards (CDC 2020 Feb 11). Fit testing is a crucial step in determining the effectiveness of respirators in these settings; fit testing involves checking the seal between the respirator and the face to ensure the respirator is secure and free from leaks (OSHA 2019). The use of quantitative fit testing, which uses a condensation particle counter to measure particle leakage, provides a more accurate assessment of the fit than qualitative fit testing, which relies on the wearer’s sense of smell or taste to detect leaks. The fit factor is a numerical value that represents the effectiveness of a respirator in reducing the concentration of airborne particles inside the respirator compared to outside. A fit pass occurs when the measured fit factor meets or exceeds the pass criterion or standard set by Occupational Safety and Health Standards (OSHA), indicating that the respirator provides an adequate level of protection. A fit fail occurs when the measured fit factor falls below the pass criterion, indicating that the respirator does not provide an adequate level of protection and should not be used. The pass/fail criterion for fit testing can vary depending on the type of respirator being used and the regulatory standards applicable to the particular work environment (OSHA 2004).
Meeting the standard fit test criteria is difficult with current respirators on the market. In a previous study, researchers reported that more than half of tested respirators had less than 10% passing rates; even the 2 best performers passed only 43% and 27% of trials (Fakherpour et al. 2021). This research indicates that most of the respirators tested did not fit properly, which could lead to inadequate respiratory protection for users. Another study found that about 78% of respirator users with various demographic characteristics failed fit testing (Manganyi et al. 2017). Previous studies have identified variations in facial dimensions as important determinants of fit test results based on the correlation found between the respirator fit factor scores and face shapes (Kim et al. 2003).
However, little is known about how the FFR interacts with the face to “fit.” The human head is a particularly complicated body area, with 22 bones and dozens of muscles packed into a small space (Anderson et al. 2023; Westbrook et al. 2023). Face anthropometry is a useful tool to understand these complex structures by breaking them down into subdivisions, allowing investigation of the different facial features of individuals (Young 1993). The current respirator fit test panels are based on American facial anthropometric surveys that may not accurately represent the facial anthropometric characteristics of different races, such as Asians, which could lead to poor respirator fit for this population (Yang et al. 2007). Given this gap, face anthropometry could serve as a crucial bridge to connect the face shape and respirator fit.
Several studies seeking to understand respirator fit and face shape (Oestenstad and Perkins 1992; Kim et al. 2003; Oestenstad and Bartolucci 2010; Chu et al. 2015; Zhang et al. 2020) have repeatedly used traditional head/face anthropometry. However, traditional anthropometry was developed for general purposes and not tailored specifically for FFR, and it has not been proven to be relevant to FFR fit. This study explored the application of FFR-specific face anthropometry in comparison with traditional head/face anthropometry. We examined its usefulness for investigating the association between face dimensions and respirator fit, and the FFR-specific face anthropometry’s ability to predict an FFR fit accurately. The research objectives and questions addressed in this study were:
Objective 1: Determine the ability of FFR-specific and traditional anthropometry to capture the unique characteristics of face shape and size through correlation analysis.
◦ Question 1: Do FFR-specific face anthropometry and traditional head/face anthropometry consist of measurements that represent the unique characteristics of the face shape and size, respectively?
Objective 2: Test the effectiveness of PCA in investigating face shape and size.
◦ Question 2: Does the PCA approach effectively group facial measurements with related facial regions, enabling a better understanding of facial features?
Objective 3: Develop a face-respirator fit association model and assess the reliability and validity of FFR-specific and traditional anthropometry through regression analysis.
◦ Question 3: Do FFR-specific face anthropometry and traditional head/face anthropometry have a significant association with quantified respirator fit, respectively?
Literature review
Efforts have been made to understand the relationship between face shape and respirator fit; however, traditional head/face anthropometry has been repeatedly used without being validated for its effectiveness in investigating respirator fit (Oestenstad and Perkins 1992; Kim et al. 2003; Oestenstad and Bartolucci 2010; Chu et al. 2015; Zhang et al. 2020).
Recognizing the role of facial dimensions for respirator fit, the National Institute for Occupational Safety and Health (NIOSH) conducted a large-scale face anthropometric study to develop the first standardized respirator fit panel; this has been foundational to anthropometrics for respiratory protective devices (ISO/TS 16976-2:2015; ISO 2015). However, NIOSH’s face anthropometry uses many of the same landmarks and measurements used in traditional head/face anthropometric studies; these included a wide range of facial areas from the top of the head which is not specific to the wearing area of filtering facepiece respirators (FFRs). Although the effectiveness of this anthropometry in understanding fit has not been proven, it is the dominant face of anthropometry in the field. NIOSH used a bivariate distribution approach based on face length and face width and a principal component analysis (PCA) approach to develop a fit test panel with 18 landmarks and 19 facial dimensions, which have been a vital reference for many subsequent face anthropometric studies on respirator fit.
Despite the claim that NIOSH’s bivariate and PCA panels were based on various face shapes that encompassed different races and ages, many studies have reported low accommodation rates for diverse face groups. Researchers found that only a small number of N95 FFRs passed fit tests for the participants categorized as head sizes small, medium, and large according to the NIOSH bivariate fit test panel (Fakherpour et al. 2021). Another study showed that a considerable proportion of the Chinese participants (12% to 35%) had facial dimensions outside of the ranges derived from American fit panels, suggesting that the current respirator fit panel developed with traditional head/face anthropometry may not accurately represent the facial characteristics of various populations (Yang et al. 2007). The low accommodation rates of the fit panel raise questions regarding the effectiveness of the face anthropometry used to identify facial features of diverse populations. Previous studies have leaned heavily on bivariate or PCA panels to investigate the relationship between facial dimensional characteristics and respirator fit. However, as low accommodation issues have been continuously reported for diverse groups, more advanced and detailed methods that facilitate the investigation of correlation are required.
Several anthropometric studies that used PCA for face shape classification or face modeling (Ball et al. 2010; Luximon et al. 2012; Goto et al. 2015; Kuo et al. 2020) still have inherent flaws. PCA relies on linear transformations to extract major factors that represent facial shapes. This can lead to some loss of information and an incomplete representation of the complex shape and diverse features of the face. The inability of PCA to capture nonlinear relationships and complex interactions can limit a precise understanding of facial shape and features. Additionally, the reliability of data quality and accuracy is crucial in PCA-based anthropometric research. Errors or noise may be introduced during the collection and processing of facial measurement data, which can influence the outcomes of PCA. These limitations underscore the shortcomings of PCA-based anthropometric research on faces, emphasizing the need for alternative approaches and analysis techniques to attain more accurate and comprehensive results. In conjunction with effective face anthropometry, it is essential to prioritize acquiring precise and informative data. Although recent studies have analyzed the relationship between respirator fit and facial anthropometric dimensions using regression statistics beyond the PCA method (Kim et al. 2003; Chu et al. 2015; Zhang et al. 2020), they repeatedly used a subset of traditional head/face anthropometry whose usefulness has not been verified for exploring the relationship between face shape and respirator fit.
To address this research gap, we aimed to investigate the usefulness of FFR-specific face anthropometry specialized for respirator fit in understanding the relationship between facial features and respirator fit. We analyzed the effectiveness of FFR-specific face anthropometry and traditional head/face anthropometry in understanding respirator fit and explored the association between respirator fit and facial anthropometric dimensions using a new methodology.
Methods
Face anthropometry
In this study, we obtained FFR-specific face anthropometry and traditional head/face anthropometry (Fig. 1). Measurement definitions are provided in the Supplementary Data (S1 and S2 Appendix). FFR-specific face anthropometry was a new set of 20 anthropometric measurements specialized for FFR. It was developed based on the face-to-respirator relationship. Design for fit criteria of FFR were created for how the respirator should fit in relation to the face; the majority of the criteria were derived based on OSHA (OSHA 2004), CDC (CDC 2022), CDC (CDC 2023), as well as other FFR specific literature (Cloet et al. 2022; Niu et al. 2023). FFR-specific face anthropometry consists of measurements useful in designing the overall structure and detailed components of the respirator for facial areas such as the nose and chin, which are also integral to the respirator’s fit, seal, and comfort. FFR-specific face anthropometry included 8 linear measurements, 9 surface measurements, and three 3-point measurements. For all FFR-specific measurements and landmarks, inter-trial and inter-measurer reliabilities were validated with the standardized operating procedures by 2 measurers who have expertise in human dimension research and have extensive experience with 3D anthropometry. The measurers obtained landmarks and measurements from the 3D head scans of 5 participants with diversified characteristics such as age, gender, and body mass index. The differences between trials and measures were less than 1 mm. It confirmed that the definitions of the FFR-specific measurements are reliable during repeated measurement trials and between the different measures.
Fig. 1.
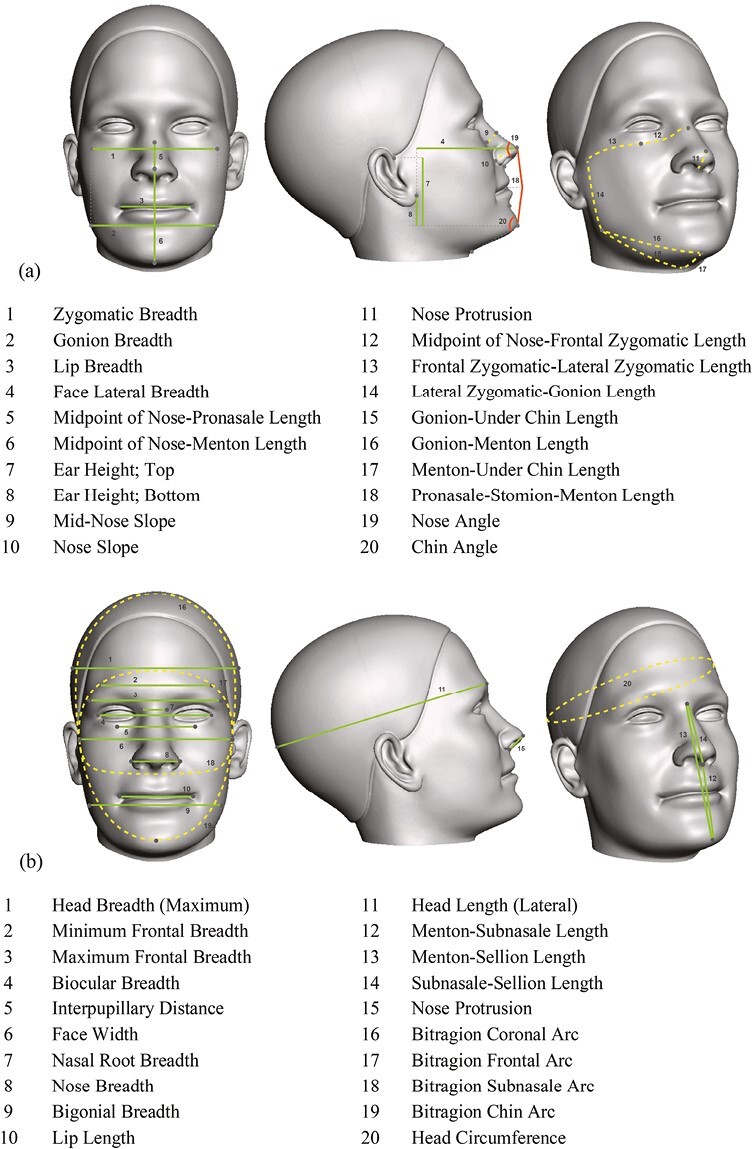
a) FFR-specific face anthropometry. b) Traditional head/face anthropometry.
Traditional head/face anthropometry included a total of 20 measurements, incorporating 18 facial measurements from ISO/TS 16976-2:2015 that specified the standard on human anthropometry for design, testing, and use of respiratory protective devices and 2 additional measurements that have been repeatedly used with ISO facial measurements in key literature related to the face anthropometry for respirator fit (Oestenstad and Perkins 1992; Han and Choi 2003; Zhuang and Bradtmiller 2005; Zhuang et al. 2005, 2011; Oestenstad et al. 2007; Oestenstad and Bartolucci 2010; ISO 2015). Traditional head/face anthropometry consisted of 15 linear measurements, 4 arc measurements, and one circumference measurement.
Data collection
Participants
This study included 56 participants: 47 healthcare workers recruited from M Health Fairview Medical Center, and 9 researchers in healthcare-related fields recruited from the University of Minnesota. To ensure the proper fit of a filtering facepiece respirator (FFR) and control other factors that may affect the respirator fit besides the face shape, all participants had experience wearing an N95 respirator, had no facial hair, and did not have respiratory and circulatory complications. Demographic information on participants, such as gender, age, and ethnicity, was collected. The age range of the participants was relatively evenly distributed, including participants in the following categories: 18 to 24 years (n = 7), 25 to 34 years (n = 12), 35 to 44 years (n = 10), 45 to 54 years (n = 10), 55 to 64 years (n = 9), and over 65 years (n = 3). The distributions of gender (45 female and 11 male) and ethnicity (50 White, 2 African American/Black, 2 Hispanic, 4 Asian, and 1 Other) were uneven because the main recruitment targeted healthcare workers, where women accounted for 70% all over the world (Boniol et al. 2019). A convenience sampling method was used due to the pandemic. Data collection occurred in May and June 2021, and it included 2 main stages: 3D face scanning to acquire the face dimensions and a quantitative fit test with FFRs to obtain individual fit factor scores.
3D face scanning
To ensure good quality face scans, participants donned a wig cap and tied their hair into a low bun if applicable to keep the face or ears from being covered by the hair. The researcher put 7 prelandmarks on the participant’s face with a washable marker to inform postlandmarking and measurements in 3D anthropometry software. Prelandmarks were the anatomical points considered important for face anthropometry or palpable rather than visual observation. Two manual measurements, face width, and face length, were obtained with a small bone caliper and an electronic digital caliper. Those measurements were for the initial dimensional accuracy inspection of face scan data before 3D anthropometric data collection (Table 1).
Table 1.
Prelandmarks and manual measurements.
| Category | Name | Definition | ||
|---|---|---|---|---|
| Prelandmark |

|
a | Tragion (R/L) | The superior point on the juncture of the cartilaginous flap (tragus) of the ear with the head |
| B | Sellion | The point of the deepest depression of the nasal bones at the top of the nose | ||
| C | Pronasale | The point of the anterior projection of the tip of the nose | ||
| D | Gonion (R/L) | The most lateral, most inferior, and most posterior point on the angle of the mandible (jawbone) | ||
| e | Menton | The inferior point of the mandible in the midsagittal plane (bottom of the chin) | ||
| Manual measurement |
|
1 | Face width | The linear distance between the left and right tragion. |
| 2 | Face length | The linear distance from sellion to menton. | ||
3D scanning was performed using an Artec Leo scanner (Artec 3D, Luxembourg, Luxembourg). Artec Leo is one of the state-of-the-art handheld 3D scanners with structured light. It features a high dimensional accuracy within a range of ISO standard (ISO 2018) allowable error for 3D face and head scan data, a fast data acquisition speed, and high resolution with texture accuracy (Artec 3D 2021). Artec Leo has been validated for head scanning and dimensional accuracy and is useful for capturing the hidden or detailed parts of the face, such as the ears and the nose, from various angles (Yu et al. 2021). For this study, the HD mode scan setting was used since it enabled capturing small elements with minimal noise and improved resolution even for hard-to-reach geometry. During scanning, participants were guided to sit in the scanning chair in the relaxed seated position, looking straight ahead. The researcher scanned the head and neck areas of the participant. To avoid face movement, participants were instructed to perform quiet, resting breathing, and keep their faces stable. Face scanning was repeated twice as a minimum to prevent any possible data fusion errors. The raw face scan data were postprocessed with Artec Studio software (Artec 3D, Luxembourg, Luxembourg) to create the OBJ and STL mesh, which are the optimal formats for 3D anthropometry software.
Quantitative fit test
Quantitative fit test was performed by using a condensation particle counter device, PortaCount Pro+ Respirator Fit Tester 8038 (TSI Inc., Shoreview, MN) following the OSHA-accepted TSI test procedures and protocols for fit testing N95 respirators (Standard 29 CFR 1910.134; OSHA 2004). This test protocol measures the fit factor scores of respirators using the ratio of ambient particles to particles in respirators, while a participant performs 7 exercises such as normal breathing, deep breathing, head side to side, head up and down, talking, bending over, and 2nd normal breathing. The overall fit factor score is determined by calculating the harmonic mean of the fit factors from each test exercise. The respirator was not adjusted once the test began, and each test exercise was performed for 1 min. To provide proper respiratory protection, OSHA requires N95 FFRs to achieve a minimum fit factor of 100 to pass the fit test; a score below 100 is considered a fail.
For this study, an alternative N95 FFR, MNmask, was used due to the critical N95 FFRs shortages at the time of study in the middle of the pandemic. MNmask is an emergency-use, protective face respirator developed by an interdisciplinary team at the University of Minnesota to address the shortage of N95 FFRs (Griffin et al. 2022). The filtration media of MNmask achieved > 95% filtration efficiency when it was tested using the method of fractional filtration efficiency over a particle size range between 0.03 and 1.0 µm (Ou et al. 2020). In quantitative fit tests for MNmask validation that included both genders and different races, MNmask had fit factor scores and pass rates comparable with N95 FFRs on average (Griffin et al. 2022).
During the study, participants were asked to wear the probe-inserted MNmask and adjust the respirator fit following the researcher’s instructions until they obtained a stable fit. After performing the user seal check, the fit test began, following the protocol. The researcher recorded the fit factor scores for each step, overall fit score, and fit test result (Pass/Fail). Among a total of 56 participants, 50% passed the fit test while the remaining 50% failed. Participants who passed achieved an average score of 404, while those who failed had an average score of 46.
3D anthropometry
The FFR-specific measurements and traditional measurements were extracted from 3D face scan data of participants using 3D anthropometric measuring software. The linear and surface measurements were obtained using Anthroscan ScanWorX software (Human Solutions GmbH, Heidelberg, Germany) and 3-point measurements were taken with Rhino 7 (Robert McNeel and Associates, Seattle, WA, USA). The measuring processes included placing digital landmarks by referring to the prelandmarks with planes or distance and then measuring the face based on the digital landmarks.
Data analysis
Data analysis included descriptive analysis of collected face measurements and fit test results. Statistical analyses such as principal component analysis (PCA) and logistic regression were used for more advanced research using SPSS Statistics version 26 (IBM Corp, Armonk, NY, USA).
Correlation analysis
Before investigating the association between face anthropometry and FFR fit, the usefulness of FFR-specific and traditional anthropometry in understanding facial characteristics was compared. For both face anthropometries, correlation analysis was performed to investigate the correlation between measurements constituting each set. Effective face anthropometry should be able to comprehensively grasp the shape and dimensional information of the face, and each measurement should provide information on various parts of the face such as the nose and under chin. In other words, the measurements in one set of anthropometry may be related to some extent in that they constitute a face, but it can be an issue if the correlation between measurements is too high; high correlations mean that nondiscriminant variables are repeated redundantly, so it can be interpreted that it is not significant to explain the complex anatomical shape of the face (Clauser et al. 1972; Kennedy 1986; Zhuang et al. 2007).
Principal component analysis (PCA)
PCA was performed separately for each of the FFR-specific and traditional (ISO standard and key literature) anthropometry. PCA is a multivariate statistical method that has been used in anthropometric studies to understand human body size and shape. PCA follows the principle of deconstructing raw data into a covariance matrix using a linear combination of principal components for dimensionality reduction (reducing the number of variables). Researchers have identified key body measurements that represent the body type of a group of people and have represented them in the 2 most important measurements (e.g. body width and body length) of a multivariate data set (Ben Azouz et al. 2006; Zakaria and Ruznan 2020). Unlike body areas (upper and lower bodices) where this method was effective, the usefulness of PCA has been less explored for facial areas. In some studies that have attempted to link respirator fit with anthropometric characteristics of the face, PCA has been used to develop or evaluate a respirator fit test panel (Zhuang et al. 2007; Chen et al. 2009) or to obtain factor scores prior to the regression stage (Chu et al. 2015).
The main purpose of PCA in this study was to test whether this dominant PCA approach has value as a statistical method for understanding the anthropometric size and shape of faces. The validity of using PCA for our dataset was checked by the Kaiser-Meyer-Olkin (KMO) Measure of Sampling Adequacy (value greater than 0.5) and Bartlett’s Test of Sphericity (p-value less than 0.01) criteria. Kaiser’s eigenvalue criterion was used to select elements with eigenvalues greater than 1.0.
Logistic regression
Logistic regression analysis was conducted to develop fit association models by estimating the relationship between each face measurement set and the fit test result. The logistic regression results were used to determine the set of facial measurements and principal components (PCs) that could be good predictors of FFR fit and thus find the most predictable model. Logistic regression is a statistical method for analyzing a dataset with independent variables that determine an outcome. It is used for classification problems, where the aim is to predict a categorical, binary response variable based on one or more predictor variables. Logistic regression models the relationship between the independent variables and the log odds of the dependent variable, which is transformed into probabilities of class membership. Logistic regression analysis provides a set of coefficients that represent the contribution of each predictor variable to the log odds of the response.
In this study, the dependent variable of logistic regression was a binary indicator of the fit test results (pass/fail). Separate trials were made for the FFR-specific and traditional anthropometry. The predictor variables included (i) all measurements, (ii) all PC scores, and (iii) the top 5 measurements from PCA analysis. Here, PCA was a method of accounting for the possible overfitting issues that may be caused by a large number of predictors compared to the number of participants by using PC score variables generated after PCA to reduce the number of independent variables. To address possible overfitting issues that may be caused by a large number of predictors compared to the number of participants, the logistic regression analysis was also performed for a reduced predictor set based on PCA results. First, we used the PC scores of each FFR-specific face anthropometry and traditional head/face anthropometry (ISO and key literature, ISO only) as predictors. Second, the analysis was performed using the key measurements with the highest Eigenvalue from each PC.
For association models with all PC scores and the top measurements from PCA, validation was conducted by randomly selecting 25 participants out of a total of 56 participants. The models with all measurements were not included in the validation process, since there could be an overfitting issue due to a relatively large number of variables to the small number of participants.
Results and discussion
Comparison between FFR-specific and traditional anthropometry
For FFR-specific and traditional anthropometry, the measurement data of 56 participants is described in the Supplementary Data (S3 Appendix) and the correlation analysis results using the data are presented in Supplementary Data (S4 Appendix). Although the same number of measurements (20) were used, FFR-specific face anthropometry has the ability to detect more facial features than traditional head/face anthropometry. The average number of measurements in which correlation was found at the significance level of 95% or higher per variable was 6.65 in FFR-specific face anthropometry and 10.85 in traditional face anthropometry. The number of measurements with correlations above the 99% significance level was significantly higher in traditional head/face anthropometry, indicating a high correlation between measurements in the traditional anthropometric set.
In FFR-specific face anthropometry, only one measurement was associated with more than 10 other measurements. However, in traditional head/face anthropometry, 12 measurements were associated with more than 10 other measurements, indicating that they are not contributing significant information on their own. In particular, the 4 bitragion arcs of traditional head/face anthropometry were closely correlated with each other at the 99% significance level, making it difficult to differentiate between them. Arc measurements also had high correlations with 15 or more other measurements, which calls into question the need for redundant measurements to understand the face. To summarize, if the 20 measurements are highly correlated like in traditional head/face anthropometry, obtaining all of them may not be efficient and effective; similar information can be explained with a smaller number of measurements, and they may not provide enough information to differentiate various face shapes.
FFR-specific face anthropometry consists of a set of measurements that can inform the shape and size of the detailed face area associated with the FFRs more efficiently and effectively, whereas traditional head/face anthropometry includes many measurements for the upper part of the head indirectly related to the FFR wearing area. In terms of ease of use for manual and 3D measuring, traditional head/face anthropometry was evaluated as less beneficial since it included palpable landmarks and long surface measurements that could lead to poor reliability and consistency by measurers. FFR-specific face anthropometry could be easily found based on a small number of prelandmarks and planes referring to them. In addition, traditional head/face anthropometry showed a high correlation between measurements, making it difficult to recognize the unique characteristics of distinguishing facial features.
Principal component analysis
PCA was conducted separately for FFR-specific face anthropometry and traditional head/face anthropometry to assess the effectiveness of the PCA approach in clustering related facial measurements with key measurements. Unlike previous studies (Song and Ashdown 2011; Lee et al. 2020; Yu and Kim 2020) where distant regions of the body showed clear separation (e.g. separation of waist, abdomen, and hip region), the application of PCA to facial measurements exhibited a tendency to group unrelated measurements together in a component for both sets of anthropometry. The first 2 components only accounted for about 35% of the variance in FFR-specific face anthropometry and 40% of the variance in traditional head/face anthropometry. The detailed PCA results are summarized in the Supplementary Data (S5 Appendix).
Logistic regression
Table 2 presents the association model’s significance, explained distribution, overall goodness of fit, and prediction results. Compared to the association model of the traditional head/face anthropometry, the FFR-specific face anthropometry association models were significant in all analyses with higher prediction accuracy and a better model’s goodness of fit. The detailed results are as follows.
Table 2.
Logistic regression results (N = 56).
| Category | Significance of model | Explained distribution | Model’s foodness of fit | Prediction results | |||
|---|---|---|---|---|---|---|---|
| χ2 | P | Cox & Snell R Square | −2 Log likelihood | Hosmer and Lemeshow Test (Sig.) | Correctly predicted % | ||
| Input all measurements | FFR | 77.632 | 0.000*** | 0.750 | 0.000a | 1.000 | 100 |
| ISO + key lit | 32.041 | 0.031* | 0.436 | 45.591a | 0.551 | 78.6 | |
| ISO | 29.147 | 0.047* | 0.406 | 48.485a | 0.400 | 82.1 | |
| Input all PCs | FFR | 12.672 | 0.049* | 0.203 | 64.960a | 0.810 | 67.9 |
| ISO + key lit | 2.767 | 0.736 | 0.048 | 74.866a | 0.276 | 60.7 | |
| ISO | 2.792 | 0.732 | 0.049 | 74.841a | 0.449 | 57.1 | |
| Input top 5 measurements from PCA† | FFR | 14.762 | 0.011* | 0.232 | 62.870a | 0.617 | 71.4 |
| ISO + key lit | 2.852 | 0.723 | 0.050 | 74.781a | 0.323 | 53.6 | |
| ISO | 2.852 | 0.723 | 0.050 | 74.781a | 0.066 | 53.6 | |
* P < 0.05 ***P < 0.00
†To make the condition equivalent (5 measurements for each FFR-specific and traditional anthropometry), the FFR-specific face anthropometry’s PC 6 was not included in the analysis.
When inputting a set of all measurements for each FFR-specific and traditional anthropometry, the model fit statistics indicated that the logistic regression model of FFR-specific face anthropometry provided a good fit to the data, with a −2 Log likelihood of 0.000. For FFR-specific face anthropometry, the Hosmer–Lemeshow goodness of fit test indicated no significant lack of fit between the observed and predicted probabilities of fit test results (P = 1.000). The FFR-specific face anthropometry model was significant at a 99% confidence level (P = 0.000), which was higher than the traditional head/face anthropometry (P = 0.031 for ISO and key literature; P = 0.047 for ISO only). The case classification results showed that the logistic regression model with FFR-specific face anthropometry correctly classified 100% of the cases in the sample, while the combination of ISO and key literature anthropometry and ISO only had 78.6% and 82.6% of correctly predicted cases respectively.
For logistic regression analyses by inputting all PCs and the top 5 measurements from PCA results, only the results of FFR-specific face anthropometry had significance with a P-value of 0.049 and 0.011, respectively. The model fit statistics indicated that the association models with FFR-specific face anthropometry provided a good fit to the data with a P-value of 0.810 and 0.617, respectively at the Hosmer–Lemeshow goodness of fit test. Both regression models with FFR-specific face anthropometry’s all PC scores and top 5 measurements showed higher accuracy of prediction than traditional head/face anthropometry; in the FFR-specific face anthropometry models, 67.9% of cases were correctly predicted, and that of the top 5 measurements predicted 71.4% of cases.
For these 3 regression models using FFR-specific face anthropometry (all measurements, all PCs, and the top 5 measurements from PCA), detailed logistic regression equations were examined to compare the exponentiated coefficient. The exponentiated coefficient, Exp(β), is an indicator that allows one to gauge the strength of the relationship between each predictor (measurement or PC) and the outcome of the respirator fit test. That is, with this equation, it is possible to understand the magnitude of a relationship between each predictor (measurement or PC) and respirator fit test result, and if a predictor has a positive or negative relationship with fit test result. All results are summarized in the Supplementary Data (S6 Appendix).
While the first regression model with all measurements had abnormally large Exp(β) values for some measurements with a potential overfitting issue, the second (all PCs) and the third (top 5 measurements from PCA) showed reliable results. Especially, the third regression model with the top 5 measurements from PCA showed the relative importance of mid-nose and chin areas (Fig. 2). The variable exerting the most substantial influence on respirator fit pass/fail was a mid-nose slope with an Exp(β) value of 1.426 (P = 0.004). The second most important measurement was ear height-top with an Exp(β) value of 0.892 (P = 0.017). In this model where we coded fit “pass” as 0 and “fail” as 1, these results implied that for every 1 mm increase in mid-nose slope and ear height-top, the likelihood of fit test failure increases 1.426 times and 0.892 times, respectively. However, it is important to note that these effect sizes pertain specifically to our logistic regression model. The usage of Exp(β) in predictive equations typically requires a substantial sample size. In our model, it serves as a means to understand the relevance and importance of each measurement concerning respirator fit.
Fig. 2.
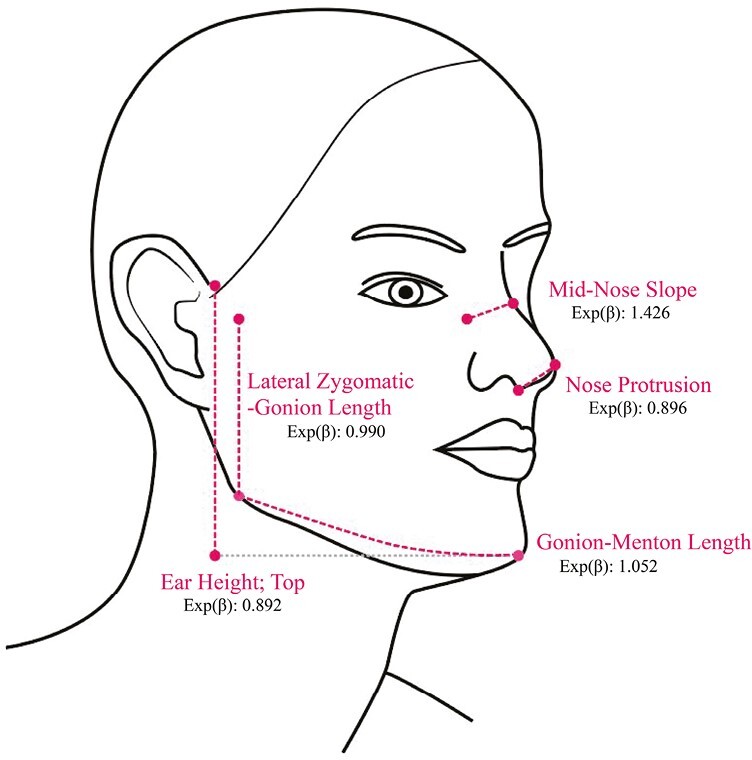
Key facial areas with the exponentiated coefficients.
Table 3 presents the validation results, which indicate that the models of FFR-specific face anthropometry with all PCs and the top 5 measurements from PCA were significant and had the highest explained distribution compared to those of traditional head/face anthropometry. The models of FFR-specific face anthropometry correctly predicted 84% of cases when using all PCs and the top 5 measurements. The models of traditional head/face anthropometry were not significant for all analyses.
Table 3.
Validation results (n = 25; randomly selected).
| Category | Significance of model | Explained distribution | Model’s goodness of fit | Prediction results | |||
|---|---|---|---|---|---|---|---|
| χ 2 | P | Cox & Snell R Square | ×2 Log likelihood | Hosmer and Lemeshow Test (Sig.) | Correctly predicted % | ||
| Input all PCs | FFR | 19.566 | 0.003 *** |
0.543 | 14.084a | 0.719 | 84.0 |
| ISO + key literature | 8.286 | 0.141 | 0.282 | 25.365a | 0.466 | 80.0 | |
| ISO | 7.555 | 0.183 | 0.261 | 26.096a | 0.205 | 72.0 | |
| Input top 5 measurements from PCA† | FFR | 16.840 | 0.005 *** |
0.490 | 16.811a | 0.830 | 84.0 |
| ISO + key literature | 8.573 | 0.127 | 0.290 | 25.078a | 0.893 | 68.0 | |
| ISO | 8.573 | 0.127 | 0.290 | 25.078a | 0.893 | 68.0 | |
*** P < 0.001.
†To make the condition equivalent (5 measurements for each FFR-specific and traditional anthropometry), the FFR-specific face anthropometry’s PC 6 was not included in the analysis.
The results of this study can be summarized as follows. The correlation analysis results showed that FFR-specific face anthropometry consisted of more effective measurements that allow one to understand unique facial characteristics associated with FFRs compared to traditional head/face anthropometry. In contrast to previous studies (Song and Ashdown 2011; Lee et al. 2020; Yu and Kim 2020) where distinct grouping of measurements into specific body regions was successful, the application of PCA to facial features proved to be ineffective. The PCA approach was not well-suited for explaining the complexities of facial features through region-based grouping. This was primarily due to the challenge in describing the relationships between facial measurements that were grouped together under the same PC, hindering a comprehensive understanding of the dimensional characteristics of the face. The unique nature of facial anatomy, with its intricate and varied features, posed difficulties in applying a straightforward region-based approach through PCA. Unlike other body parts where clear anatomical associations exist, the face has numerous distinctive measurements that may not necessarily align with a simple grouping criterion. This complexity made it challenging to establish meaningful patterns and correlations through the PCA analysis, which are essential for region-based categorizations. In logistic regression analysis proposed as an advanced method to develop a face-respirator fit association model, FFR-specific face anthropometry models consistently exhibited significance across all analyses. In contrast, the traditional head/face anthropometry models did not demonstrate the same level of significance. The FFR-specific measurements had higher prediction accuracy for respirator fit success/failure than traditional measurements. Logistic regression results provided critical insights including key facial measurements with more substantial coefficients in relation to respirator fit test results and the specific impact of each facial measurement on fit test outcome in the association model.
Conclusions
This study aimed to address the limitations of traditional head/face anthropometry and standardized anthropometric research in effectively examining facial dimensions in relation to the fit of a filtering facepiece respirator (FFR). The objective of this research was to analyze the ability of FFR-specific face anthropometry to capture facial features associated with FFR fit compared to traditional head/face anthropometry. This study also sought to explore the applicability of PCA in analyzing the anthropometric characteristics of the face and to comprehensively investigate the association between respirator fit factors and facial measurements using precise and reliable quantitative measures.
The findings of this study highlight the effectiveness and practicality of FFR-specific face anthropometry in examining FFR fit. Moreover, it sheds light on the limitations of the prevailing PCA-based methods used for investigating facial shapes (Ball et al. 2010; Luximon et al. 2012; Goto et al. 2015; Kuo et al. 2020), emphasizing their inadequacy in comprehending intricate facial features. The regression-based approach employed in this research establishes a solid foundation for exploring the specific impact of different facial regions on the success or failure of respirator fit through the development of a face-respirator fit association model.
This study contributes to the advancement of knowledge in this field, paving the way for alternative approaches and progress in effectively understanding and characterizing facial shapes. Its significance lies in its comprehensive and systematic approach, which sets it apart from previous literature (Oestenstad and Perkins 1992; Kim et al. 2003; Oestenstad and Bartolucci 2010; Chu et al. 2015; Zhang et al. 2020) that heavily relied on ineffective traditional head/face anthropometry. In contrast, this study developed, validated, and implemented a tailored face anthropometry specifically designed for FFRs, followed by an investigation to develop a fit association model.
This study was limited to a small number of participants and the majority of them were of White ethnicity. Further studies will include a larger number of and more diverse participants. Further exploration needs to apply FFR-specific face anthropometry to a wider range of respirator types since this study focused on a single FFR (MNmask), that is not commercially available. The regression analysis-based association model presented in this study has the potential to advance into a respirator fit prediction model by leveraging larger datasets. This advancement would enable the development of a system that assesses the success or failure of respirator fit based on facial characteristics, integrating automated measuring technologies and machine learning. One possible approach could involve developing prediction algorithms based on the top 5 measurements of FFR-specific face anthropometry for a broad population, encompassing diverse mask types. This system could be applied for respirator users such as occupational hygienists or even the general public in assessing whether a particular respirator will provide an adequate fit for an individual.
This study holds significance in its contribution to public health by providing the foundation to reduce the risks posed by respiratory viruses resulting from inadequate FFR fit on the face. Understanding FFR fit not only aids in the preparation against respiratory viruses in healthcare and postpandemic scenarios but also paves the way for the development of enhanced respirator fit testing methods based on face shape. These endeavors will enhance the safety of workers who depend on respiratory protective devices within their work environments, promoting more accurate and effective protection measures.
Supplementary Material
Contributor Information
Minji Yu, College of Design, University of Minnesota, 1985 Buford Ave, 240 McNeal Hall, Saint Paul, MN 55108, United States.
Linsey Griffin, College of Design, University of Minnesota, 1985 Buford Ave, 240 McNeal Hall, Saint Paul, MN 55108, United States.
William K Durfee, Department of Mechanical Engineering, University of Minnesota, 111 Church Street SE, Minneapolis, MN 55455, United States.
Susan Arnold, Division of Environmental Health Sciences, School of Public Health, University of Minnesota, 420 Delaware Street SE, Minneapolis, MN 55455, United States.
Funding
Funding for this research was provided by the University of Minnesota Institute for Engineering in Medicine and the University of Minnesota Office of Discovery and Translation. This research was supported by the National Institutes of Health’s National Center for Advancing Translational Sciences, grant UL1TR002494. The content is solely the responsibility of the authors and does not necessarily represent the official views of the National Institutes of Health’s National Center for Advancing Translational Sciences. This research was supported in part by the intramural research program of the U.S. Department of Agriculture, National Institute of Food and Agriculture, Minnesota Agriculture Experiment Station #7002592. The findings and conclusions in this publication have not been formally disseminated by the U. S. Department of Agriculture and Should not be construed to represent any agency determination or policy.
Conflict of interest
The authors declare that they have no known competing financial interests or personal relationships that could have appeared to influence the work reported in this paper.
Data availability
The data underlying this article will be shared on reasonable request to the corresponding author.
References
- Anderson BW, Kortz MW, Al Kharazi KA.. Anatomy, head and neck, skull. In: StatPearls. Treasure Island (FL): StatPearls Publishing; 2023. [accessed 2023 Apr 16]. http://www.ncbi.nlm.nih.gov/books/NBK499834/ [PubMed] [Google Scholar]
- Artec 3D. Wireless Handheld 3D Scanner | Artec Leo | Best 3D Scanning Solutions. 2021. [accessed 2021 Mar 17]. https://www.artec3d.com/portable-3d-scanners/artec-leo
- Ball R, Shu C, Xi P, Rioux M, Luximon Y, Molenbroek J.. A comparison between Chinese and Caucasian head shapes. Appl Ergon. 2010:41(6):832–839. 10.1016/j.apergo.2010.02.002 [DOI] [PubMed] [Google Scholar]
- Ben Azouz Z, Rioux M, Shu C, Lepage R.. Characterizing human shape variation using 3D anthropometric data. Vis Comput. 2006:22(5):302–314. 10.1007/s00371-006-0006-6 [DOI] [Google Scholar]
- Boniol M, McIsaac M, Xu L, Wuliji T, Diallo K, Campbell J.. WHO | Gender equity in the health workforce: analysis of 104 countries. 2019. [accessed 2020 Oct 30]. http://apps.who.int/bookorders
- CDC. Types of masks and respirators. Cent Dis Control Prev. 2020. [accessed 2023 Apr 3]. https://www.cdc.gov/coronavirus/2019-ncov/prevent-getting-sick/types-of-masks.html.
- CDC. How to use Your N95 respirator. Cent Dis Control Prev. 2022. [accessed 2023 Jun 27]. https://www.cdc.gov/coronavirus/2019-ncov/prevent-getting-sick/use-n95-respirator.html.
- CDC. Masks and Respirators. CDC.:1–12. 2023. [accessed 2023 Jun 28]. https://www.cdc.gov/coronavirus/2019-ncov/prevent-getting-sick/types-of-masks.html
- Chen W, Zhuang Z, Benson S, Du L, Yu D, Landsittel D, Wang L, Viscusi D, Shaffer RE.. New respirator fit test panels representing the current Chinese Civilian Workers. Ann Occup Hyg. 2009:53(3):297–305. 10.1093/annhyg/men089 [DOI] [PubMed] [Google Scholar]
- Chu C-H, Huang S-H, Yang C-K, Tseng C-Y.. Design customization of respiratory mask based on 3D face anthropometric data. Int J Precis Eng Manuf. 2015:16(3):487–494. 10.1007/s12541-015-0066-5 [DOI] [Google Scholar]
- Clauser CE, Tucker P, McConville JT, Churchill E, Laubach LL, Reardon J.. Anthropometry of Air Force women. Ohio: Aerospace Medical Research Laboratory Wright-Patterson Air Force Base; 1972. [Google Scholar]
- Cloet A, Griffin L, Yu M, Durfee W.. Design considerations for protective mask development: a remote mask usability evaluation. Appl Ergon. 2022:102: 103751. 10.1016/j.apergo.2022.103751 [DOI] [PMC free article] [PubMed] [Google Scholar]
- Fakherpour A, Jahangiri M, Seif M, Charkhand H, Abbaspour S, Floyd EL.. Quantitative fit testing of filtering face-piece respirators during the COVID-19 pandemic reveals anthropometric deficits in most respirators available in Iran. J Environ Health Sci Eng. 2021:19(1):805–817. 10.1007/s40201-021-00648-3 [DOI] [PMC free article] [PubMed] [Google Scholar]
- Goto L, Lee W, Song W, Molenbroek J, Goossens R.. Analysis of a 3D anthropometric data set of children for design applications. In: Proceedings 19th Triennial Congress of the IEA. Melbourne; 2015.
- Griffin L, Yu M, Cloet A, Arnold S, Carlson N, Hillmyer M, Ou Q, Pei C, Cao Q, Pui Det al. Protective masks utilizing nonendangered components. J Med Dev. 2022:16(1):015001. 10.1115/1.4053720 [DOI] [PMC free article] [PubMed] [Google Scholar]
- Han D-H, Choi K-L.. Facial dimensions and predictors of fit for half-mask respirators in Koreans. AIHA J. 2003:64(6):815–822. 10.1202/501.1 [DOI] [PubMed] [Google Scholar]
- ISO. ISO/TS 16976-2 Respiratory protective devices- Human Factors- Part 2: Anthropometrics. 2015. [accessed 2022 Jun 8]. https://www.iso.org/standard/67529.html
- ISO. ISO 20685-1:2018 3-D scanning methodologies for internationally compatible anthropometric databases—Part 1: Evaluation protocol for body dimensions extracted from 3-D body scans. 2018. [accessed 2021 Mar 3]. https://www.iso.org/standard/63260.html
- Kennedy KW. A Collation of United States Air Force Anthropometry. Report No.: ADA168485. 1986. [accessed 2023 Apr 18]. https://apps.dtic.mil/sti/citations/ADA168485
- Kim H, Han D-H, Roh Y-M, Kim K, Park Y-G.. Facial anthropometric dimensions of Koreans and their associations with fit of quarter-mask respirators. Ind Health. 2003:41(1):8–18. 10.2486/indhealth.41.8 [DOI] [PubMed] [Google Scholar]
- Kuo C-C, Wang M-J, Lu J-M.. Developing sizing systems using 3D scanning head anthropometric data. Measurement. 2020:152: 107264. 10.1016/j.measurement.2019.107264 [DOI] [Google Scholar]
- Lee KS, Song HK, Kim S.. Categorization of lower body shapes of abdominal obese men using a script-based 3D body measurement software. Fash Text. 2020:7(1):3. 10.1186/s40691-019-0199-8 [DOI] [Google Scholar]
- Luximon Y, Ball R, Justice L.. The 3D Chinese head and face modeling. Comput-Aided Des. 2012:44(1):40–47. 10.1016/j.cad.2011.01.011 [DOI] [Google Scholar]
- Manganyi J, Wilson KS, Rees D.. Quantitative respirator fit, face sizes, and determinants of fit in South African diagnostic laboratory respirator users. Ann Work Expo Health. 2017:61(9):1154–1162. 10.1093/annweh/wxx077 [DOI] [PubMed] [Google Scholar]
- Niu X, Koehler RH, Yermakov M, Grinshpun SA.. Assessing the fit of N95 filtering facepiece respirators fitted with an ear loop strap system: a pilot study. Ann Work Expo Health. 2023:67(1):50–58. 10.1093/annweh/wxac051 [DOI] [PMC free article] [PubMed] [Google Scholar]
- Oestenstad RK, Bartolucci AA.. Factors affecting the location and shape of face seal leak sites on half-mask respirators. J Occup Environ Hyg. 2010:7(6):332–341. 10.1080/15459621003729909 [DOI] [PubMed] [Google Scholar]
- Oestenstad RK, Elliott LJ, Beasley TM.. The effect of gender and respirator brand on the association of respirator fit with facial dimensions. J Occup Environ Hyg. 2007:4(12):923–930. 10.1080/15459620701709619 [DOI] [PubMed] [Google Scholar]
- Oestenstad RK, Perkins LL.. An assessment of critical anthropometric dimensions for predicting the fit of a half-mask respirator. Am Ind Hyg Assoc J. 1992:53(10):639–644. 10.1080/15298669291360283 [DOI] [PubMed] [Google Scholar]
- OSHA. 1910.134 App A—Fit testing procedures. US Dep Labor. 2004. [accessed 2022 Mar 3]. https://www.osha.gov/laws-regs/regulations/standardnumber/1910/1910.134AppA [Google Scholar]
- OSHA. 1910.134—Respiratory protection. 2019. [accessed 2023 Apr 3]. https://www.osha.gov/laws-regs/regulations/standardnumber/1910/1910.134
- Ou Q, Pei C, Chan Kim S, Abell E, Pui DYH.. Evaluation of decontamination methods for commercial and alternative respirator and mask materials—view from filtration aspect. J Aerosol Sci. 2020:150: 105609. 10.1016/j.jaerosci.2020.105609 [DOI] [PMC free article] [PubMed] [Google Scholar]
- Song HK, Ashdown SP.. Categorization of lower body shapes for adult females based on multiple view analysis. Text Res J. 2011:81(9):914–931. 10.1177/0040517510392448 [DOI] [Google Scholar]
- Westbrook KE, Nessel TA, Hohman MH, Varacallo M. Anatomy, head and neck: facial muscles. In: StatPearls. Treasure Island (FL): StatPearls Publishing; 2023. [accessed 2023 Apr 16]. http://www.ncbi.nlm.nih.gov/books/NBK493209/ [PubMed] [Google Scholar]
- Yang L, Shen H, Wu G.. Racial differences in respirator fit testing: a pilot study of whether American fit panels are representative of Chinese faces. Ann Occup Hyg. 2007:51(4):415–421. 10.1093/annhyg/mem005 [DOI] [PubMed] [Google Scholar]
- Young JW. 1993. Head and face anthropometry of adult U.S. Civilians. Civil Aerospace Medical Institute Report No.: DOT/FAA/AM-93/10 [accessed 2023 Apr 16]. https://rosap.ntl.bts.gov/view/dot/21363
- Yu M, Cloet A, Arnold J, Griffin L.. Comparison of portable 3D face scanning technologies: a pilot study. In: Human Factors Ergonomic Society 65th International Annual Meeting. Baltimore, Maryland; 2021.
- Yu M, Kim D-E.. Body shape classification of Korean middle-aged women using 3D anthropometry. Fash Text. 2020:7(1):35. 10.1186/s40691-020-00223-8 [DOI] [Google Scholar]
- Zakaria N, Ruznan WS.. 4 - Developing apparel sizing system using anthropometric data: body size and shape analysis, key dimensions, and data segmentation. In: Zakaria N, Gupta D, editors. Anthropometry, apparel sizing and design. 2nd ed. Woodhead Publishing. (The Textile Institute Book Series); 2020. p. 91–121 [accessed 2023 Apr 16]. https://www.sciencedirect.com/science/article/pii/B9780081026045000044 [Google Scholar]
- Zhang X, Jia N, Wang Z.. The relationship between the filtering facepiece respirator fit and the facial anthropometric dimensions among Chinese people. Ind Health. 2020:58(4):318–324. 10.2486/indhealth.2019-0158 [DOI] [PMC free article] [PubMed] [Google Scholar]
- Zhuang Z, Benson S, Lynch S, Palmiero A, Roberge R.. Laboratory study to assess causative factors affecting temporal changes in filtering facepiece respirator fit: Part I—pilot study. J Occup Environ Hyg. 2011:8(12):729–739. 10.1080/15459624.2011.627294 [DOI] [PubMed] [Google Scholar]
- Zhuang Z, Bradtmiller B.. Head-and-face anthropometric survey of U.S. respirator users. J Occup Environ Hyg. 2005:2(11):567–576. 10.1080/15459620500324727 [DOI] [PubMed] [Google Scholar]
- Zhuang Z, Bradtmiller B, Shaffer RE.. New respirator fit test panels representing the current U.S. civilian work force. J Occup Environ Hyg. 2007:4(9):647–659. 10.1080/15459620701497538 [DOI] [PubMed] [Google Scholar]
- Zhuang Z, Coffey CC, Ann RB.. The effect of subject characteristics and respirator features on respirator fit. J Occup Environ Hyg. 2005:2(12):641–649. 10.1080/15459620500391668 [DOI] [PubMed] [Google Scholar]
Associated Data
This section collects any data citations, data availability statements, or supplementary materials included in this article.
Supplementary Materials
Data Availability Statement
The data underlying this article will be shared on reasonable request to the corresponding author.