

Abstract
Objective:
Alcohol overservice at on-premises establishments is associated with driving while intoxicated, violence, and other harms. This study examined rates of alcohol overservice and service refusal among licensed on-premises establishments in northern California and characteristics of establishments, servers, and pseudo-patrons (PPs) that may be associated with service refusal.
Method:
In 2022, 300 licensed on-premises establishments were sampled in nine counties representing the San Francisco Bay Area. From July 2022 to January 2023, PP and observer teams visited each establishment, and PPs attempted to buy alcohol while displaying obvious signs of intoxication. The outcome of each purchase attempt; characteristics of establishments, servers, and PPs; and month, day, and time were recorded. Descriptive and regression analyses were conducted to address study objectives.
Results:
Twentyone percent of the establishments refused alcohol service to PPs. No establishment or server characteristics were significantly associated with service refusal in logistic regression analysis, nor were month, day, or time. However, service refusal was significantly more likely among female PPs (odds ratio = 3.71, 95% CI [1.67, 8.24], p < .01) and PPs displaying obvious or very obvious signs of intoxication (odds ratio = 9.28, 95% CI [1.99, 43.40], p < .01). There was no significant interaction effect of PP × Server Gender on the likelihood of service refusal.
Conclusions:
This study indicates that alcohol overservice to obviously intoxicated patrons remains common at licensed on-premises establishments. Mandatory responsible beverage service training of servers and enforcement of alcohol overservice laws are needed to reduce overservice and related harms.
Alcohol intoxication increases the likelihood of harm to oneself and others (Bellis et al., 2015; Greenfield et al., 2014; Rehm et al., 2017) and imposes a strain on emergency services such as law enforcement, ambulance crews, and hospitals. In the United States, alcohol-related crashes represent 31% of all traffic crashes, and 42.5% of all traffic crash fatalities among males are attributable to alcohol (World Health Organization, 2021). A 2017 study of hospitals in Australia and New Zealand found that nearly 1 in every 10 admissions to emergency departments was alcohol related (Egerton-Warburton et al., 2018). This burden is especially acute during times when alcohol consumption is higher, such as on weekends in on-premises licensed alcohol establishments like bars and nightclubs (Institute of Alcohol Studies, 2015). On-premises establishments have been found to be associated with more hourly drinks consumed compared with off-premises establishments (Anderson Goodell et al., 2022).
The issue is exacerbated by licensed establishments serving alcohol to intoxicated patrons. In 1993, an Australian study concluded that serving bar customers who were clearly intoxicated was significantly associated with harm and was the most influential factor in predicting such outcomes (Stockwell et al., 1993). Alcohol overservice at on-premises establishments is associated with driving while intoxicated and other problems including violence. According to a 2009 study, drivers coming from bars were involved in more than half of the occurrences of impaired driving (Naimi et al., 2009). In addition, alcohol intoxication in on-premises establishments has been linked to injuries (Macdonald et al., 2006) and physical and sexual assault (Graham et al., 2006).
Serving intoxicated patrons is illegal in all but two of the U.S. states (Florida and Nevada). Police enforcement of alcohol overservice is associated with fewer alcohol-impaired-driving fatal crashes in urban–suburban communities within their jurisdictional boundaries, and in small town–rural communities within a 10-mile buffer (Lenk et al., 2021), but enforcement is relatively rare. Studies have shown that individuals posing as intoxicated patrons were served alcohol in on-premise establishments in a majority of purchase attempts (Buvik & Rossow, 2015; Gosselt et al., 2013; Grube et al., 2021; Lenk et al., 2006; Toomey et al., 2004, 2016). Factors found to be associated with continued service or overservice of alcohol to pseudo-intoxicated patrons vary across studies. These include poor lighting, high noise level, pseudo-patron (PP) gender (Buvik & Rossow, 2015), age of server (Toomey et al., 2016) and of PP (Woodall et al., 2018), the night of the week (Quigg et al., 2022), length of employment of the manager (Lenk et al., 2006), and a desire to maintain a pleasant atmosphere by avoiding conflict (Buvik, 2013).
There is significant potential for alcohol servers to reduce the level of harm related to drinking, but research to date has yet to identify what factors need to be addressed to predictably improve server behavior. This study further examines characteristics of on-premises establishments (e.g., license type and type or style of establishment), alcohol servers, and pseudo-intoxicated patrons that may be associated with overservice or service refusal to inform overservice prevention strategies.
Method
Sample of on-premises licensed outlets
The sample of licensees was taken from all those with either beer and wine or general (including distilled spirits) licenses in the nine California counties that constitute the San Francisco Bay Area. These are the counties that surround the bay and include metropolitan areas (e.g., San Francisco, San Jose), rural areas of Napa and Sonoma Counties, and suburban communities in Marin, the East Bay, and the San Francisco Peninsula. Altogether, these counties comprise nearly 8 million people and approximately 10,600 outlets licensed to sell alcohol for consumption on premise.
A multistage sample of 300 outlets was created with an initial random sample of 60 outlets from publicly available online lists of licensees published by the state Department of Alcoholic Beverage Control. Four more outlets were randomly selected from within the same zip code areas as the 60 “seeds.” This procedure was intended to make data collection more efficient by reducing travel time between outlets. Anticipating the possibility that some outlets would be permanently closed because of the COVID pandemic, field teams were given a short list of randomly selected “replacements” from the same zip code that they could use when necessary.
Pseudo-patron protocol and data collection
Eight young adults were hired and trained to be alternating PP buyers and observers. Training included practice visits to licensed on-premises establishments near the study offices in Berkeley, California. During data collection, PP and observer teams visited a cluster of five outlets on Thursday, Friday, and Saturday nights from July 2022 to January 2023. During each visit, a PP would feign intoxication by displaying obvious intoxication cues and record whether they were served a drink (beer), which would be illegal were it a truly intoxicated patron. This technique was used in more than 2,500 buying attempts by McKnight (1993), as well as adopted by others who have evaluated responsible beverage service (RBS) training programs in the United States, Canada, and European countries (e.g., Gosselt et al., 2013; Quigg et al., 2022; Toomey et al., 2005, 2016; Wallin et al., 2002). PP assessments present the server with the most overt situation in which service is supposed to be refused (i.e., when a patron is displaying clear signs of intoxication).
The observer entered the premise first, ordered a nonalcoholic beverage, and recorded characteristics of the premise environment (e.g., type of establishment, approximate number of patrons and staff). The PP entered the establishment exhibiting the signs of intoxication they were trained to present (e.g., fumbling with keys and cash, swaying, slurred speech, stumbling) and attempted to order and purchase a standard beer. The observer recorded the nature of the interaction between PP and server and whether the apparently intoxicated PP received alcohol service. The observer also recorded the extent to which the PP exhibited all the trained behaviors of intoxication. The PP also recorded details of the interaction with the server after exiting the establishment. All data were recorded by PPs and observers using tablet computers given to facilitate data entry.
The PP recorded whether service was made as well as whether there were any comments expressing concern or worries about the apparent condition of the PP, whether food was offered, and whether the server made a joke about it (a rare occurrence). The PP also noted whether they were refused entry, whether any other staff or manager were brought into the interaction, and whether any other patrons in the establishment engaged in the buyer–server interaction. The PP recorded the server's estimated age, ethnicity, race, and gender.
The observer recorded date and time of the visit and whether the outlet was a restaurant, restaurant with a separate bar, or just a bar. They recorded establishment types using categories from the National Restaurant Association (e.g., casual with table service, fast casual ordering from a counter, fine dining). Observers noted how busy the business was and estimated the number of staff and patrons. They also recorded how obvious the PP's display of intoxication was and different signs of intoxication displayed.
Study variables
Alcohol overservice. A dichotomous variable was created to indicate whether alcohol was served to PPs (0 = alcohol service, 1 = alcohol service refusal).
License type. Establishments were classified by license type (beer/wine or general).
Establishment types. Observers recorded whether the establishment was a restaurant, restaurant with a separate bar, or just a bar. Two dummy variables were created to represent bars and restaurants, with a bar area with restaurant as the referent category. Establishments were also characterized using 10 categories from the National Restaurant Association (e.g., sports bar, brewpub, nightclub, theme bar/restaurant, hotel bar, casual restaurant with table service, fast casual restaurant with ordering from a counter, upscale/fine dining restaurant). These variables were dummy coded, but the characteristics were not mutually exclusive.
Activity in establishments. Observers rated how busy each establishment was on a 4-point ordinal scale (1 = quiet to 4 = very busy) and estimated the number of staff and patrons.
Warning signs. Observers recorded whether there were obvious warning signs indicating that (a) anyone under 21 years of age would not be allowed in the establishment or would not be served alcohol, and (b) alcohol was a risk for cancer and for someone who is pregnant. Both of these variables were dummy coded (0 = no, 1 = yes).
Server characteristics. PPs recorded the type of staff who were engaged during the purchase attempts (e.g., bartender, table server, manager, bouncer/security). Because the majority of staff engaged were bartenders or table servers, these two variables were dummy coded and other types of staff combined were the referent group. PPs also recorded the server's approximate age, gender, ethnicity, and race.
Pseudo-patron characteristics. PP's gender was recorded. All PPs were young adults (21–29 years old). The number of PPs in different ethnic/racial categories was too small to be included in analyses.
Display of intoxication. Observers recorded how obvious the PP's display of intoxication was on a 5-point scale (1 = not at all obvious to 5 = very obvious). Because of the skewed distribution and no PP buyers being classified as having a “not at all obvious” display of intoxication, this variable was dichotomized (0 = slightly/somewhat obvious, 1 = obvious/very obvious).
Signs of intoxication. Observers also recorded whether PPs displayed seven different signs of intoxication (e.g., slurred speech, stumbling, dropped ID or money). These indicators were summed to create an overall measure of signs of intoxication.
Time of data collection. The date and time of each establishment visit was recorded. From the dates we created separate variables for month, day, and hour of each establishment visit.
Data analysis
Analyses were based on establishments with complete data for all study variables (N = 295). Establishment-level PP and observer data were combined for analyses. Descriptive statistics were first examined for all study variables. Because of the fairly large number of study variables, we conducted two-step cluster analysis through an iterative process to determine whether subsets of study variables could be used to classify establishments. Logistic regression analysis was then conducted to determine whether cluster type and other study variables were associated with refusal of alcohol service. An initial regression model included a PP Gender × Server Gender interaction term along with other study variables to assess possible differences in alcohol service refusal based on the gender of PPs and servers. All analyses were conducted in IBM SPSS Statistics for Windows, Version 27 (IBM Corp., Armonk, NY).
Results
Descriptive statistics
Descriptive statistics for study variables are provided in Table 1. Of 295 attempts by PPs to purchase an alcoholic beverage, 234 (79%) resulted in service; this was also true for all 300 attempts, although five establishments did not have complete data for other study variables. Of the establishment characteristics, only upscale fine dining restaurant was associated with alcohol service refusal (i.e., refused to serve PP when displaying intoxication cues), as service was refused at 32.6% of these establishments. No server characteristics were associated with alcohol service refusal. A significantly higher percentage of female PPs were refused service (30.7%) compared with male PPs (7.8%). PPs who displayed obvious or very obvious signs of intoxication were also significantly more likely to be refused service (26.6%) compared with PPs who displayed slightly or somewhat obvious signs of intoxication (2.7%). The number of signs of intoxication was not associated with service refusal. A higher refusal rate was observed in August (27.6%) relative to other months combined (15.5%). No other time variables were related to alcohol service refusal.
Table 1.
Sample characteristics by alcohol overservice status, % or M (SD)

| Variable | Total sample (N = 295)a | Refusal of serviceb | Alcohol overserviceb |
|---|---|---|---|
| Total sample (N = 295), % | – | 20.7 | |
| Establishment characteristics, % | |||
| Beer/wine license (n = 161) | 54.6 | 21.1 | |
| General license (n = 134) | 45.4 | 20.1 | |
| Restaurant with no bar area (n = 134) | 45.3 | 20.1 | |
| Restaurant with bar area (n = 129) | 43.7 | 20.9 | |
| Bar (n = 32) | 10.8 | 21.9 | |
| Sports bar (n = 28) | 9.5 | 21.4 | |
| Theme bar/restaurant (n = 51) | 17.3 | 15.7 | |
| Brewpub (n = 11) | 3.7 | 27.3 | |
| Winery/wine bar (n = 7) | 2.4 | 28.6 | |
| Dive bar (n = 24) | 8.1 | 25.0 | |
| Hotel bar (n = 8) | 2.7 | 0.0 | |
| Music bar/nightclub (n = 13) | 4.4 | 38.5 | |
| Upscale/fine dining (n = 46) | 15.6 | 32.6* | |
| Fast casual/fast food (n = 78) | 26.4 | 24.4 | |
| Casual dining w/table service (n = 169) | 57.3 | 18.3 | |
| Establishment activity, M (SD) | 2.2 (1.1) | 2.2 (1.1) | 2.2 (1.1) |
| Number of patrons | 18.4 (20.9) | 20.9 (25.0) | 17.7 (19.7) |
| Number of staff | 4.4 (3.8) | 4.9 (5.5) | 4.2 (3.1) |
| Warning sign—under 21 (n = 20), % | 6.8 | 15.0 | |
| Warning sign—pregnancy/cancer (n = 104), % | 35.3 | 23.1 | |
| Server characteristics, % | |||
| Bartender (n = 117) | 39.7 | 20.5 | |
| Server (n = 126) | 42.7 | 16.7 | |
| Age, in years, M (SD) | 35.3 (11.1) | 35.7 (10.5) | 35.2 (11.2) |
| Male (n = 156) | 52.9 | 21.8 | |
| Race/ethnicity | |||
| Hispanic/Latino (n = 95) | 32.2 | 22.1 | |
| Asian (n = 92) | 31.2 | 21.7 | |
| Black (n = 10) | 3.4 | 20.0 | |
| White (n = 100) | 33.9 | 18.0 | |
| Other race (n = 74) | 25.1 | 25.7 | |
| Unknown race (n = 19) | 6.4 | 10.5 | |
| Pseudo-patron characteristics, % | |||
| Female (n = 166)c | 56.3 | 30.7** | |
| Obvious/very obvious display of intoxication (n = 222)c | 75.3 | 26.6** | |
| Signs of intoxication, M (SD) | 3.8 (1.1) | 4.1 (1.0) | 3.8 (1.1) |
| Month, % | |||
| July (n = 60)c | 20.3 | 11.7 | |
| August (n = 127)c | 43.1 | 27.6** | |
| September (n = 101)c | 34.2 | 16.8 | |
| October–January (n = 7)c | 2.4 | 28.6 | |
| Day, % | |||
| Thursday (n = 95)c | 32.2 | 21.1 | |
| Friday (n = 109)c | 36.9 | 18.3 | |
| Saturday (n = 91)c | 30.8 | 23.1 | |
| Hour, % | |||
| 5–7 P.M. (n = 68)c | 23.1 | 27.9 | |
| 7–8 P.M. (n = 130)c | 44.1 | 19.2 | |
| 8–10 P.M. (n = 97)c | 32.9 | 17.5 |
Notes: Significance tests are based on comparisons of percentages or means for study variables among establishments that did and did not serve alcohol to pseudo-patrons.
Percentage or mean in the total sample of establishments (i.e., column percentage or mean). All means are for the total sample of establishments;
percentage within each establishment, server, and pseudo-patron characteristic or time period (i.e., row percentage);
subsample size (n) represents the number of establishments visited by pseudo-patrons with each characteristic (e.g., female) or number of establishments visited in each period (month, day, hour).
p < .05;
p < .01.
Cluster analysis
We used two-step cluster analysis to determine whether study variables could be used to classify different types of establishments and thereby reduce the number of study variables. The initial model included all study variables and indicated two clusters based on Schwarz's Bayesian Criterion, but only had a fair model fit. Variables that were least strongly associated with the two clusters were dropped from the analysis in a stepwise manner with three subsequent model iterations, yielding a final model with 16 variables indicating establishment characteristics (e.g., license and establishment types, server type, number of staff and patrons) that distinguished the two clusters of establishments with a good model fit (see results in Supplemental Table 1). Characteristics that most clearly distinguished the two clusters were license type (beer/wine vs. general) and bar versus restaurant with or without a separate bar area. The cluster variable was coded 0 for characteristics including beer/wine license, restaurant, fewer staff and patrons, and a table server (n = 161); and 1 for characteristics including general license, bar, greater number of staff and patrons, and bartender (n = 134). We note that three types of establishments (upscale/fine dining, casual restaurant with table service, theme bar/restaurant) did not help to distinguish the two clusters and were therefore examined separately along with other study variables in regression analyses.
Logistic regression analysis
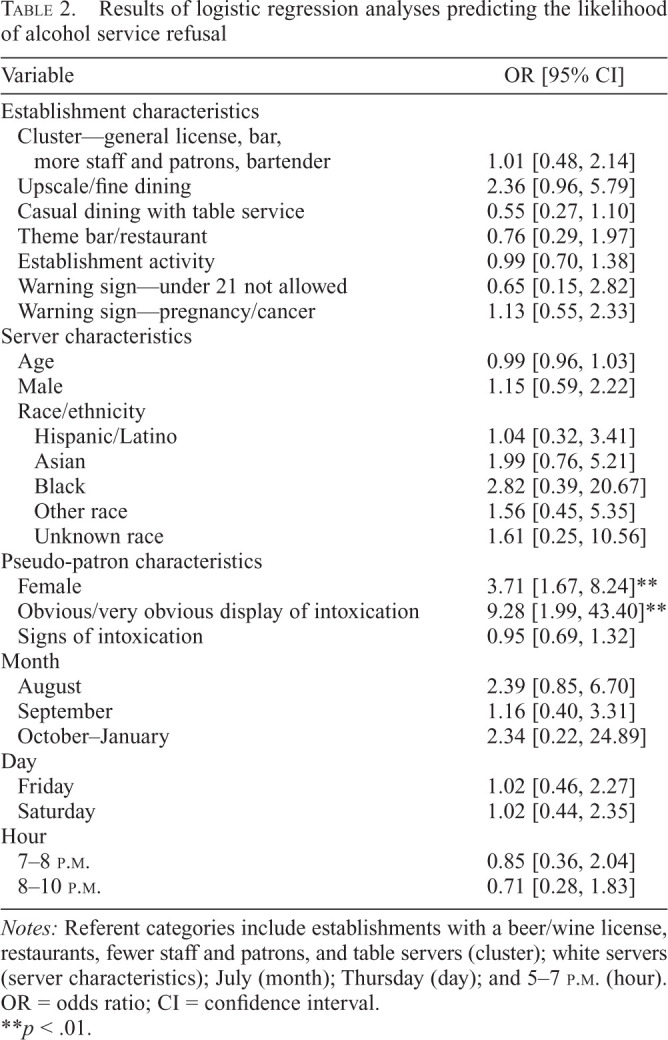
An initial regression model indicated that the PP Gender × Server Gender interaction term was not significantly related to alcohol service refusal (odds ratio = 1.30, 95% CI [0.26, 6.39]) and was therefore dropped from the analysis. Results for the subsequent model are included in Table 2. Neither establishment cluster type nor other establishment characteristics were significantly associated with alcohol service refusal in the regression model. None of the server characteristics were associated with alcohol service refusal in the model. Of the PP characteristics, being female and displaying obvious or very obvious signs of intoxication were positively associated with alcohol service refusal. None of the time variables were associated with alcohol service refusal.
Table 2.
Results of logistic regression analyses predicting the likelihood of alcohol service refusal
| Variable | OR [95% CI] |
|---|---|
| Establishment characteristics | |
| Cluster—general license, bar, more staff and patrons, bartender | 1.01 [0.48, 2.14] |
| Upscale/fine dining | 2.36 [0.96, 5.79] |
| Casual dining with table service | 0.55 [0.27, 1.10] |
| Theme bar/restaurant | 0.76 [0.29, 1.97] |
| Establishment activity | 0.99 [0.70, 1.38] |
| Warning sign—under 21 not allowed | 0.65 [0.15, 2.82] |
| Warning sign—pregnancy/cancer | 1.13 [0.55, 2.33] |
| Server characteristics | |
| Age | 0.99 [0.96, 1.03] |
| Male | 1.15 [0.59, 2.22] |
| Race/ethnicity | |
| Hispanic/Latino | 1.04 [0.32, 3.41] |
| Asian | 1.99 [0.76, 5.21] |
| Black | 2.82 [0.39, 20.67] |
| Other race | 1.56 [0.45, 5.35] |
| Unknown race | 1.61 [0.25, 10.56] |
| Pseudo-patron characteristics | |
| Female | 3.71 [1.67, 8.24]** |
| Obvious/very obvious display of intoxication | 9.28 [1.99, 43.40]** |
| Signs of intoxication | 0.95 [0.69, 1.32] |
| Month | |
| August | 2.39 [0.85, 6.70] |
| September | 1.16 [0.40, 3.31] |
| October–January | 2.34 [0.22, 24.89] |
| Day | |
| Friday | 1.02 [0.46, 2.27] |
| Saturday | 1.02 [0.44, 2.35] |
| Hour | |
| 7–8 p.m. | 0.85 [0.36, 2.04] |
| 8–10 p.m. | 0.71 [0.28, 1.83] |
Notes: Referent categories include establishments with a beer/wine license, restaurants, fewer staff and patrons, and table servers (cluster); white servers (server characteristics); July (month); Thursday (day); and 5–7 P.M. (hour). OR = odds ratio; CI = confidence interval.
p < .01.
Discussion
The main finding of this study is that only about one in five apparently intoxicated patrons were refused service at outlets licensed to sell alcohol for on-premises consumption. This is disappointing if not surprising. Similar rates of refusal were reported in recent decades by Lenk et al. (2006) of 35%, Toomey et al. (2004) 24%, Grube et al. (2021) 10%, Gosselt et al. (2013) 14%, Toomey et al. (2016) 18%, and Andreasson et al. (2000) 5%. Similar refusal rates in Northern California were also observed in a study using the same protocol (Buller et al., 2024). It seems clear that, no matter the law, refusing service to intoxicated patrons is not normative for this industry.
The lack of compliance with serving laws likely stems from the lack of enforcement of those laws (Lenk et al., 2023). Whereas law enforcement agencies have developed standard operating procedures for using decoy minors to reduce alcohol sales and service to underage individuals (and often are given supplemental funding to do so), there is no equivalent procedure for enforcing laws prohibiting service to apparently intoxicated patrons. Agents will use actual minors in attempts to buy alcohol but would not deploy truly impaired confederates for service to apparently intoxicated patrons for obvious reasons. Officers are likewise loath to enter businesses as undercover agents to sit and wait for an apparently intoxicated customer to be served, as they see doing so to be a highly inefficient mode of enforcement, taking officers “off the street” where they could be used more effectively. Thus, there may not be sufficient deterrence to motivate alcohol servers to refuse service to apparently intoxicated customers beyond their possible concerns about customers' safety and well-being.
It is also possible that some of the overservice may have stemmed from alcohol servers not knowing the serving laws related to intoxication. Of note, the State of California only implemented a requirement that servers be trained in alcohol service laws in September 2022, during the data collection period, so training servers in alcohol serving laws has likely been the responsibility of management until recently, which can be of variable quality. The findings do suggest that alcohol servers were not able to recognize cues to intoxication unless they were obvious, and this is a skill that also could be trained. Another possibility is that when faced with an intoxicated customer, servers at a number of establishments may have opted to serve alcohol to reduce the chances of conflict with the patron when refusing service. This informal house policy could be intended to avoid disrupting the dining experience of other customers. Similar concern has influenced overservice in prior research (Buvik, 2013).
Some effort was made to capture contextual and situational features of these bars and restaurants. Context would include descriptors of the physical venue (e.g., having a separate bar area, counter vs. table service, etc.), whereas situational aspects might vary within the same venue (e.g., number of patrons, how busy the place is, server demographics, etc.). Cluster analysis was used since some of these features seemed to be correlated, which they were to an extent. For example, places with a general license (i.e., to serve distilled spirits) were generally larger, with more staff and patrons than places with a beer and wine license. In any case, we could find no features of these places that were associated with likelihood of refusing service except that “upscale/fine dining” restaurants seem more likely to refuse service. This was somewhat surprising given many people's intuition that, for instance, busy places may be less likely to notice or respond to a display of intoxication. Toomey and colleagues (2016), looking over a variety of characteristics, also found no associations with refusals except for fewer refusals at places owned by corporations. We are left to speculate that the likelihood of refusal is a function of management priorities that guide training or supervision of staff (e.g., avoiding conflict), and that responsible management is to be found, if rare, across all types of businesses.
We did find that female PPs were refused service more often than male PPs. This is in contrast with data from a study in Oslo, Norway, where female PPs were more likely to be served (not refused) (Buvik & Rossow, 2015). It is difficult to interpret the gender effect in the current study. It could be that women were better actors than the men and displayed more obvious cues to intoxication, although the effect was robust to controlling for “obviousness.” Servers may have been more concerned about harms or social acceptance of intoxication by women than men in American culture.
Among this study's limitations is the specific geographic sampling frame that limits generalizability more broadly. It also relies on the PP's performance, although the judged obviousness of the performance was rated highly by observers in all but a few cases. The sampling plan designed to reduce travel costs could introduce a design effect to the degree in which places in the same zip code were similar to each other and different from places in other zip codes. On the other hand, there are some offsetting strengths. The PP protocol is a close simulation of the behavior of interest (as opposed to, say, self-reported serving practice). The sample included a mix of urban, suburban, and rural businesses in proportion to their numbers. The sample also included a diverse mix of outlet “types” (e.g., sports bars, fine dining, hotel bars) that allowed an examination as to whether refusal rates differed by type.
What, then, are the prospects of improving alcohol service? One complementary intervention often implemented by states is requiring training in RBS that covers the laws prohibiting overserving customers, how to recognize intoxication, and ways to refuse service. Reviews of RBS interventions have found mixed results at best (Jones et al., 2011; Ker & Chinnock, 2008). The Community Preventive Services Task Force, sponsored by the Centers for Disease Control and Prevention (CDC), found insufficient evidence to determine the effectiveness of RBS training programs, “although reviewed studies generally showed positive results for measured outcomes …” (CDC, 2010).
Nevertheless, there are examples of successful RBS interventions, most dramatically reported by the STAD (STockholm prevents Alcohol and Drug problems) program in Sweden, a multicomponent intervention that increased service refusal rates to apparently intoxicated patrons from 5% before the program to 70% 5 years later (Wallin et al., 2005), and which has risen to 80% more recently (Elgan et al., 2023). An attempt to replicate these outcomes in Oslo, Norway, was unsuccessful, however (Rossow & Baklien, 2010). An online RBS training program was able to raise refusals from 35% to 69% in New Mexico (Woodall et al., 2018), and an evaluation of a statewide mandatory training law in Oregon reduced alcohol-related crashes by 23% net of other predictors (Holder & Wagenaar, 1994).
Still, it seems unlikely that RBS training alone will be a reliably effective preventive intervention. The training is most likely necessary (as with any law or regulation) but not sufficient. The challenge is to find the combination of laws, enforcement, training, and possibly community mobilization that together can promote responsible service.
Conflict-of-Interest Statement
Dr. Saltz, Dr. Paschall, and Dr. O'Hara have no conflicts. Dr. Buller, Dr. Woodall, and Ms. Martinez receive a salary from Klein Buendel, Inc. Dr. Buller's spouse is an owner of Klein Buendel, Inc. Dr. Buller and Dr. Woodall are owners of Wedge Communications, LLC, the distributor of the WayToServe online training. An active management plan is in place at Klein Buendel to manage this conflict of interest. The management plan includes offering the WayToServe free to project participants; having results reviewed by project investigators outside Klein Buendel who are free of conflicts of interest; publicly disclosing the conflicts of interest; reporting results faithfully, accurately, and completely; and monitoring and auditing of the conflict of interest.
Footnotes
This research was supported by National Institute on Alcohol Abuse and Alcoholism Grant AA028772.
References
- Anderson Goodell E. M., Kuntsche E., Labhart F., Thrul J. Drinking location moderates the association between social group size and alcohol consumption among young adults: An event-level study. Drug and Alcohol Review. 2022;41(1):238–245. doi: 10.1111/dar.13340. [DOI] [PMC free article] [PubMed] [Google Scholar]
- Andréasson S., Lindewald B., Rehnman C. Over-serving patrons in licensed premises in Stockholm. Addiction. 2000;95(3):359–363. doi: 10.1046/j.1360-0443.2000.9533596.x. [DOI] [PubMed] [Google Scholar]
- Bellis M. A., Quigg Z., Hughes K., Ashton K., Ferris J., Winstock A. Harms from other people's drinking: An international survey of their occurrence, impacts on feeling safe and legislation relating to their control. BMJ Open. 2015;5(12):e010112. doi: 10.1136/bmjopen-2015-010112. [DOI] [PMC free article] [PubMed] [Google Scholar]
- Buller D. B., Woodall W. G., Saltz R., Martinez L., Small A., Chirico N., Cutter G. R. Journal of Studies on Alcohol and Drugs. Advance online publication; 2024. Sales to apparently intoxicated customers in three states with different histories of responsible beverage service training. [DOI] [PMC free article] [PubMed] [Google Scholar]
- Buvik K. How bartenders relate to intoxicated customers. International Journal of Alcohol and Drug Research. 2013;2(2):1–6. doi: 10.7895/ijadr.v2i2.120. [DOI] [Google Scholar]
- Buvik K., Rossow I. Factors associated with over-serving at drinking establishments. Addiction. 2015;110(4):602–609. doi: 10.1111/add.12843. [DOI] [PubMed] [Google Scholar]
- Centers for Disease Control and Prevention. Alcohol excessive consumption: Responsible beverage service training. 2010 https://www.the-communityguide.org/findings/alcohol-excessive-consumption-responsible-beverage-service-training [Google Scholar]
- Egerton-Warburton D., Gosbell A., Moore K., Wadsworth A., Richardson D., Fatovich D. M. Alcohol-related harm in emergency departments: A prospective, multi-centre study. Addiction. 2018;113(4):623–632. doi: 10.1111/add.14109. [DOI] [PubMed] [Google Scholar]
- Elgan T., Feltmann K., Gustafsson N., Gripenberg J.Alcohol service to underaged at licensed premises: A 25-year follow-up of a responsible beverage service program in Stockholm, Sweden; Poster presented at annual meeting of the Society for Prevention Research; Washington, D.C. 2023. [Google Scholar]
- Gosselt J. F., Van Hoof J. J., Goverde M. M., De Jong M. D. T. One more beer? Serving alcohol to pseudo-intoxicated guests in bars. Alcoholism: Clinical and Experimental Research. 2013;37(7):1213–1219. doi: 10.1111/acer.12074. [DOI] [PubMed] [Google Scholar]
- Graham K., Bernards S., Osgood D. W., Wells S. Bad nights or bad bars? Multi-level analysis of environmental predictors of aggression in late-night large-capacity bars and clubs. Addiction. 2006;101(11):1569–1580. doi: 10.1111/j.1360-0443.2006.01608.x. [DOI] [PubMed] [Google Scholar]
- Greenfield T. K., Karriker-Jaffe K. J., Giesbrecht N., Kerr W. C., Ye Y., Bond J. Second-hand drinking may increase support for alcohol policies: New results from the 2010 National Alcohol Survey. Drug and Alcohol Review. 2014;33(3):259–267. doi: 10.1111/dar.12131. [DOI] [PMC free article] [PubMed] [Google Scholar]
- Grube J. W., Krevor B. S., DeJong W. A group randomized trial of the Stop Service to Obviously-Impaired Patrons (S-STOP) program to prevent overservice in bars and restaurants in college communities. Substance Use & Misuse. 2021;56(8):1216–1223. doi: 10.1080/10826084.2021.1914107. [DOI] [PMC free article] [PubMed] [Google Scholar]
- Holder H. D., Wagenaar A. C. Mandated server training and reduced alcohol-involved traffic crashes: A time series analysis of the Oregon experience. Accident Analysis and Prevention. 1994;26(1):89–97. doi: 10.1016/0001-4575(94)90071-X. [DOI] [PubMed] [Google Scholar]
- Institute of Alcohol Studies. Alcohol's impact on emergency services. 2015 https://www.ias.org.uk/uploads/Alcohols_impact_on_emergency_services_full_report.pdf [Google Scholar]
- Jones L., Hughes K., Atkinson A. M., Bellis M. A. Reducing harm in drinking environments: A systematic review of effective approaches. Health & Place. 2011;17(2):508–518. doi: 10.1016/j.healthplace.2010.12.006. [DOI] [PubMed] [Google Scholar]
- Ker K., Chinnock P. Interventions in the alcohol server setting for preventing injuries. Cochrane Database of Systematic Reviews. 2008 doi: 10.1002/14651858.CD005244.pub3. [DOI] [PMC free article] [PubMed] [Google Scholar]
- Lenk K. M., Scholz N., Erickson D. J., Joshi S., Toomey T. L., Jones-Webb R., Nelson T. F. Alcohol enforcement in the United States from 2010 to 2019. Journal of Studies on Alcohol and Drugs. 2023;84(3):416–423. doi: 10.15288/jsad.22-00096. [DOI] [PMC free article] [PubMed] [Google Scholar]
- Lenk K. M., Toomey T. L., Erickson D. J. Propensity of alcohol establishments to sell to obviously intoxicated patrons. Alcoholism: Clinical and Experimental Research. 2006;30(7):1194–1199. doi: 10.1111/j.1530-0277.2006.00142.x. [DOI] [PMC free article] [PubMed] [Google Scholar]
- Lenk K. M., Erickson D. J., Nelson T. F., Horvath K. J., Nederhoff D. M., Hunt S. L., Ecklund A. M., Toomey T. L. Changes in alcohol policies and practices in bars and restaurants after completion of manager-focused responsible service training. Drug and Alcohol Review. 2018;37(3):356–364. doi: 10.1111/dar.12629. [DOI] [PMC free article] [PubMed] [Google Scholar]
- Macdonald S., Cherpitel C. J., DeSouza A., Stockwell T., Borges G., Giesbrecht N. Variations of alcohol impairment in different types, causes and contexts of injuries: Results of emergency room studies from 16 countries. Accident Analysis and Prevention. 2006;38(6):1107–1112. doi: 10.1016/j.aap.2006.04.019. [DOI] [PubMed] [Google Scholar]
- Naimi T. S., Nelson D. E., Brewer R. D. Driving after binge drinking. American Journal of Preventive Medicine. 2009;37(4):314–320. doi: 10.1016/j.amepre.2009.06.013. [DOI] [PubMed] [Google Scholar]
- Quigg Z., Butler N., Hughes K., Bellis M. A. Effects of multi-component programmes in preventing sales of alcohol to intoxicated patrons in nightlife settings in the United Kingdom. Addictive Behaviors Reports. 2022;15:100422. doi: 10.1016/j.abrep.2022.100422. [DOI] [PMC free article] [PubMed] [Google Scholar]
- Rehm J., Gmel G. E., Sr., Gmel G., Hasan O. S. M., Imtiaz S., Popova S., Probst C., Roerecke M., Room R., Samokhvalov A. V., Shield K. D., Shuper P. A. The relationship between different dimensions of alcohol use and the burden of disease—an update. Addiction. 2017;112(6):968–1001. doi: 10.1111/add.13757. [DOI] [PMC free article] [PubMed] [Google Scholar]
- Rossow I., Baklien B. Effectiveness of responsible beverage service: The Norwegian experiences. Contemporary Drug Problems. 2010;37(1):91–107. doi: 10.1177/009145091003700105. [DOI] [Google Scholar]
- Stockwell T., Lang E., Rydon P. High risk drinking settings: The association of serving and promotional practices with harmful drinking. Addiction. 1993;88(11):1519–1526. doi: 10.1111/j.1360-0443.1993.tb03137.x. [DOI] [PubMed] [Google Scholar]
- Toomey T. L., Lenk K. M., Nederhoff D. M., Nelson T. F., Ecklund A. M., Horvath K. J., Erickson D. J. Can obviously intoxicated patrons still easily buy alcohol at on-premise establishments? Alcoholism: Clinical and Experimental Research. 2016;40(3):616–622. doi: 10.1111/acer.12985. [DOI] [PMC free article] [PubMed] [Google Scholar]
- Toomey T. L., Wagenaar A. C., Erickson D. J., Fletcher L. A., Patrek W., Lenk K. M. Illegal alcohol sales to obviously intoxicated patrons at licensed establishments. Alcoholism: Clinical and Experimental Research. 2004;28(5):769–774. doi: 10.1097/01.ALC.0000125350.73156.FF. [DOI] [PubMed] [Google Scholar]
- Wallin E., Gripenberg J., Andréasson S. Overserving at licensed premises in Stockholm: Effects of a community action program. Journal of Studies on Alcohol. 2005;66(6):806–814. doi: 10.15288/jsa.2005.66.806. [DOI] [PubMed] [Google Scholar]
- Woodall W. G., Starling R., Saltz R. F., Buller D. B., Stanghetta P. Results of a randomized trial of web-based retail onsite responsible beverage service training: Waytoserve. Journal of Studies on Alcohol and Drugs. 2018;79(5):672–679. doi: 10.15288/jsad.2018.79.672. [DOI] [PMC free article] [PubMed] [Google Scholar]
- World Health Organization. Global Health Observatory data repository. 2021 https://www.who.int/data/gho Data set. [Google Scholar]