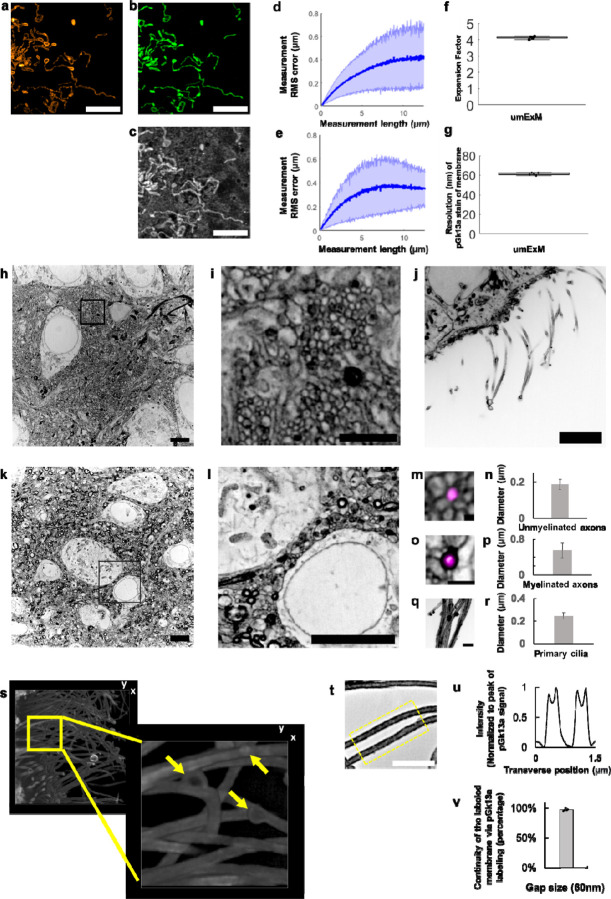
Figure 2. Resolution and distortion of umExM.
(a) Representative (n=3 cells from one culture) single z-plane structured illumination microscopy (SIM) image of a pre-expanded HEK293 cell expressing mitochondrial matrix-targeted green fluorescent protein (GFP, shown in orange). (b) Single z-plane confocal image of the same HEK293 cell as in (a), after undergoing the umExM protocol, showing expression of mitochondrial matrix-targeted GFP in the same field of view as shown in (a). GFP, green color. (c) Single z-plane confocal image of the same umExM-expanded fixed HEK293 cell as in (a), showing pGk13a staining of the membrane in the same field of view as shown in (a). pGk13a, gray color. (d) Root-mean-square (RMS) length measurement error as a function of measurement length, comparing pre-expansion SIM images of fixed HEK293 cells expressing mitochondrial matrix-targeted GFP and post-expansion confocal images of the same cells after umExM processing, showing mitochondrial matrix-targeted GFP (blue line, mean; shaded area, standard deviation; n=3 cells from one culture). (e) As in (d) but with post-expansion images showing pGk13a staining of the membrane. (f) Boxplot showing measured expansion factor as described (n=8 pairs of landmark points; from 3 fixed brain slices from two mice; median, middle line; 1st quartile, lower box boundary; 3rd quartile, upper box boundary; error bars are the 95% confidence interval; black points, individual data points; used throughout this manuscript unless otherwise noted). (g) Boxplot showing resolution of post-expansion confocal images (60x, 1.27NA objective) of umExM-processed mouse brain tissue slices showing pGk13a staining of the membrane (n=5 fixed brain slices from two mice). (h) Representative (n=5 fixed brain slices from two mice) single z-plane confocal image of expanded Thy1-YFP mouse brain tissue (hippocampus, dentate gyrus) showing pGk13a staining of the membrane. pGk13a staining of the membrane visualized in inverted gray color throughout this figure (dark signals on light background) except for (s). (i) Magnified view of black boxed region in (h). (j) As in (h) but imaging of the third ventricle. (k) As in (h) but imaging of mouse somatosensory cortex layer 6 (L6). (l) Magnified view of black boxed region in (k). (m) Representative (n=2 fixed brain slices from two mice) single z-plane confocal image of expanded Thy1-YFP mouse brain tissue (hippocampus dentate gyrus), that underwent umExM protocol and anti-GFP labeling (here labeling YFP), showing YFP (magenta) and pGk13a staining of the membrane (inverted gray). (n) Diameter of unmyelinated axons (n=17 axons from three fixed brain slices from two mice; bar, mean, error bars, standard deviation; used throughout this manuscript unless otherwise noted). (o) As in (m), but imaging of somatosensory cortex L6 that was used for measuring the diameter of myelinated axons. (p) Diameter of myelinated axons (n=21 axons from two fixed brain slices from two mice). (q) As in (m) but imaging of the third ventricle that was used for measuring the diameter of cilia. (r) Diameter of cilia (n=19 cilia from two fixed brain slices from two mice). (s) (left) Representative (n=4 slices of fixed brains from three mice) volume rendering of epithelial cells in the third ventricle from mouse brain tissue, showing pGk13a staining of the membrane. pGk13a staining of the membrane visualized in gray color. (right) Magnified view of yellow boxed region in (left). Yellow arrows indicate putative extracellular vesicles. Serial image sections that were used for the 3D rendering are in Supp. Fig. 12. (t) Single z-plane confocal image of expanded mouse brain tissue (third ventricle) processed by umExM, showing pGk5b staining (gray), focusing on the plasma membrane of cilia (i.e., ciliary membrane). (u) Transverse profile of cilia in the yellow dotted boxed region in (u) after averaging down the long axis of the box and then normalizing to the peak of pGk13a signal. (v) Bar graph showing the percent continuity of the membrane label (n=5 separate cilia from two fixed brain slices from one mouse), where we define a gap as a region larger than the resolution of the images (~60 nm, from Fig. 2g), over which the pGk13a signal was two standard deviations below the mean of the intensity of pGk13a along the ciliary membrane. Scale bars are provided in biological units throughout all figures (i.e., physical size divided by expansion factor): (a,b,d) 5μm, (h) 5μm, (i) 2μm, (j) 5μm, (k) 5μm, (l) 5μm, (m) 0.25 μm (o,q) 1μm, (s, left) (x); 13.57μm (y); and 7.5μm (z) (s, right) 3.76μm (x); 3.76μm (y); 1.5μm (z) (t) 2μm.

