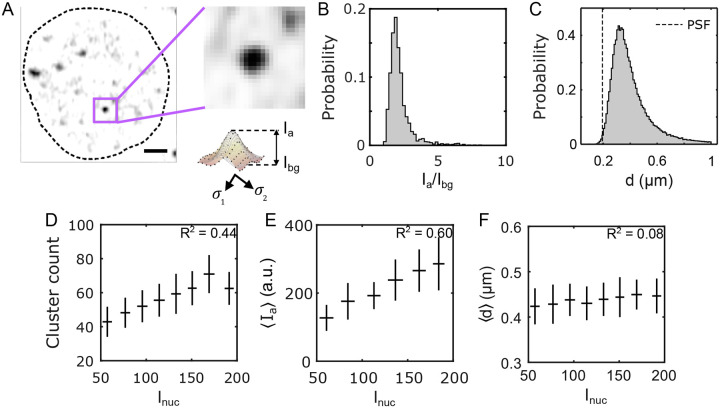
FIG. 2. Biophysical properties of Bcd clusters.
(A) A single nucleus showing Bcd-GFP heterogeneities. The close-up image (right) shows a single Bcd-GFP cluster. Cluster intensity fit with a 2D Gaussian (see profile below). The cluster amplitude , the cluster background intensity (), and the cluster size are extracted from fit parameters (Materials and Methods). Scale bar is . (B) A histogram of the signal-to-background ratio () for 99671 clusters from 2027 nuclei in 14 embryos expressing Bcd-GFP is plotted. (C) A histogram of the cluster size (), computed from the same clusters as in B is shown. The vertical dashed line representing the size of the PSF is included to compare with the size of the detected clusters. (D, E, F) The number of clusters per nucleus (D), the nuclear average of cluster amplitude (E), and the nuclear average of cluster size (F) are plotted against nuclear Bcd-GFP intensity, . Error bars represent the mean ± s.d. for data in each bin, calculated via bootstrap sampling of data within each bin. The coefficient of determination for each plot in D, E, and F is indicated in the respective panels.

