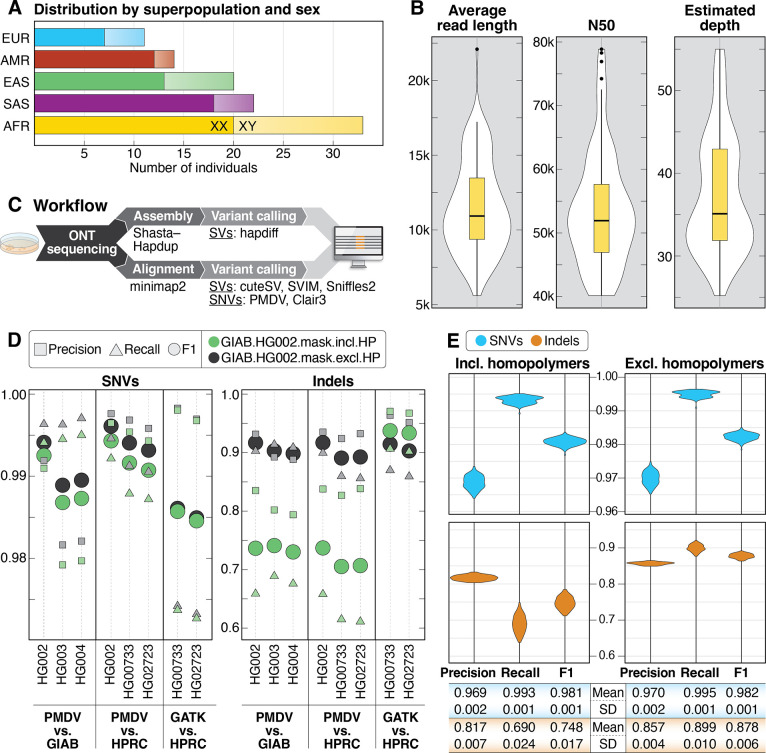
Figure 1. Summary statistics of samples, sequencing and small variant detection.
A: Samples selected for sequencing are shown by superpopulation and sex. B: Violin plots showing average read length, read N50, and average depth of coverage for all 100 samples. C: DNA was extracted from cells grown from aliquots received from Coriell and sequenced using the R9.4.1 pore. Data was analyzed using both alignment- and assembly-based approaches. D: Comparison of precision, recall, and F1 scores for SNVs and indels called from ONT data (PMDV) or Illumina data (GATK) compared to GIAB or HPRC calls for 5 high-confidence samples genome-wide in GIAB high-confidence regions only (GIAB.HG002.mask.incl.HP) and when excluding homopolymers in the GIAB high-confidence regions (GIAB.HG002.mask.excl.HP). Homopolymers were defined as any sequence of four identical nucleotides or more, including one bp flanking each side of the sequence. E: Precision, recall, and F1 scores for SNVs and indels from chromosomes 1–22 called with PMDV in GIAB high-confidence regions (including homopolymers) and GIAB high-confidence regions when excluding homopolymers.

