. 2024 Feb 27;12:RP87458. doi: 10.7554/eLife.87458

Figure 3. Indole-3-acetate (I3A) administration partially reverses diet-induced metabolome alterations in the liver.

(A) Scatter plots of latent variable projections from PLS-DA of untargeted metabolomics data features. Comparison of all four experimental groups (left panel), control mice (CN) vs. Western diet (WD) group (middle panel), and WD vs. WD-50 and WD-100 groups (right panel). (B) Heatmap of significant metabolite features (FDR<0.1) based on statistical comparisons of treatment groups (CN vs. WD). (C) KEGG pathway enrichment analysis of the metabolites. Number in the parenthesis represents the metabolites detected in the pathway. (D) Schematic for tryptophan metabolism (left panel). Tryptophan metabolism metabolites fold-changes of WD-50, WD-100, CN relative to WD (right panel). (E) Acyl-carnitine fold-change of WD-50, WD-100, CN relative to WD. p-Values were calculated using Student’s t-test and corrected by FDR.

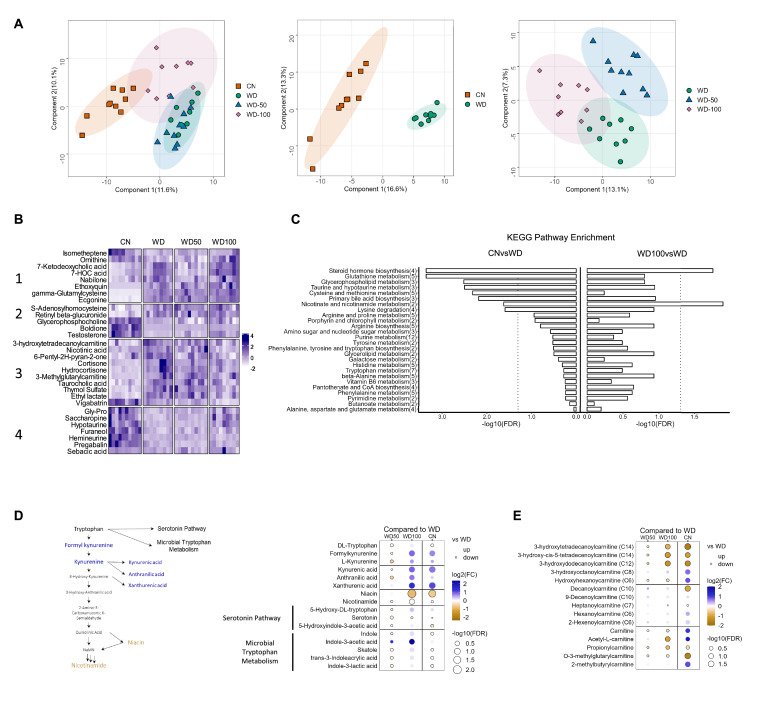
Figure 3.

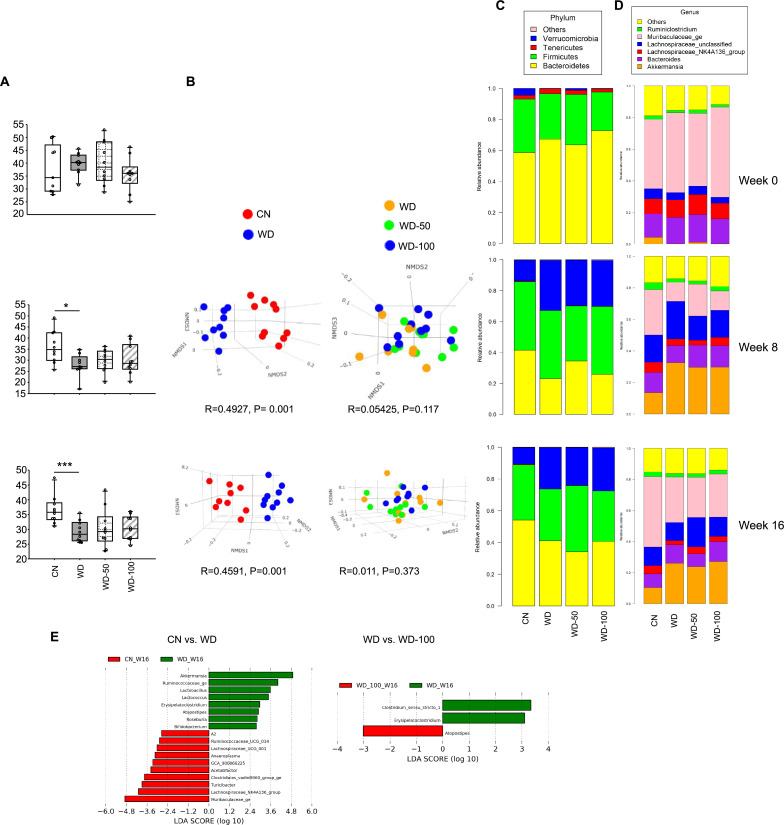
Figure 3—figure supplement 1. 16srRNA metagenomics of mouse fecal microbiota.

Figure 3—figure supplement 1.

(A) Alpha diversity of the fecal microbiome from control mice (CN), Western diet (WD), WD-50, and WD-100 groups. (B) Analysis of similarities (ANOSIM) comparison for CN vs. WD group and WD vs. WD-50 vs. WD-100 groups. (C, D) Phylum and genus level relative abundance of the fecal microbial community members. (E) Linear discriminant analysis effect size (LEfSe) results at the genus level. *: p<0.05, ***: p<0.001 using Wilcoxon rank sum test.
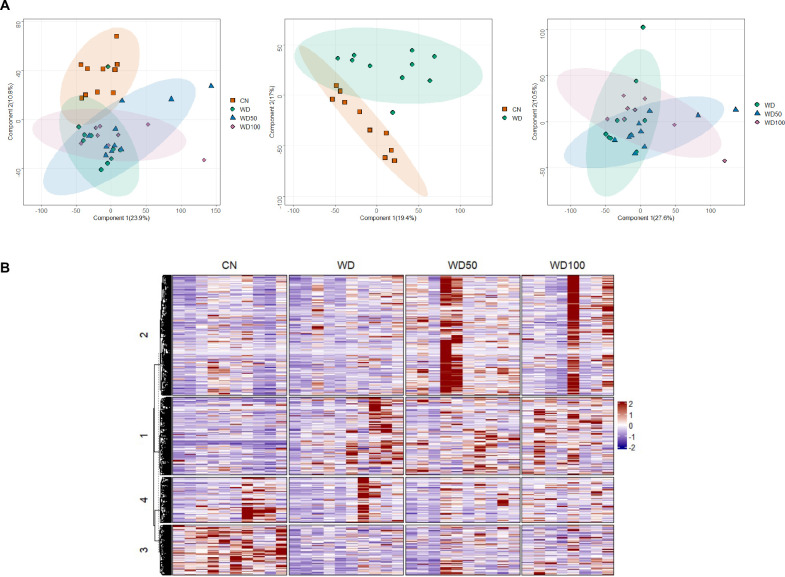
Figure 3—figure supplement 2. Untargeted metabolomic analysis of mouse fecal metabolites at week 16.

Figure 3—figure supplement 2.

(A) Score plots show the first two principal components for all four experimental groups (left panel), control mice (CN) vs. Western diet (WD) group (middle panel), and WD vs. WD-50 and WD-100 groups (right panel). Numbers in the parentheses of axis titles show percent of variance explained by the corresponding principal component. Ellipses circumscribe 95% confidence regions for the experimental groups assuming Gaussian distribution of component scores. (B) Heatmap of fecal microbiome metabolite features detected in all treatment groups. Rows and columns are features and treatment groups, respectively. The features were clustered using k-means.