. 2024 Jan 5;12:RP87965. doi: 10.7554/eLife.87965

Figure 5. Dag1 and Pomt2 cKOs exhibit impaired CB1R+ basket synapse formation in stratum pyramidale of hippocampal CA1.

P30 coronal sections immunostained for (A) CB1R and (B) VGAT in hippocampal CA1; merged image in (C) shows CB1R in magenta and VGAT in green. (A–C) Scale bar = 50 μm. (Higher magnification view of SP in (C’); scale bar = 10 μm.) (D) Quantification of VGAT puncta density in SP expressed as a percent of control. (E) Quantification of CB1R puncta density in SP expressed as a percent of control. (F) Quantification of co-localization between VGAT and CB1R in SP to estimate putative CB1R+ basket cell synapse formation. Error bars show mean + SEM. (For quantification of puncta densities and co-localization in SO and SR see Figure 5—figure supplement 1.) See Supplementary file 1 for Ns. Significance: *=p < 0.05, **=p < 0.01, ***=p < 0.001, NS = p ≥ 0.05. SO, stratum oriens; SP, stratum pyramidale; SR, stratum radiatum.

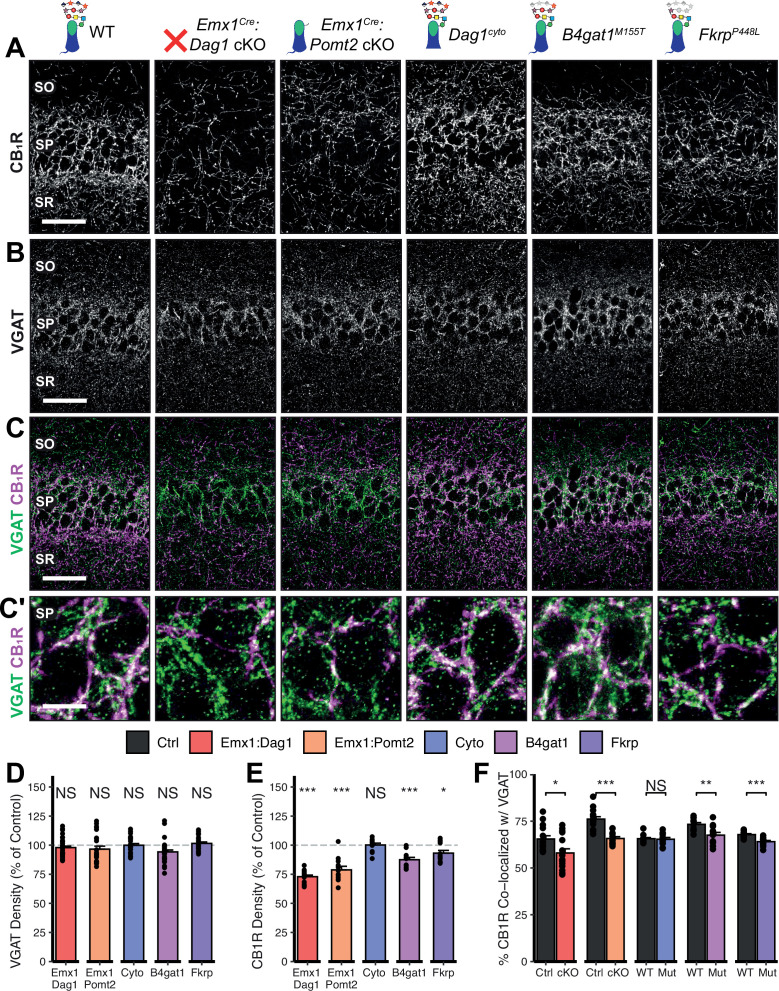
Figure 5—source data 1. Raw data for quantification in Figure 5D, E.
Figure 5—source data 2. Raw data for quantification in Figure 5F.

Figure 5.

Figure 5—figure supplement 1. Extended quantification of images in Figure 5A–C.

Figure 5—figure supplement 1.

Quantification within hippocampal CA1 SO and SR regions and all regions pooled together. (A) Quantification of VGAT puncta density expressed as a percent of control. (B) Quantification of CB1R puncta density expressed as a percent of control. (C) Quantification of co-localization between VGAT and CB1R to estimate putative CB1R+ basket cell synapse formation. Error bars show mean + SEM. (To see quantification of puncta densities and co-localization in SP see Figure 5D–F.) See Supplementary file 1 for Ns. Significance: *=p < 0.05, **=p < 0.01, ***=p < 0.001, NS = p ≥ 0.05.
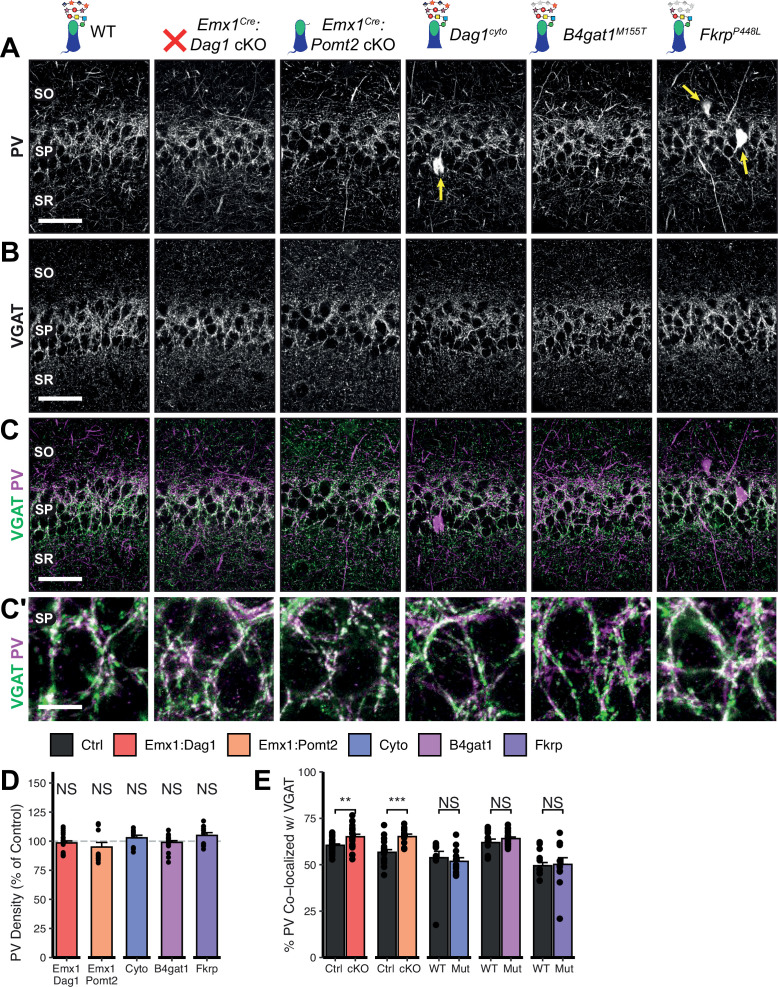
Figure 5—figure supplement 2. Dag1 and Pomt2 cKOs exhibit increased PV+ basket synapse formation in stratum pyramidale of hippocampal CA1.

Figure 5—figure supplement 2.

P30 coronal sections immunostained for (A) PV and (B) VGAT in hippocampal CA1; merged image in (C) shows PV in magenta and VGAT in green. Yellow arrows indicate PV+ interneuron cell bodies. (A–C) Scale bar = 50 μm. (Higher magnification view of SP in (C’); scale bar = 10 μm.) (D) Quantification of PV puncta density in SP expressed as a percent of control. (E) Quantification of co-localization between VGAT and PV in SP to estimate putative PV+ basket synapse formation. Error bars show mean + SEM. (To see quantification of puncta densities and co-localization in SO and SR see Figure 5—figure supplement 3.) See Supplementary file 1 for Ns. Significance: *=p < 0.05, **=p < 0.01, ***=p < 0.001, NS = p ≥ 0.05. PV, parvalbumin; SO, stratum oriens; SP, stratum pyramidale; SR, stratum radiatum.
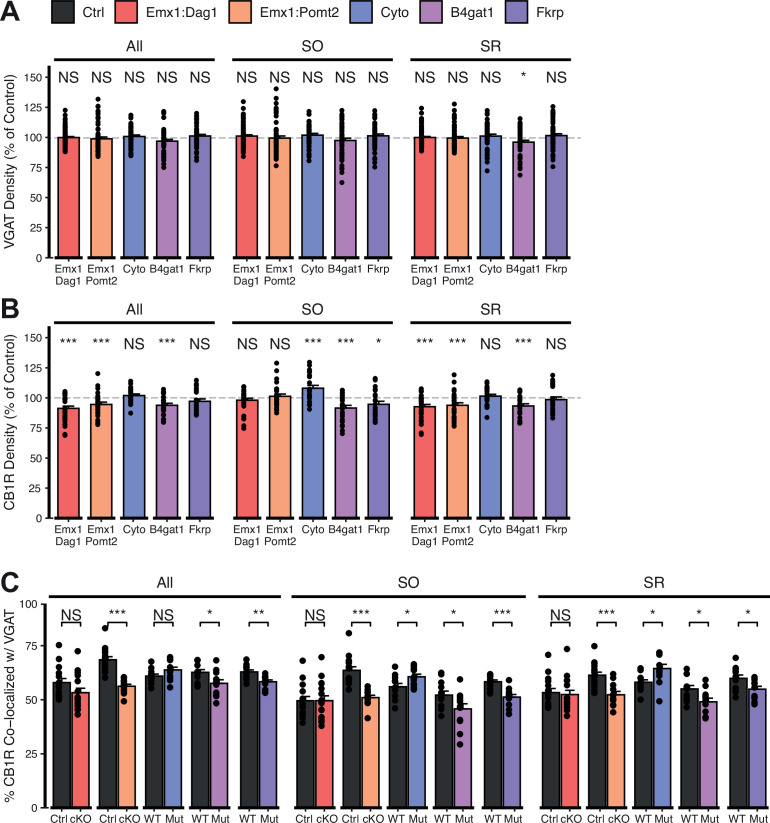
Figure 5—figure supplement 2—source data 1. Raw data for quantification in Figure 5—figure supplement 2D.
Figure 5—figure supplement 2—source data 2. Raw data for quantification in Figure 5—figure supplement 2E.
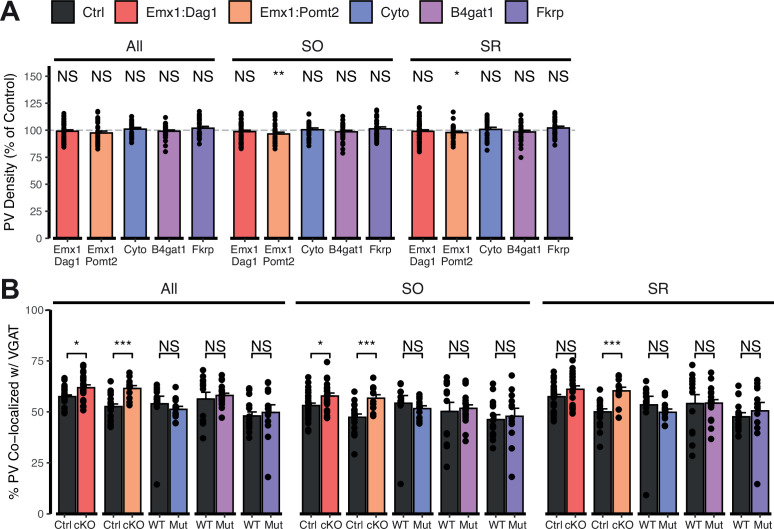
Figure 5—figure supplement 3. Extended quantification of images in Figure 5—figure supplement 2A–C.

Figure 5—figure supplement 3.

Quantification within hippocampal CA1 SO and SR regions and all regions pooled together. (A) Quantification of PV puncta density expressed as a percent of control. (B) Quantification of co-localization between VGAT and PV to estimate putative PV+ basket cell synapse formation. Error bars show mean + SEM. (To see quantification of puncta densities and co-localization in SP see Figure 5—figure supplement 2D, E). See Supplementary file 1 for Ns. Significance: *=p < 0.05, **=p < 0.01, ***=p < 0.001, NS = p ≥ 0.05. PV, parvalbumin; SO, stratum oriens; SP, stratum pyramidale; SR, stratum radiatum.