Abstract
High-speed, phase contrast retinal and blood flow imaging using an adaptive optics partially confocal multi-line ophthalmosocope (AO-pcMLO) is described. It allows for simultaneous confocal and phase contrast imaging with various directional multi-line illumination by using a single 2D camera and a digital micromirror device (DMD). Both vertical and horizontal line illumination directions were tested, for photoreceptor and vascular imaging. The phase contrast imaging provided improved visualization of retinal structures such as cone inner segments, vessel walls and red blood cells with images being acquired at frame rates up to 500 Hz. Blood flow velocities of small vessels (<40 µm in diameter) were measured using kymographs for capillaries and cross-correlation between subsequent images for arterioles or venules. Cardiac-related pulsatile patterns were observed with normal resting heart-beat rate, and instantaneous blood flow velocities from 0.7 to 20 mm/s were measured.
1. Introduction
Adaptive optics scanning laser ophthalmoscopy (AO-SLO) has been a powerful tool to study retinal structure and function, providing in vivo cellular resolution imaging with improved contrast and optical sectioning capability [1]. It allows for imaging of photoreceptor cell mosaics, nerve fiber layer bundles as well as microscopic capillary vessels with confocal detection. More recently, non-confocal detection [2], which captures multiply scattered light, has been applied to AO-SLO imaging, showing enhanced contrast and visualization of retinal structures such as cone inner segments [3], retinal pigment epithelium [4], retinal vessels and capillaries [5,6] and retinal ganglion cells [7,8].
However, low image acquisition rate, generally 30 fps, requires correction of the eye motion induced distortion and can limit its use in investigating dynamic retinal function such as blood flow. The optical design of an AO-SLO is also complex due to scanning mirrors and the requirement for multiple relay telescopes to reimage the pupil. In addition, for multi-directional non-confocal imaging, they require additional devices such as an offset aperture mask and a moving PMT [8], fiber bundles and multiple detectors [9] or a spatial light modulator [10]. AO line scanning ophthalmoscopy (AO-LSO) was reported with a possibility of high speed confocal retinal imaging using a high-speed line camera and a single one-directional scanner while trading off imaging resolution and contrast caused by light cross-talk along the illumination line [11–15]. A digital micromirror device (DMD), which was reported to work as an alternative to conventional scanning mirrors [16–20], allows for flexible changes in the illumination line direction which affects visualization of structures such as blood vessels and retinal ganglion cells in phase contrast imaging [21]. Krafft et al. demonstrated an AO multimodal ophthalmoscope using a 2D camera and a DMD projecting single- or multi-line illumination patterns for simultaneous bright- and dark-field imaging [22]. Multi-line (28 m line width) or a single line (100 m line width) were scanned across the retina. They reported a large field of view (FOV) of , but while the image acquisition rate was 100 Hz, the composite frame rate was lower due to the requirement to acquire multiple sub-frames, and hence did not allow for dynamic imaging such as blood flow. Here, a high-speed AO partially confocal multi-line ophthalmoscope (pcMLO) also providing simultaneous partially confocal and phase contrast retinal imaging with various directional multi-line illumination is demonstrated. Our system employs much narrower line widths (6 or 13 m) and acquires composite retinal images at a frame rate of up to 500 Hz. However, our FOV is much smaller than the of Krafft et al.[22]. Our previously reported AO partially confocal multi-spot ophthalmoscope (pcMSO) [20] was used to project multi-line patterns rather than multi-spot patterns using a DMD synchronized with a 2D camera and demonstrates the ability to visualize and measure velocities of individual red blood cells. The optical design is greatly simplified, compared to other confocal and split aperture configurations, as the lens-based system keeps the system aberrations low [23] and removes the need for off-axis configurations [24–26] typically required in AO-SLO and AO-OCT systems when using spherical mirrors [27,28]. Avoiding the need for scanning mirrors removes several relay telescopes further reducing system complexity.
Phase contrast imaging of static structure using the AO-pcMLO reveals a photoreceptor mosaic appearing similar to that obtained by a split-detection AO-SLO [3] and also a similar DMD line scan ophthalmoscope [22]. It also provides better contrast and visualization of vasculature structure such as vessel walls and red blood cell flow in small size vessels (<40 m in diameter) including capillaries, even resolving individual erythrocytes in single-file flow. The high image acquisition rate allows for blood flow velocity measurement of the small vessels, which could help assessing retinal hemodynamics and its abnormalities caused by eye diseases. Several studies have demonstrated blood flow velocity measurement using AO ophthalmoscopes. It has been reported that blood flow velocity can be measured in parafoveal capillaries by tracking leukocytes over time [29]. Blood flow velocity of larger size vessels was measured using spatiotemporal traces (kymographs) of erythrocyte movement obtained by an AO confocal ophthalmoscope with stationary line scanning [30–32]. Capillary flow velocity was also evaluated using kymographs acquired by an AO confocal [31,33] and flood-illumination ophthalmoscope with their 2D spatial and temporal correlograms [34]. Spatial [35] and temporal [36] cross-correlation based methods were proposed for retinal capillary velocity measurement using flood-illumination systems. A dual-beam non-confocal AO-SLO with a small temporal offset between channels was able to measure capillary flow velocity using blood cell displacement in two channel images [37]. Here, unlike previous methods blood flow velocities of small size vessels were measured using phase contrast images. Velocities of multiple small vessels in focus within the FOV could be measured at the same time using kymographs for capillary and spatial cross-correlation between subsequent images for arterioles or venules. The measured velocity showed synchronized cardiac-dependent pulsatile patterns with normal resting heart-beat rate.
2. Methods
2.1. AO partially confocal multi-line ophthalmoscope
The AO-pcMLO used the same layout described in [20] but projected multi-line illumination patterns instead of spots. Briefly, the DMD (V-7001, Vialux, Germany) placed at a retinal conjugate plane projects a series of complementary multi-line illumination patterns on the retina, synchronized with a high-speed 2D camera (Nova S16, Photron, USA). An internal synchronization signal of the Photron camera (Sync Pos) was used to update the DMD illumination pattern using the TriggerIn input. The wavefront sensing is performed by a Shack–Hartmann wavefront sensor (SHSCam AR-S-150-GE, Optocraft, Germany), and the DMD patterns are pre-corrected by a deformable mirror (DM) (DM97-15, ALPAO, France) to form sharply focused lines on the retina. The magnification from the retina to the Photron camera, which is also placed at a retinal conjugate plane, is 25.5. The size of one DMD mirror element and one Photron camera pixel on the retina is 2.12 m (0.5 Airy disk diameter (ADD)) and 0.78 m, respectively. The FOV is in diameter, which corresponds to 270 pixels on the Photron camera. Superluminescent diodes with a central wavelength of 880 nm (QSDM-880-9, QPhotonics, USA) and 796.4 nm (SLD-381-HP3, Superlum Ltd., Russia) were used for the AO-beacon and imaging light, respectively.
2.2. Human subjects
In vivo retinal imaging was performed on three healthy subjects (N1, N2, and N3) between the ages of 25 to 49 years old. The tenets of the Declaration of Helsinki were observed and the protocol was approved by the Institutional Review Board of The Ohio State University. Written informed consent was obtained after all procedures and possible outcomes of the study were fully explained to the subjects and prior to any experimental measurements. The subjects were imaged at five to eight retinal locations spanning from to temporal (T) retina (R) and from inferior (I) R to superior (S) R after pupil dilation (1% tropicamide and 2.5% phenylephrine). At the current time, the reconstructed images cannot be viewed in real time as they directly buffer to camera memory and have to be downloaded for image reconstruction at the end of a trial. The method for choosing the retinal location and imaging depth is as follows: Firstly, due to the small AO FOV, imaging locations were selected based on fundus photos taken with a commercial fundus camera (TRC-NW8, Topcon Corporation, Japan). Then, using the AO system, a montage of flood illumination retinal images (all DMD mirrors turned ‘on’) at the location of interest was captured with a step size of < , to build an overall montaged FOV . Once the desired retinal location was determined, a series of flood-illuminated images with a range of defocus offsets (applied via the DM) were then captured to determine correct axial depth. Note that the system allows for a live view (cannot save the data) of the Photron camera images and this was used for alignment in flood-illuminated mode. Once this step was completed, a set of high-speed multi-line illumination images were acquired and recorded centered around the previously determined retinal depth.
2.3. Image acquisition
Vertical and horizontal multi-line illumination patterns were tested for photoreceptor and retinal vasculature imaging. To determine the optimal line separation, retinal images were acquired for three different line separations, 20 (10 ADD), 40 (20 ADD), and 60 (30 ADD) DMD mirror elements. The average of 245 retinal (focused at photoreceptor layer) sub-frames and their cross-sectional plots are shown in Supplement 1 (1.6MB, pdf) . As expected the crosstalk between adjacent lines decreases as the line separation increases, but this comes at the expense of requiring more sub-frames to build a single composite frame. Thus, 40 DMD mirror elements separation (20 ADD, 85 m at the retina) was employed as this reduced crosstalk while providing a high overall composite frame rate. The set of complementary patterns for photoreceptor imaging consists of forty multi-line patterns having line width of three DMD mirror elements (1.5 ADD) and a scanning step size of one DMD mirror element (0.5 ADD). For retinal vascular imaging, in order to increase acquisition speed, the number of complementary patterns required was reduced to half by doubling the line width to six DMD mirror elements (3 ADD) and the scanning step size to two mirror elements (1 ADD).
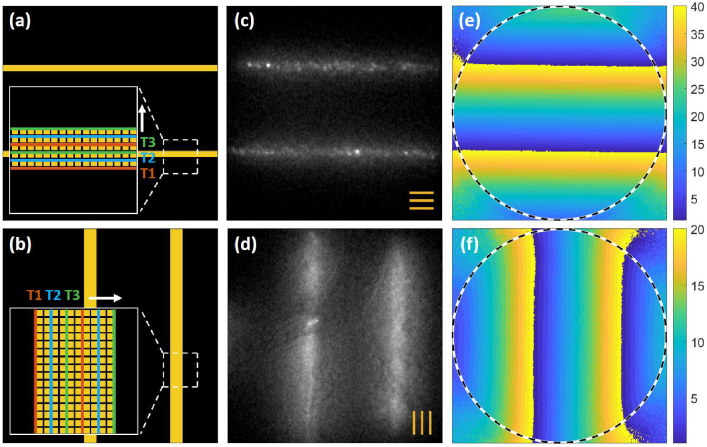
Figure 1(a) shows a schematic of the multi-line pattern in the horizontal direction for photoreceptor imaging and (b) in the vertical direction for retinal vascular imaging. The insets show enlarged illumination lines that are scanned vertically and horizontally with a step size of one and two mirror elements, respectively. The orange, blue and green boxes show three consecutive steps. An acquisition rate for a single sub-frame was set to 10,000 fps. Figure 1(c) is an example of a single sub-frame of photoreceptors and (d) retinal vasculature. Videos of sub-frames capturing photoreceptor and retinal vasculature with the set of complementary patterns are shown in Visualization 1 (3.2MB, avi) and Visualization 2 (1.8MB, avi) .
Fig. 1.
Schematic of multi-line patterns of (a) horizontal line illumination for photoreceptor imaging and (b) the vertical direction for retinal vascular imaging. Illumination lines are shown in yellow. The insets show enlarged illumination lines that are scanned vertically and horizontally with the step size of one and two mirror elements, respectively, over time T1 (orange), T2 (blue) and T3 (green). Examples of single sub-frames of (c) photoreceptors and (d) retinal vasculature. The orange lines indicate the orientation of the line illumination. The spatial masks used for composite image reconstruction of (e) photoreceptor and (f) retinal vasculature images. Each pixel is assigned to a number between 1 and the number of complementary patterns (20 for vasculature and 40 for photoreceptors), as shown on the color scale [20]. Dotted circles indicate the illumination area.
Image acquisition was performed over 1 second for photoreceptor imaging and 2 seconds for vascular imaging at composite frame rates of 250 fps and 500 fps, respectively. Corresponding illumination powers incident on the cornea were <245 or <490 W, and the AO-beacon power incident on the cornea was <60 W. All light powers were below ANSI safety standards [38]. Images were acquired over a 6.5 mm exit pupil giving a single ADD of 4.98 m on the retina at a wavelength of 796.4 nm.
2.4. Retinal image reconstruction
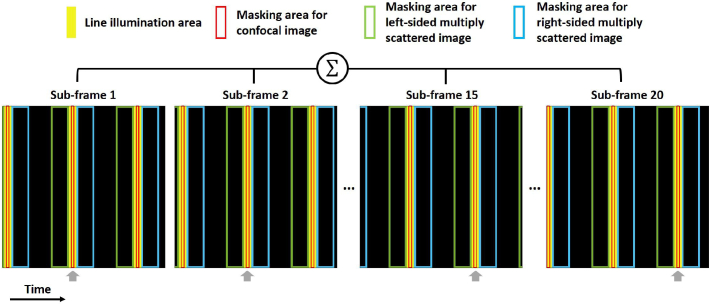
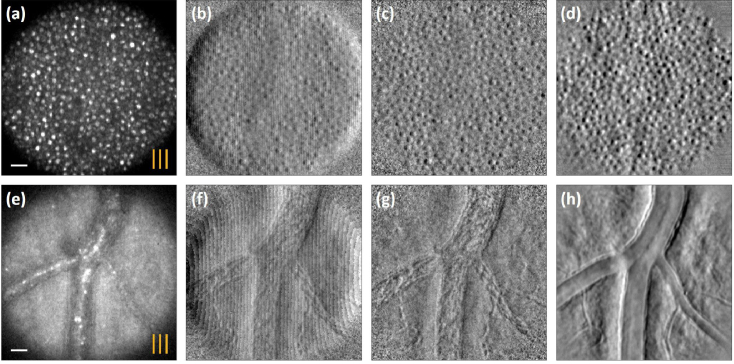
Confocal and phase contrast composite images were reconstructed by simple arithmetic operations on a set of spatially differently masked sub-frames from a single camera acquisition [19,20,22]. A spatial mask (Fig. 1(e) and (f)) was obtained by assigning a label to every image pixel such that pixels under the same illumination pattern had the same label. Creation of the spatial mask is described in our previous work [20]. Figure 2 shows a schematic of the illumination and masking areas for confocal or phase contrast imaging under vertical line illumination, shown in yellow. For confocal line imaging, masking areas were set to be the central illumination areas shown by the red box, and a set of masked sub-frames were added together. The width of the masking areas was chosen for confocality, namely close to 1 ADD in width. This width was also the same as the scanning step size, one mirror element (0.5 ADD) for photoreceptor imaging and two mirror elements (1 ADD) for retinal vascular imaging. Figure 3(a) and (e) are examples of composite confocal images of photoreceptor and retinal vasculature, respectively, captured under vertical line illumination. The phase contrast image was reconstructed by two multiply scattered images obtained from opposite sides of the multi-line illumination shown by the green and blue boxes in Fig. 2. The width of the mask and separation from the line illumination were determined empirically for photoreceptor or blood flow imaging separately–if the mask is too wide, there will be crosstalk from the next illumination line. If it is too narrow or too far away from the confocal line illumination, it will result in low signal. The mask for multiply scattering light was set to have the width of five mirror elements (2.5 ADD), separated by one mirror element (0.5 ADD) from the line illumination, for photoreceptor imaging and doubled to ten mirror elements (5 ADD), adjacent to the line illumination, for vascular imaging. Each composite multiply scattered image was reconstructed by adding a set of masked sub-frames. Then, the difference of the left-sided and right-sided multiply scattered images was divided by the sum of two multiply scattered images. The contrast mechanism for phase contrast imaging is the same as described in [22,39]. Phase contrast images have undesired periodic patterns parallel to illumination direction as shown in Fig. 3(b) and (f) because multiply scattered light intensity decreases as getting further away from illumination area. The effect becomes more obvious with larger scanning step sizes, thus, the pattern is more clearly visible in vascular images. The periodic pattern was removed by dividing each phase contrast image by average of a set of the unregistered images over the 1 or 2 second trial duration. Figure 3(c) and (g) show the corresponding single composite phase contrast images. The photoreceptor and retinal vascular images were captured from N1 at TR and T SR, respectively. The reconstructed images were then registered using the confocal images and averaged to increase the signal-to-noise ratio as shown in Fig. 3(d) and (h).
Fig. 2.
Schematic of illumination and masking areas of each sub-frame for confocal and one-sided multiply scattered image reconstruction. Line illumination areas are shown in yellow. Solid red, green and blue boxes indicate masking areas for confocal, left-sided and right-sided multiply scattered image. The gray arrows indicate the same illumination line scanned to the right.
Fig. 3.
Single composite confocal images of (a) photoreceptors of N1 at TR and (e) retinal vasculature at T SR obtained under vertical line illumination. Corresponding phase contrast images (b) and (f) showing the periodic variation and (c) and (g) after dividing by the unregistered average. (d) and (h) are the corresponding registered average images from (c) and (g). The scale bar is 20 m.
2.5. Blood flow velocity measurement
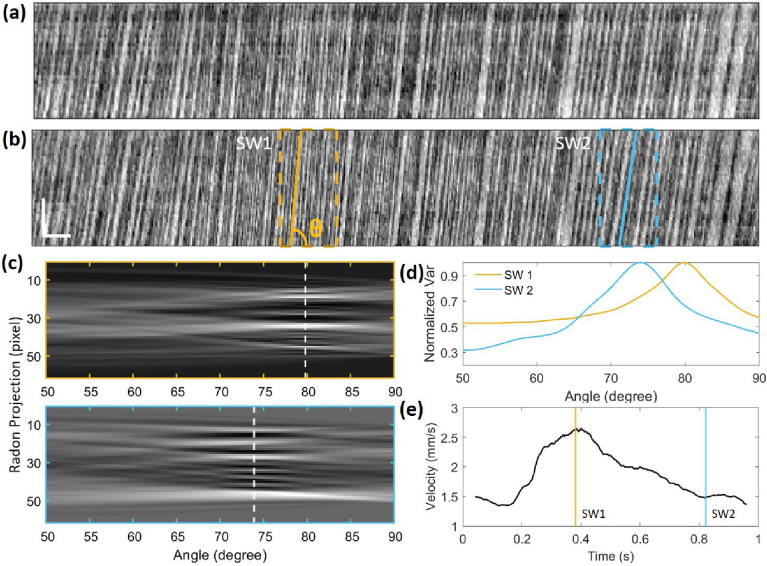
Two different methods were applied to measure retinal blood flow velocity depending on the vessel lumen size. Phase contrast images were used throughout due to their improved blood cell contrast. For capillaries with a diameter of <10 m, a skeletonized vessel segment was obtained using a motion contrast image which is calculated as a standard deviation of intensities of each pixel over the phase contrast image set. A cropped motion contrast image having the vessel segment of interest was thresholded and, then, skeletonized using the Matlab function ’bwskel.’ Then, manual adjustment was performed to obtain the final skeletonized vessel segment. Intensities along the vessel skeleton were plotted together over time to obtain a kymograph [33,34] as shown in Fig. 4(a). Then, spatial and temporal non-uniformities were reduced using the method reported by Duncan et al. [40] as shown in Fig. 4(b). Each cell moving through the vessel generates a tilted trace on the kymograph, and blood flow velocity was measured by
| (1) |
where is the trace angle, which was calculated based on the Radon transform [40–42] and L is the length of a capillary segment. The sampling window for Radon transformation was set to 80 ms. Radon projections of two different sampling windows (SW1 and SW2) indicated by colored boxes in Fig. 4(b) are shown in Fig. 4(c) with dotted lines representing the trace angles. The normalized variance of the Radon projections provided a clear and smooth peak at the trace angle as shown in Fig. 4(d), so the angle having the largest variance was selected as the trace angle. The velocity measured from Fig. 4(b) is plotted in Fig. 4(e) with two solid lines indicating the velocities in the SW1 and SW2.
Fig. 4.
Kymographs of a capillary of N1 at T SR (a) before and (b) after reduction of temporal and spatial non-uniformities. Two sampling windows (SW1 and SW2) and corresponding tilted trace angles are shown as colored dotted boxes and tilted lines, respectively. The horizontal scale bar is 40 ms, and the vertical scale bar is 10 m. (c) Radon projections of SW1 and SW2 with dotted lines representing the trace angles. (d) The normalized variance of the Radon projections as a function of angle for SW1 and SW2. (e) Measured blood flow velocities from (b) with solid lines indicating velocities in SW1 and SW2.
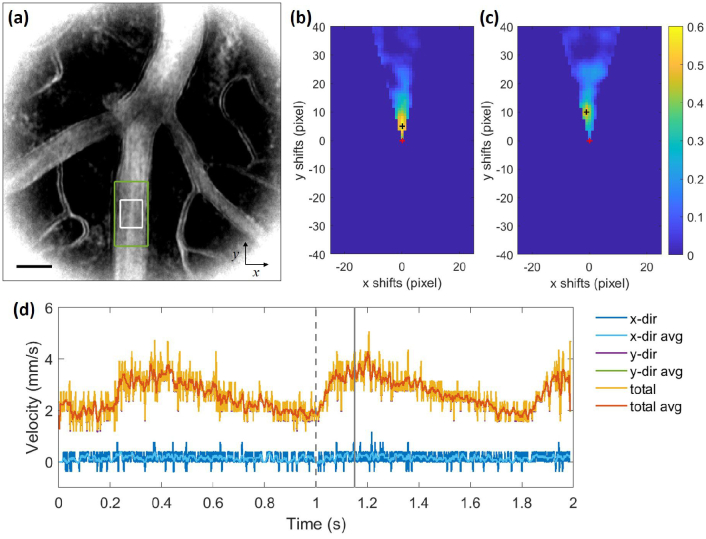
For arterioles or venules with a diameter of 15-40 m, a cross-correlation approach was employed. Between consecutive frames, a larger region of interest (ROI) in the initial frame and a smaller ROI from the following frame, were cross-correlated to find the areas having the highest similarity, and their spatial offset was considered as the displacement distance of blood cells during each frame time. A straight vessel segment was chosen for the ROIs avoiding branches, given the current small FOV, there was typically only one or two locations that satisfied this criterion. The normalized cross-correlation value for the x-shift and y-shift is calculated using the normalized 2D cross-correlation MATLAB function ‘normxcorr2.’ The size of the ROIs was decided depending on vessel diameter and blood flow speed. The location of every local maximum having higher intensity than an adjusted threshold was detected in the cross-correlation map, and the location of the one closest to the previously selected local maximum was selected as the spatial offset of two ROIs to avoid false peak detection. The search region of the spatial offset was limited using the prior information of vessel and flow direction. Blood flow velocity was calculated by dividing the spatial offset by each frame time. Figure 5(a) shows a motion contrast image of N1 at T SR. Different sized ROIs were represented by white and green rectangular boxes. Figure 5 shows the cross-correlation maps at the (b) minimum and (c) maximum velocities. The search region was limited to positive y-shifts given that the flow is upwards in this particular image set. Then, the search region was set to a cone-shaped region, limiting the range of flow direction pointed by a vector (x-shifts, y-shifts), with the assumption that the flow direction does not deviate greatly from the vessel direction. The video of phase contrast images and corresponding cross-correlation maps is shown in Visualization 3 (228.9MB, avi) . The red and black crosses indicate the origin and local maximum used for the velocity calculation, respectively. The measured and averaged velocities over time (10 ms, 5 frames) are plotted in Fig. 5(d) with a dotted gray line indicating the minimum velocities from (b) and a solid line for maximum velocities from (c). High frequency noise was reduced in the averaged velocity plot, but unaveraged velocities were plotted throughout to show high frequency noise level as well.
Fig. 5.
(a) Motion contrast image obtained from the phase contrast images of N1 at T SR. Rectangular boxes (green and white) indicate ROIs for the velocity calculation. The scale bar is 30 m. Cross-correlation maps within their spatial offset search region at the (b) minimum and (c) maximum velocity. The red and black crosses indicate the origin and local maximum chosen for spatial offset, respectively. (d) Measured blood flow velocity with dotted and solid gray vertical lines indicating the minimum and maximum velocities from (b) and (c), respectively. The blood flow velocities in x- (blue), y- (orange) and flow (yellow) direction (root mean square of velocities in x- and y-direction) and corresponding averaged velocities (light blue, green, red) over time (10 ms, 5 frames) are shown. Note that the horizontal component of velocities is close to zero as the vessel is oriented vertically.
3. Results and discussion
3.1. Photoreceptor imaging
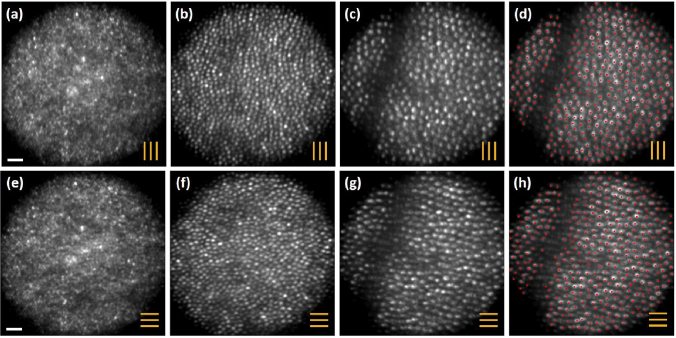
Figure 6 shows the confocal photoreceptor images of N2 at the fovea, TR and TR under vertical and horizontal line illumination. The photoreceptor mosaic shows the expected increase in diameter and cone spacing with increasing retinal eccentricity. The images under two different illumination directions show the same photoreceptor morphology, and for direct comparison, 360 visible cones at TR are marked in Fig. 6(d) and (h).
Fig. 6.
Registered average of up to 245 confocal photoreceptor images of N2 at the (a) fovea, (b) TR and (c) TR under vertical illumimation and (e)-(g) horizontal illumination. The orange lines indicate the orientation of the line illumination. (d) and (h) show the TR images from (c) and (g) with the 360 cone centers marked with red spots for direct comparison. The scale bar is 20 m.
Their normalized power spectra for the confocal images (Supplement 1 (1.6MB, pdf) ) also have similar shapes. Cone photoreceptors are slightly oblate parallel to the illumination line, which may be due to lower contrast along the direction of the illumination rather than in the perpendicular confocal direction. The cone spacing estimated from spatial frequency peak positions in the normalized radial power spectrum were 2.9, 6.9, and 9.7 m at fovea, TR and TR, respectively, in agreement with [43].
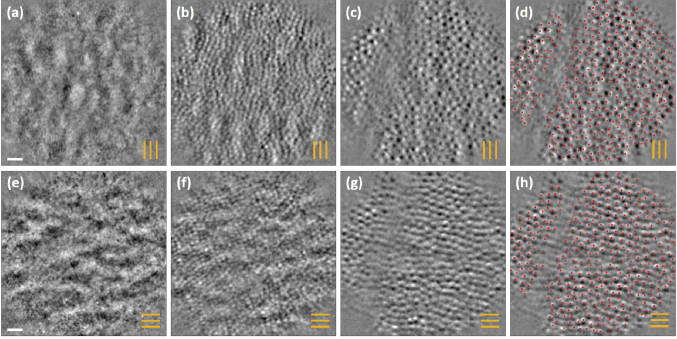
In Fig. 7, phase contrast images corresponding to Fig. 6 show presumed photoreceptor inner segments as reported in [3,22]. The features have a high correlation with the position of the imaged cones as marked with red spots in Fig. 7(d) and (h). Their normalized power spectrum (Supplement 1 (1.6MB, pdf) ) have peaks around frequencies corresponding to the cone spacing. Phase contrast imaging provided lower resolution than confocal imaging due to absence of confocality, and photoreceptor inner segments at the fovea were not resolvable as shown in Fig. 7(a) and (e).
Fig. 7.
Phase contrast images corresponding to Fig. 6 under (a)-(c) vertical line illumination and (e)-(g) horizontal line illumination. The orange lines indicate the orientation of the line illumination. (d) and (h) show the TR images from (c) and (g) with the 360 cone centers marked with red spots for direct comparison also compared to Fig. 6(d) and (h). The scale bar is 20 m.
3.2. Retinal vasculature imaging and blood flow velocity measurement
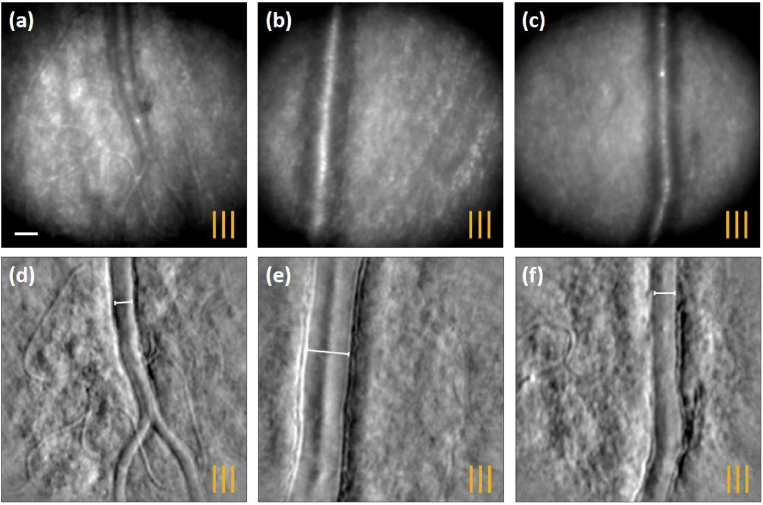
The registered average of confocal and phase contrast vasculature images of N1, N2 and N3 obtained with vertical line illumination are shown in Fig. 8. Figure 8(a)-(c) are confocal images of N1 ( T SR) , N2 ( T IR) and N3 ( T SR), respectively, and the corresponding phase contrast images are shown in Fig. 8(d)-(f). Arterioles or venules show higher reflection along the central region of vessels, and this decreases as closer to the vessel walls, complicating the ability to identify vessel walls and measure vessel lumen diameters. The phase contrast images provide better visualization of vascular walls, especially when vessels are parallel to line illumination direction, as shown here. Vessel lumen diameter was easily measured as indicated by white line segments in Fig. 8(d)-(f). The measured diameters were 14.5, 36.1 and 17.2 m, respectively. Capillaries are more clearly visible with phase contrast imaging, and even individual blood cells in capillaries are identifiable as shown in the video of N1 (Visualization 4 (37MB, avi) ). The blood cells show an asymmetric intensity profile perpendicular to the line illumination, brighter on one side and darker on the opposite side. Similar profiles have been reported using split-detection imaging in the mouse retina [44,45]. The corresponding video acquired simultaneously with confocal imaging is provided in Visualization 5 (14.2MB, avi) for comparison.
Fig. 8.
Registered average of confocal retinal vessel images of (a) N1 at T SR, (b) N2 at T IR, (c) N3 at T SR obtained with vertical line illumination. (d)-(f) The corresponding phase contrast images acquired simultaneously. The orange lines indicate the orientation of the line illumination. The scale bar is 20 m.
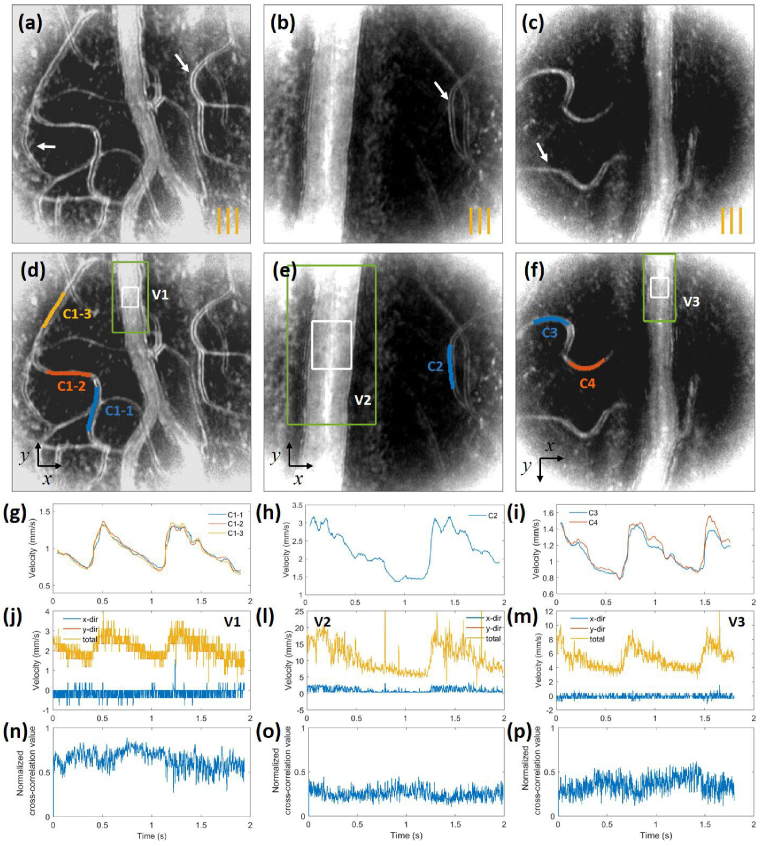
Blood flow velocities were measured using phase contrast image sets shown in Fig. 8(d)-(f), and the corresponding motion contrast images are shown in Fig. 9(a)-(c). Some capillaries that were not observed in both confocal and phase contrast images in Fig. 8 are visible in the motion contrast images as indicated by the white arrows. Blood flow velocities of multiple vessels could be measured from a single set of images, and ROIs are indicated by lines or boxes on duplicated motion contrast images (Fig. 9(d)-(f)). Capillaries appear different in the motion contrast images depending on the angle between the capillary and illumination line direction as previously reported [6]. Capillaries that are parallel to the illumination line have two parallel thinner lines outlining the perfused lumen (C1-1, C1-3 and C2), while, those perpendicular to illumination line have one thicker line inside the capillary lumen (C1-2, C3 and C4). For both cases, velocities were measured using skeletonized capillary segments either on central or boundary regions having high intensities in motion contrast images. The measured blood flow velocities in capillaries are plotted in Fig. 9(g)-(i) showing cardiac-dependent pulsatile patterns with normal resting heart-beat rate. Blood flow velocities of a single capillary measured from three different segments (C1-1, C1-2 and C1-3) show similar shapes as shown in Fig. 9(g). Blood flow velocities of arterioles or venules, V1, V2 and V3, measured from the same sets of images are plotted in Fig. 9(j)-(m) showing synchronized cardiac-dependent pulsatile patterns with Fig. 9(g)-(i), respectively. The normalized cross-correlation values shown in Fig. 9(n)-(p) have an inverse relationship with the flow velocities due to the variation in blood cells profile as they move over a longer distance. However, cross-correlation and velocity plots were not perfectly correlated as there are other factors affecting cross-correlation values such as various vessel lumen diameters, focusing depth fluctuation during AO correction and intensity changes due to eye movements. Furthermore, variations in local hematocrit, inter-cellular spacing and cell aggregation [46] could also effect on the cross-correlation values. This points to possible limitations in extracting accurate flow velocities using optical coherence tomography angiography relying mostly on decorrelation between consecutive frames.
Fig. 9.
(a)-(c) Motion contrast images calculated from the same set of images as shown in Fig. 8(d)-(f), respectively. Arrows indicate capillaries not readily observed in Fig. 8. The orange lines indicate the orientation of the line illumination. (d)-(f) Duplicated motion contrast images with ROIs indicated by lines and rectangular boxes. (g)-(i) Measured blood flow velocities in capillaries and (j)-(m) arterioles or venules. (n)-(p) Normalized cross-correlation values corresponding to the velocities of (j)-(m), respectively.
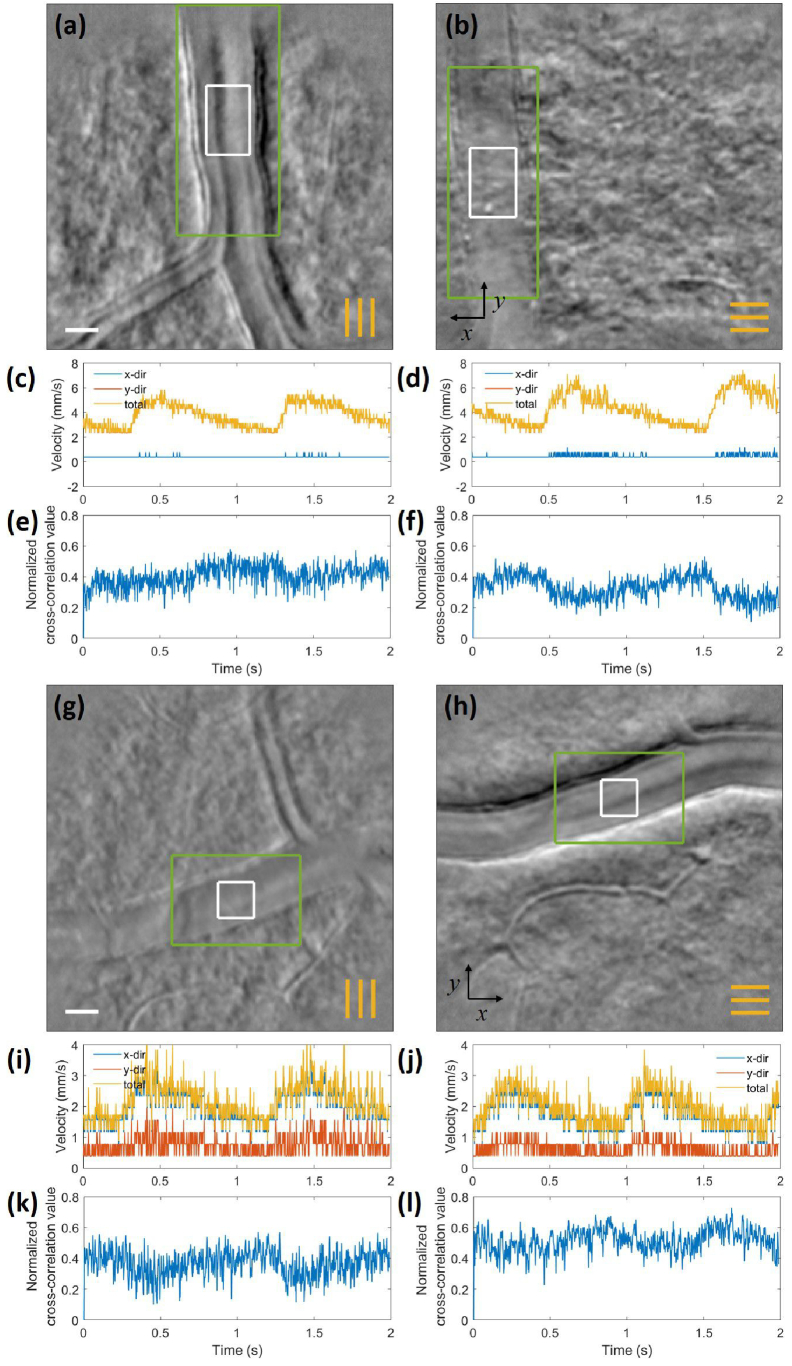
Two vessels of N2 and N3 imaged with both vertical and horizontal line illumination are shown in Fig. 10(a)-(b) and (g)-(h). The videos of Fig. 10(g) and (h) are shown in Visualization 6 (58.3MB, avi) and Visualization 7 (60.1MB, avi) , respectively. Vessel walls and capillaries are more clearly visible in the registered average of phase contrast images when the line illumination is parallel to the vessels. Although individual blood cells in capillaries could be resolved independent of illumination line direction, blood cell movements parallel to the phase contrast direction degraded the phase contrast signal of blood cells by averaging images. The cross-correlation based method was able to measure blood flow velocity using both vertical and horizontal line illumination, but the normalized cross-correlation values were lower with illumination lines perpendicular to the vessel as shown in Fig. 10(e)-(f) and (k)-(l).
Fig. 10.
Registered average of phase contrast vascular images of N2 at T SR using (a) vertical line illumination and (b) horizontal line illumination. (c)-(d) show the velocity measurement over 2 seconds showing average velocity of 4 mm/s. (e)-(f) Corresponding normalized cross-correlation values, showing inverse relationship with the flow velocities. (g)-(h) show similar images of N3 at T IR. (i)-(j) Blood flow velocity measurement from (g)-(h) showing average velocity of 2 mm/s. (k)-(l) Corresponding normalized cross-correlation values, showing lower normalized cross-correlation values with illumination lines perpendicular to the vessel than those parallel to the vessel. The orange lines indicate the orientation of the line illumination. The scale bar is 20 m.
Blood flow velocities of five capillaries having diameters of 4.7 to 5.5 m and eleven arterioles and venules having diameters of 9.6 to 36.1 m were measured. Their average velocity over one cardiac pursatile cycle were in the range of 0.975 to 2.08 mm/s for capillaries and 1.95 to 10.4 mm/s for arterioles and venules. The average flow velocities of the arterioles and venules plotted as a function of vessel lumen diameter with their fitted linear regression line are shown in Supplement 1 (1.6MB, pdf) . The velocity range and fitted line were reasonably matched with that of control vessels having diameter of <40 m in [47]. R2 of our data, 0.28, is lower than 0.68 reported in [47], due to smaller sample size. The measured range of instantaneous flow velocities were 0.7 to 20 mm/s.
3.3. Discussion
Considering for a moment the use of the DMD in a retinal imaging system. Almost all imaging system are inefficient in the light delivery to the eye, correctly choosing the optimization of the light reflected from the eye to the detector over that of the incident light. In addition to usual pattern illumination losses, the DMD also suffers from a mirror fill factor of 92% (DLP 7000, Texas Instruments, USA). So the total light “lost” during illumination is the product of the mirror fill factor and the fraction of the active area of the DMD with mirror segments being switched ‘in’ compared to the overall illuminated area as the line image is acquired. This resulted in 6.9% and 13.8% reflection by DMD for the two illumination line widths presented here. In the system described here and also by Krafft et al [19,22], upon reflection from the retina all of the light (confocal and multiply scattered) is collected by the detector (albeit with a lower sensitivity than a PMT) unlike in the use of a 1-D line camera [11–15]. The ability to capture all of this light coupled with the high speed of DMD (22 kHz update rate) and XGA DMD segment resolution (1024 by 768 segments) permits a virtually unlimited number of illumination and detection configurations that will be explored in the future.
While other blood velocity measurement approaches may be currently faster. The stationary line approach described in [30–32] only allows for measurement of a single vessel at a single retinal location. The 2D approach described here in principle allows for simultaneous measurement of velocities over the whole FOV. The high speed flood-illuminated approach described by Bedggood et al. [34–36] and Gofas-Salas et al.[48] also allows for velocity measurement over the 2D FOV but suffers from lower contrast. To examine the role of contrast on velocity measurement, the kymographs of the retinal capillary C1 (Fig. 9(d)) obtained from the confocal and phase contrast images are presented in Supplement 1 (1.6MB, pdf) with measured velocities, and it is clear that the signal from the phase contrast approach is less noisy. Similarly, velocities measured by the cross-correlation based method using phase contrast images showed much less noises than partially confocal images. Visualization 8 (23.5MB, mp4) and Visualization 9 (42.8MB, mp4) show videos of partially confocal, Fig. 8(c), and phase contrast images, Fig. 8(f), cross-correlation maps, measured velocities and cross-correlation values.
It should be noted that only 270 270 pixels on the Photron camera (read out at 10 kHz) are currently used for the FOV retinal image. However, the full 1024 1024 frame can be read out at 16 kHz, enabling the imaging of a retinal area 14 times larger than the current FOV. This would require a higher power light source or a more efficient use of the current source output to be achievable (current system is well below ANSI permitted limits). Unlike single flying spot systems, this larger FOV comes without a cost of imaging speed or pixel dwell time as a larger area of the DMD can be used to generate more simultaneous line exposures. The current 10 kHz sampling rate used here is slower than the maximum DMD update rate ( 22 kHz) and much slower than the camera frame rate (141 kHz with this pixel ROI). Hence, increasing the range of measurable blood flow velocities over this FOV would be achievable.
4. Conclusion
Simultaneous, high speed and high resolution confocal and phase contrast imaging using an AO-pcMLO is demonstrated. Phase contrast imaging provided improved visualization of retinal structures and cells such as photoreceptor inner segments, retinal vessel walls and blood cells as previously reported. The blood flow velocities of multiple small vessels with diameters <40 m could be measured from a single set of images, showing synchronized cardiac-related pulsatile patterns with normal resting heart-beat rate. Instantaneous blood flow velocities were measured to be in the range of 0.7 to 20 mm/s with a frame acquisition rate of 500 Hz. This system allows for convenient changes of phase contrast direction by simply projecting different directional line illumination patterns using the DMD.
Funding
National Institutes of Health, National Eye Institute10.13039/100000053 (EY031098).
Disclosures
The authors declare no conflicts of interest.
Data availability
Data underlying the results presented in this paper are not publicly available at this time but may be obtained from the authors upon reasonable request.
Supplemental document
See Supplement 1 (1.6MB, pdf) for supporting content.
References
- 1.Roorda A., Romero-Borja F., Donnelly III W. J. D., et al. , “Adaptive optics scanning laser ophthalmoscopy,” Opt. Express 10(9), 405–412 (2002). 10.1364/OE.10.000405 [DOI] [PubMed] [Google Scholar]
- 2.Elsner A., Miura M., Burns S., et al. , “Multiply scattered light tomography and confocal imaging: detecting neovascularization in age-related macular degeneration,” Opt. Express 7(2), 95–106 (2000). 10.1364/OE.7.000095 [DOI] [PubMed] [Google Scholar]
- 3.Scoles D., Sulai Y. N., Langlo C. S., et al. , “In Vivo Imaging of Human Cone Photoreceptor Inner Segments,” Invest. Ophthalmol. Vis. Sci. 55(7), 4244–4251 (2014). 10.1167/iovs.14-14542 [DOI] [PMC free article] [PubMed] [Google Scholar]
- 4.Scoles D., Sulai Y. N., Dubra A., “In vivo dark-field imaging of the retinal pigment epithelium cell mosaic,” Biomed. Opt. Express 4(9), 1710–1723 (2013). 10.1364/BOE.4.001710 [DOI] [PMC free article] [PubMed] [Google Scholar]
- 5.Chui T. Y. P., VanNasdale D. A., Burns S. A., “The use of forward scatter to improve retinal vascular imaging with an adaptive optics scanning laser ophthalmoscope,” Biomed. Opt. Express 3(10), 2537–2549 (2012). 10.1364/BOE.3.002537 [DOI] [PMC free article] [PubMed] [Google Scholar]
- 6.Sulai Y. N., Scoles D., Harvey Z., et al. , “Visualization of retinal vascular structure and perfusion with a nonconfocal adaptive optics scanning light ophthalmoscope,” J. Opt. Soc. Am. A 31(3), 569–579 (2014). 10.1364/JOSAA.31.000569 [DOI] [PMC free article] [PubMed] [Google Scholar]
- 7.Rossi E. A., Granger C. E., Sharma R., et al. , “Imaging individual neurons in the retinal ganglion cell layer of the living eye,” Proc. Natl. Acad. Sci. U.S.A. 114(3), 586–591 (2017). 10.1073/pnas.1613445114 [DOI] [PMC free article] [PubMed] [Google Scholar]
- 8.Gofas-Salas E., Rui Y., Mecê P., et al. , “Design of a radial multi-offset detection pattern for in vivo phase contrast imaging of the inner retina in humans,” Biomed. Opt. Express 13(1), 117–132 (2022). 10.1364/BOE.441808 [DOI] [PMC free article] [PubMed] [Google Scholar]
- 9.Mozaffari S., Jaedicke V., Larocca F., et al. , “Versatile multi-detector scheme for adaptive optics scanning laser ophthalmoscopy,” Biomed. Opt. Express 9(11), 5477–5488 (2018). 10.1364/BOE.9.005477 [DOI] [PMC free article] [PubMed] [Google Scholar]
- 10.Sapoznik K. A., Luo T., de Castro A., et al. , “Enhanced retinal vasculature imaging with a rapidly configurable aperture,” Biomed. Opt. Express 9(3), 1323–1333 (2018). 10.1364/BOE.9.001323 [DOI] [PMC free article] [PubMed] [Google Scholar]
- 11.Mujat M., Ferguson R. D., Iftimia N., et al. , “Compact adaptive optics line scanning ophthalmoscope,” Opt. Express 17(12), 10242–10258 (2009). 10.1364/OE.17.010242 [DOI] [PMC free article] [PubMed] [Google Scholar]
- 12.Lu J., Gu B., Wang X., et al. , “Adaptive optics parallel near-confocal scanning ophthalmoscopy,” Opt. Lett. 41(16), 3852–3855 (2016). 10.1364/OL.41.003852 [DOI] [PMC free article] [PubMed] [Google Scholar]
- 13.Lu J., Gu B., Wang X., et al. , “High-speed adaptive optics line scan confocal retinal imaging for human eye,” PLoS One 12(3), e0169358 (2017). 10.1371/journal.pone.0169358 [DOI] [PMC free article] [PubMed] [Google Scholar]
- 14.Lu J., Gu B., Wang X., et al. , “High speed adaptive optics ophthalmoscopy with an anamorphic point spread function,” Opt. Express 26(11), 14356–14374 (2018). 10.1364/OE.26.014356 [DOI] [PMC free article] [PubMed] [Google Scholar]
- 15.Pandiyan V. P., Jiang X., Kuchenbecker J. A., et al. , “Reflective mirror-based line-scan adaptive optics oct for imaging retinal structure and function,” Biomed. Opt. Express 12(9), 5865–5880 (2021). 10.1364/BOE.436337 [DOI] [PMC free article] [PubMed] [Google Scholar]
- 16.Muller M. S., Elsner A. E., “Confocal retinal imaging using a digital light projector with a near infrared VCSEL source,” in Emerging Digital Micromirror Device Based Systems and Applications X , Vol. 10546 Douglass M. R., eds., International Society for Optics and Photonics (SPIE, 2018), p. 105460G. [DOI] [PMC free article] [PubMed] [Google Scholar]
- 17.Vienola K. V., Damodaran M., Braaf B., et al. , “Parallel line scanning ophthalmoscope for retinal imaging,” Opt. Lett. 40(22), 5335–5338 (2015). 10.1364/OL.40.005335 [DOI] [PubMed] [Google Scholar]
- 18.Damodaran M., Vienola K. V., Braaf B., et al. , “Digital micromirror device based ophthalmoscope with concentric circle scanning,” Biomed. Opt. Express 8(5), 2766–2780 (2017). 10.1364/BOE.8.002766 [DOI] [PMC free article] [PubMed] [Google Scholar]
- 19.Krafft L., Gofas-Salas E., Lai-Tim Y., et al. , “Partial-field illumination ophthalmoscope: improving the contrast of a camera-based retinal imager,” Appl. Opt. 60(31), 9951–9956 (2021). 10.1364/AO.428048 [DOI] [PubMed] [Google Scholar]
- 20.Lee S., Choi S. S., Meleppat R. K., et al. , “Programmable, high-speed, adaptive optics partially confocal multi-spot ophthalmoscope using a digital micromirror device,” Opt. Lett. 48(3), 791–794 (2023). 10.1364/OL.480688 [DOI] [PMC free article] [PubMed] [Google Scholar]
- 21.Mecê P., Gofas-Salas E., Rui Y., et al. , “Spatial-frequency-based image reconstruction to improve image contrast in multi-offset adaptive optics ophthalmoscopy,” Opt. Lett. 46(5), 1085–1088 (2021). 10.1364/OL.417903 [DOI] [PMC free article] [PubMed] [Google Scholar]
- 22.Krafft L., Senée P., Gofas E., et al. , “Multimodal high-resolution retinal imaging using a camera-based dmd-integrated adaptive optics flood-illumination ophthalmoscope,” Opt. Lett. 48(14), 3785–3788 (2023). 10.1364/OL.495515 [DOI] [PubMed] [Google Scholar]
- 23.Felberer F., Kroisamer J.-S., Hitzenberger C. K., et al. , “Lens based adaptive optics scanning laser ophthalmoscope,” Opt. Express 20(16), 17297–17310 (2012). 10.1364/OE.20.017297 [DOI] [PubMed] [Google Scholar]
- 24.Burns S. A., Tumbar R., Elsner A. E., et al. , “Large-field-of-view, modular, stabilized, adaptive-optics-based scanning laser ophthalmoscope,” J. Opt. Soc. Am. A 24(5), 1313–1326 (2007). 10.1364/JOSAA.24.001313 [DOI] [PMC free article] [PubMed] [Google Scholar]
- 25.Gómez-Vieyra A., Dubra A., Malacara-Hernández D., et al. , “First-order design of off-axis reflective ophthalmic adaptive optics systems using afocal telescopes,” Opt. Express 17(21), 18906–18919 (2009). 10.1364/OE.17.018906 [DOI] [PMC free article] [PubMed] [Google Scholar]
- 26.Dubra A., Sulai Y., “Reflective afocal broadband adaptive optics scanning ophthalmoscope,” Biomed. Opt. Express 2(6), 1757–1768 (2011). 10.1364/BOE.2.001757 [DOI] [PMC free article] [PubMed] [Google Scholar]
- 27.Dubra A., Sulai Y., Norris J. L., et al. , “Noninvasive imaging of the human rod photoreceptor mosaic using a confocal adaptive optics scanning ophthalmoscope,” Biomed. Opt. Express 2(7), 1864–1876 (2011). 10.1364/BOE.2.001864 [DOI] [PMC free article] [PubMed] [Google Scholar]
- 28.Lee S.-H., Werner J. S., Zawadzki R. J., “Improved visualization of outer retinal morphology with aberration cancelling reflective optical design for adaptive optics - optical coherence tomography,” Biomed. Opt. Express 4(11), 2508–2517 (2013). 10.1364/BOE.4.002508 [DOI] [PMC free article] [PubMed] [Google Scholar]
- 29.Martin J. A., Roorda A., “Direct and noninvasive assessment of parafoveal capillary leukocyte velocity,” Ophthalmology 112(12), 2219–2224 (2005). 10.1016/j.ophtha.2005.06.033 [DOI] [PubMed] [Google Scholar]
- 30.Zhong Z., Petrig B. L., Qi X., et al. , “In vivo measurement of erythrocyte velocity and retinal blood flow using adaptive optics scanning laser ophthalmoscopy,” Opt. Express 16(17), 12746–12756 (2008). 10.1364/OE.16.012746 [DOI] [PMC free article] [PubMed] [Google Scholar]
- 31.Joseph A., Guevara-Torres A., Schallek J., “Imaging single-cell blood flow in the smallest to largest vessels in the living retina,” eLife 8, e45077 (2019). 10.7554/eLife.45077 [DOI] [PMC free article] [PubMed] [Google Scholar]
- 32.Liu R., Wang X., Hoshi S., et al. , “High-speed measurement of retinal arterial blood flow in the living human eye with adaptive optics ophthalmoscopy,” Opt. Lett. 48(8), 1994–1997 (2023). 10.1364/OL.480896 [DOI] [PMC free article] [PubMed] [Google Scholar]
- 33.Gu B., Wang X., Twa M. D., et al. , “Noninvasive in vivo characterization of erythrocyte motion in human retinal capillaries using high-speed adaptive optics near-confocal imaging,” Biomed. Opt. Express 9(8), 3653–3677 (2018). 10.1364/BOE.9.003653 [DOI] [PMC free article] [PubMed] [Google Scholar]
- 34.Bedggood P., Metha A., “Analysis of contrast and motion signals generated by human blood constituents in capillary flow,” Opt. Lett. 39(3), 610–613 (2014). 10.1364/OL.39.000610 [DOI] [PubMed] [Google Scholar]
- 35.Bedggood P., Metha A., “Direct visualization and characterization of erythrocyte flow in human retinal capillaries,” Biomed. Opt. Express 3(12), 3264–3277 (2012). 10.1364/BOE.3.003264 [DOI] [PMC free article] [PubMed] [Google Scholar]
- 36.Bedggood P., Metha A., “Mapping flow velocity in the human retinal capillary network with pixel intensity cross correlation,” PLoS One 14(6), e0218918 (2019). 10.1371/journal.pone.0218918 [DOI] [PMC free article] [PubMed] [Google Scholar]
- 37.de Castro A., Huang G., Sawides L., et al. , “Rapid high resolution imaging with a dual-channel scanning technique,” Opt. Lett. 41(8), 1881–1884 (2016). 10.1364/OL.41.001881 [DOI] [PMC free article] [PubMed] [Google Scholar]
- 38.Laser Institute of America, “American National Standard for safe use of lasers ANSI Z136.1-2018,”.
- 39.Ford T. N., Chu K. K., Mertz J., “Phase-gradient microscopy in thick tissue with oblique back-illumination,” Nat. Methods 9(12), 1195–1197 (2012). 10.1038/nmeth.2219 [DOI] [PMC free article] [PubMed] [Google Scholar]
- 40.Duncan D. D., Lemaillet P., Ibrahim M., et al. , “Absolute blood velocity measured with a modified fundus camera,” J. Biomed. Opt. 15(5), 056014 (2010). 10.1117/1.3494565 [DOI] [PMC free article] [PubMed] [Google Scholar]
- 41.Barrett H. H., Love J., “ III. The Radon Transform and its Applications (Elsevier, 1984), pp. 217–286. [Google Scholar]
- 42.Drew P. J., Blinder P., Cauwenberghs G., et al. , “Rapid determination of particle velocity from space-time images using the radon transform,” J Comput Neurosci 29(1-2), 5–11 (2010). 10.1007/s10827-009-0159-1 [DOI] [PMC free article] [PubMed] [Google Scholar]
- 43.Wells-Gray E. M., Choi S. S., Bries A., et al. , “Variation in rod and cone density from the fovea to the mid-periphery in healthy human retinas using adaptive optics scanning laser ophthalmoscopy,” Eye 30(8), 1135–1143 (2016). 10.1038/eye.2016.107 [DOI] [PMC free article] [PubMed] [Google Scholar]
- 44.Guevara-Torres A., Joseph A., Schallek J. B., “Label free measurement of retinal blood cell flux, velocity, hematocrit and capillary width in the living mouse eye,” Biomed. Opt. Express 7(10), 4228–4249 (2016). 10.1364/BOE.7.004228 [DOI] [PMC free article] [PubMed] [Google Scholar]
- 45.Guevara-Torres A., Williams D. R., Schallek J. B., “Origin of cell contrast in offset aperture adaptive optics ophthalmoscopy,” Opt. Lett. 45(4), 840–843 (2020). 10.1364/OL.382589 [DOI] [PMC free article] [PubMed] [Google Scholar]
- 46.Bedggood P., Metha A., “Imaging relative stasis of the blood column in human retinal capillaries,” Biomed. Opt. Express 10(11), 6009–6028 (2019). 10.1364/BOE.10.006009 [DOI] [PMC free article] [PubMed] [Google Scholar]
- 47.Palochak C. M. A., Lee H. E., Song J., et al. , “Retinal blood velocity and flow in early diabetes and diabetic retinopathy using adaptive optics scanning laser ophthalmoscopy,” J. Clin. Med. 8(8), 1165 (2019). 10.3390/jcm8081165 [DOI] [PMC free article] [PubMed] [Google Scholar]
- 48.Gofas-Salas E., Mecê P., Mugnier L., et al. , “Near infrared adaptive optics flood illumination retinal angiography,” Biomed. Opt. Express 10(6), 2730–2743 (2019). 10.1364/BOE.10.002730 [DOI] [PMC free article] [PubMed] [Google Scholar]
Associated Data
This section collects any data citations, data availability statements, or supplementary materials included in this article.
Data Availability Statement
Data underlying the results presented in this paper are not publicly available at this time but may be obtained from the authors upon reasonable request.


