

Abstract
Background
Medicare Part D plans are required to provide Medication therapy management (MTM) programs to eligible beneficiaries to optimize medication utilization. MTM programs’ effects on medication utilization among older persons living with HIV/AIDS (PLWHs) remain unclear.
Objective
This study examined the effects of the Medicare MTM programs on medication utilization among PLWHs.
Methods
This study analyzed 2017 Medicare databases linked to the Area Health Resources Files. Recipients and non-recipients of the MTM services were compared on their medication utilization: adherence to antiretroviral medications, drug-drug interactions, and concurrent use of opioids and benzodiazepines. The intervention group comprised recipients of the medication therapy management services, and the control group was non-recipients meeting the eligibility criteria. A propensity score with a ratio of 1:2 between the intervention and control groups was used to identify study groups with balanced characteristics. A logistic regression was used to control for patient/community characteristics.
Results
After matching, the intervention and comparison groups comprised 3,298 and 6,596 beneficiaries for the antiretroviral adherence measure, 809 and 1,618 for the drug-drug interactions measure, and 691 and 1,382 for the concurrent use of opioids and benzodiazepines measure. The intervention was associated with higher odds of adherence to antiretroviral medications (adjusted odds ratio = 1.15, 95% Confidence Interval = 1.04 – 1.26), and no concurrent use of opioids and benzodiazepines (adjusted odds ratio = 1.255, 95% Confidence Interval = 1.005 – 1.568). The study groups did not differ on no drug-drug interactions (adjusted odds ratio = 0.95, 95% Confidence Interval = 0.74 – 1.20).
Conclusions
Medicare MTM programs effectively improved medication utilization among people living with HIV/AIDS. Future studies should explore the long-term effects of the program.
Keywords: HIV, Medication Therapy Management, Highly Active Antiretroviral Therapy, Drug Interactions, Opioids, Benzodiazepines
Introduction
HIV/AIDS exerts a tremendous disease burden in the United States in general and for Medicare in particular. Approximately 1.2 million people were living with HIV/AIDS in the U.S., with 36,136 new infections in 2021.1 By 2020, the number of people living with HIV/AIDS (PLWHs) covered by traditional Medicare plans has more than doubled since 1997.2 As a result, Medicare covered approximately 28% of PLWHs in 2020.2 As of 2020, about 77% Medicare beneficiaries with HIV/AIDS initially qualified for Medicare through the disability pathway, among whom, some qualified due to end-stage renal disease and others amyotrophic lateral sclerosis.2 The proportion of PLWHs who qualified for Medicare based on age increased from 14% in 2015 to 23% in 2020 due to their increased lifespan thanks to effective HIV treatment.2 As the second largest government payer after Medicaid, Medicare pays a hefty price tag for HIV: Medicare spent $11.3 billion for HIV treatment and care in the fiscal year 2022, accounting for 39% of the total federal HIV care expenditure.2 Covering essential services, including preventive services, prescription medications, physician services, and inpatient and outpatient care, Medicare plays a significant role in HIV prevention and care.2
Advances in antiretroviral therapy have contributed to lower mortality and an extended lifespan; however, some chronic conditions are now more prevalent among older PLWHs.3,4 For example, according to a previous study that used a Medicare sample of 1996–2015, hypertension prevalence in older men and women with HIV was 72.0% and 83.1%, respectively, much higher than 61.0% and 71.6% among their HIV-negative counterparts.4 Further, older PLWHs had 12.7 and 1.3 times the odds of having chronic hepatitis and hypertension than their HIV-negative counterparts, according to a previous study that investigated a 2016 Medicare sample.5 Adherence to antiretroviral medications is necessary to achieve and maintain viral suppression. Thus, antiretroviral medication adherence is the key to the success of HIV treatment.
Although generally more adherent to antiretroviral medications than their younger peers, older PLWHs face many challenges in their daily medication management, such as cognitive impairment, mental health issues, and lack of social support.6 Further, many older PLWHs experience medication issues, including polypharmacy, drug-drug interactions (DDI), and adverse drug events due to the high burden of non-HIV chronic conditions.6 For instance, HIV-induced chronic inflammation and peripheral neuropathy can cause chronic pain, so chronic pain is prevalent among PLWHs: previous studies estimated this prevalence at 25% – 83%.7,8 To treat chronic pain, long-term opioids are more frequently prescribed to PLWHs than to people without HIV.9 Since the long-term use of benzodiazepine is ubiquitous among older PLWHs, concurrent use of opioids and benzodiazepines (COB) is also a legitimate concern among this population.10 This is also concerning because people who receive opioids and benzodiazepines concurrently show an increased risk of an emergency room visit or hospital admission for opioid overdose than those prescribed opioids but not benzodiazepines.11 Overdose death rates among individuals prescribed opioids and benzodiazepine concurrently were reported as ten times higher than the ones who received opioid prescriptions alone.12
To optimize medication therapeutic outcomes and reduce the risk of adverse drug events, the Centers for Medicare and Medicaid Services (CMS) initiated the medication therapy management (MTM) program in 2006 and has required all Part D plans to implement the program.13 Based on CMS guidelines, plans set their eligibility thresholds for MTM programs.14 For example, the majority of plans applied the MTM’s general eligibility criteria to enroll beneficiaries who had at least 3 chronic conditions, took 8 or more Part D-covered medications, and incurred a minimum annual medication expense of $3,919 in 2017.14,15 With the core MTM service, comprehensive medication review, medication consultations were provided to patients on a yearly basis. During these interactive consultations with patients, pharmacists or other qualified providers systematically assess medication therapies and identify medication-related issues.14 A written summary in a standardized format with a recommended medication action plan is provided to patients and prescribers after the consultations.14
Previous research revealed that MTM receipt was associated with improved medication adherence, lower healthcare expenses, and a racial/ethnic disparity reduction in nonadherence to medications.16–18 However, MTM effects on medication utilization among older PLWHs remain unclear. This study examined whether receiving MTM services was associated with improved medication utilization among older PLWHs in Medicare. This study’s medication utilization measures included adherence to antiretroviral medications, drug-drug interactions, and concurrent use of opioids and benzodiazepines. By providing empirical evidence of MTM’s effectiveness on medication utilization, this study may guide policy changes regarding the expansion of MTM among older PLWHs in Medicare.
Methods
Data sources and sample selection
This cross-sectional study analyzed 2017 Medicare data linked to the Area Health Resources Files.19,20 The Medicare databases used were the Master Beneficiary Summary File, Part D MTM Data File, Part D Event File, and Parts A and B claims.19 Beneficiaries’ information was derived from the Medicare databases, including demographic characteristics, chronic disease diagnosis, prescription utilization information, and MTM enrollment status. Further, community-level characteristics of interest were obtained from the Area Health Resources Files.20
Inclusion criteria were: (1) aged 65 years and above in 2017; (2) were alive in 2017; (3) had continuous coverage of Medicare Parts A, B, and D in 2017; (4) used antiretroviral medications in 2017.
Conceptual framework
Andersen’s Behavioral Model of Health Services Use was applied as a conceptual model in selecting factors associated with the study outcome, which were all measures of medication utilization.21 This model categorized factors determining individuals’ health service utilization into predisposing, enabling, and need factors.21 This study included individual-level and community-level sociodemographic characteristics as predisposing factors. The predisposing factors at the individual level included age, gender, and race/ethnicity. The community-level factors, including the percentage of married-couple families, the percentage of people with high school and above degrees, the per capita income, and the percentage of people without health insurance in a community, were also considered as predisposing factors. The enabling factors referred to metropolitan statistical area, Health Professional Shortage Area, and census regions in this study. These factors reflect resources that are necessary for individuals to access health care. The study analysis included a risk adjustment summary score as a need factor accounting for patients’ health status. CMS originally developed the risk adjustment summary score to predict beneficiaries’ healthcare expenses using their demographic and diagnostic information.22 Since the risk adjustment summary score calculation covered patients’ major medical conditions, additional diagnoses were not included as need factors.23 An individual with a higher score was projected to incur higher healthcare costs due to worse health status.
Intervention and comparison groups
MTM recipients in 2017 consisted of the intervention group of the study. The comparison group comprised beneficiaries eligible for MTM but were not enrolled in the program in 2017. According to CMS guidelines, the MTM eligibility thresholds for 2017 were 3 chronic diseases, a minimum of 8 Part D-covered medications, and incurring at least $3,919 for Part D-covered medications in 2017.14 Although these were established as minimum thresholds by CMS, most Part D plans adopted these thresholds.15 For example, over 84% of Part D plans adopted 3 chronic diseases, and 66% of programs set 8 Part D-covered medications as their thresholds to enroll beneficiaries in the MTM program in 2017.15 Therefore, beneficiaries who exceeded these thresholds, including 3 chronic diseases, 8 Part D-covered medications, and an annual cost of $3,919 for medications, but were not enrolled in the MTM program, were included in the comparison group.
Regarding data sources for MTM eligibility determination, prescription records and annual medication costs of eligible beneficiaries were obtained from the 2017 Part D Event File.24 Patients’ medical conditions were determined based on beneficiaries’ Parts A and B claims data using the ICD-10 diagnosis codes of a list of 25 chronic diseases for Medicare beneficiaries in a previous study.25 A comparable intervention and a comparison group were identified using a propensity score matching strategy to ensure balanced characteristics between the two groups. Beneficiaries were matched on their predicted likelihood of receiving MTM in a logistic regression, including the variables suggested by the conceptual framework. The nearest-neighbor matching mechanism without replacement was applied to obtain the most balanced groups.26 Three propensity score matchings were performed, one for each measure. Based on the sample size differences between the intervention group and the comparison group before matching, a ratio of 1:2 between the intervention group and the comparison group was applied to all 3 measures to achieve the best matching.
Study outcomes
The study outcome was medication utilization, including adherence to antiretroviral medications, no DDI, and no COB. The 3 measures were developed by the Pharmacy Quality Alliance, a national quality organization dedicated to advancing medication utilization by developing performance measures for Medicare Part D.27,28 Adherence to antiretroviral medications was defined as greater than or equal to 90% of the proportion of days covered by the prescriptions of interest.27,28 The proportion of days covered was determined by the number of days covered by one or more prescriptions divided by the total number of days starting from the first prescription date to the end of the year.27,28 The medication safety measure DDI was applied in detecting beneficiaries’ concurrent use of two medications not recommended by pharmacology or practice due to adverse effects or unfavorable interactions. Further, COB was defined as 30 or more cumulative days of overlapping supply days for an opioid and a benzodiazepine during the measurement year.28
Statistical analysis
The Medicare databases were accessed through the CMS Virtual Research Data Center desktop, and its associated SAS software (9.4, Cary, NC) was used to perform all the data analyses. The Institutional Review Board at the corresponding author’s institution granted the exempt status of the study on February 20, 2020 (approval number 20–07197-XM).
Beneficiaries’ characteristics were compared between the intervention and comparison groups before and after propensity score matching for all 3 medication utilization measures. Chi-square tests were performed to compare all categorical variables, and t-tests were performed for continuous variables. Further, Chi-square tests were conducted to compare the percentages of beneficiaries who appropriately used medications regarding the 3 measures between the intervention and comparison groups. A 2-tailed alpha value of 0.05 or below determined the statistical significance.
MTM effects on medication utilization were assessed in the adjusted multivariate analysis incorporating all factors defined by the conceptual model. The estimated coefficient of MTM receipt captures the MTM effects on a beneficiary’s medication utilization. An odds ratio over one would indicate that MTM receipt was associated with improved adherence to antiretroviral medications and safety. The observations from the same county were clustered to account for their potential correlations.
Results
For the antiretroviral adherence measure, 3,659 and 13,105 beneficiaries were identified for the intervention and comparison groups before the matching. After matching with a ratio of 1:2, 3,298 beneficiaries remained in the intervention group and 6,596 in the comparison group, with a total sample size of 9,894. Table 1 presents beneficiaries’ characteristics by study group before and after the matching for the antiretroviral adherence measure. Before the matching, the intervention group exhibited a lower proportion of male beneficiaries, a lower proportion of the uninsured at the county level, and a higher mean risk adjustment summary score than the comparison group (p < .01). The geographic distributions also were different between the two groups (p < .01). After the matching, the intervention and comparison groups did not differ significantly for any characteristics (all p > .05).
Table 1.
Baseline Characteristics for Intervention and Comparison Groups Before and After Propensity Score Matching among Medicare Beneficiaries Who Used Antiretroviral Medications in 2017
| Characteristics | Before Matching | After Matching | ||||||
|---|---|---|---|---|---|---|---|---|
| Intervention | Comparison | Intervention | Comparison | |||||
| (n=3,659) | (n=13,105) | (n=3,298, 33.3%) | (n=6,596, 66.7%) | |||||
| Number | % | Number | % | Number | % | Number | % | |
| Predisposing Factors | ||||||||
| Age, mean (SD) | 70.18 (4.56) | 70.28 (4.69) | 70.25 (4.62) | 70.14 (4.64) | ||||
| Maleb | 2,659 | 72.67 | 9,880 | 75.39 | 2,450 | 74.29 | 4,900 | 74.29 |
| Race/Ethnicity | ||||||||
| Non-Hispanic Whites | 1,698 | 46.41 | 6,246 | 47.66 | 1,569 | 47.57 | 3,138 | 47.57 |
| Blacks (African Americans) | 1,322 | 36.13 | 4,740 | 36.17 | 1,242 | 37.66 | 2,484 | 37.66 |
| Hispanics | 471 | 12.87 | 1,538 | 11.74 | 372 | 11.28 | 744 | 11.28 |
| Asian/Pacific Islanders | 62 | 1.69 | 175 | 1.34 | 37 | 1.12 | 74 | 1.12 |
| Other | 106 | 2.90 | 406 | 3.10 | 78 | 2.37 | 156 | 2.37 |
| Proportion of Married-Couple Families, mean (SD)a | 0.68 (0.09) | 0.68 (0.09) | 0.68 (0.09) | 0.68 (0.09) | ||||
| Proportion of High School Education and Above, mean (SD)a | 0.86 (0.05) | 0.86 (0.05) | 0.86 (0.05) | 0.86 (0.05) | ||||
| Income Per Capita (in $1,000), mean (SD)a | 59.77 (29.53) | 59.84 (29.90) | 60.32 (30.08) | 59.65 (29.64) | ||||
| Proportion of the Uninsured, mean (SD)ab | 0.097 (0.046) | 0.104 (0.048) | 0.098 (0.046) | 0.097 (0.044) | ||||
| Enabling Factors | ||||||||
| Metropolitan Statistical Areaa | 3,402 | 92.98 | 12,155 | 92.75 | 3,104 | 94.12 | 6,208 | 94.12 |
| Health Professional Shortage Areaa | 3,531 | 96.50 | 12,589 | 96.06 | 3,226 | 97.82 | 6,452 | 97.82 |
| Census Regionsab | ||||||||
| Northeast | 1,192 | 32.58 | 3,421 | 26.10 | 1,023 | 31.02 | 2,046 | 31.02 |
| Midwest | 395 | 10.80 | 1,378 | 10.52 | 347 | 10.52 | 694 | 10.52 |
| South | 1,305 | 35.67 | 5,478 | 41.80 | 1,204 | 36.51 | 2,408 | 36.51 |
| West | 767 | 20.96 | 2,828 | 21.58 | 724 | 21.95 | 1,448 | 21.95 |
| Need Factor | ||||||||
| Risk Adjustment Summary Score, mean (SD)b | 2.79 (1.87) | 2.23 (1.56) | 2.54 (1.55) | 2.49 (1.60) | ||||
SD = standard deviation.
County-level characteristics.
Characteristic significantly differed between the intervention and comparison groups before matching (P < .01).
All characteristics were similar between the intervention and comparison groups after matching (P > .05).
Before the matching, the intervention and comparison groups comprised 908 and 2,670 beneficiaries who met the DDI measure criteria among beneficiaries prescribed antiretroviral medications in 2017 (Appendix Table 1). After matching with a 1:2 ratio, the intervention group comprised 809 beneficiaries, and the comparison group included 1,618 beneficiaries (Appendix Table 1). The final study sample for this measure was 2,427 beneficiaries. Three characteristics exhibited significant differences between the intervention group and the comparison group before the matching: proportion of the uninsured at the county level, census regions, and risk adjustment summary score (p < .05). After the matching, the two groups did not show significant differences among all characteristics (p > .05).
A total of 802 beneficiaries who met the COB measure criteria among those who used antiretroviral medications were identified for the intervention group and 2,471 for the comparison group before the matching (Appendix Table 2). After matching with a ratio of 1:2, the final sample comprised 2,073 beneficiaries; the intervention group included 691 beneficiaries, and the comparison group consisted of 1,382 beneficiaries (Appendix Table 2). The intervention group and the comparison group differed in risk adjustment summary score and census regions before the matching (p < .05). However, after the matching, the intervention and comparison groups did not show significant differences for any characteristics (p > .05).
Figure 1 illustrates the proportions of beneficiaries with appropriate use of medications based on the unadjusted analysis. The proportion of beneficiaries who adhered to antiretroviral medications in the intervention group was 75.44%, significantly higher than the comparison group (73.09%, p = .01). The proportions of beneficiaries who did not have DDI issues were similar between the two groups (85.78% for intervention and 86.59% for comparison, p > .05). Further, the intervention group exhibited a significantly higher rate than the comparison group regarding the proportion of beneficiaries who did not use opioids and benzodiazepines concurrently (78.87% for intervention and 74.38% for comparison, p = .02).
Figure 1.
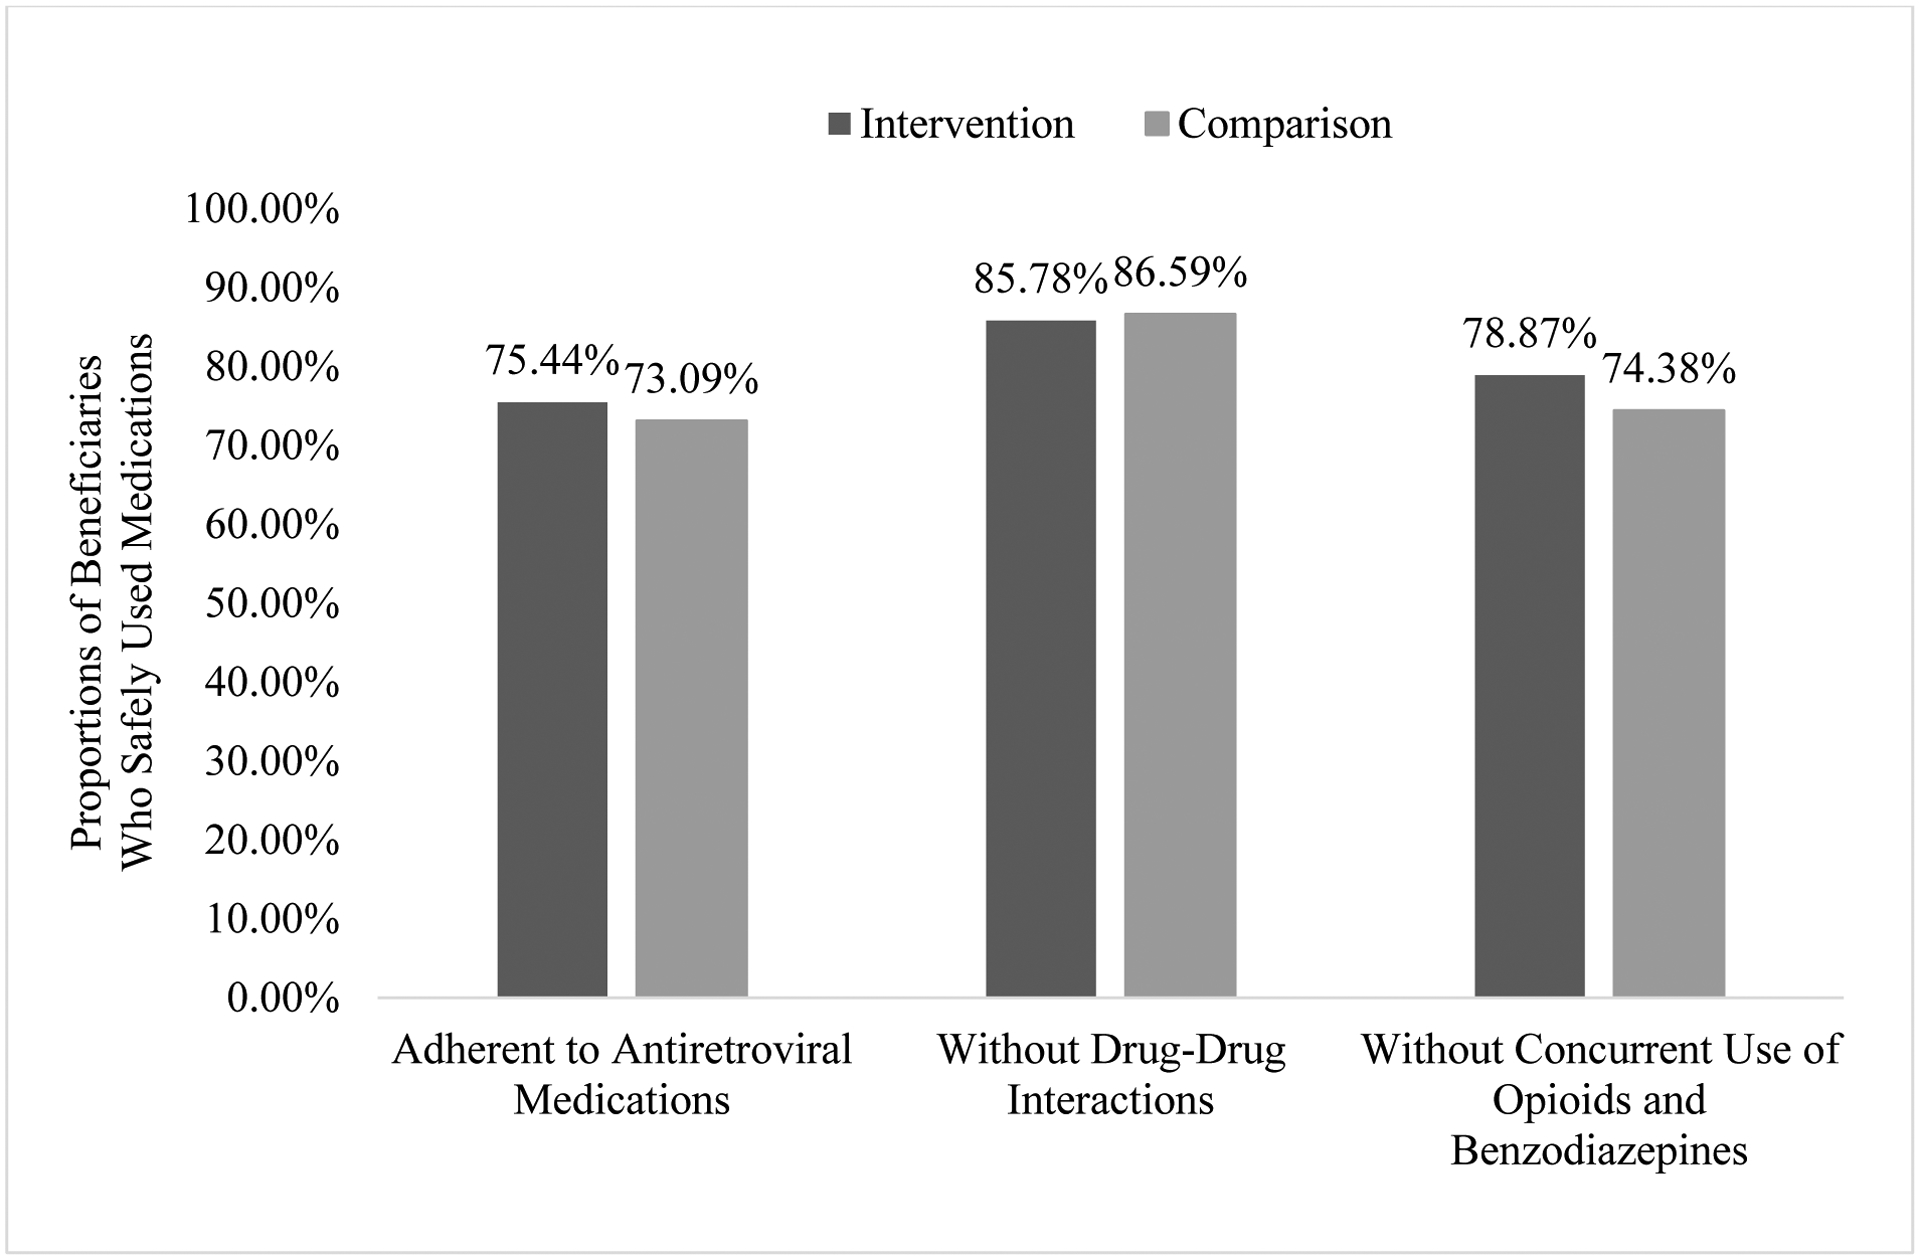
Proportions of Beneficiaries Who Safely Used Medications in Intervention and Comparison Groups among People Living with HIV/AIDS in Medicare
The adjusted analysis demonstrated that MTM receipt was associated with higher odds of adherence to antiretroviral medications and safe medication utilization regarding COB (Table 2). In contrast, MTM recipients and non-recipients did not differ in their odds regarding DDI. The adjusted odds ratio for MTM receipt in adherence to antiretroviral medications was 1.15 (95% Confidence Interval or CI = 1.04 – 1.26). This result indicated that the odds of adherence to antiretroviral medications among MTM recipients were 15% higher than among MTM non-recipients. Regarding the DDI measure, MTM recipients and non-recipients did not exhibit significant differences in their medication utilization with an adjusted odds ratio of 0.95 (95% CI = 0.74 – 1.20). For the COB measure, the adjusted odds ratio of 1.255 indicated that the odds of safe medication utilization for MTM recipients were 25.5% higher than for MTM non-recipients (95% CI = 1.005 – 1.568).
Table 2.
MTM Effects on the Medication Utilization among Medicare Beneficiaries Who Used Antiretroviral Medications in 2017
| Characteristics | Adherence to Antiretroviral Medications | Safe Use Regarding Drug-Drug Interactions | Safe Use Regarding Concurrent Use of Opioids and Benzodiazepines | |||
|---|---|---|---|---|---|---|
| (n = 9,894) | (n = 2,427) | (n = 2,073) | ||||
| Odds | 95% | Odds | 95% | Odds | 95% | |
| Ratio | Confidence | Ratio | Confidence | Ratio | Confidence | |
| MTM Receipt | 1.15 | 1.04 – 1.26 | 0.95 | 0.74 – 1.20 | 1.255 | 1.005 – 1.568 |
| Predisposing Factors | ||||||
| Age | 0.998 | 0.988 – 1.008 | 1.030 | 1.004 – 1.057 | 1.04 | 1.01 – 1.06 |
| Male | 1.22 | 1.08 – 1.37 | 1.22 | 0.94 – 1.58 | 1.30 | 1.06 – 1.60 |
| Race/Ethnicity | ||||||
| Blacks (African Americans) | 0.61 | 0.54 – 0.69 | 1.45 | 1.11 – 1.89 | 2.26 | 1.79 – 2.84 |
| Hispanics | 0.77 | 0.66 – 0.89 | 1.35 | 0.84 – 2.17 | 1.31 | 0.92 – 1.86 |
| Asian/Pacific Islanders | 0.70 | 0.47 – 1.06 | 0.88 | 0.28 – 2.77 | 1.29 | 0.48 – 3.44 |
| Other | 0.88 | 0.63 – 1.21 | 1.39 | 0.66 – 2.96 | 1.53 | 0.61 – 3.84 |
| Proportion of Married-Couple Familiesa | 1.44 | 0.62 – 3.35 | 0.53 | 0.08 – 3.38 | 0.23 | 0.03 – 1.72 |
| Proportion of High School Education and Abovea | 0.36 | 0.06 – 2.26 | 6.23 | 0.17 – 224.39 | 2.18 | 0.08 – 56.69 |
| Income Per Capita (in $1,000)a | 1.0001 | 0.9979 – 1.0022 | 0.997 | 0.993 – 1.001 | 0.999 | 0.994 – 1.005 |
| Proportion of the Uninsureda | 1.30 | 0.20 – 8.46 | 0.50 | 0.01 – 22.23 | 0.31 | 0.01 – 16.56 |
| Enabling Factors | ||||||
| Metropolitan Statistical Areaa | 1.17 | 0.94 – 1.45 | 1.07 | 0.65 – 1.76 | 0.72 | 0.46 – 1.12 |
| Health Professional Shortage Areaa | 1.31 | 0.99 – 1.72 | 0.60 | 0.27 – 1.32 | 0.96 | 0.51 – 1.82 |
| Census Regionsa | ||||||
| Midwest | 1.11 | 0.92 – 1.33 | 1.38 | 0.88 – 2.16 | 0.77 | 0.51 – 1.15 |
| South | 1.07 | 0.90 – 1.27 | 1.26 | 0.84 – 1.90 | 1.06 | 0.73 – 1.54 |
| West | 1.12 | 0.95 – 1.31 | 1.11 | 0.77 – 1.60 | 0.92 | 0.64 – 1.34 |
| Need Factor | ||||||
| Risk Adjustment Summary Score | 0.86 | 0.84 – 0.89 | 0.82 | 0.77 – 0.89 | 0.936 | 0.879 – 0.998 |
MTM = Medication Therapy Management.
County-level characteristics.
Reference groups: comparison group (MTM non-recipients), female, non-Hispanic White, non-Metropolitan Statistical Area, non-Health Professional Shortage Area, and Northeast region.
A few other factors in the adjusted model also were significantly associated with the study outcomes. The odds of adherence to antiretroviral medications in males were 22% higher than in females (OR = 1.22, 95% CI = 1.08 – 1.37). Black race, Hispanic ethnicity, and risk adjustment summary score were negatively associated with adherence to antiretroviral medications. For instance, Black and Hispanic patients had 39% and 23% lower odds of medication adherence than Non-Hispanic Whites (Whites), respectively (for Black: OR = 0.61, 95% CI = 0.54 – 0.69; for Hispanic: OR = 0.77, 95% CI = 0.66 – 0.89). In terms of the DDI measure, older age was associated with higher odds of appropriate medication utilization (OR = 1.030, 95% CI = 1.004 – 1.057), and Black beneficiaries had 45% higher odds of proper medication utilization compared to White beneficiaries (OR = 1.45, 95% CI = 1.11 – 1.89). An elevated risk adjustment summary score was associated with lower odds of safe medication utilization regarding DDI (OR = 0.82, 95% CI = 0.77 – 0.89). For the COB measure, older age, male gender, and Black race exhibited higher odds of safe medication utilization. For example, Black beneficiaries had 126% higher odds of safe medication utilization regarding COB compared to White beneficiaries (OR = 2.26, 95% CI = 1.79 – 2.84). A higher risk adjustment summary score was related to lower odds of safe medication utilization regarding COB (OR = 0.936, 95% CI = 0.879 – 0.998).
Discussion
This study analyzed 2017 Medicare databases to assess the effects of MTM among PLWHs in Medicare. MTM recipients exhibited a higher likelihood of adherence to antiretroviral medications and a lower chance of COB among older beneficiaries with HIV/AIDS in this study. In this study, MTM recipients and non-recipients of older PLWHs did not exhibit significant differences in DDI.
Previous studies found that MTM participants reported more significant improvements in medication adherence or higher reduction in medication nonadherence to diabetes, hypertension, and hyperlipidemia medications than the comparison groups.16,29 The study results are consistent with previous literature regarding the effects of MTM in improving medication compliance.
The Pharmacy Quality Alliance DDI measure was developed as a population-level performance indicator rather than one that guides clinical assessment for a particular situation.30 This measure is not an all-inclusive list specified by the Pharmacy Quality Alliance and only includes a small portion of antiretroviral medications.30 For example, only one antiretroviral medication was included as a target medication, representing one class of seven available antiretroviral medication classes.28,31 Therefore, the results relative to DDI in this study were not comparable with previous literature, which mainly investigated DDI of antiretroviral medications.32,33 MTM effects relative to COB remained unknown in the existing literature.
The prevalence of antiretroviral medication adherence in this study was high compared to multiple previous studies among older PLWHs, which reported a range of 32% to 53%.34,35 It could be explained by the differences in populations studied, information sources, and measure identification methods. The prevalence of DDI in this study falls in the range of 7% to 70% reported in some previous studies for PLWHs.33,36 For COB, the prevalence findings in this study could not be compared with previous literature due to the lack of comparable results. Given the medication utilization challenges older PLWHs face, effective MTM services may be particularly beneficial in addressing medication-related issues and improving medication utilization for this population.
Although this study and previous literature attested to MTM’s effectiveness on medication utilization, the generally low MTM enrollment rate prevented MTM from achieving its full potential. For example, the average MTM enrollment rate was 10% among Medicare Advantage drug plans and stand-alone prescription drug plans in 2012.37 The generally low MTM enrollment rate may be due to plans’ restrictive eligibility criteria. Moreover, health plans could decide whether they target beneficiaries with any chronic conditions or specific conditions.15 The majority of Part D plans targeted beneficiaries with specific chronic conditions for MTM intervention in 2019.38 For example, only 11.9% of MTM programs included HIV/AIDS as one of their targeted diseases in 2019 because HIV/AIDS was not on the list of nine conditions that CMS recommended MTM programs to target.38 In addition, MTM service costs were included in plans’ annual bids for a contract as part of the administrative costs, so Part D plans lack incentives to expand MTM services beyond meeting CMS’ basic requirements.39 Reforms are needed to further develop MTM services among older PLWHs, such as adopting less restrictive eligibility criteria, including HIV/AIDS as a targeted disease for MTM intervention, and reimbursing plans for their expanded MTM services.
A few individual-level characteristics also exhibited significant associations with the study outcomes. Older age was associated with fewer DDI and COB issues in this study. It may be because prescribers are less likely to prescribe opioids and benzodiazepines to patients of very old age for medication safety concerns.40,41 This study exhibited that males generally were more likely to adhere to antiretroviral medications and be free from COB issues than females. Previous studies also reported that women were generally less adherent to their antiretroviral medications and were more likely to report lifetime prescription opioid use than men.42,43 Blacks and Hispanics exhibited a lower likelihood of adherence to antiretroviral medications than White beneficiaries. The results were consistent with previous research that reported minorities were generally less likely to achieve optimal adherence to antiretroviral medications than Whites among PLWHs.44 Conversely, Black beneficiaries exhibited a higher likelihood of being free from DDI issues than White beneficiaries. Lower adherence among Black patients than White patients may mean fewer medications being taken among Black patients, rendering a lower risk of DDI among this population.44,45 This study found that White beneficiaries were more likely to report COB issues than Black beneficiaries. This result was consistent with a previous study that reported that the White group was among the highest-represented groups prescribed both benzodiazepines and opioids during their first visit to primary care doctors.46 Further, an individual with a higher risk adjustment summary score was less likely to adhere to their antiretroviral medications and use medications safely. A higher risk adjustment summary score signified more chronic conditions and complex regimens, which were barriers to achieving optimal medication management.6
This study has several limitations. First, the findings generated from a Medicare sample of older PLWHs may not be generalized to other populations, such as younger PLWHs, PLWHs covered by other insurance programs, and the uninsured. Nevertheless, Medicare plays an increasing role in HIV care, and the Medicare databases allowed for a reasonably large sample size for the analyses. Second, a few county-level variables were included in the analyses since the individual-level characteristics were unavailable in the databases. These county-level variables may not accurately represent individuals’ characteristics. Third, beneficiaries’ prescription records were used to measure medication utilization. Although patients’ prescriptions may not equal their actual medication utilization, prescription records are valid proxies and have been adopted by CMS and Pharmacy Quality Alliance as core measures.27,47 Fourth, the general eligibility criteria for MTM enrollment were applied in the study to identify a comparison group. The criteria may not accurately represent beneficiaries’ eligibility to MTM programs for individual plans because the criteria vary across plans. However, the eligibility thresholds of 3 or more chronic conditions and 8 or more Part D medications were adopted by most MTM programs in 2017.15 Finally, the study outcomes of medication utilization were not equivalent to patients’ health outcomes. Future studies should investigate the long-term effects of MTM services on patients’ health outcomes, such as mortality among PLWHs in Medicare.
Conclusions
This research assessed the effectiveness of MTM services in adherence to antiretroviral medications and appropriate use of medications regarding DDI and COB among older PLWHs. This study provided critical evidence that supports the expansion of the MTM program in PLWHs who face many challenges in their daily medication management. Expanding MTM programs could benefit older PLWHs by optimizing antiretroviral medication adherence and lowering the COB risk. Future studies should investigate the long-term effects of MTM services on patients’ health service utilization, healthcare expenses, and health outcomes in PLWHs in Medicare.
Key Points.
What was already known
Advances in antiretroviral therapy have contributed to lower mortality and an extended lifespan, but some chronic conditions are now more prevalent among older people living with HIV/AIDS.
Centers for Medicare and Medicaid Services initiated the medication therapy management (MTM) program in 2006 to optimize medication therapeutic outcomes and reduce the risk of adverse drug events.
Previous research revealed that MTM receipt was associated with improved medication adherence, lower healthcare expenses, and a racial/ethnic disparity reduction in nonadherence to medications.
What this study adds
This study provided critical evidence that supports the expansion of the MTM program in PLWHs who face many challenges in their daily medication management.
This study found that the odds of adherence to antiretroviral medications among MTM recipients were 15% higher than among MTM non-recipients.
The odds of safe medication utilization regarding concurrent use of opioids and benzodiazepines for MTM recipients were 25.5% higher than for MTM non-recipients. Regarding drug-drug interactions, MTM recipients and non-recipients did not exhibit significant differences in their medication utilization.
Acknowledgments
The authors would like to acknowledge the clerical support from Chi Chun Steve Tsang, PhD, a Postdoctoral Scholar at the Department of Clinical Pharmacy & Translational Science, University of Tennessee College of Pharmacy. The authors also would like to acknowledge two Doctor of Pharmacy Students at the University of Tennessee Health Science Center College of Pharmacy, Clayton Hausberger and Prakash Kafle, for providing valuable insights for the introduction and discussions of the manuscript.
Declaration of funding
Research reported in this publication was supported by the National Institute on Aging of the National Institutes of Health under Award Number R01AG040146. The content is solely the responsibility of the authors and does not necessarily represent the official views of the National Institutes of Health.
Disclosures of conflicts of interest:
Xiangjun Zhang has no financial disclosures to report. Junling Wang received funding from AbbVie, Curo, Bristol Myers Squibb, Pfizer, and Pharmaceutical Research and Manufacturers of America (PhRMA) and serves as the Co-Chair of the Value Assessment-Health Outcomes Research Advisory Committee of the PhRMA Foundation.
Acronyms and abbreviations
- PLWHs
Persons/people living with HIV/AIDS
- DDI
Drug-drug interactions
- COB
Concurrent use of opioids and benzodiazepines
- CMS
Centers for Medicare & Medicaid Services
- MTM
Medication Therapy Management
- OR
Odds ratio
- CI
Confidence interval
- Whites
Non-Hispanic Whites
Appendix Table 1. Baseline Characteristics for Intervention and Comparison Groups Before and After Propensity Score Matching among Medicare Beneficiaries Who Met Drug-Drug Interactions Measure Criteria and Used Antiretroviral Medications in 2017
| Characteristics | Before Matching | After Matching | ||||||
|---|---|---|---|---|---|---|---|---|
| Intervention | Comparison | Intervention | Comparison | |||||
| (n=908) | (n=2,670) | (n=809, 33.3%) | (n=1,618, 66.7%) | |||||
| Number | % | Number | % | Number | % | Number | % | |
| Predisposing Factors | ||||||||
| Age, mean (SD) | 70.44 (4.70) | 70.51 (4.90) | 70.46 (4.72) | 70.49 (4.97) | ||||
| Male | 672 | 74.01 | 2,011 | 75.32 | 619 | 76.51 | 1,238 | 76.51 |
| Race/Ethnicity | ||||||||
| Non-Hispanic Whites | 437 | 48.13 | 1,307 | 48.95 | 406 | 50.19 | 810 | 50.06 |
| Blacks (African Americans) | 322 | 35.46 | 986 | 36.93 | 287 | 35.48 | 552 | 34.12 |
| Hispanics | 108 | 11.89 | 267 | 10.00 | 80 | 9.89 | 182 | 11.25 |
| Asian/Pacific Islanders and Other | 41 | 4.51 | 110 | 4.12 | 36 | 4.45 | 74 | 4.57 |
| Proportion of Married-couple Families, mean (SD)* | 0.68 (0.10) | 0.69 (0.09) | 0.69 (0.09) | 0.68 (0.09) | ||||
| Proportion of High School Education and Above, mean (SD)* | 0.86 (0.06) | 0.86 (0.05) | 0.86 (0.05) | 0.86 (0.05) | ||||
| Income Per Capita (in $1,000), mean (SD)* | 57.53 (26.91) | 58.05 (27.45) | 58.37 (27.96) | 58.10 (26.96) | ||||
| Proportion of the Uninsured, mean (SD)*# | 0.097 (0.046) | 0.105 (0.048) | 0.099 (0.048) | 0.098 (0.046) | ||||
| Enabling Factors | ||||||||
| Metropolitan Statistical Area* | 841 | 92.62 | 2,455 | 91.95 | 747 | 92.34 | 1,498 | 92.58 |
| Health Professional Shortage Area* | 874 | 96.26 | 2,558 | 95.81 | 779 | 96.29 | 1,561 | 96.48 |
| Census Regions*# | ||||||||
| Northeast | 282 | 31.06 | 682 | 25.54 | 235 | 29.05 | 470 | 29.05 |
| Midwest | 108 | 11.89 | 323 | 12.10 | 103 | 12.73 | 206 | 12.73 |
| South | 324 | 35.68 | 1,102 | 41.27 | 289 | 35.72 | 578 | 35.72 |
| West | 194 | 21.37 | 563 | 21.09 | 182 | 22.50 | 364 | 22.50 |
| Need Factor | ||||||||
| Risk Adjustment Summary Score, mean (SD)# | 3.04 (2.04) | 2.49 (1.76) | 2.70 (1.66) | 2.62 (1.68) | ||||
SD = standard deviation.
County-level characteristics.
These characteristics significantly differed between the intervention and comparison groups before matching (P < .05).
All characteristics were similar between the intervention and comparison groups after matching (P > .05).
Appendix Table 2. Baseline Characteristics for Intervention and Comparison Groups Before and After Propensity Score Matching among Medicare Beneficiaries Who Met Concurrent Use of Opioids and Benzodiazepines Measure Criteria and Used Antiretroviral Medications in 2017
| Characteristics | Before Matching | After Matching | ||||||
|---|---|---|---|---|---|---|---|---|
| Intervention | Comparison | Intervention | Comparison | |||||
| (n=802) | (n=2,471) | (n=691, 33.3%) | (n=1,382, 66.7%) | |||||
| Number | % | Number | % | Number | % | Number | % | |
| Predisposing Factors | ||||||||
| Age, mean (SD) | 69.39 (4.20) | 69.34 (4.13) | 69.39 (4.20) | 69.24 (4.06) | ||||
| Male | 506 | 63.09 | 1,640 | 66.37 | 453 | 65.56 | 906 | 65.56 |
| Race/Ethnicity | ||||||||
| Non-Hispanic Whites | 318 | 39.65 | 1,018 | 41.20 | 289 | 41.82 | 569 | 41.17 |
| Blacks (African Americans) | 345 | 43.02 | 1,078 | 43.63 | 300 | 43.42 | 580 | 41.97 |
| Hispanics | 118 | 14.71 | 295 | 11.94 | 87 | 12.59 | 203 | 14.69 |
| Asian/Pacific Islanders and Other | 21 | 2.62 | 80 | 3.24 | 15 | 2.17 | 30 | 2.17 |
| Proportion of Married-couple Families, mean (SD)* | 0.68 (0.09) | 0.68 (0.09) | 0.68 (0.09) | 0.68 (0.09) | ||||
| Proportion of High School Education and Above, mean (SD)* | 0.86 (0.06) | 0.86 (0.05) | 0.86 (0.06) | 0.86 (0.05) | ||||
| Income Per Capita (in $1,000), mean (SD)* | 56.85 (24.76) | 56.78 (25.96) | 57.12 (24.97) | 56.49 (25.84) | ||||
| Proportion of the Uninsured, mean (SD)* | 0.10 (0.05) | 0.10 (0.05) | 0.10 (0.05) | 0.10 (0.05) | ||||
| Enabling Factors | ||||||||
| Metropolitan Statistical Area* | 729 | 90.90 | 2,250 | 91.06 | 634 | 91.75 | 1,268 | 91.75 |
| Health Professional Shortage Area* | 774 | 96.51 | 2,380 | 96.32 | 667 | 96.53 | 1,330 | 96.24 |
| Census Regions*# | ||||||||
| Northeast | 219 | 27.31 | 550 | 22.26 | 176 | 25.47 | 352 | 25.47 |
| Midwest | 103 | 12.84 | 300 | 12.14 | 85 | 12.30 | 170 | 12.30 |
| South | 300 | 37.41 | 1,071 | 43.34 | 277 | 40.09 | 554 | 40.09 |
| West | 180 | 22.44 | 550 | 22.26 | 153 | 22.14 | 306 | 22.14 |
| Need Factor | ||||||||
| Risk Adjustment Summary Score, mean (SD)# | 3.10 (1.90) | 2.57 (1.70) | 2.79 (1.55) | 2.71 (1.54) | ||||
SD = standard deviation.
County-level characteristics.
These characteristics significantly differed between the intervention and comparison groups before matching (P < .05).
All characteristics were similar between the intervention and comparison groups after matching (P > .05).
Footnotes
Publisher's Disclaimer: This is a PDF file of an unedited manuscript that has been accepted for publication. As a service to our customers we are providing this early version of the manuscript. The manuscript will undergo copyediting, typesetting, and review of the resulting proof before it is published in its final form. Please note that during the production process errors may be discovered which could affect the content, and all legal disclaimers that apply to the journal pertain.
Contributor Information
Xiangjun Zhang, Department of Clinical Pharmacy & Translational Science, University of Tennessee Health Science Center College of Pharmacy.
Junling Wang, Department of Clinical Pharmacy & Translational Science, University of Tennessee Health Science Center College of Pharmacy.
Data availability statement
Medicare databases are United States federal databases sponsored by the Centers for Medicare & Medicaid Services (CMS). These data are available to researchers through the Research Data Assistance Center (ResDAC) at the University of Minnesota, according to a strict protocol for data requests. Users of Medicare databases cannot disclose to, nor share the data with, individuals not listed in the Data Use Agreement. ResDAC can be reached via email at resdac@umn.edu or by phone at 888–973-7322.
References
- 1.Centers for Disease Control and Prevention. Basic Statistics. Accessed October 16, 2023. https://www.cdc.gov/hiv/basics/statistics.html
- 2.Dawson L, Kates J, Roberts T, Cubanski J, Neuman T, Damico A. Medicare and People with HIV. KFF. Accessed April 28, 2023. https://www.kff.org/hivaids/issue-brief/medicare-and-people-with-hiv/ [Google Scholar]
- 3.Trickey A, May MT, Vehreschild J-J, et al. Survival of HIV-positive patients starting antiretroviral therapy between 1996 and 2013: a collaborative analysis of cohort studies. Lancet HIV. 2017;4(8):e349–e356. [DOI] [PMC free article] [PubMed] [Google Scholar]
- 4.Yu X, Westra JR, Giordano TP, Berenson AB, Baillargeon JG, Kuo Y-F. Assessing comorbidities and survival in HIV-infected and uninfected matched Medicare enrollees. AIDS. 2021;35(10):1667. [DOI] [PMC free article] [PubMed] [Google Scholar]
- 5.Turrini G, Chan SS, Klein PW, et al. Assessing the health status and mortality of older people over 65 with HIV. PloS One. 2020;15(11):e0241833. [DOI] [PMC free article] [PubMed] [Google Scholar]
- 6.Sarma P, Cassidy R, Corlett S, Katusiime B. Ageing with HIV: Medicine Optimisation Challenges and Support Needs for Older People Living with HIV: A Systematic Review. Drugs Aging. 2023:1–62. [DOI] [PMC free article] [PubMed] [Google Scholar]
- 7.Merlin JS, Long D, Becker WC, et al. The association of chronic pain and long-term opioid therapy with HIV treatment outcomes. J Acquir Immune Defic Syndr. 2018;79(1):77. [DOI] [PMC free article] [PubMed] [Google Scholar]
- 8.Parker R, Stein DJ, Jelsma J. Pain in people living with HIV/AIDS: a systematic review. J Int AIDS Soc. 2014;17(1):18719. [DOI] [PMC free article] [PubMed] [Google Scholar]
- 9.Silverberg MJ, Ray GT, Saunders K, et al. Prescription long-term opioid use in HIV-infected patients. Clin J Pain. 2012;28(1):39. [DOI] [PMC free article] [PubMed] [Google Scholar]
- 10.Saloner R, Grelotti DJ, Tyree G, et al. Benzodiazepine use is associated with an increased risk of neurocognitive impairment in people living with HIV. J Acquir Immune Defic Syndr. 2019;82(5):475. [DOI] [PMC free article] [PubMed] [Google Scholar]
- 11.Sun EC, Dixit A, Humphreys K, Darnall BD, Baker LC, Mackey S. Association between concurrent use of prescription opioids and benzodiazepines and overdose: retrospective analysis. BMJ. 2017;356. [DOI] [PMC free article] [PubMed] [Google Scholar]
- 12.Dasgupta N, Funk MJ, Proescholdbell S, Hirsch A, Ribisl KM, Marshall S. Cohort study of the impact of high-dose opioid analgesics on overdose mortality. Pain Med. 2016;17(1):85–98. [DOI] [PubMed] [Google Scholar]
- 13.Gray C, Cooke CE, Brandt N. Evolution of the Medicare Part D medication therapy management program from inception in 2006 to the present. Am Health Drug Benefits. 2019;12(5):243. [PMC free article] [PubMed] [Google Scholar]
- 14.Centers for Medicare & Medicaid Services. CY 2017 Medication Therapy Management Program Guidance and Submission Instructions. Accessed Dec 16, 2022. https://www.cms.gov/Medicare/Prescription-Drug-Coverage/PrescriptionDrugCovContra/Downloads/Memo-Contract-Year-2017-Medication-Therapy-Management-MTM-Program-Submission-v-040816.pdf
- 15.Centers for Medicare & Medicaid Services. 2017 Medicare Part D Medication Therapy Management (MTM) Programs. Accessed Dec 15, 2022. https://www.cms.gov/Medicare/Prescription-Drug-Coverage/PrescriptionDrugCovContra/Downloads/CY2017-MTM-Fact-sheet.pdf
- 16.Ferries E, Dye JT, Hall B, Ndehi L, Schwab P, Vaccaro J. Comparison of medication therapy management services and their effects on health care utilization and medication adherence. J Manag Care Spec Pharm. 2019;25(6):688–695. [DOI] [PMC free article] [PubMed] [Google Scholar]
- 17.Tsang CCS, Shih Y-CT, Dong X, et al. Cost-Effectiveness of Medication Therapy Management Program Across Racial and Ethnic Groups Among Medicare Beneficiaries. Value Health. 2022; [DOI] [PMC free article] [PubMed] [Google Scholar]
- 18.Browning JA, Tsang CCS, Dong X, et al. Effects of Medicare comprehensive medication review on racial/ethnic disparities in nonadherence to statin medications among patients with Alzheimer’s disease: an observational analysis. BMC Health Serv Res. 2022;22(1):1–10. [DOI] [PMC free article] [PubMed] [Google Scholar]
- 19.Research Data Assistance Center. Find the CMS Data File You Need. Accessed Sept 15, 2023. https://resdac.org/cms-data
- 20.Health Resources & Services Administration. Area Health Resources Files. Accessed Dec 15, 2022. https://data.hrsa.gov/topics/health-workforce/ahrf
- 21.Andersen RM. Revisiting the behavioral model and access to medical care: does it matter? J Health Soc Behav. 1995:1–10. [PubMed] [Google Scholar]
- 22.Centers for Medicare & Medicaid Services. Risk Adjustment. Accessed Dec 16, 2022. https://www.cms.gov/Medicare/Health-Plans/MedicareAdvtgSpecRateStats/Risk-Adjustors [PubMed]
- 23.Centers for Medicare & Medicaid Services. Report to Congress: risk adjustment in Medicare Advantage. 2021. Accessed September 14, 2023. https://www.cms.gov/files/document/report-congress-risk-adjustment-medicare-advantage-december-2021.pdf
- 24.Research Data Assistance Center. Part D Event File. Accessed Dec 15, 2022. https://resdac.org/cms-data/files/pde
- 25.Daniel GW, Malone DC. Characteristics of older adults who meet the annual prescription drug expenditure threshold for Medicare medication therapy management programs. J Manag Care Spec Pharm. 2007;13(2):142–154. [DOI] [PMC free article] [PubMed] [Google Scholar]
- 26.Austin PC. A comparison of 12 algorithms for matching on the propensity score. Stat Med. 2014;33(6):1057–1069. [DOI] [PMC free article] [PubMed] [Google Scholar]
- 27.Pharmacy Quality Alliance. Measures Overview. Accessed Dec 16, 2022. https://www.pqaalliance.org/measures-overview
- 28.Pharmacy Quality Alliance. Technical specifications for PQA-endorsed measures, 2018. Alexandria, VA: Pharmacy Quality Alliance; 2018. [Google Scholar]
- 29.Dong X, Tsang CCS, Zhao S, et al. Effects of the Medicare Part D comprehensive medication review on medication adherence among patients with Alzheimer’s disease. Curr Med Res Opin. 2021;37(9):1581–1588. [DOI] [PMC free article] [PubMed] [Google Scholar]
- 30.Hines LE, Malone DC. A Population-Based Approach to Improving Patient Safety Related to Drug-Drug Interactions. Am J Pharm Benefits. 2015;7(5):212–214. [Google Scholar]
- 31.HIVinfo.NIH.gov. What to Start: Choosing an HIV Treatment Regimen. Accessed June 29, 2023. https://hivinfo.nih.gov/understanding-hiv/fact-sheets/what-start-choosing-hiv-treatment-regimen
- 32.Nachega JB, Hsu AJ, Uthman OA, Spinewine A, Pham PA. Antiretroviral therapy adherence and drug–drug interactions in the aging HIV population. AIDS. 2012;26:S39–S53. [DOI] [PubMed] [Google Scholar]
- 33.Holtzman C, Armon C, Tedaldi E, et al. Polypharmacy and risk of antiretroviral drug interactions among the aging HIV-infected population. J Gen Intern Med. 2013;28:1302–1310. [DOI] [PMC free article] [PubMed] [Google Scholar]
- 34.Abara WE, Adekeye OA, Xu J, Heiman HJ, Rust G. Correlates of combination antiretroviral adherence among recently diagnosed older HIV-infected adults between 50 and 64 years. AIDS Behav. 2016;20:2674–2681. [DOI] [PMC free article] [PubMed] [Google Scholar]
- 35.Hinkin CH, Hardy DJ, Mason KI, et al. Medication adherence in HIV-infected adults: effect of patient age, cognitive status, and substance abuse. AIDS. 2004;18(Suppl 1):S19. [DOI] [PMC free article] [PubMed] [Google Scholar]
- 36.Greene M, Steinman MA, McNicholl IR, Valcour V. Polypharmacy, drug-drug interactions, and potentially inappropriate medications in older adults with human immunodeficiency virus infection. J Am Geriatr Soc. 2014;62(3):447–453. [DOI] [PMC free article] [PubMed] [Google Scholar]
- 37.Stuart B, Hendrick FB, Shen X, et al. Eligibility for and enrollment in Medicare Part D medication therapy management programs varies by plan sponsor. Health Aff. 2016;35(9):1572–1580. [DOI] [PubMed] [Google Scholar]
- 38.Centers for Medicare & Medicaid Services. 2019 Medicare Part D Medication Therapy Management (MTM) Programs. Accessed June 21, 2023. https://www.cms.gov/Medicare/Prescription-Drug-Coverage/PrescriptionDrugCovContra/Downloads/CY2019-MTM-Fact-Sheet.pdf
- 39.Fan B, Ghimire E, Habibulla A, et al. Evaluation of the Part D Enhanced Medication Therapy Management (MTM) Model: First Evaluation Report. Acumen LLC. Accessed April 28, 2023. https://downloads.cms.gov/files/mtm-firstevalrpt.pdf [Google Scholar]
- 40.Rhee TG. Coprescribing of benzodiazepines and opioids in older adults: rates, correlates, and national trends. J Gerontol A Biol Sci Med Sci. 2019;74(12):1910–1915. [DOI] [PMC free article] [PubMed] [Google Scholar]
- 41.Spitz A, Moore AA, Papaleontiou M, Granieri E, Turner BJ, Reid MC. Primary care providers’ perspective on prescribing opioids to older adults with chronic non-cancer pain: A qualitative study. BMC Geriatr. 2011/07/14 2011;11(1):35. doi: 10.1186/1471-2318-11-35 [DOI] [PMC free article] [PubMed] [Google Scholar]
- 42.Puskas CM, Forrest JI, Parashar S, et al. Women and vulnerability to HAART non-adherence: a literature review of treatment adherence by gender from 2000 to 2011. Curr HIV/AIDS Rep. 2011;8:277–287. [DOI] [PubMed] [Google Scholar]
- 43.Serdarevic M, Striley CW, Cottler LB. Gender differences in prescription opioid use. Curr Opin Psychiatry. 2017;30(4):238. [DOI] [PMC free article] [PubMed] [Google Scholar]
- 44.Thrasher AD, Earp JAL, Golin CE, Zimmer CR. Discrimination, distrust, and racial/ethnic disparities in antiretroviral therapy adherence among a national sample of HIV-infected patients. J Acquir Immune Defic Syndr. 2008;49(1):84–93. [DOI] [PubMed] [Google Scholar]
- 45.McQuaid EL, Landier W. Cultural issues in medication adherence: disparities and directions. J Gen Intern Med. 2018;33:200–206. [DOI] [PMC free article] [PubMed] [Google Scholar]
- 46.Hirschtritt ME, Delucchi KL, Olfson M. Outpatient, combined use of opioid and benzodiazepine medications in the United States, 1993–2014. Prev Med Rep. 2018;9:49–54. [DOI] [PMC free article] [PubMed] [Google Scholar]
- 47.Centers for Medicare & Medicaid Services. Part C and D Performance Data. Accessed May 25, 2023. https://www.cms.gov/medicare/prescription-drug-coverage/prescriptiondrugcovgenin/performancedata
Associated Data
This section collects any data citations, data availability statements, or supplementary materials included in this article.
Data Availability Statement
Medicare databases are United States federal databases sponsored by the Centers for Medicare & Medicaid Services (CMS). These data are available to researchers through the Research Data Assistance Center (ResDAC) at the University of Minnesota, according to a strict protocol for data requests. Users of Medicare databases cannot disclose to, nor share the data with, individuals not listed in the Data Use Agreement. ResDAC can be reached via email at resdac@umn.edu or by phone at 888–973-7322.