

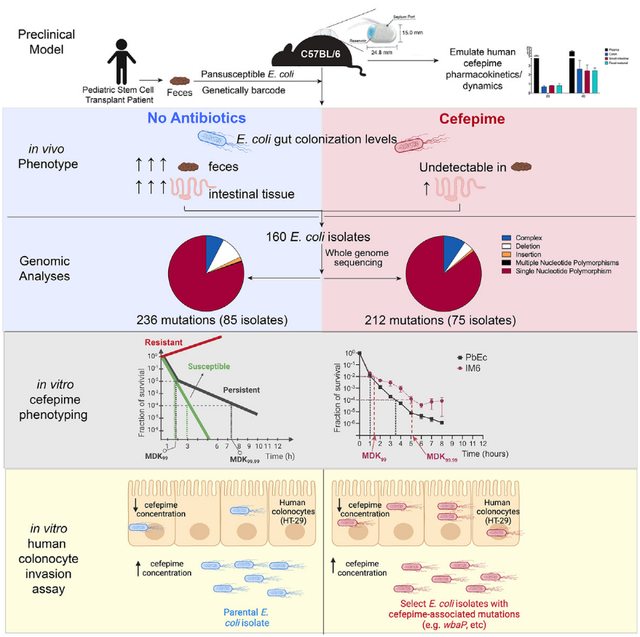
SUMMARY
Antibiotic resistance and evasion are incompletely understood and complicated by the fact that murine interval dosing models do not fully recapitulate antibiotic pharmacokinetics in humans. To better understand how gastrointestinal bacteria respond to antibiotics, we colonized germ-free mice with a pan-susceptible genetically barcoded Escherichia coli clinical isolate and administered the antibiotic cefepime via programmable subcutaneous pumps, allowing closer emulation of human parenteral antibiotic dynamics. E. coli was only recovered from intestinal tissue, where cefepime concentrations were still inhibitory. Strikingly, “some” E. coli isolates were not cefepime resistant but acquired mutations in genes involved in polysaccharide capsular synthesis increasing their invasion and survival within human intestinal cells. Deleting wbaP involved in capsular polysaccharide synthesis mimicked this phenotype, allowing increased invasion of colonocytes where cefepime concentrations were reduced. Additionally, “some” mutant strains exhibited a persister phenotype upon further cefepime exposure. This work uncovers a mechanism allowing “select” gastrointestinal bacteria to evade antibiotic treatment.
In brief
Rodrigues et al. demonstrate that Escherichia coli colonizing the murine gastrointestinal tract can evade antibiotic treatment by acquiring mutations increasing their ability to invade and survive within intestinal cells, where antibiotic concentrations are lower but inhibitory. Some mutant strains exhibit a persister phenotype enabling them to survive antibiotic exposure.
Graphical Abstract
INTRODUCTION
The world is currently at the precipice of an antibiotic resistance crisis that is threatening to overwhelm healthcare systems in the next few decades.1 Antibiotics are lauded as one of the most impactful medical discoveries and are credited with saving millions of lives.2 However, despite these successes, we have seen a dramatic rise in the incidence of antibiotic-resistant bacterial infections.3 ~2.8 million antibiotic resistant infections are reported per year in the United States resulting in over 35,000 deaths.4
Bacteria found in the gut of animals and humans account for a significant portion of the antibiotic-resistant infections and related deaths in the US and throughout the world.5 For over 40 years, we have known that these resistant bacteria can move easily between farm animals and humans, and also from humans to other humans in the hospital and in the community setting.6–11 Acquisition of these resistant bacteria can occur via the fecal-oral route for gram-negative Enterobacterales bacteria (e.g., E. coli and Klebsiella spp.), which are the most common causes of urinary tract infections and among the most common causes of bloodstream infections in patients.6,12 Hence, the mammalian gut, which is home to trillions of resident bacteria, can serve as an ideal host niche to study how gut bacteria adapt to antibiotic exposure.
One patient population particularly at risk for developing antibiotic-resistant infections are immunocompromised individuals. Cancer and stem cell transplant (SCT) patients become severely immunocompromised as a result of their therapies and are treated with prophylactic and/or empiric antibiotic regimens for days to weeks to prevent serious infectious complications. Our group13 and others14,15 have shown that these patient populations develop higher incidences of antibiotic resistance and recurrent infections, leading to an increased rate of gastrointestinal (GI) carriage of antibiotic-resistant bacteria resulting in excess fatality due to infections. Therefore, there is an urgent need for a mechanistic understanding for how antibiotic treatment affects gut microbiota and whether these changes/adaptations could impact the development of infectious complications.
Antibiotics given by interval dosing (intraperitoneal, intravenous, or orally) to mice are generally metabolized or cleared too rapidly to mimic serum/plasma levels observed in humans.16–18 Therefore, we developed a murine model with the goal of better approximating the antibiotic pharmacokinetics/dynamics observed in humans via the use of programmable subcutaneous (SC) pumps that allows for continuous antibiotic administration. We isolated an antibiotic pan-susceptible E. coli (parental E. coli [PEc]) isolate from the feces of a pediatric SCT patient prior to the receipt of any therapy and genetically barcoded this E. coli isolate (parental barcoded E. coli [PbEc]). Germ-free mice colonized with this barcoded E. coli were then treated with cefepime, an antibiotic commonly used in cancer and SCT patients. The population size of the barcoded E. coli cells in the GI tract of cefepime-treated mice substantially diminished over time, as expected from a pan-susceptible isolate, and we were no longer able to culture any viable E. coli from mouse feces. We, however, were able to recover E. coli from different segments of the GI tract (particularly the ileum), despite high cefepime concentrations in the GI tissue and plasma. To our surprise, none of the recovered E. coli isolates were resistant to cefepime. Rather, several of these strains had acquired genetic changes in the wbaP gene, which encodes an enzyme required for the initiation of the synthesis of the polysaccharide capsule and O-antigen of lipopolysaccharide (LPS) that allowed these mutants to survive in intestinal tissue. We were able to recapitulate these findings with an in vitro human colonocyte invasion assay using these recovered E. coli mutants as well as newly generated E. coli mutants lacking the wbaP gene. Together, our study reveals a potential mechanism by which a commensal gut bacteria exposed to high doses of an antibiotic can adapt by developing persistence and invading intestinal cells thereby avoiding high antibiotic concentrations, an observation that could have significant clinical implications as continuous antibiotic exposure can lead to antibiotic resistance.19
RESULTS
Establishing a murine model to study the effect of antibiotics on bacteria in the GI tract
Critically ill patients, such as cancer patients or patients in the intensive care unit, often receive prophylactic and/or empiric antibiotics administered intravenously for long durations (days to weeks).20,21 These hospitalized patients potentially serve as “breeding” grounds for the development of antibiotic resistance, as the resident bacteria are exposed to antibiotics and other drugs in the GI tract and could potentially translocate and cause infections.22–24 As such, we sought to develop a preclinical model utilizing prolonged parenteral antibiotic administration to study the evolution and development of bacterial antibiotic resistance in the mammalian gut.
Administration of antibiotics (oral, intraperitoneal, or intravenous) via interval dosing to mice are often unable to mimic plasma levels observed in humans.16,18 For beta-lactam antibiotics, maintaining antibiotic plasma levels in the plasma above minimum inhibitory concentrations (MICs) for 40%–60% of the dosing interval is critical for maintaining bactericidal activity of the drug and ensuring optimal antibiotic efficacy in patients.25 Cefepime, a beta-lactam antibiotic commonly administered to cancer and SCT patients,20,21 requires a free time above the MIC (fT > MIC) of ≥60% for bactericidal activity.26 We confirmed that a single SC dose of cefepime in conventional C57BL/6J mice rapidly decreased in the plasma after injection falling below the MIC for the E. coli isolate used in this study (~0.1 μg/mL) (Figure 1B) by 4 h as measured by liquid chromatography-tandem mass spectrometry (LC-MS/MS). In contrast, cefepime administered by continuous SC infusion (20 mg/mL, 4 μL/h) via an implanted SC pump (iPrecio 310R minipump) resulted in nearly constant cefepime plasma concentrations (~5 μg/mL) over time (Figures 1A and 1B), ensuring the pharmacodynamic target of ≥60% fT > MIC was achieved given the cefepime MIC of the E. coli was ~0.1 μg/mL. We could increase cefepime plasma concentrations by loading higher concentrations of cefepime into a SC pump, in a dose dependent fashion (Figure 1C). Of note, cefepime plasma levels (~5 μg/mL) observed in mice with SC pumps loaded with 20 mg/mL cefepime was comparable to plasma trough levels (~2–6 μg/mL) observed in humans receiving cefepime,27 including cancer and SCT patients receiving cefepime for fever and neutropenia28 (Figure 1C). These data suggest that continuous SC delivery of cefepime in mice allows for more accurate approximation of human cefepime pharmacokinetics/dynamics.
Figure 1. Establishing a murine model to emulate the antibiotic pharmacokinetics/dynamics observed in humans.

(A) Free cefepime concentration in plasma of C57BL/6J mice treated with a single subcutaneous (SC) dose (50 mg/kg dose) or via continuous cefepime infusion (20 mg/mL, 5 μL/h). Cefepime concentrations were calculated using liquid-chromatography-tandem mass spectrometry (LC-MS/MS). n = 3 mice per group. Points represent the mean ± SEM. Three technical replicates were performed per mouse sample.
(B) Schematic overview of subcutaneous pump implantation into mice. Dimensions for drug reservoir and septum (through which the drug is injected and loaded) are indicated.
(C) Free cefepime concentration in plasma of mice treated with continuous subcutaneous cefepime dosing (cefepime pump concentrations of 20, 40, or 60 mg/mL; at 8 μL/h for 20 h;). n = 3 mice per group. Bars represent the mean ± SEM. Three technical replicates were performed for each mouse sample.
(D) Free cefepime concentration in plasma, colon, small intestine (ileum), and fecal material in mice after continuous subcutaneous cefepime dosing (8 μL/h) for 20 h using cefepime pump concentrations of 20 and 40 mg/mL. n = 3 mice per group. Bars represent the mean ± SEM. Three technical replicates were performed for each mouse sample.
(E) Plasma, ileum, colon, and fecal material concentrations of free cefepime in mice after single subcutaneous (SC) dose (50 mg/kg dose × 1) or after continuous cefepime dosing (20 mg/mL, 4 μL/h) measured using LC-MS/MS. n = 3 mice per group. SC + pump values were calculated by mathematical addition of SC concentrations to pump concentrations. Points represent the mean value per group ± SD.
(F) Concentration of levofloxacin in mouse plasma, lung, colon, ileum and fecal material over time measured using LC-MS/MS—after a single dose of levofloxacin administered through oral gavage (150 mg/kg) or intravenously (75 mg/kg). n = 3 mice per time point. Points represent the mean value per group ± SD.
We then measured intestinal tissue cefepime concentrations in mice implanted with pumps that received cefepime (20 mg/mL) for 24 h. Cefepime concentrations in feces, small intestine (ileum), and colon were lower than in plasma but increased with higher cefepime concentrations (40 mg/mL) loaded into the pump (Figures 1D and 1E). In contrast, a single oral or intravenous dose of the antibiotic levofloxacin (which is dosed once a day for both oral and intravenous administration in humans) resulted in higher concentrations in mouse intestinal tissue and fecal material compared with plasma (Figure 1F), an effect that persisted up to ~16 h after injection. These data are consistent with prior reports showing that parenteral administration of antibiotics result in measurable antibiotic concentration in feces in calves29 and in mice.30 In humans, oral administration of antibiotics leads to appreciable antibiotic concentrations in fecal matter,31 but there are no comprehensive human data that we are aware of that measures corresponding plasma and intestinal tissue antibiotic concentrations after parenteral antibiotic administration.
Collectively, these data suggest that continuous SC infusion of cefepime in mice allows for a preclinical model that better mimics cefepime pharmacokinetics/dynamics observed in humans and results in measurable cefepime concentrations in intestinal tissue, which could select for the development of antibiotic resistance.
Cultivation and characterization of a pan-susceptible E. coli clinical isolate
To rigorously study the effect of cefepime on gut-colonizing bacteria, we isolated pan-susceptible E. coli strains from a fecal sample collected from a pediatric SCT patient prior to the receipt of chemotherapy and antibiotics. The rationale for choosing E. coli is that it is a common human gut bacterium that can readily colonize the murine GI tract and can result in disseminated bacterial infections in immunocompromised humans31,32 and in preclinical mouse models.33–35 Further, numerous in vitro antibiotic resistance studies have utilized E. coli.36–41 Finally, as our ultimate goal is to better understand how gut bacteria adapt and evolve when exposed to antibiotics, isolating an antibiotic pan-susceptible clinical isolate recovered from human GI tract was deemed a high priority. Thus, the patient fecal sample was grown in a sequence of selective media for E. coli (Figure S1A).42,43 E. coli identification confirmation (via matrix-assisted laser desorption ionization-time of flight (MALDI-TOF) mass spectrometry and supplemental testing to rule-out Shigella species) and antimicrobial sensitivity testing by microbroth dilution was performed in the Clinical Microbiology Laboratory at Children’s Medical Center Dallas.
An E. coli isolate confirmed as susceptible to all of the antibiotic compounds tested (NM43 gram-negative MicroScan Panel, Beckman Coulter) and was used for the remaining experiments in this study and designated as PEc. The PEc genome was sequenced (Illumina NextSeq 2000, PE 150) and the assembled genome was compared with genomes of other commonly used laboratory E. coli strains: the widely studied K12 substrain MG165544; the strain BL21 commonly used for molecular cloning and recombinant protein production; and the shiga-like toxin producing O157:H7 strain, which is commonly implicated in foodborne illness, though consumption of raw or undercooked foods.45 PEc was found to have ~100,000 base pair mismatches compared with these other E. coli genomes (Figure S1B) and thus exhibited considerable genetic distance from these other E. coli strains (Figure S1C). The contigs formed from assembling these reads were then submitted to Rapid Annotations using Subsystems Technology (RAST46) for functional annotation of possible genes. Notably, PEc was enriched for membrane transport proteins that consisted mainly of conjugative proteins, suggesting the acquisition of multiple mobile genetic elements when compared with the E. coli K12 strain BW25113 (Figures S1D and S1E).
Next, we integrated a library of randomized DNA barcodes into the genome of the PEc, thereby creating the strain library PbEc, to confirm the identity of and track our exogenously introduced E. coli clinical strain in the mouse GI tract (Figure S1F). The barcode spanning region was PCR amplified and sequenced using the Amplicon-EZ (150–500 bp) sequencing service from Genewiz (now Azenta). This assay generated ~50,000 reads and we detected 6,533 unique barcodes, and the Shannon diversity index was 6.8 (Figure S1G). Figure S1F depicts the diversity of the integrated barcodes from the initial library and the genetic distance of 20 random barcodes from each other. PbEc did not display any detectable phenotypic deviation from the PEc, as determined by colony morphology, growth, and cefepime susceptibility (Figures S2A and S2B).
Recovery of viable E. coli from intestinal tissue, but not fecal samples, in mice treated with cefepime
To assess the utility of our model as a tractable tool for studying antibiotic resistance, we sought to study the effect of cefepime on E. coli alone, in the absence of other gut microbiota. Thus, germ-free C57BL/6 mice were first colonized with PbEc via a single oral gavage. Mice then received cefepime via SC pumps (20 mg/mL cefepime, 5 μL/h) or no antibiotics (Figure 2A). PbEc colonization levels in mice that did not receive antibiotic treatment, as determined by enumeration of cultured PbEc from feces and qPCR, were consistent throughout the experiment (~109–1010 colony forming unit [CFU]/g feces, ~108–9 copies/g) (Figures 2B–2D). PbEc colonization levels, however, rapidly decreased and were no longer detectable in fecal samples collected from cefepime-treated mice by day 6 (Figure 2B), even after using E. coli growth enrichment techniques.47 After 7 days of cefepime administration, mice were euthanized, and intestinal tissues were harvested. Interestingly, while we were unable to culture PbEc from colonic and cecal contents (feces), we were able to isolate viable PbEc from intestinal tissue, particularly the ileum, in mice treated with cefepime (Figure 2C).
Figure 2. Recovery of viable Escherichia coli from intestinal tissues, but not fecal samples, in mice colonized with E. coli and treated with cefepime.

(A) Schema for germ-free mouse experiment studying the effect of cefepime on parental barcoded Escherichia coli isolate (PbEc) colonizing the gastrointestinal tract.
(B) Escherichia coli strain PbEc GI colonization levels in germ-free mice treated with or without cefepime. Circles (untreated) and squares (cefepime treated) represent results from individual animals. Green dashed line indicates the limit of detection for the experiment. Bars represent the mean ± SEM. n = 6 per group. Statistical analysis by Mann-Whitney test. *p < 0.05. **p < 0.01. ns, not significant.
(C) Escherichia coli strain PbEc levels in intestinal tissues and feces in germ-free mice treated with or without cefepime for 7 days. PbEc colonization levels were calculated by enumerating CFU and then normalizing to tissue weight. Circles (untreated) and squares (cefepime treated) represent results from individual animals. Bars represent the mean ± SEM. n = 6 per group.
(D) E. coli GI colonization levels of untreated mice. E. coli GI levels as determined by qPCR of fecal gDNA of E. coli-specific uidA gene. Fecal samples collected from untreated mice (U1–U6) on days 1 and 3. Bars represent mean ± SD for each mouse; 2 technical replicates performed for each sample.
(E) Cefepime concentrations in intestinal tissue and feces in mice treated with cefepime for 7 days. Tissue homogenate supernatants were analyzed by LC-MS/MS to determine free cefepime concentration. Bars represent the mean ± SEM. n = 6 per group.
(F) Growth of PbEc and E. coli isolates recovered from the ileum tissues of mice treated with cefepime for 7 days (ileal isolate from mouse 1 [IM1]; ileal isolate from mouse 2 [IM2], etc.) in lysogenic broth (LB) media (37°C) with varying concentrations of cefepime. Two biological experiments with 4 technical replicates were performed. Points represent the mean ± SD of one biological experiment.
(G) Growth curves for PbEc and E. coli isolates recovered from the ileum tissues of mice treated with cefepime for 7 days (ileal isolate from mouse 1 [IM1]; ileal isolate from mouse 2 [IM2], etc) in LB media. Two biological experiments with 4 technical replicates were performed. Points represent the mean ± SD of one biological experiment.
Plasma and intestinal tissue cefepime concentrations in cefepime-treated mice were consistent with our prior results (Figures 1C and 2E). Cefepime concentrations in cecal contents and feces were markedly higher than in intestinal tissues: cecal contents: 6.8, feces: 4.5 vs. ileum 0.8, cecum 1.05, and colon 0.44 μg/g (Figure 2E). The survival of PbEc in illeal tissue was likely not attributable to lower cefepime concentrations, as the ileal tissue cefepime concentration (~0.8 μg/g) was still ~8 times higher than the MIC of PbEc for cefepime (MIC PbEc = 0.1 μg/mL). Surprisingly, there was no significant difference in either the MIC (Figure 2F) or the growth rate (Figure 2G) of PbEc isolates recovered from ileums of cefepime-treated mice (designated as ileal isolate from mouse 1 [IM1, IM2, etc.]), suggesting that PbEc survival was not a result of a canonical antibiotic resistance mechanism such as cefepime inactivation or efflux. Similarly, PbEc isolates obtained from other intestinal tissue also did not appear to have differences in MIC or growth rate (Figures S2C–S2F).
Lineage tracking of barcoded E. coli in mice shows clonal interference and decreased population diversity during cefepime treatment
To characterize the effect of the cefepime treatment on E. coli populations over time, we performed E. coli barcode sequencing on daily fecal samples (fecal gDNA). Although hundreds of unique barcodes were detected in all mice from both treatment groups (Figure S3), E. coli populations were dominated by ~30 highly abundant barcodes. Several dominant barcodes were highly abundant in most mice, possibly due to a founding effect during oral gavage of bacteria or horizontal transfer of bacteria from mouse to mouse via coprophagia. We observed highly dynamic trajectories of the 30 most abundant barcodes in both untreated and cefepime-treated populations (Figure 3A). These variations may have arisen due to either beneficial or costly mutations acquired by bacterial members of an asexually reproducing population in the heterogonous GI tract, a concept termed clonal interference, or horizontal transfer of bacteria between mice housed in the same cage.48 In the cefepime-treated mice, however, some barcode lineages reached frequencies of up to ~0.8 in the overall population, whereas this was not observed in untreated mice (Figure 3A). In fact, the number of unique barcodes observed in the E. coli populations of cefepime-treated mice was consistently lower than in the untreated control group (Figure 3B). This effect was most likely due to a strong population bottleneck effect where cefepime-induced bacterial death greatly reduced the size and diversity of the PbEc population (Figure 3B), as compared with untreated mice where more lineages were prevalent throughout the experiment.
Figure 3. Lineage tracking of barcoded E. coli in mice shows clonal interference and decreased population diversity during cefepime treatment.

(A) The trajectories of the 30 most frequent barcodes in parental barcoded Escherichia coli isolate (PbEc) recovered from daily collected fecal samples from untreated mice (top) and cefepime-treated mice (bottom). Mice were housed in four cages (3 mice per cage). Mice identified as 1, 2, and 3 were co-housed in one cage; mice identified as 4, 5, and 6 were co-housed in another cage.
(B) The number of unique PbEc barcodes in mice treated with or without cefepime. Black circles (untreated) and red squares (cefepime-treated) indicate the mean number of unique PbEc barcodes in each treatment group respectively. Error bars indicate the standard deviation.
(C) PbEc barcode abundance diversity within an individual mouse (alpha diversity) was calculated using the Shannon diversity index. Black circles (untreated) and red squares (cefepime-treated) indicate the mean. Error bars indicate the standard deviation.
(D) Principal coordinate analysis was performed to assess differences in overall PbEc barcode abundance composition (beta diversity) between the untreated (black circle) and cefepime-treated (red square) groups. Treatment group dissimilarity was assessed by calculating Bray-Curtis distances (weighted and normalized). The proportion of variance accounted by each principal component is indicated.
We then assessed E. coli population diversity within individual mice (alpha diversity) and measured population similarity/dissimilarity between untreated and cefepime-treated groups (beta diversity). Alpha diversity (as determined by Shannon diversity index) declined in individual mice in both groups (Figure 3C), perhaps indicating that PbEc clone competition for nutrients and inhabitable niches serves as a first layer of genetic bottleneck during GI colonization. Indeed, a small-scale barcode analysis of 2 mice from the cefepime-treated group (one mouse from each cage) and 2 mice from the untreated group (one mouse from each cage) via amplicon sequencing showed that the number of unique barcodes reduced from 6,533 to 1,292 ± 97 (mean ± standard deviation) at day 0, before cefepime treatment started. Cefepime-treated PbEc populations, however, appeared to undergo a stronger bottleneck effect, as evidenced by a greater reduction in diversity over time compared with untreated populations (Figure 3C). Principal-component analysis (beta diversity) of PbEc barcode abundance data revealed that cefepime treatment led to distinct patterns of PbEc population composition when compared with untreated counterparts (Figure 3D).
Collectively, these data suggest that lineage tracking of barcoded bacteria within the murine GI tract is a tractable tool to study the short-term and long-term effects of antibiotic exposure on bacterial population dynamics and diversity.
E. coli isolated from intestinal tissue of cefepime-treated mice exhibit antibiotic persistence
To garner greater mechanistic insight into how PbEc ileal isolates were able to survive cefepime exposure, we screened bacterial isolates from individual mice for phenotypic changes. As noted above, there was no detectable difference in either the MIC (Figure 2F) or the growth rate (Figure 2G) of PbEc isolates recovered from ileums of cefepime-treated mice compared with PbEc. However, we did notice an observable phenotypic difference (increased translucency) in several of the PbEc ileal isolate colonies we recovered from cefepime-treated mice (Figure 4A). Hence, we performed whole-genome sequencing (WGS) of PbEc ileal strains isolated from four different mice (Figure 4B). Two isolates—ileum isolate recovered from mouse 5 (IM5) and ileum isolate from mouse 6 (IM6)—had acquired mutations in the wbaP gene (Figure 4B), which catalyzes the first step in capsular polysaccharide synthesis in E. coli and Klebsiella49,50 and has also been implicated in LPS O-antigen synthesis in Salmonella and Porphyromonas.51,52 Two different loss-of-function mutations in wbaP occurred independently in two different mice suggesting that loss of this gene may have had some beneficial effect for survival of E. coli in cefepime-treated mice. Interestingly, wbaP capsular mutants have previously been reported to exhibit a more translucent colony phenotype compared with the wild-type strain in Klebsiella pneumoniae.50,53
Figure 4. E. coli recovered from the intestinal tissues of cefepime-treated mice exhibit antibiotic persistence.

(A) Image of select E. coli isolates recovered from the ileum of mice treated with cefepime (IM1–IM6) and parent barcoded strain (PbEc) grown on LB agar plate. Streaked inoculum normalized for each isolate.
(B) Table summarizing genetic mutations, mutation type, and predicted phenotypes in E. coli isolates recovered from the ileum of mice treated with cefepime.
(C) PbEc and IM6 growth curves in response to varying concentrations of cefepime. Points represent mean ± SD; 3 replicates were performed for each experiment.
(D) Schematic figures showing illustrative definitions of hypothetical time-kill curves of bacteria exposed to antibiotics with different phenotypic outcomes: resistant and susceptible strains (left), tolerant and susceptible strains (center), and persistent and susceptible strains (right). Minimum duration for killing (MDK) values for killing 99% (MDK99) and 99.99% (MDK99.99) of total bacteria is indicated for each outcome.
(E) Time-kill assay of PbEc and IM6 (n = 6) after exposure to cefepime (1 μg/mL).
Points represent the mean ± SEM. Black vertical dashed lines and red vertical dashed lines are used to represent the calculated MDK99 and MDK99.99 values for PbEc and IM6, respectively.
Because the wbaP gene mutation was observed in 2 of the 4 isolate sequences, we hypothesized that changes to the PEc polysaccharide capsule and/or LPS O-antigen might play an important role in the ability of PbEc to better survive antibiotic/antimicrobial peptide exposure given prior published reports.54–56 Of note, analysis of the PEc WGS data suggested a group 1 polysaccharide capsule type for the PEc strain (Figure S4A).57 We could not ascertain any differences in LPS O-antigen between the ileal isolates and PbEc, as determined by performing gel electrophoresis of purified LPS from these strains (Figures S4B and S4C). As IM6 retained its C-terminal domain, the O-antigen-synthesizing glycosyltransferase activity presumably remained intact in this strain as opposed to IM5 where the entire gene was deleted. Therefore, we proceeded to focus on strain IM6 that had a single-nucleotide deletion in wbaP, rather than IM5, which exhibited a deletion of wbaP, including other genes in its operon.
PbEc isolates recovered from cefepime-treated mice were not antibiotic resistant, as we found no significant difference in cefepime MIC (MIC PbEc ≅ 0.1 μg/mL) when comparing PbEc with IM6 (Figure 4C). Therefore, we assessed whether IM6 exhibited an antibiotic-tolerant or -persistent phenotype, which is highly prevalent among clinical isolates recovered from patients with previous exposure to antibiotics.58–60 Antibiotic tolerance refers to a bacterial population that can tolerate exposure to particular antibiotics, thus dying at a slower rate compared with antibiotic-susceptible bacteria. Antibiotic persistence is the phenomenon by which a sub-population of cells consistently survive lethal doses of antibiotic treatment.61–63 Thus, adhering to the guideline definitions proposed by a multinational scientific consortium,61 we performed a cefepime-induced time-kill assay by exposing growing cultures of PbEc and IM6 to a cefepime concentration of 1 μg/mL, which corresponds to ten times above the MIC (0.1 μg/mL). Antibiotic-resistant bacteria clinically exhibit growth in the presence of antibiotic concentrations exceeding MIC, which divide antibiotic susceptibility testing into categories that correlate with the probability of clinical outcomes (illustrative definition in Figure 4D, red line, left). In contrast, antibiotic-tolerant bacteria have longer minimum duration of killing for both 99% (MDK99) and 99.99% (MDK99.99) killing (illustrative definition in Figure 4D, blue line, middle), compared with antibiotic-susceptible bacteria (Figure 4D, green line, right). While the MDK99 value for antibiotic persistent bacteria is similar to antibiotic-susceptible bacteria, the time required to kill 99.9% or 99.99% of (MDK99.9 or MDK99.99) of persister bacteria is significantly longer (illustrative definition in Figure 4D, black line, right). In our cefepime time-kill assay, we observed that although the MDK99 was similar for both PbEc and IM6 (1.05 and 1.37 h, respectively), the MDK99.99 was significantly longer for IM6 (PbEc: 3.38 h vs. IM6: 4.79 h, p = 0.002, paired t test; Figure 4E). Thus, we concluded that the IM6 isolates had developed an antibiotic persistence61 phenotype in the presence of cefepime (Figure 4E). Interestingly, the killing rate for both the PbEc and IM6 decreased after ~6 h, as has been previously described for laboratory evolved persister bacteria.64 This effect is likely due to either a standing variation in both populations or degraded cefepime molecules losing their activity over time in our assay.
E. coli (PEc) mutants lacking wbaP exhibit increased invasion of cultured human colonocytes
Bacterial capsular deletion mutants have been shown to be internalized by macrophages and bladder epithelial cells at a higher rate than wild-type counterparts.50,65,66 To test whether perturbations in capsule production in our clinical E. coli strain could play a role in colonocyte invasion, we generated a wbaP deletion mutant of the clinical strain PEc and performed intestinal epithelial cell invasion assays using cultured HT-29 human colonocytes.67 We were able to culture significantly larger numbers of PEc wbaP deletion mutants (ΔwbaP) from colonocyte cells compared with colonocytes co-incubated with PEc (Figure 5A). ΔwbaP mutants complemented with wbaP (with arabinose-induced expression) exhibited colonocyte invasion comparable to the wild-type PEc strain. Finally, the E. coli IM6 isolate with a one nucleotide deletion in wbaP also exhibited increased invasion capacity when compared with PEc (Figure 5B). Interestingly, Klebsiella wbaP mutants have been shown to have an increased capacity to invade bladder epithelial cells, a phenomenon observed in urinary tract infection (UTI) clinical isolates.50
Figure 5. E. coli (PEc) mutants lacking wbaP exhibit increased invasion of cultured human colonocytes.

(A) Cell invasion assays of human HT-29 colonocytes using E. coli strains PEc (black), PEc-ΔwbaP (red), PEc-ΔwbaP + pKD-wbaP (dark blue), and PEc-ΔwbaP + pKD-wbaP + arabinose (light blue). E. coli was quantified by the enumeration of cultured CFU and normalized to the initial inoculum (CFU) of PEc. Points represent a single biological experiment (with 3 technical replicates). Bars represent the mean ± SEM. *p ≤ 0.05, **p ≤ 0.01, ***p ≤ 0.001.
(B) Cell invasion assays of HT-29 cell lines with PbEc (black) and IM6 (red). Experimental design as described above in (A) with the exception that IM6 cell invasion numbers were normalized to PbEc. Points represent a single biological experiment (with 3 technical replicates). Bars represent the mean ± SEM. *p ≤ 0.05. **p ≤ 0.01. ***p ≤ 0.001.
(C) HT-29 colonocyte intracellular cefepime concentrations. The colonocyte intracellular concentration of cefepime was assessed by LC-MS/MS. n = 3 replicates. Symbols (circle, square, and triangle) represent the mean ± SD. *p ≤ 0.05. **p ≤ 0.01. ***p ≤ 0.001.
(D) Time-kill assay of PbEc vs. IM6 at sub-MIC concentration of cefepime (0.05 μg/mL). Experimental procedure as described in Figure 4E. Mean ± SD plotted.
(E) PbEc and IM6 evolved for cefepime resistance using an in vitro serial passage assay. PbEc (black square) and IM6 (red circle) were grown in increasing concentrations of cefepime in LB (corresponding to 0.25×, 0.5×, 1×, 2×, and 4× MIC) daily. n = 6 for each group. Symbols (black square, PbEc, and red circle, IM6) represent the mean with accompanying 95% confidence interval values.
To determine whether bacterial internalization within epithelial cells provides an additional level of protection to bacteria from cefepime treatment, we measured cefepime levels within colonocytes. Cultured colonocytes were exposed to varying concentrations of cefepime added to the cell culture media: 0.1 μg/mL (MIC of PEc), 1 μg/mL (approximating our observed mouse ileal, 0.8 μg/g, and cecal tissue cefepime concentration, 1.05 μg/g; Figure 2D), and 5 μg/mL (approximating the plasma concentration of cefepime observed in our model; Figures 1D and 2D). Intracellular colonocyte cefepime concentration was nearly twenty times lower and directly proportional to the concentration of cefepime in the cell culture media, notably increasing over time with the highest concentration of 5 μg/mL (Figure 5C). Interestingly, when using a cefepime concentration of 1 μg/mL in the cell culture media, which approximates intestinal tissue levels in mice, we found that the colonocyte intracellular concentration of cefepime was below the MIC, or sub-MIC (0.05 μg/mL) (Figure 5C). We next performed a time-kill assay to determine the effects of sub-MIC (0.05 μg/mL) concentrations of cefepime on PEc and IM6. At this concentration, cefepime is expected to have a significant inhibitory effect on bacterial cells but will not have a bactericidal effect as strong as what we observed at concentrations higher than MIC (e.g., 1 μg/mL, Figures 4E, S5, and S6A). We found that at sub-MIC concentrations (0.05 μg/mL), survival of both PEc and IM6 was increased approximately 10-fold, with IM6 still exhibiting higher survival compared with PEc (Figures 5D and S6B) evidenced by slower killing rate for IM6 at this lower cefepime dose. Thus, we concluded that IM6 had two fitness advantages over PbEc. First, IM6 exhibits increased ability to invade cells due to the wbaP mutation, sheltering mutant bacteria from higher and lethal extracellular cefepime concentrations. Second, IM6 strain exhibited cefepime persistence, allowing for increased survival in both the intracellular and extracellular environment (Figure S6B). Of note, wbaP deletion alone is not sufficient to induce increased antibiotic resistance or persistence (Figure S6C).
Finally, we tested the ability of PbEc and IM6 to evolve resistance to cefepime using an in vitro evolution assay. Briefly, PbEc and IM6 were passaged in varying concentrations of cefepime (corresponding to 0, 1/4X, 1/2X, 1X, 2X, and 4X the MIC of PbEc) over 21 days. MIC’s were evaluated daily, and cefepime concentrations in evolution experiments were adjusted accordingly. Cells were then passaged in the aforementioned concentrations (calculated using the new daily MIC value). We found that IM6 evolved resistance at a comparable rate to PbEc (Figure 5E) and acquired similar mutations (Table S2), suggesting that IM6 was neither more nor less adept at evolving toward cefepime resistance. Populations derived from evolving PbEc under cefepime selection in vitro had steadily increasing number of surviving E. coli (Figure S6D) as conceptually described in Figure 4D. Interestingly, mutations in the wbaP gene were observed in evolving PbEc populations. However, wbaP deletion does not increase cefepime resistance as previously stated suggesting that loss of wbaP may confer a fitness advantage for laboratory adaptation of a clinical E. coli strain. Indeed, many of the commonly used laboratory strains of E. coli lack the wbaP gene. Frequent mutations in the wbaP gene were also previously reported in K. pneumoniae, particularly when bacterial cultures were passaged in rich growth media under aerobic conditions.68 Previous studies have shown that repeated exposure to sub-MIC doses of antibiotics increases the propensity of bacteria to develop resistance.69–71 Therefore, consistent exposure to sub-MIC conditions (such as those observed here) over a longer period of time could potentially lead to eventual resistance development in clinical settings.
An unbiased genomic survey of E. coli isolated from intestinal tissue of untreated and cefepime-treated mice
We initially chose to focus on the IM6 isolate, as it exhibited a morphogenic phenotypic difference when compared with other strains. To address whether our observation of persister/colonocyte invader phenotype was more generalizable, we performed an unbiased and comprehensive genomic screening of E. coli isolates/strains recovered from our experimental mice. We interrogated the archived intestinal tissue (ileum, cecum, and colon) homogenates of all mice (untreated and cefepime treated, n = 6 per group) with the goal of isolating and analyzing ~5 strains per tissue, ~15 strains per mouse. We were able to recover 160 isolates, with more consistent and abundant colony recovery from the untreated group as compared with the cefepime group: 85 isolates from untreated, 75 isolates from cefepime treated (Figure 6A). The isolates were designated S1–S161 (as S143 was inadvertently skipped in our numbering regimen). We performed WGS (Illumina 150 bp paired-end sequencing) on the parental strain PbEc and on these 160 isolates and detected a total of 448 mutations (236 in untreated group, 212 in cefepime), with the vast majority being single-nucleotide polymorphisms, SNP (Figure 6B; Table S3). We excluded any mutations found in the parental strain, PbEc (e.g., complex mutation in rhsD, position 139112) (Table S3). Interestingly, we were able to identify mutations that were exclusive to isolates recovered from either the untreated or cefepime-treated group (Figure 6C). Of note, we only observed unique mutations in 2 genes in the cefepime-treated mice: wbaP (in 4 isolates recovered from 3 mice, two different cages) and in the cad operon (3 isolates from 3 mice, two different cages) (Figure 6C).
Figure 6. Genomic and phenotypic characterization of E. coli isolates recovered from intestinal tissue of untreated and cefepime-treated mice.

(A) Summary of E. coli isolates recovered from archived intestinal tissue homogenates from germ-free mice colonized with PbEc and treated with or without cefepime.
(B) Summary of genomic sequence variation of 160 E. coli isolates. WGS, whole-genome sequencing.
(C) Genetic mutations exclusive to E. coli isolates recovered from intestinal tissue of untreated mice vs. cefepime-treated mice.
(D) Description of the four E. coli isolates (S24, S30, S53, and S66), which underwent phenotypic characterization, by their tissue source and mutations detected by whole-genome sequencing.
(E) Cell invasion assays of human HT-29 colonocytes using E. coli strains PbEc, IM6, S24, S30, S53, and S66. Points represent a single biological experiment (with 9 technical replicates). Bars represent the mean ± SEM. *p ≤ 0.05. **p ≤ 0.01. ***p ≤ 0.001.
(F) Time-kill assay of PbEc, IM6, S24, S30, S53, and S66 at MIC of cefepime (0.1 μg/mL). 8–24 replicates. Mean ± SEM.
(G) MIC measurements were performed for PbEc, IM6, S24, S30, S53, and S66 using cefepime at increasing concentrations. The measurements were conducted in triplicate, and the results are presented as the mean ± standard deviation.
We then sought to investigate the phenotypes of 4 new isolates (S24, S30, S53, and S66) recovered from cefepime-treated mice identified in our screen above. The rationale for choosing these 4 strains is that each isolate had a unique genetic mutational profile (Figure 6D). We then proceeded to perform bacteria/colonocyte co-cultured invasions assays, also including the parental barcoded strain, PbEc, as a normalizing reference, and IM6, the previously described isolate with a wbaP mutation which exhibited an increased capacity for human colonocyte invasion (Figures 5A and 5B). While each of the new isolates exhibited increased colonocyte invasion compared with PbEc, only IM6 and S53 showed a statistically significant increase (Figure 6E), with S53 exhibiting an even stronger invasion phenotype than IM6. Interestingly, S53 harbors a mutation in a hypothetical protein gene, which shares 98% identity with an uncharacterized protein gene yubN (https://www.uniprot.org/uniprotkb/Q9JMR2/entry) and 95% identity with an fimbrial-like protein gene yehA (https://www.uniprot.org/uniprotkb/P33340/entry), both of which are found in the E. coli strain K12. While there is little known about the function of YubN, there is one study that shows that constitutive expression of the ye-hABCD operon in E. coli K12 does result in increased adhesion/biofilm formation to abiotic surfaces.72 Thus, this begs the speculative question as to whether a mutation in this “yehA-like fimbrial-like” hypothetical protein could lead to changes in the capacity of S53 to invade intestinal epithelial cells. Ultimately, further studies will need to be performed to more definitively answer this question.
Finally, we also performed in vitro MDK assays with cefepime with these 4 strains, together with PbEc and IM6. Consistent with our prior results (Figure 5D), we did observe a significant difference in cefepime killing of IM6 compared with PbEc (Figure 6F). Among the 4 new isolates, only S53 exhibited greater resistance to cefepime killing, even greater than IM6 (Figure 6F). We also conducted in vitro MIC measurements using cefepime on these strains and observed that none exhibited increased cefepime resistance compared with the parental strain (PbEc), as shown in Figure 6G.
DISCUSSION
Studies on antibiotic resistance development and evolution are often limited by the use of well-controlled systems utilizing permissive, and perhaps non-physiologic, conditions. Thus, the conclusions arrived at using these approaches may lack clinical relevance.73 Here, we describe an in vivo model for studying the effects of antibiotic treatment on E. coli residing in the GI tract. We sought to emulate exposures observed in human patients by first focusing on achieving clinically relevant trough plasma levels. We found that antibiotic concentrations varied significantly in different intestinal tissues from the measured plasma levels, leading to recovery of bacterial isolates from only certain GI tract segments, highlighting the significance of tissue-specific antibiotic concentrations.
The mechanisms of bacterial survival after antibiotic treatment are poorly understood. Intracellular invasion has been widely implicated in facilitating these infections particularly in the case of recurrent UTI infections74,75: intracellular bacteria can escape membrane-bound phagocytosed vacuoles to establish cytosolic intracellular bacterial communities that can spawn reinfection and induce lower urinary tract symptoms with no apparent bacteriuria. The wbaP mutant, IM6 isolated from the intestinal tissue of the cefepime-treated mice, as well as the E. coli wbaP mutant that we generated for this study, exhibited increased capacity to invade cultured human colonocytes. This phenotype has been observed previously in hypocapsulated Salmonella enteritidis mutants, which although previously implicated in their enhanced ability to invade macrophage cells, were also found to be defective in swarm motility, which is important for proliferation in the intracellular environment.66 It is possible that the intracellular sub-MIC concentration of cefepime would allow for the formation of intracellular bacterial communities or even for the bacteria to escape their initial phagocytosed membrane-bound organelles remaining in a quiescent state within these vesicles, but further investigation is required to rigorously address these questions.
As to the clinical relevance of wbaP mutations in E. coli, we could not find any publications which included E. coli clinical isolates with wbaP mutations. After interrogating the NCBI bacterial genome archives, we were, however, able to find one E. coli strain, F16EC0456, a bloodstream infection isolate recovered from a human host in 2016, as part of the Korea Global Antimicrobial Resistance Surveillance System (Kor-GLASS) program, with a comparable wbaP mutation (https://www.ncbi.nlm.nih.gov/biosample/SAMN23391690). We have found two other E. coli isolates (ELN4452882.1 and EFB9349347.1) that had wbaP genes with the same length as our PEc isolate (475 aa). ELN4452882.1 was recovered from a human urine sample, and EFB9349347.1 was isolated from an oyster during food surveillance. Both strains have wbaP mutations, albeit no premature stop codons. As noted above, Klebsiella wbaP mutants have been shown to have an increased capacity to invade bladder epithelial cells, a phenomenon observed in UTI infection clinical isolates.50 wbaP is also required for motility and invasion of Salmonella enterica serovar Enteritidis.66 These collective data would suggest that wbaP may play a role in adhesion/invasion in several members of the Enterobacteriaceae family.
Understanding and potentially predicting antibiotic resistance evolution should be an important consideration when administering antibiotics to human patients. Currently, empiric antibiotic therapy is the paradigm when administering antibiotics to populations at high risk for developing infections (e.g., fever and neutropenia for cancer patients, presumed sepsis in ICU patients, etc.) with screening performed afterward to confirm the susceptibility of the infectious agent.76 Alternatively, by understanding potential pathways to resistance, more informed and effective treatments could be prescribed that minimize the potential for resistance or cross-resistance and maximizes positive treatment outcomes. Thus, our preclinical model has the potential to generate potentially impactful insights into how microorganisms adapt and evolve when exposed to antibiotics.
Our study also highlights the utility of this model to study bacterial population dynamics and evolution. Here, we chose to study the effect of a single antibiotic on a single gut bacterium. Any genetically barcoded microorganism could be introduced into a germ-free or conventional GI tract. Potentially, any antibiotic or combinations of antibiotics could be administered via SC pumps and conventional delivery systems. Any number of additional “stressors” or variables could then be added as well: changes in diet, co-infection with a microbial pathogen, induction of an autoimmune phenotype, etc. In addition to ascertaining the effect of these stressors on the microorganism in question, the effects on the host—ranging from effect on the microbiome, metabolome, immune function, and host metabolism—could easily be interrogated as well.
In summary, we have developed a tractable and clinically relevant preclinical model to study the effects of antibiotics on bacteria residing within the GI tract. In this study, we documented one mechanism by which commensal gut bacteria can adapt to antibiotic exposure by invading intestinal cells and exhibiting increased antibiotic persistence. In the future, this model could easily be adapted to study numerous aspects of microbiology, infectious diseases, ecology, and evolution.
Limitations of the study
E. coli colonizing the GI tract of a germ-free mouse will likely behave quite distinctly from E. coli colonizing the GI tract of a mouse or human with an intact and mature microbiome. Therefore, future studies will involve introducing the PbEc into conventional mice with intact gut microbiomes and then administering antibiotics. Further, as it is well documented that different inbred mouse strains harbor different gut microbiomes (and even the same strain, such as C57BL/6 mice, from different vendors have unique gut microbiomes77), it would be important to confirm whether our findings are generalizable in other inbred strains of mice.
We are cognizant that the antibiotic trough levels reported in human patients arrive through bolus dosing at regular intervals. Further, we realize that bolus dosing itself, as there is an accompanying peak level prior to reaching a sustained trough level, could have significant impacts on antibiotic pharmacokinetic/pharmacodynamic (PK/PD) observed systemically and in the gut. As such, we plan to implement bolus dosing in addition to continuous antibiotic administration in future versions of this model as we strive to better approximate the human condition (Figure 1).
STAR★METHODS
RESOURCE AVAILABILITY
Lead contact
Further information and requests for resources and reagents should be directed to and will be fulfilled by the lead contact, Erdal Toprak (erdal.toprak@utsouthwestern.edu).
Materials availability
Bacterial isolates generated during this study will be provided under a material transfer agreement.
Data and code availability
Raw bacterial whole genome and barcode sequencing data are deposited under the NCBI BioProject with accession number PRJNA930439
In vivo and in vitro data reported in this paper will be shared by the lead contact upon request.
Original code generated for this study is deposited at GitHub at the following repository: https://github.com/marinelle-rodrigues/Rodrigues_2023 and https://github.com/msadikyildiz/rodrigues_2023.
Any additional information required to reanalyze the data reported in this paper is available from the lead contact upon request.
EXPERIMENTAL MODEL AND SUBJECT DETAILS
Mice
C57BL/6J (strain number 000664) mice were obtained from Jackson Laboratories and bred and maintained in the barrier facility at the University of Texas Southwestern Medical Center. All animals were kept on a 12-hour light-dark cycle and were fed standard mouse chow (Teklad 2916, irradiated). Female, 5–7week old mice were used for all experiments. Experiments were performed using protocols approved by the Institutional Animal Care and Use Committees of the UT Southwestern Medical Center.
Germfree C57BL/6 mice were bred and maintained in isolators at the University of Texas Southwestern Medical Center. Female, 5–7 week old mice were used for all experiments. Inclusion/exclusion criteria were not established. No animals were excluded from analysis. Randomization was not used, and no blinding was done for mouse studies.
Bacterial strains
Escherichia coli cultures were routinely grown in Lysogenic Broth (LB) medium aerobically (shaking at 230 rpm) at 37°C, unless otherwise specified. Growth was determined by spectrometry (OD600) or enumeration of cultured colony forming units (CFU) on LB plates. When specified, kanamycin was supplemented at 50 μg/mL, chloramphenicol was supplemented at 25 μg /mL, and ampicillin was supplemented at 100 μg /mL.
Human subjects
Fecal sample was collected from a pediatric stem cell transplant patient (10 year-old, white, Hispanic, male) under a biospecimen study. This study (STU 012017–027) was reviewed and approved by the University of Texas Southwestern Medical Center IRB. The subject and his parents were provided with an explanation of the study and gave informed consent in writing prior to the start of their participation in the study.
Cell Culture
HT-29 cells (HTB-38, human colorectal adenocarcinoma) were purchased from the American Type Culture Collection (ATCC) and tested negative for mycoplasma contamination. HT-29 cells were grown in DMEM (Gibco cat. 11965092) (supplemented with 10% FBS and 1% Antibiotic-Antimycotic Gibco cat. 15240062) for 72 hours at 37°C until confluent.
METHOD DETAILS
Sub-cutaneous pump administration of cefepime and assessment of tissue cefepime concentrations
Conventional C57BL/6 mice (female, 5–7 weeks age) were anesthetized with isoflurane and then implanted with Alzet model 2001D mini-osmotic pumps subcutaneously. Pumps were then filled with 20, 40 and 60 mg/mL of active cefepime (PremierProRx, Sagen Pharmaceuticals) prepared in sterile HPLC grade water. Mice were administered 5 mg/kg carprofen SC at time of surgery and then 18 hours later for pain management. 20 hours after surgery, the animals were euthanized by inhalation overdose of CO2 and pumps were removed. Whole blood was harvested by terminal cardiac puncture. Plasma was processed from whole blood by centrifugation of the ACD treated blood for 10 minutes at 10,000 rpm in a standard centrifuge. Lung, colon, small intestine, small intestine contents, and fecal pellets were also collected. The tissues were weighed and snap frozen in liquid nitrogen. Tissues were homogenized in a three-fold volume to weight ratio of PBS using a polytron homogenizer (IKA T25 Ultra Turrax Basic Homogenizer, IKA Works, Wilmington, NC). Homogenates were stored at −80°C until analysis by LC-MS/MS.
LC-MS/MS analysis of cefepime
Levels of cefepime in plasma, tissues, and cell lysates were determined by LC-MS/MS. Briefly, plasma, tissue homogenate, or cell lysate was mixed with a two-fold volume of methanol containing 0.15% formic acid and 150 ng/mL of the internal standard ceftazidime. Samples were vortexed for 15 seconds, incubated for 10 min at RT and then centrifuged for 5 min at 4°C for 5 min at 16,100 × g. The supernatant was centrifuged a second time before placing in an HPLC vial. Levels of cefepime were monitored by LC-MS/MS using an AB Sciex (Framingham, MA) 4000 QTRAP® or Triple Quad 4500™ mass spectrometer coupled to a Shimadzu (Columbia, MD) Prominence LC. The compound was detected with the mass spectrometer in positive MRM (multiple reaction monitoring) mode by following the precursor to fragment ion transition 481.1/396.0. An Agilent C18 XDB column (5 micron, 50 X 4.6 mm) was used for chromatography with the following conditions: Buffer A: dH20 + 0.1% formic acid, Buffer B: methanol + 0.1% formic acid, 0 – 0.5 min 5% B, 0.5 – 1.5 min gradient to 100% B, 1.5 – 4.5 min 100% B, 4.5 – 4.6 min gradient to 5% B, 4.6 – 5.5 5% B, flow rate 1.5 ml/min. Ceftazidine (transition 547.101/468.0) from Sigma (St. Louis, MO) was used as an internal standard (IS).
Comparison of different dosing methods for cefepime Subcutaneous (SC)
C57BL/6J mice were administered 50 mg/kg cefepime SC (0.2 ml per SC injection). Whole blood was harvested by cardiac puncture from euthanized mice and placed into acid citrate dextrose (ACD) tubes. Plasma was extracted after centrifugation (9,600 × g for 10 minutes). Colon, small intestine, fecal material, and fecal pellet were also collected at this time. The tissues were weighed and snap frozen in liquid nitrogen. Tissues were homogenized in a three-fold volume to weight ratio of PBS as previously described. Homogenates were stored at −80°C until analysis by LC-MS/MS.
Pump only
A separate cohort of animals were implanted SC with iPrecio pumps (iPRECIO Micro Infusion Pump System, SMP-310R; Primetech Corporation, Tokyo, Japan) containing 20 mg/mL Cefepime (flow rate: 4 μL/hr) and plasma and tissue levels determined in the same manner.
Isolation of Escherichia coli isolate from patient fecal sample
After initial enrichment in lactose broth, successive plating on selective agar: mEndo followed by mFC agar and finally MacConkey Agar with MUG. Colonies appearing fluorescent on this media were identified as E. coli (designated PEc) using MALDI-TOF (Bruker MALDI Biotyper); genome sequencing ruled-out potential misidentification of Shigella species by MALDI-TOF.
Genomic analyses of PEc strain
Genomic DNA was isolated from the clinical strains obtained using DNeasy Blood and tissue kit (Qiagen cat. 69504). DNA was sent to Microbial Genome Sequencing Center, PA (now Seqcenter) for Illumina whole genome sequencing. Paired-end reads (2 × 150 bp) were first assembled into contigs using CLC Genomics Workbench de novo assembly tool. These contigs were then submitted to RAST for annotation and prediction.
RefSeq genome assemblies of E. coli MG1655, BL21, and O157:H7 were downloaded from National Center for Biotechnology Information (NCBI) FTP site. MUMmer 478 was used to compare the genome assemblies. The mutation rate between two genomes was calculated by the number of SNPs divided by the alignment length and Jukes-Cantor distances were calculated from the mutation rates. The neighbor-joining tree was generated based on the distances using R-packages ape79 and ggtree.80
PEc Barcoding protocol
The clinical strain PEc was first transformed with the modified lambda recombineering plasmid pKD-PC. The resulting transformants were induced for lambda recombination using arabinose, and the resulting cells were transformed with 1 microgram of the barcoded plasmid library. After overnight incubation at room temperature, the cells were plated on pre-warmed M9-Kanamycin-4-chloro-phenylalanine plates (200 mL 5X M9 salts, 100 mL 10X Amikacin, 40 mL 25X Glucose, 2 mL MgSO4, 100 μl CaCl2, 2 gr 4-Chloro-DL-phenylalanine (Alfa Aesar, cat. A13323), 15 gr agar per 1 L of media). After overnight growth at 40°C, the lawns of cells were scraped and diluted in M9 broth supplemented with kanamycin and 4-chloro-DL-phenylalanine. Several passages were performed taking at least 106 cells per passage to completely remove ampicillin and chloramphenicol resistance genes from the library. To assess integrated barcode diversity, amplification of the barcodes was always performed using one primer outside of the region of homology on the chromosome while the other primer was located within the integration cassette on the other side of the barcode.
Genomic analyses of PbEc isolates
Whole genome DNA sequencing of the isolates is performed on Illumina HiSeq 2000 at near 150x coverage with 150bp paired-end sequencing. Reads are trimmed using cutadapt81 tool with a quality cutoff of 20, and aligned against the custom genome assembly of PbEc we referred earlier using bowtie282 with very sensitive local alignment preset while discarding mixed and discordantly aligned read pairs. Resulting alignments were used to call SNPs, insertions, deletions, and more complex genetic variations using snippy and Pilon83 tools with default parameters. Mutations found in the ancestral strain are retrospectively filtered (54-variant-call-review.i-pynb). All mutations are linked to their corresponding origin of mice, tissue, colony number, and barcodes using custom python scripts (56-barcode-analysis.ipynb, 57-collect-all-results.ipynb).
Preclinical model studying the effects of antibiotics on E. coli in the GI tract
5–7 week old female C57/BL6 germ-free mice were used, with n=6 for each group. Mice were gavaged with 1 ×10⁷ CFU PbEc. 2 days after oral gavage, PbEc GI colonization levels were assessed by enumeration of cultured PbEc from fecal samples. On Day 3 after oral gavage, 6 mice were implanted with iPrecio SMP-310R pumps which were filled with cefepime 20 mg/mL dispensing 5 μl/hr. Stool was collected daily for measurement of PbEC GI levels. Pumps were refilled with cefepime daily after mice were briefly anesthetized using isoflurane. On day 10 after oral gavage, mice were euthanized, and GI tract tissue (ileal, cecal, colon, fecal material from cecum and colon) were harvested. A portion of fresh GI tissue was homogenized and incubated in lactose broth to assess for PbEc growth. The remainder of GI tissue was snap frozen in liquid nitrogen. Tissue was later used for measuring cefepime concentrations via LC-MS/MS analysis and extracting genomic DNA for sequencing.
Escherichia coli growth quantification from mouse tissue
Stool was collected daily in pre-weighed sterile Eppendorf tubes, and fecal pellet weight was measured. Pellets were homogenized in 0.1% Proteose peptone by affixing them to a vortexer for 5 minutes. Homogenized stool was serially diluted in a 96-well plate and dilutions were plated on LB plates supplemented with kanamycin and MacConkey agar plates.
Mice were euthanized and tissue samples (Ileum, cecum, colon) were resected, weighed and resuspended in 0.1% proteose peptone. Tissue samples were homogenized using TissueLyser II (Qiagen) at 25 Hz for 90 seconds and serially diluted in proteose peptone. Dilutions were plated on LB-kanamycin and MacConkey agar plates and also inoculated into lactose broth and incubated at 37C aerobically for 16–20 hours. Additionally, glycerol stocks of homogenate were prepared (25% v/v). Colony-forming units were enumerated the following day.
Quantitative PCR for assessing E. coli GI levels
Bacterial load in stool was quantified by qPCR analysis (SsoAdvancedSYBR Green Supermix, Bio-Rad) of microbial gDNA using the E. coli uidA gene as previously described.84 Bacterial abundance was determined using standard curves constructed with reference to cloned DNA corresponding to a short segment of the uidA gene that were amplified using conserved specific primers (qPCR Primer set 1). 25ng of microbial gDNA was used as an input template. Reaction conditions were 30 sec at 95°C, followed by 40 cycles of 1 sec at 95°C and 10 sec at 57.2°C.
Quantification of PbEc Barcode Frequency and Distribution in the Murine GI Tract
gDNA was extracted from fecal and tissue samples using the MagAttract Power Microbiome DNA/RNA KF kit (Qiagen) and Kingfisher Flex (Thermo Fisher Scientific). Amplicon libraries were prepared using 50 ng of fecal gDNA for initial amplification of samples (BC amp Set 1 primers, Table S1). 5 μl of this reaction was used in a subsequent round of amplification using BC amp set 3 primers to add Illumina adapters to the sequences followed by amplification using the Nextera XT DNA Library Preparation Kit (Illumina cat. FC-131–1096) to add 5’ and 3’ indices to the library. The bands corresponding to the amplicon were gel extracted and pooled together before sequencing.
Amplicon sequencing was performed (BGIseq 2000 platform, PE 100). Small scale barcode amplicon sequencing (Figure S5) was done using Amplicon-EZ (150–500 bp) sequencing service from Genewiz. We quantified barcode frequencies from the raw sequencing reads with following steps:
Merged paired reads into a single longer reads (median read length 127) using FLASH85 with parameters minimum overlap is 10bp and maximum mismatch density is 0.25.
Aligned merged reads to the amplicon region template sequence using bowtie282 with parameters set to very sensitive local alignment while disabling gaps (complete command included in 25-bowtie2-align-merged-pairs.run) in the reference sequence in order to eliminate reads with partial barcode integration.
Counted successfully aligned reads using a custom python script (30-find-barcodes.py) that indexes each read with the aligned barcode sequence.
Generated day-by-day barcode frequency trajectories using a custom python script (40-create-barcode-trajectories.py) by normalizing barcode read counts to the total recovered barcode count at each sample.
Cefepime dose-response curve assays
Overnight cultures of the strains were prepared and inoculated into a 96-well plate containing 2-fold dilutions of cefepime in LB media to a final OD600 of 0.001. Plates were incubated at 37°C with shaking (400 rpm in Infors HT plate shaker). Plates were read the next day using Biotek Epoch2 plate reader. Background subtracted data was obtained from Biotek Gen5 software after specifying blank wells. The minimum cefepime concentration where no bacterial growth was detected using optical density reads was designated as the MIC value (Background corrected OD600 < 0.01).
Growth curve assays
Overnight cultures of the strains were prepared and inoculated into a 96-well plate containing LB to a final OD600 of 0.001. Plates were incubated in stacker device provided with Biotek Epoch2 machine and were read every 15 minutes for 24 hours. Growth curve data was obtained after background subtraction by Biotek Gen5 software.
Cefepime time-kill assay
Overnight cultures of PbEc and IM6 were diluted 1:1000 and allowed to grow for 2 hours aerobically. The initial CFU of the culture was recorded using serial dilution and plating on LB agar. The cultures were then exposed to different concentrations of cefepime and every hour samples were obtained, washed twice with 1X PBS to remove residual antibiotic and serial dilutions and plating was used to assess CFU at different time points.
Cefepime evolution assay
PbEc and IM6 (six replicates of each strain) were grown in LB with cefepime concentrations corresponding to 0.25X, 0.5X, 1X, 2X and 4X MIC. Based on growth (OD600>0.5), new MIC’s were calculated daily. Cultures were then diluted 1:100 into fresh media containing the aforementioned concentrations of cefepime. The experiment was carried out for 21 days. Two replicates of each strain were also simultaneously passaged in LB (without cefepime) for comparison.
LPS extraction and PAGE
LPS was extracted from the strains as previously described.86 10 μl of LPS extract was mixed with 10 μl 2X SDS dye and was run on 10% unstained polyacrylamide gel at 180 V for 30 minutes. Gel was stained using Pro-Q™ Emerald 300 Lipopolysaccharide Gel Stain Kit (ThermoFisher cat. P20495) and visualized using a BioRad imager.
Polymerase Chain Reaction (PCR)
Routine PCR was performed using Q5 High-fidelity Mastermix (NEB M0492L). PCR purification and gel extraction was performed using Macherey-Nagel Kit cat. 740609, plasmid purification was performed using Macherey-Nagel Kit cat. 740588, gDNA was extracted using QIagen DNeasy Blood and Tissue kit (cat. 69504) unless otherwise specified.
Plasmids used
An integration cassette containing two regions of homology flanking a kanamycin-resistance gene was engineered on a pUC backbone plasmid encoding ampicillin resistance using the NEBuilder HiFi DNA Assembly mastermix (NEB E2621L). A counter-selectable marker based on PheS was engineered under the constitutive SpeI promoter and cloned into the pUC plasmid (generating pUC-BC) as well as the lambda recombineering plasmid pKD46.87 In addition, the ampicillin resistance marker on pKD46 was replaced by a chloramphenicol resistance cassette yielding plasmid pKD-PC. Phosphorylated primers containing one half of the barcode each at the 5′ ends were used to linearize the pUC-BC plasmid and the resulting amplicon was ligated using T4 DNA Ligase (NEB M2200L). The purified ligation reaction was transformed into NEB-10-Beta competent cells (NEB C3020K) and the lawns resulting from this transformation were pooled together and inoculated into LB broth supplemented with kanamycin. Plasmid purification from the library was performed using the Qiagen Plasmid Midi Kit (Qiagen 12123).
wbaP deletion protocol
Two regions of homology corresponding to the first 100 bp and the last 100 bp of the wbaP gene were cloned into a pUC- origin plasmid with a chloramphenicol-resistance cassette flanked by FRT sites in between them. Constructed plasmid was sequence confirmed and subsequently amplification of the deletion construct was performed using ΔwbaP set 1 forward primer and ΔwbaP set 3 reverse primer (Table S1). This amplicon was transformed into the PEc strain induced for lambda recombineering88 and plated on LB-chloramphenicol.
Colonies appearing from this transformation which appeared translucent were inoculated into LB-chloramphenicol media and incubated overnight at 40°C to cure the lambda recombineering plasmid. The following day, glycerol stocks of the deletion were made and a portion of the culture was also plated on ampicillin to ensure removal of the pKD46 plasmid.
The chloramphenicol resistance cassette was subsequently removed using aprotocol88 with the plasmid pCP20 targeted recombination at the FRT sites.
wbaP complementation
wbaP complement primers listed in Table S1 were used to create 1) a plasmid bearing pUC origin; 2) the arabinose-inducible promoter construct from pKD46, and 3) the full wbaP gene from PEc forming the plasmid pKD-wbaP. wbaP expression was induced using 50 mM L-arabinose.
Intestinal epithelial cell invasion assay
Colorectal adenocarcinoma cell line HT-29 cells were grown in DMEM (Gibco cat. 11965092) (supplemented with 10% FBS and 1% Antibiotic-Antimycotic Gibco cat. 15240062) for 72 hours at 37°C until confluent. After washing once with pre-warmed 1X PBS, E. coli (1×10⁵ or 1×10⁶ CFU) were inoculated in fresh, pre-warmed DMEM media (supplemented with 10% FBS and further supplemented with chloramphenicol 25 μg/mL for plasmid-carrying cells and 50 mM arabinose for complemented strain) and added to 1×10⁵ HT-29 cells. After 4 hours of incubation at 37° C, the media was removed, and the cells were washed with ice cold PBS x 3. Pre-warmed DMEM supplemented with 100 μg/mL of gentamicin was then added to the HT-29 cells for 2 hours to kill any extracellular bacteria. HT-29 cells were then washed with ice cold PBS x 3 (washes were saved and plated). The cells were then lysed with 0.25% Trypsin-EDTA (Gibco 25200056) +0.5% Triton X 100 and the lysate was plated to enumerate the number of internalized bacteria.
Colonocyte intracellular cefepime concentration assay
HT-29 cells were seeded in 6 well plates with 7.5 × 10⁵ cells per well and grown in DMEM media supplemented with 10% FBS. After 24 hours, the media was replaced with fresh media including 0.1, 1 and 5 μg/mL of cefepime, respectively. After 0.5, 2, 6 and 24 hours of incubation with compounds, cells were harvested using trypsin and washed in PBS. All the steps were carried out under ice cold conditions. Then each sample was diluted in PBS to achieve a final concentration of 1.5 × 10⁶ cells/mL. In parallel, untreated HT-19 cells were prepared with PBS to yield 1.5 × 10⁶ cells/mL (10 mL). All samples were snap-frozen in 15 mL conical tubes with liquid nitrogen and stored at −80°C for cefepime quantification by LC-MS/MS as described above. Total cefepime amounts were determined by multiplying the lysate concentration by the total lysate volume. The total number of cells contained in that lysate volume was then multiplied by the volume of an individual HT29 cell determined using a Scepter™ Handheld Automated Cell Counter (Millipore, Burlington, MA). Intracellular cefepime concentrations were then calculated by dividing the total lysate cefepime by the intracellular volume of cells in the lysate.
QUANTIFICATION AND STATISTICAL ANALYSIS
GraphPad Prism v.9.2 was used for statistical analysis. All data sets were tested for normality (e.g. Shapiro-Wilk). Data sets with normal distribution were analyzed with parametric tests, such as standard student t-test or one-way ANOVA with Bonferroni post-test. For non-normal distributions, non-parametric tests, such as Mann Whitney U test or Kruskal Wallis with Dunn’s post-test, were applied.
We performed principal coordinate analysis (PCoA) for cefepime treated and untreated groups using Bray-Curtis dissimilarity. The Bray-Curtis dissimilarity matrix was calculated based on log-transformed data from day 0 to day 7 together using R function “vegan::vegdist()”. The PCoA was performed using R function “ape::pcoa()” and negative eigenvalues were corrected using Cailliez method. The results were visualized using the R package “ggplot2”.
Supplementary Material
Key resources table.
| REAGENT or RESOURCE | SOURCE | IDENTIFIER |
|---|---|---|
| Antibodies | ||
| Bacterial and virus strains | ||
| Parental E. coli strain | This paper. E. coli strain isolated from feces of a pediatric stem cell transplant patient prior to the receipt of chemotherapy and antibiotics. | PEc |
| Parental barcoded E. coli strain | This paper | PbEc |
| IM6 E. coli strain | This paper | IM6 |
| Biological samples | ||
| pKD-PC | ||
| pUC | ||
| pUC-BC | This paper | pUC-BC |
| T4 DNA Ligase | NEB | Cat# M2200L |
| NEB-10-Beta competent cells | NEB | Cat# C3020K |
| Chemicals, peptides, and recombinant proteins | ||
| Cefepime HCl | APOTEX | NDC# 60505-6146-0 |
| Ceftazidime | WG Critical Care | Cat# ABL4721 |
| Chloramphenicol | Sigma Aldrich | Cat# C0378-25G |
| Arabinose | Sigma Aldrich | Cat# A3256-100G |
| Amikacin | Heritage | Cat# 510006908IN04 |
| Ampicillin | WG Critical Care | Cat# LBL1578204 |
| Kanamycin | Amresco | Cat# 0408-100G |
| 4-chloro-phenylalanine | Alfa Aesar | Cat# A13323 |
| SsoAdvancedSYBR Green Supermix | BioRad | Cat #1725274 |
| NEBuilder HiFi DNA Assembly mastermix | New England Biolabs | Cat# E2621L |
| Q5 High-fidelity Mastermix | New England Biolabs | Cat# M0492L |
| Gentamicin sulfate | VWR | Cat# 97061-370 |
| Agilent C18 XDB column | Agilent | |
| Triton X-100 | Fisher | Cat# BP151-100 |
| Critical commercial assays | ||
| DNeasy Blood and tissue kit | Qiagen | Cat# 69504 |
| MagAttract Power Microbiome DNA/RNA KF kit | Qiagen | Cat# 27600-4-KF |
| Nextera XT DNA Library Preparation Kit | Illumina | Cat# FC-131-1096 |
| Pro-Q™ Emerald 300 Lipopolysaccharide Gel Stain Kit | ThermoFisher | Cat# P20495 |
| PCR purification and gel extraction Macherey-Nagel Kit | Macherey-Nagel | Cat# 740609 |
| Plasmid purification Macherey-Nagel Kit | Macherey-Nagel | Cat# 740588 |
| Qiagen Plasmid Midi Kit | Qiagen | Cat# 12123 |
| Deposited data | ||
| E. coli isolate whole genome sequencing and E. coli barcoding sequencing data | This paper | NCBI BioProject with accession number PRJNA930439 |
| Experimental models: Cell lines | ||
| HT-29 | ATCC | HTB-38 |
| Experimental models: Organisms/strains | ||
| Conventional C57BL/6J mice | Jackson Laboratories | strain number 000664 |
| Germ-free C57BL/6 mice | This paper. | N/A |
| Oligonucleotides | ||
| See Table S1 for primers | This paper | N/A |
| Recombinant DNA | ||
| Software and algorithms | ||
| GraphPad Prism v.9.2 | Dotmatics | https://www.graphpad.com/ |
| CLC Genomics Workbench | Qiagen | https://digitalinsights.qiagen.com/products-overview/discovery-insights-portfolio/analysis-and-visualization/qiagen-clc-genomics-workbench/ |
| MUMmer 4 | Kurtz et. al.82 | https://mummer4.github.io/ |
| ape | Paradis et. al.83 | https://cran.r-project.org/web/packages/ape/index.html |
| ggtree | Yu84 | https://bioconductor.org/packages/release/bioc/html/ggtree.html |
| cutadapt | Martin85 | https://pypi.org/project/cutadapt/ |
| Bowtie2 | Langmead and Salzberg86 | https://github.com/BenLangmead/bowtie2 |
| Snippy | Torsten Seemann | https://github.com/tseemann/snippy |
| Pilon | Walker et. al. 87 | https://github.com/broadinstitute/pilon |
| Alzet model 2001D mini-osmotic pumps (iPrecio pumps) | iPRECIO Micro Infusion Pump System | SMP-310R |
| IKA T25 Ultra Turrax Basic Homogenizer | IKA Works | |
| Illumina HiSeq 2000 | Illumina | SeqCenter, Inc. |
| TissueLyser II | Qiagen | TissueLyser II |
Highlights.
A murine model that allows for closer emulation of antibiotic pharmacokinetics in humans
E. coli isolates are only recovered from intestinal tissue of mice treated with cefepime
Some E. coli acquire mutations increasing invasion and survival within intestinal cells
Select E. coli mutants exhibit a persister phenotype when further exposed to cefepime
ACKNOWLEDGMENTS
Funding: this work is supported by NIH grant K24 AI123163 (A.Y.K.) and the University of Texas Southwestern Medical Center and Children’s Health Cellular and Immuno Therapeutics Program (A.Y.K.). E.T. is supported by UTSW Endowed Scholars Program, Human Frontiers Science Program Research grant RGP0042/2013, NIH grant R01GM125748, DOD PR172118, and Welch Foundation I-2082–20210327. L.V.H. is supported by NIH grant R01 DK070855, Welch Foundation grant I-1874, and the Howard Hughes Medical Institute. We acknowledge the resources and expertise provided by the institutionally supported UTSW Preclinical Pharmacology Core for drug level measurements. We thank David E. Greenberg, MD, for his advice.
Footnotes
DECLARATION OF INTERESTS
A.Y.K. is a consultant for Prolacta Biosciences. A.Y.K. received research funding from Novartis. A.Y.K. is a co-founder of Aumenta Biosciences.
SUPPLEMENTAL INFORMATION
Supplemental information can be found online at https://doi.org/10.1016/j.chom.2024.01.012.
REFERENCES
- 1.O’Neill J (2016). Jim O’Neill. Nature Reviews Drug Discovery 15, 526. [DOI] [PubMed] [Google Scholar]
- 2.Hutchings MI, Truman AW, and Wilkinson B (2019). Antibiotics: past, present and future. Curr. Opin. Microbiol. 51, 72–80. [DOI] [PubMed] [Google Scholar]
- 3.Davies J, and Davies D (2010). Origins and evolution of antibiotic resistance. Microbiol. Mol. Biol. Rev. 74, 417–433. [DOI] [PMC free article] [PubMed] [Google Scholar]
- 4.Centers for Disease Control (2019). Antibiotic Resistance Threats in the United States. [Google Scholar]
- 5.Spellberg B, Hansen GR, Kar A, Cordova CD, Price LB, and Johnson JR (2016). Antibiotic resistance in humans and animals. NAM perspectives. Discussion Paper (National Academy of Medicine; ). [Google Scholar]
- 6.Davis GS, and Price LB (2016). Recent research examining links among Klebsiella pneumoniae from food, food animals, and human extraintestinal infections. Curr. Environ. Health Rep. 3, 128–135. [DOI] [PubMed] [Google Scholar]
- 7.Levy SB, FitzGerald GB, and Macone AB (1976). Changes in intestinal flora of farm personnel after introduction of a tetracycline-supplemented feed on a farm. N. Engl. J. Med. 295, 583–588. [DOI] [PubMed] [Google Scholar]
- 8.Marshall BM, and Levy SB (2011). Food animals and antimicrobials: impacts on human health. Clin. Microbiol. Rev. 24, 718–733. [DOI] [PMC free article] [PubMed] [Google Scholar]
- 9.Robinson TP, Wertheim HF, Kakkar M, Kariuki S, Bu D, and Price LB (2016). Animal production and antimicrobial resistance in the clinic. Lancet 387, e1–e3. [DOI] [PubMed] [Google Scholar]
- 10.Liu L, Chen X, Skogerbø G, Zhang P, Chen R, He S, and Huang DW (2012). The human microbiome: a hot spot of microbial horizontal gene transfer. Genomics 100, 265–270. [DOI] [PubMed] [Google Scholar]
- 11.Penders J, Stobberingh EE, Savelkoul PH, and Wolffs PF (2013). The human microbiome as a reservoir of antimicrobial resistance. Front. Microbiol. 4, 87. [DOI] [PMC free article] [PubMed] [Google Scholar]
- 12.Nordstrom L, Liu CM, and Price LB (2013). Foodborne urinary tract infections: a new paradigm for antimicrobial-resistant foodborne illness. Front. Microbiol. 4, 29. [DOI] [PMC free article] [PubMed] [Google Scholar]
- 13.Simms-Waldrip TR, Sunkersett G, Coughlin LA, Savani MR, Arana C, Kim J, Kim M, Zhan X, Greenberg DE, Xie Y, et al. (2017). Antibiotic-induced depletion of anti-inflammatory Clostridia is associated with the development of graft-versus-host disease in pediatric stem cell transplantation patients. Biol. Blood Marrow Transplant. 23, 820–829. [DOI] [PubMed] [Google Scholar]
- 14.Shono Y, Docampo MD, Peled JU, Perobelli SM, Velardi E, Tsai JJ, Slingerland AE, Smith OM, Young LF, Gupta J, et al. (2016). Increased GVHD-related mortality with broad-spectrum antibiotic use after allogeneic hematopoietic stem cell transplantation in human patients and mice. Sci. Transl. Med. 8, 339ra71. [DOI] [PMC free article] [PubMed] [Google Scholar]
- 15.Bilinski J, Robak K, Peric Z, Marchel H, Karakulska-Prystupiuk E, Halaburda K, Rusicka P, Swoboda-Kopec E, Wroblewska M, Wiktor-Jedrzejczak W, and Basak GW (2016). Impact of Gut Colonization by Antibiotic-Resistant Bacteria on the Outcomes of Allogeneic Hematopoietic Stem Cell Transplantation: A Retrospective, Single-Center Study. Biology Blood Marrow Transp. 22, 1087–1093. [DOI] [PubMed] [Google Scholar]
- 16.Andes D, and Craig WA (2002). Animal model pharmacokinetics and pharmacodynamics: a critical review. Int. J. Antimicrob. Agents 19, 261–268. [DOI] [PubMed] [Google Scholar]
- 17.Gerber AU, Brugger H-P, Feller C, and Stritzko T (2022). Antibiotic therapy of infections due to Pseudomonas aeruginosa in normal and granulocytopenic mice: comparison of murine and human pharmacokinetics. J. Infect. Dis. 153, 90–97. [DOI] [PubMed] [Google Scholar]
- 18.Vogelman B, Gudmundsson S, Leggett J, Turnidge J, Ebert S, and Craig WA (1988). Correlation of antimicrobial pharmacokinetic parameters with therapeutic efficacy in an animal model. J. Infect. Dis. 158, 831–847. [DOI] [PubMed] [Google Scholar]
- 19.Levin-Reisman I, Ronin I, Gefen O, Braniss I, Shoresh N, and Balaban NQ (2017). Antibiotic tolerance facilitates the evolution of resistance. Science 355, 826–830. [DOI] [PubMed] [Google Scholar]
- 20.Lehrnbecher T, Fisher BT, Phillips B, Alexander S, Ammann RA, Beauchemin M, Carlesse F, Castagnola E, Davis BL, Dupuis LL, et al. (2020). Guideline for antibacterial prophylaxis administration in pediatric cancer and hematopoietic stem cell transplantation. Clin. Infect. Dis. 71, 226–236. [DOI] [PMC free article] [PubMed] [Google Scholar]
- 21.Taplitz RA, Kennedy EB, Bow EJ, Crews J, Gleason C, Hawley DK, Langston AA, Nastoupil LJ, Rajotte M, Rolston KV, et al. (2018). Antimicrobial prophylaxis for adult patients with cancer-related immunosuppression: ASCO and IDSA clinical practice guideline update. J. Clin. Oncol. 36, 3043–3054. [DOI] [PubMed] [Google Scholar]
- 22.Berg RD (1999). Bacterial translocation from the gastrointestinal tract. Adv. Exp. Med. Biol. 473, 11–30. [DOI] [PubMed] [Google Scholar]
- 23.Tamburini FB, Andermann TM, Tkachenko E, Senchyna F, Banaei N, and Bhatt AS (2018). Precision identification of diverse bloodstream pathogens in the gut microbiome. Nat. Med. 24, 1809–1814. [DOI] [PMC free article] [PubMed] [Google Scholar]
- 24.Maier L, Pruteanu M, Kuhn M, Zeller G, Telzerow A, Anderson EE, Brochado AR, Fernandez KC, Dose H, Mori H, et al. (2018). Extensive impact of non-antibiotic drugs on human gut bacteria. Nature 555, 623–628. [DOI] [PMC free article] [PubMed] [Google Scholar]
- 25.Martinez MN, Papich MG, and Drusano GL (2012). Dosing regimen matters: the importance of early intervention and rapid attainment of the pharmacokinetic/pharmacodynamic target. Antimicrob. Agents Chemother. 56, 2795–2805. [DOI] [PMC free article] [PubMed] [Google Scholar]
- 26.Craig AW, and (1990). Interrelationship between pharmacokinetics and pharmacodynamics in determining dosage regimens for broad-spectrum cephalosporins. Diagn. Microbiol. Infect. Dis. 22, 89–96. [DOI] [PubMed] [Google Scholar]
- 27.Barbhaiya RH, Knupp CA, Pfeffer M, Zaccardelli D, Dukes GM, Mattern W, Pittman KA, and Hak LJ (1992). Pharmacokinetics of cefepime in patients undergoing continuous ambulatory peritoneal dialysis. Antimicrob. Agents Chemother. 36, 1387–1391. [DOI] [PMC free article] [PubMed] [Google Scholar]
- 28.Whited L, Grove M, Rose D, Rhodes NJ, Scheetz MH, O’Donnell JN, Neeb J, Thoele K, Jones DR, Lowe C, et al. (2016). Pharmacokinetics of cefepime in patients with cancer and febrile neutropenia in the setting of hematologic malignancies or hematopoeitic cell transplantation. Pharmacotherapy 36, 1003–1010. [DOI] [PubMed] [Google Scholar]
- 29.Beyi AF, Mochel JP, Magnin G, Hawbecker T, Slagel C, Dewell G, Dewell R, Sahin O, Coetzee JF, Zhang Q, and Plummer PJ (2022). Comparisons of plasma and fecal pharmacokinetics of danofloxacin and enrofloxacin in healthy and Mannheimia haemolytica infected calves. Sci. Rep. 12, 5107. [DOI] [PMC free article] [PubMed] [Google Scholar]
- 30.Zhang L, Huang Y, Zhou Y, Buckley T, and Wang HH (2013). Antibiotic administration routes significantly influence the levels of antibiotic resistance in gut microbiota. Antimicrob. Agents Chemother. 57, 3659–3666. [DOI] [PMC free article] [PubMed] [Google Scholar]
- 31.Mikulska M, Del Bono V, Raiola AM, Bruno B, Gualandi F, Occhini D, di Grazia C, Frassoni F, Bacigalupo A, and Viscoli C (2009). Blood stream infections in allogeneic hematopoietic stem cell transplant recipients: reemergence of Gram-negative rods and increasing antibiotic resistance. Biol. Blood Marrow Transplant. 15, 47–53. [DOI] [PubMed] [Google Scholar]
- 32.Oliveira AL, de Souza M, Carvalho-Dias VMH, Ruiz MA, Silla L, Tanaka PY, Simões BP, Trabasso P, Seber A, Lotfi CJ, et al. (2007). Epidemiology of bacteremia and factors associated with multi-drug-resistant gram-negative bacteremia in hematopoietic stem cell transplant recipients. Bone Marrow Transplant. 39, 775–781. [DOI] [PubMed] [Google Scholar]
- 33.Lopez-Medina E, Fan D, Coughlin LA, Ho EX, Lamont IL, Reimmann C, Hooper LV, and Koh AY (2015). Candida albicans inhibits Pseudomonas aeruginosa virulence through suppression of pyochelin and pyoverdine biosynthesis. PLoS Pathog. 11, e1005129. [DOI] [PMC free article] [PubMed] [Google Scholar]
- 34.Kaper JB, Nataro JP, and Mobley HLT (2004). Pathogenic Escherichia coli. Nat. Rev. Microbiol. 2, 123–140. [DOI] [PubMed] [Google Scholar]
- 35.Ohsugi T, Kiuchi Y, Shimoda K, Oguri S, and Maejima K (1996). Translocation of bacteria from the gastrointestinal tract in immunodeficient mice. Lab. Anim. 30, 46–50. [DOI] [PubMed] [Google Scholar]
- 36.Baym M, Lieberman TD, Kelsic ED, Chait R, Gross R, Yelin I, and Kishony R (2016). Spatiotemporal microbial evolution on antibiotic landscapes. Science 353, 1147–1151. [DOI] [PMC free article] [PubMed] [Google Scholar]
- 37.Comas I, Borrell S, Roetzer A, Rose G, Malla B, Kato-Maeda M, Galagan J, Niemann S, and Gagneux S (2011). Whole-genome sequencing of rifampicin-resistant Mycobacterium tuberculosis strains identifies compensatory mutations in RNA polymerase genes. Nat. Genet. 44, 106–110. [DOI] [PMC free article] [PubMed] [Google Scholar]
- 38.Hegreness M, Shoresh N, Damian D, Hartl D, and Kishony R (2008). Accelerated evolution of resistance in multidrug environments. Proc. Natl. Acad. Sci. USA 105, 13977–13981. [DOI] [PMC free article] [PubMed] [Google Scholar]
- 39.Michel JB, Yeh PJ, Chait R, Moellering RC, and Kishony R (2008). Drug interactions modulate the potential for evolution of resistance. Proc. Natl. Acad. Sci. USA 105, 14918–14923. [DOI] [PMC free article] [PubMed] [Google Scholar]
- 40.Toprak E, Veres A, Michel JB, Chait R, Hartl DL, and Kishony R (2011). Evolutionary paths to antibiotic resistance under dynamically sustained drug selection. Nat. Genet. 44, 101–105. [DOI] [PMC free article] [PubMed] [Google Scholar]
- 41.Zhang Q, Lambert G, Liao D, Kim H, Robin K, Tung CK, Pourmand N, and Austin RH (2011). Acceleration of emergence of bacterial antibiotic resistance in connected microenvironments. Science 333, 1764–1767. [DOI] [PubMed] [Google Scholar]
- 42.Jung B, and Hoilat GJ (2022). MacConkey medium. StatPearls (StatPearls Publishing). [PubMed] [Google Scholar]
- 43.Geldreich EE, Clark HF, Huh CB, and Best LC (1965). Fecal-coliform-organism medium for the membrane filter technique. J. Am. Water Works Assoc. 57, 208–214. [Google Scholar]
- 44.Blattner FR, Plunkett G 3rd, Bloch CA, Perna NT, Burland V, Riley M, Collado-Vides J, Glasner JD, Rode CK, Mayhew GF, et al. (1997). The complete genome sequence of Escherichia coli K-12. Science 277, 1453–1462. [DOI] [PubMed] [Google Scholar]
- 45.Mohseni M, Djawadi B, and Khazaei N (2022). Escherichia coli O157:H7 and Its Effect on Human Health. In Escherichia coli [Working Title] (IntechOpen; ). [Google Scholar]
- 46.Aziz RK, Bartels D, Best AA, Dejongh M, Disz T, Edwards RA, Formsma K, Gerdes S, Glass EM, Kubal M, et al. (2008). The RAST server: rapid annotations using subsystems technology. BMC Genomics 9, 75. [DOI] [PMC free article] [PubMed] [Google Scholar]
- 47.Wagner EA, and Monfort WF (1921). Lactose broth for isolating bacterium coli from water. Am. J. Public Health (N Y) 11, 203–208. [DOI] [PMC free article] [PubMed] [Google Scholar]
- 48.Park SC, and Krug J (2007). Clonal interference in large populations. Proc. Natl. Acad. Sci. USA 104, 18135–18140. [DOI] [PMC free article] [PubMed] [Google Scholar]
- 49.Whitfield C (2006). Biosynthesis and assembly of capsular polysaccharides in Escherichia coli. Annu. Rev. Biochem. 75, 39–68. [DOI] [PubMed] [Google Scholar]
- 50.Ernst CM, Braxton JR, Rodriguez-Osorio CA, Zagieboylo AP, Li L, Pironti A, Manson AL, Nair AV, Benson M, Cummins K, et al. (2020). Adaptive evolution of virulence and persistence in carbapenem-resistant Klebsiella pneumoniae. Nat. Med. 26, 705–711. [DOI] [PMC free article] [PubMed] [Google Scholar]
- 51.Wang L, Liu D, and Reeves PR (1996). C-terminal half of Salmonella enterica WbaP (RfbP) is the galactosyl-1-phosphate transferase domain catalyzing the first step of O-antigen synthesis. J. Bacteriol. 178, 2598–2604. [DOI] [PMC free article] [PubMed] [Google Scholar]
- 52.Shoji M, Yukitake H, Sato K, Shibata Y, Naito M, Aduse-Opoku J, Abiko Y, Curtis MA, and Nakayama K (2013). Identification of an O-antigen chain length regulator, WzzP, in Porphyromonas gingivalis. MicrobiologyOpen 2, 383–401. [DOI] [PMC free article] [PubMed] [Google Scholar]
- 53.Song L, Yang X, Huang J, Zhu X, Han G, Wan Y, Xu Y, Luan G, and Jia X (2021). Phage Selective Pressure Reduces Virulence of Hypervirulent Klebsiella pneumoniae through Mutation of the wzc Gene. Front. Microbiol. 12, 739319. [DOI] [PMC free article] [PubMed] [Google Scholar]
- 54.Campos MA, Vargas MA, Regueiro VN, Llompart CM, Albertí SN, and Bengoechea JA (2004). Capsule polysaccharide mediates bacterial resistance to antimicrobial peptides. Infect. Immun. 72, 7107–7114. [DOI] [PMC free article] [PubMed] [Google Scholar]
- 55.Jones A, Geö Rg M, Maudsdotter L, and Jonsson AB (2009). Endotoxin, capsule, and bacterial attachment contribute to Neisseria meningitidis resistance to the human antimicrobial peptide LL-37. J. Bacteriol. 191, 3861–3868. [DOI] [PMC free article] [PubMed] [Google Scholar]
- 56.Geisinger E, and Isberg RR (2015). Antibiotic modulation of capsular exopolysaccharide and virulence in Acinetobacter baumannii. PLoS Pathog. 11, e1004691. [DOI] [PMC free article] [PubMed] [Google Scholar]
- 57.Whitfield C (2009). Structure and assembly of Escherichia coli capsules. EcoSal Plus 3. [DOI] [PubMed] [Google Scholar]
- 58.Betriu C, Gomez M, Sanchez A, Cruceyra A, Romero J, and Picazo JJ (1994). Antibiotic resistance and penicillin tolerance in clinical isolates of group B streptococci. Antimicrob. Agents Chemother. 38, 2183–2186. [DOI] [PMC free article] [PubMed] [Google Scholar]
- 59.Tuomanen E, Durack DT, and Tomasz A (1986). Antibiotic tolerance among clinical isolates of bacteria. Antimicrob. Agents Chemother. 30, 521–527. [DOI] [PMC free article] [PubMed] [Google Scholar]
- 60.Nguyen TK, Peyrusson F, Dodémont M, Pham NH, Nguyen HA, Tulkens PM, and Van Bambeke F (2020). The persister character of clinical isolates of Staphylococcus aureus contributes to faster evolution to resistance and higher survival in THP-1 monocytes: A study with moxifloxacin. Front. Microbiol. 11, 587364. [DOI] [PMC free article] [PubMed] [Google Scholar]
- 61.Balaban NQ, Helaine S, Lewis K, Ackermann M, Aldridge B, Andersson DI, Brynildsen MP, Bumann D, Camilli A, Collins JJ, et al. (2019). Definitions and guidelines for research on antibiotic persistence. Nat. Rev. Microbiol. 17, 441–448. [DOI] [PMC free article] [PubMed] [Google Scholar]
- 62.Brauner A, Fridman O, Gefen O, and Balaban NQ (2016). Distinguishing between resistance, tolerance and persistence to antibiotic treatment. Nat. Rev. Microbiol. 14, 320–330. [DOI] [PubMed] [Google Scholar]
- 63.Ronneau S, Hill PW, and Helaine S (2021). Antibiotic persistence and tolerance: not just one and the same. Curr. Opin. Microbiol. 64, 76–81. [DOI] [PubMed] [Google Scholar]
- 64.Fridman O, Goldberg A, Ronin I, Shoresh N, and Balaban NQ (2014). Optimization of lag time underlies antibiotic tolerance in evolved bacterial populations. Nature 513, 418–421. [DOI] [PubMed] [Google Scholar]
- 65.Kaszowska M, Majkowska-Skrobek G, Markwitz P, Lood C, Jachymek W, Maciejewska A, Lukasiewicz J, and Drulis-Kawa Z (2021). The Mutation in wbaP cps Gene Cluster Selected by phage-Borne Depolymerase Abolishes Capsule Production and Diminishes the Virulence of Klebsiella pneumoniae. Int. J. Mol. Sci. 22, 11562. [DOI] [PMC free article] [PubMed] [Google Scholar]
- 66.Wang Y, Liu G, Zhang J, Gu D, Hu M, Zhang Y, Pan Z, Geng S, and Jiao X.a. (2021). WbaP is required for swarm motility and intramacrophage multiplication of Salmonella enteritidis spiC mutant by glucose use ability. Microbiol. Res. 245, 126686. [DOI] [PubMed] [Google Scholar]
- 67.Martínez-Maqueda D, Miralles B, and Recio I (2015). HT29 cell line. In The Impact Food Bioactives Health (Springer; ), pp. 113–124. [Google Scholar]
- 68.Buffet A, Rocha EPC, and Rendueles O (2020). Selection for the Bacterial Capsule in the Absence of Biotic and Abiotic Aggressions Depends on Growth Conditions (Cold Spring Harbor Laboratory; ). [Google Scholar]
- 69.Andersson DI, and Hughes D (2014). Microbiological effects of sublethal levels of antibiotics. Nat. Rev. Microbiol. 12, 465–478. [DOI] [PubMed] [Google Scholar]
- 70.Westhoff S, Van Leeuwe TM, Qachach O, Zhang Z, Van Wezel GP, and Rozen DE (2017). The evolution of no-cost resistance at sub-MIC concentrations of streptomycin in Streptomyces coelicolor. ISME J. 11, 1168–1178. [DOI] [PMC free article] [PubMed] [Google Scholar]
- 71.Wistrand-Yuen E, Knopp M, Hjort K, Koskiniemi S, Berg OG, and Andersson DI (2018). Evolution of high-level resistance during low-level antibiotic exposure. Nat. Commun. 9, 1599. [DOI] [PMC free article] [PubMed] [Google Scholar]
- 72.Korea CG, Badouraly R, Prevost MC, Ghigo JM, and Beloin C (2010). Escherichia coli K-12 possesses multiple cryptic but functional chaperone-usher fimbriae with distinct surface specificities. Environ. Microbiol. 12, 1957–1977. [DOI] [PubMed] [Google Scholar]
- 73.Lopatkin AJ, Bening SC, Manson AL, Stokes JM, Kohanski MA, Badran AH, Earl AM, Cheney NJ, Yang JH, and Collins JJ (2021). Clinically relevant mutations in core metabolic genes confer antibiotic resistance. Science 371, eaba0862. [DOI] [PMC free article] [PubMed] [Google Scholar]
- 74.Scott VCS, Haake DA, Churchill BM, Justice SS, and Kim JH (2015). Intracellular bacterial communities: A potential etiology for chronic lower urinary tract symptoms. Urology 86, 425–431. [DOI] [PMC free article] [PubMed] [Google Scholar]
- 75.Flores-Mireles AL, Walker JN, Caparon M, and Hultgren SJ (2015). Urinary tract infections: epidemiology, mechanisms of infection and treatment options. Nat. Rev. Microbiol. 13, 269–284. [DOI] [PMC free article] [PubMed] [Google Scholar]
- 76.Sepkowitz KA (2002). Antibiotic prophylaxis in patients receiving hematopoietic stem cell transplant. Bone Marrow Transplant. 29, 367–371. [DOI] [PubMed] [Google Scholar]
- 77.Ivanov II, Atarashi K, Manel N, Brodie EL, Shima T, Karaoz U, Wei D, Goldfarb KC, Santee CA, Lynch SV, et al. (2009). Induction of intestinal Th17 cells by segmented filamentous bacteria. Cell 139, 485–498. [DOI] [PMC free article] [PubMed] [Google Scholar]
- 78.Kurtz S, Phillippy A, Delcher AL, Smoot M, Shumway M, Antonescu C, and Salzberg SL (2004). Versatile and open software for comparing large genomes. Genome Biol. 5, R12. [DOI] [PMC free article] [PubMed] [Google Scholar]
- 79.Paradis E, and Schliep K (2019). ape 5.0: an environment for modern phylogenetics and evolutionary analyses in R. Bioinformatics 35, 526–528. [DOI] [PubMed] [Google Scholar]
- 80.Yu G (2020). Using ggtree to Visualize Data on Tree-Like Structures. Curr. Protoc. Bioinformatics 69, e96. [DOI] [PubMed] [Google Scholar]
- 81.Martin M (2011). Cutadapt removes adapter sequences from high-throughput sequencing reads. EMBnet.journal 17, 10. [Google Scholar]
- 82.Langmead B, and Salzberg SL (2012). Fast gapped-read alignment with Bowtie 2. Nat. Methods 9, 357–359. [DOI] [PMC free article] [PubMed] [Google Scholar]
- 83.Walker BJ, Abeel T, Shea T, Priest M, Abouelliel A, Sakthikumar S, Cuomo CA, Zeng Q, Wortman J, Young SK, et al. (2014). Pilon: an integrated tool for comprehensive microbial variant detection and genome assembly improvement. PLoS One 9, e112963. [DOI] [PMC free article] [PubMed] [Google Scholar]
- 84.Oliver DM, Bird C, Burd E, and Wyman M (2016). Quantitative PCR profiling of Escherichia coli in livestock feces reveals increased population resilience relative to culturable counts under temperature extremes. Environ. Sci. Technol. 50, 9497–9505. [DOI] [PubMed] [Google Scholar]
- 85.Magoč T, and Salzberg SL (2011). FLASH: fast length adjustment of short reads to improve genome assemblies. Bioinformatics 27, 2957–2963. [DOI] [PMC free article] [PubMed] [Google Scholar]
- 86.Davis MR, and Goldberg JB (2012). Purification and visualization of lipopolysaccharide from Gram-negative bacteria by hot aqueous-phenol extraction. J. Vis. Exp. 3916. [DOI] [PMC free article] [PubMed] [Google Scholar]
- 87.Miyazaki K (2015). Molecular engineering of a PheS counterselection marker for improved operating efficiency in Escherichia coli. BioTechniques 58, 86–88. [DOI] [PubMed] [Google Scholar]
- 88.Datsenko KA, and Wanner BL (2000). One-step inactivation of chromosomal genes in Escherichia coli K-12 using PCR products. Proc. Natl. Acad. Sci. USA 97, 6640–6645. [DOI] [PMC free article] [PubMed] [Google Scholar]
Associated Data
This section collects any data citations, data availability statements, or supplementary materials included in this article.
Supplementary Materials
Data Availability Statement
Raw bacterial whole genome and barcode sequencing data are deposited under the NCBI BioProject with accession number PRJNA930439
In vivo and in vitro data reported in this paper will be shared by the lead contact upon request.
Original code generated for this study is deposited at GitHub at the following repository: https://github.com/marinelle-rodrigues/Rodrigues_2023 and https://github.com/msadikyildiz/rodrigues_2023.
Any additional information required to reanalyze the data reported in this paper is available from the lead contact upon request.