. 2024 Jan 31;12:RP86577. doi: 10.7554/eLife.86577

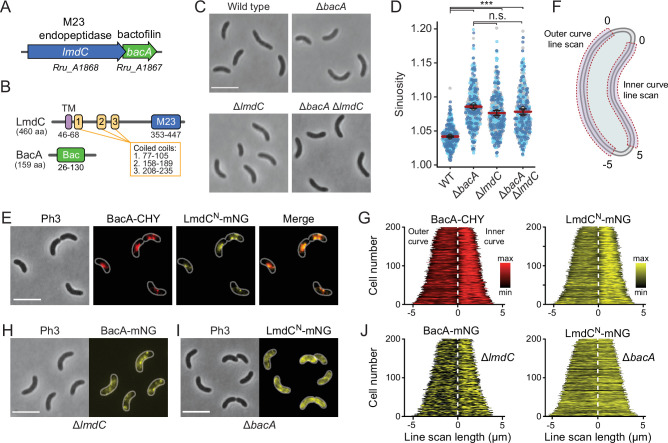
Figure 10. BacA and LmdC contribute to cell morphogenesis in R. rubrum.

(A) Schematic representation of the bacA-lmdC operon in R. rubrum. (B) Domain organization of LmdC and BacA from R. rubrum. LmdCRs consists of a transmembrane helix (TM) followed by a coiled-coil-rich region and a C-terminal M23 peptidase domain (M23). The bactofilin polymerization domain (green box) is flanked by non-structured N- and C-terminal regions. Numbers indicate the first and last amino acid of a domain. (C) Phenotypes of R. rubrum wild-type (S1), ΔbacARs (SP70), ΔlmdCRs (SP68), and ΔbacARs ΔlmdCRs (SP116) cells, imaged using phase-contrast microscopy. Bar: 5 µm. (D) Superplots showing the distribution of cell sinuosities in populations of the indicated R. rubrum strains. Small dots represent the data points, large dots represent the median values of the three independent experiments shown in the graphs (dark blue, light blue, gray). The mean of the three median values is indicated by a horizontal red line. Whiskers represent the standard deviation. ***p<0.005; ns, not significant; unpaired two-sided Welch's t-test. (E) Co-localization of BacARs-CHY and LmdCNRs-mNG in the ΔlmdCRs background (SP119). The Pearson’s Correlation Coefficient (PCC) of the two fluorescence signals in a random subpopulation of cells is 0.916. Scale bar: 5 µm. (F) Schematic showing the approach used to quantify the distribution of proteins along the outer and inner curve of a cell in panels G and J. (G) Demographs showing the enrichment of BacA-CYH and LmdCN-mNG at the inner curve the populations of strain SP119 analyzed in panel E (n=200 cells per strain). The white dashed line represents the point of transition from the outer to the inner curve. (H) Localization of BacARs-mNG in the ΔlmdCRs background (SP98). Bar: 5 µm. (I) Localization of LmdCRs-mNG in the ΔbacARs background (SP118). Bar: 5 µm. (J) Demographs showing the outer-versus-inner curve distribution of BacARs-mNG in the ΔlmdCRs background (SP98; n=200 cells) and LmdCNRs-mNG in the ΔbacARs background (SP118; n=200 cells). The white dashed line represents the point of transition from the outer to the inner curve.

Figure 10.

Figure 10—figure supplement 1. Analysis of the role of BacA and LmdC in R. rubrum morphogenesis.
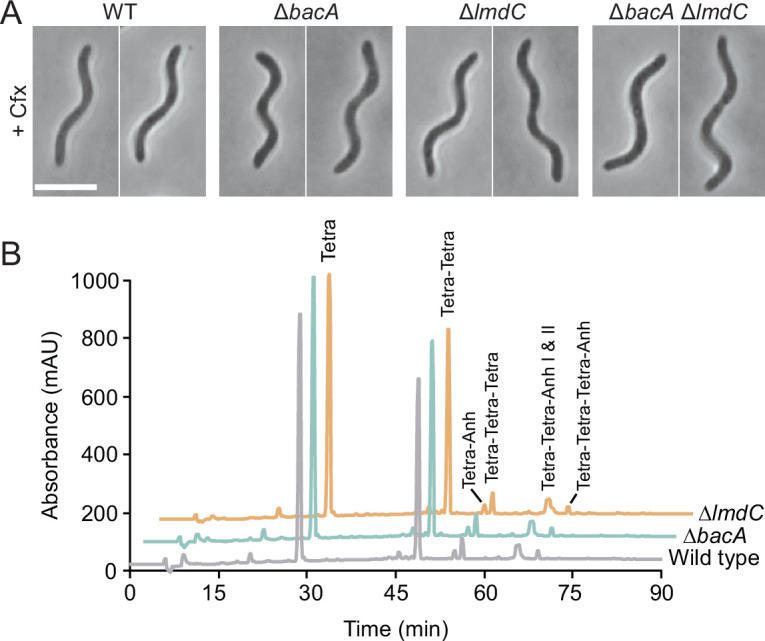
Figure 10—figure supplement 1.

(A) Clearer visualization of the abnormal curvature of BacA- and LmdC-deficient R. rubrum cells by the inhibition of cell division. Cells of strains SP68 (ΔlmdC), SP70 (ΔbacA) and SP116 (ΔlmdC ΔbacA) were treated with 5 μg/ml cefalexin (Cfx) for 6 hr. Bar: 5 µm. (B) Muropeptide profiles of different R. rubrum strains. Cell walls of strains S1 (wild-type), SP70 (ΔbacARs), and SP68 (ΔlmdC) were digested with cellosyl to release muropeptides, which were reduced and separated by HPLC chromatography. The identities of major muropeptide species, assigned based on the previously reported retention times (Glauner, 1988), are given above the corresponding peaks. Tetra stands for N-acetylglucosamine-N-acetylmuramitol tetrapeptide. ‘Anh’ indicates muropeptides containing 1,6-anhydromuramic acid. A quantification of the different muropeptide species is given in Supplementary file 2.
Figure 10—figure supplement 2. Cell lengths of R. rubrum strains.
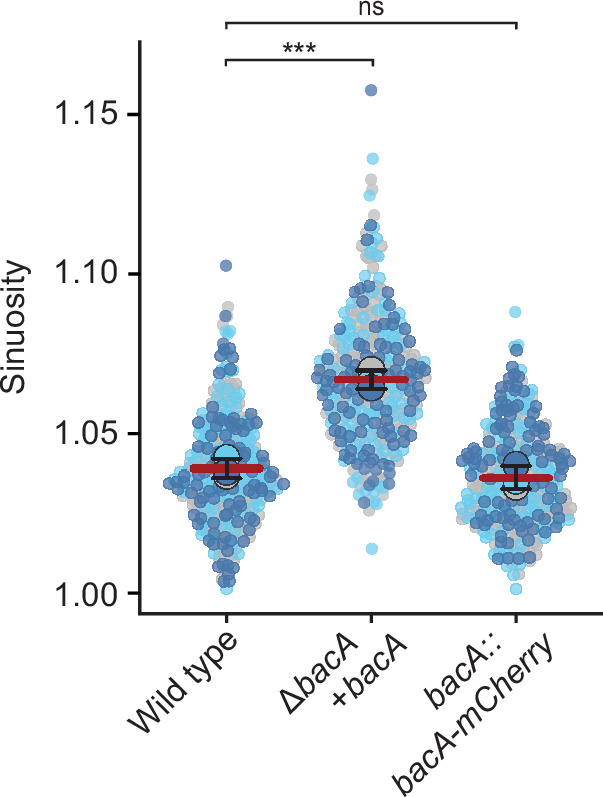
Figure 10—figure supplement 2.

Superplots showing the distribution of cell sinuosities in populations of strains S1 (wild-type), SP105 (∆bacARs PbacA-bacARs), and SP109 (bacARs::bacARs-mCherry). Small dots represent the data points, large dots represent the median values of the three independent experiments shown in the graphs (dark blue, light blue, gray). The mean of the three median values is indicated by a horizontal line. Whiskers represent the standard deviation. ***p<0.005; ns, not significant; unpaired two-sided Welch's t-test.
Figure 10—figure supplement 3. Lysis of E. coli upon heterologous expression of full-length R. rubrum lmdC.
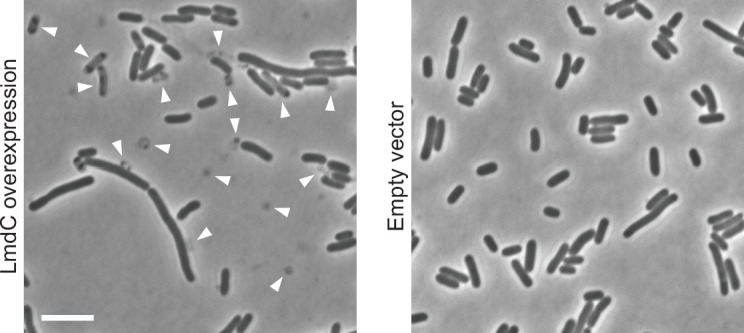
Figure 10—figure supplement 3.

Shown are cells of E. coli Rosetta(DE3)pLysS harboring pSP120 (PT7-lmdCRs) or the corresponding empty vector imaged 4 hr after the induction of gene expression with 0.5 mM isopropyl-β-D-1-thiogalactopyranoside (IPTG). Arrowheads indicate ghost cells, cell debris, lysing cells, or highly elongated cells. Scale bar: 5 µm.
Figure 10—figure supplement 4. Analysis of R. rubrum strains producing fluorescent protein fusions.

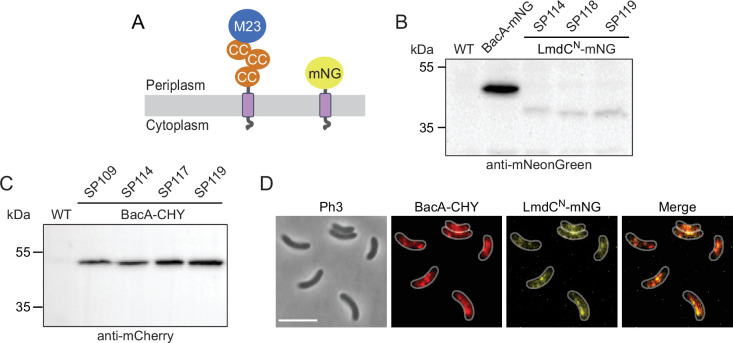
Figure 10—figure supplement 4.

(A) Domain architectures of the native LmdCRs protein and the truncated LmdCNRs-mNG reporter construct used for localization studies. The transmembrane helix is shown in purple. Abbreviations: CC (coiled-coil domain), M23 (M23 peptidase domain), mNG (mNeongreen). (B) Levels of the LmdCNRs-mNG fusion in different R. rubrum strains. Strains SP98 (∆lmdCRs bacARs::bacARs-mNeongreen), SP114 (bacARs::bacARs-mCherry PlmdC-lmdCNRs-mNeongreen), SP118 (∆bacAlmdC PlmdC-lmdC1-80-mNeongreen), and SP119 (bacA::bacA-mCherrylmdC PlmdC-lmdC1-80-mNeongreen) were subjected to immunoblot analysis with an anti-mNeonGreen antibody. Predicted molecular weights: BacARs-mNG (44.8 kDa), LmdCNRs-mNG fusion (35.9 kDa). (C) Levels of the BacARs-CHY fusion protein in different R. rubrum strains. Strains SP109 (bacARs::bacARs-mCherry), SP114 (bacARs::bacARs-mCherry PlmdC-lmdCNRs-mNeongreen), SP117 (bacARs::bacARs-mCherrylmdC), and SP119 (bacARs::bacARs-mCherrylmdC PlmdC-lmdCNRs-mNeongreen) were subjected to immunoblot analysis with an anti-mCherry antibody. The predicted molecular weight of BacARs-CHY is 44.9 kDa. (D) Co-localization of BacARs-CHY and LmdCRs-mNG in R. rubrum cells carrying the native lmdCRs gene. The Pearson’s Correlation Coefficient (PCC) of the two fluorescence signals in a random subpopulation of cells (n=177) is 0.54. Scale bar: 5 µm.
Figure 10—figure supplement 4—source data 1. Raw images for the immunoblot analyses in Figure 10—figure supplement 4B and C.