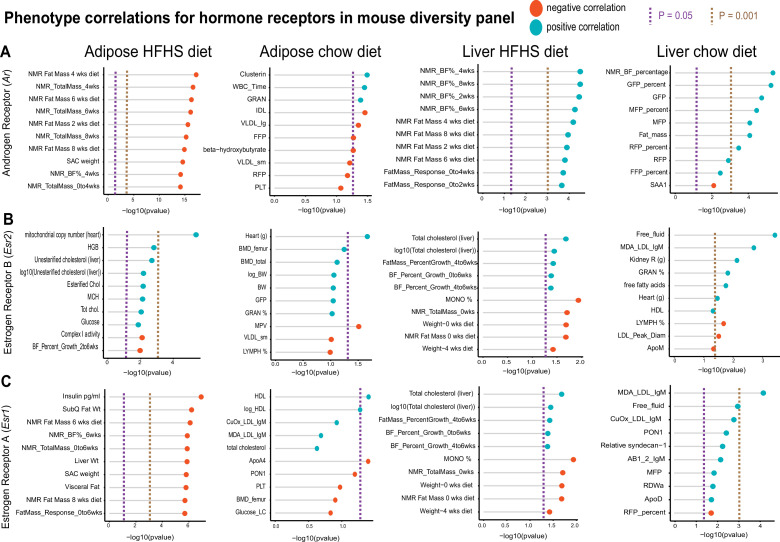
Figure 4. Hybrid mouse diversity panel (HMDP) tissue- and diet-specific correlations of sex hormone receptors.
The top 10 phenotypic traits are shown for correlations with expression of androgen receptor (A), estrogen receptor 1 (B), or estrogen receptor 2 (C), colored by direction in the hybrid mouse diversity panel. Positive correlations are shown in light blue and negative correlations as sunset orange, where phenotypes (y-axis) are ordered by significance (x-axis, -log10(p-value) of correlation). Correlations are segregated by whether sex hormone receptors are expressed by gonadal adipose tissue (left two columns) in ~100 HMDP strains fed a high-fat/high-sucrose (HFHS) diet (left), normal chow diet (left middle), or liver-expressed receptors fed an HFHS diet (right middle) or normal chow diet (right). Dashed lines show a Student’s correlation p-value (from bicor) of p=0.05 (purple) or p=0.001 (beige).

