. 2024 Jan 25;12:RP90523. doi: 10.7554/eLife.90523

Figure 1. Selected images of new split-GAL4 lines.

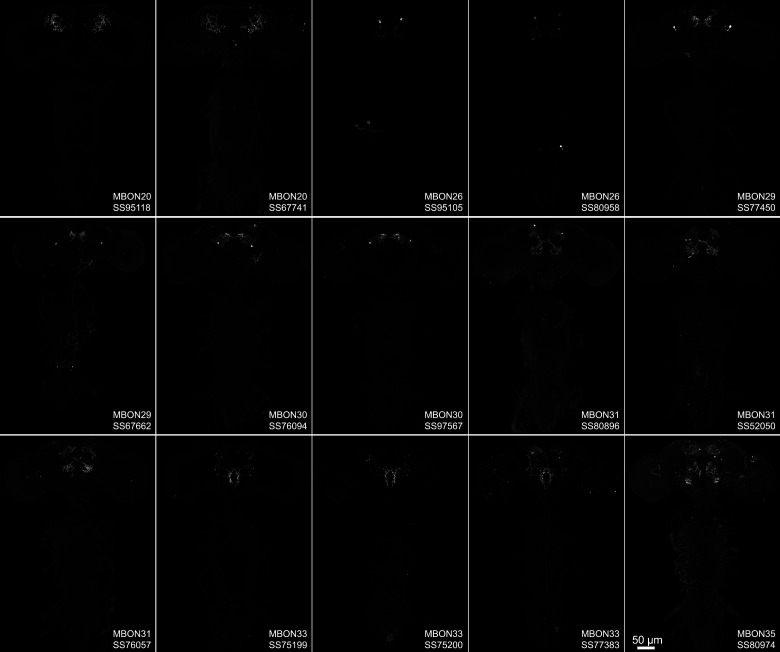
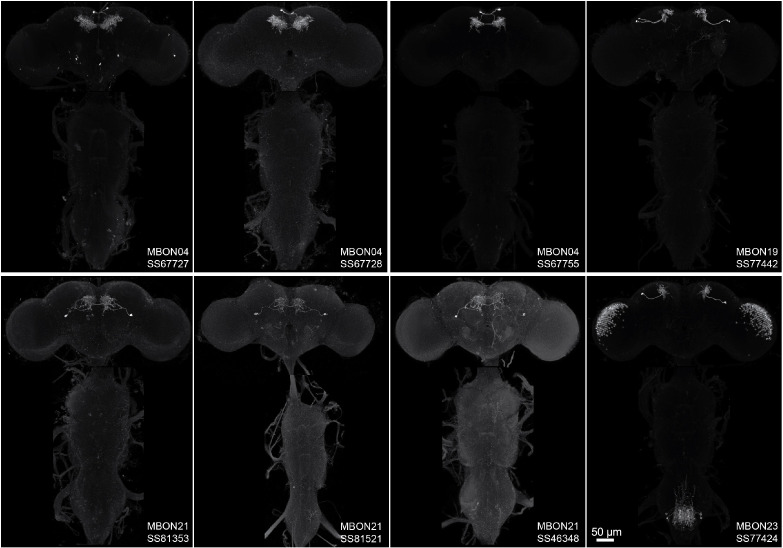
Panels A and C–H show expression (maximum intensity projections) of the indicated split-GAL4 line in the relevant portion of the brain. In panels A–H, the consensus JFRC2018 unisex brain template is also shown (green). Images showing the full brain, optic lobe, and ventral nerve cord of these lines can be found in Figure 1—figure supplement 1 (for E–H) and Figure 1—figure supplement 2 (for A–D). Panels B, I, and J show images derived from stochastic labeling that reveal the morphology of individual cells. The original confocal stacks from which these images were derived are available for download at https://splitgal4.janelia.org/cgi-bin/splitgal4.cgi.

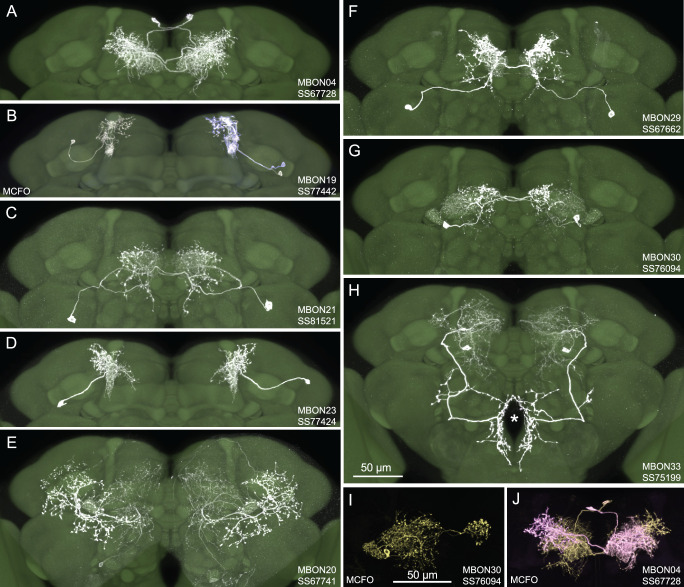
Figure 1.

Figure 1—figure supplement 1. Maximum intensity projections of the brains and ventral nerve cords of split-GAL4 lines for atypical mushroom body output neuron (MBON).

Figure 1—figure supplement 1.

Figure 1—figure supplement 2. Maximum intensity projections of the brains and ventral nerve cords of split-GAL4 lines for typical mushroom body output neuron (MBON).

Figure 1—figure supplement 2.

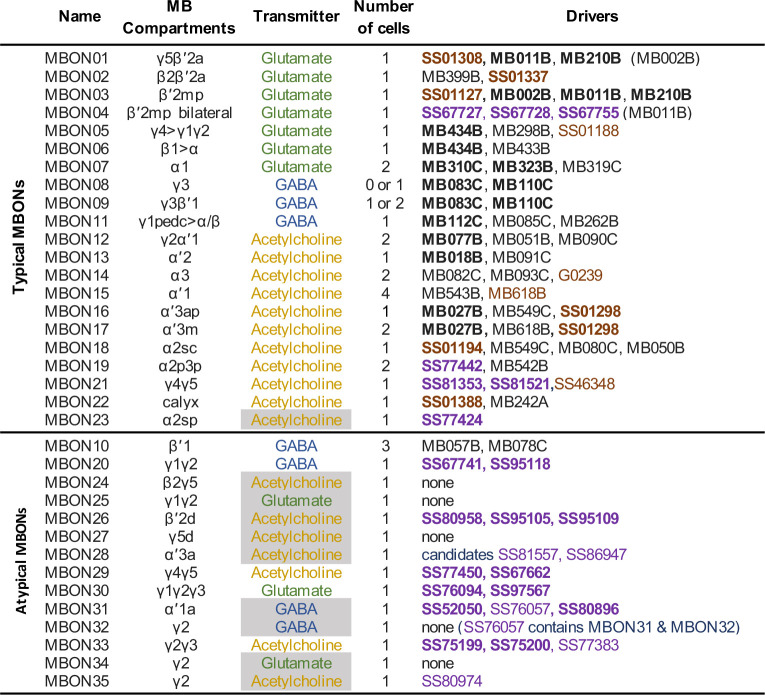
Figure 1—figure supplement 3. Summary list of selected split-GAL4 lines for all mushroom body output neuron (MBON) cell types.

Figure 1—figure supplement 3.

These lines represent what we believe to be the best available split-GAL4 drivers for each cell type. The mushroom body (MB) compartments they innervate and neurotransmitters are shown. The neurotransmitters that are shaded in gray were assigned based solely on computational prediction (Eckstein et al., 2020). Other transmitters have been confirmed by antibody staining (Aso et al., 2014a) or EASI-FISH (Eddison and Ihrke, 2022). The number of cells per hemisphere is shown for each cell type. Available split-GAL4 are listed. Lines listed in boldface are generally of higher quality. Lines whose names are shown in purple font were generated as part of this study. Lines whose names are shown in black font were described in Aso et al., 2014a. Lines from other studies are shown brown font and their sources were as follows: SS01308, Aso et al., 2019; G0239, Chiang et al., 2011; SS46348, Otto et al., 2020; MB618B, SS01127, SS01188, SS01194, SS01298, SS01337, and SS01388, Shuai et al., 2023 release: https://splitgal4.janelia.org.