

Abstract
Diabetes, a disease marked by consistent high blood glucose levels, is associated with various complications such as neuropathy, nephropathy, retinopathy, and cardiovascular disease. Notably, skeletal fragility has emerged as a significant complication in both type 1 (T1D) and type 2 (T2D) diabetic patients. This review examines noninvasive imaging studies that evaluate skeletal outcomes in adults with T1D and T2D, emphasizing distinct skeletal phenotypes linked with each condition and pinpointing gaps in understanding bone health in diabetes. Although traditional DXA-BMD does not fully capture the increased fracture risk in diabetes, recent techniques such as quantitative computed tomography, peripheral quantitative computed tomography, high-resolution quantitative computed tomography, and MRI provide insights into 3D bone density, microstructure, and strength. Notably, existing studies present heterogeneous results possibly due to variations in design, outcome measures, and potential misclassification between T1D and T2D. Thus, the true nature of diabetic skeletal fragility is yet to be fully understood. As T1D and T2D are diverse conditions with heterogeneous subtypes, future research should delve deeper into skeletal fragility by diabetic phenotypes and focus on longitudinal studies in larger, diverse cohorts to elucidate the complex influence of T1D and T2D on bone health and fracture outcomes.
Keywords: diabetes, type 1 diabetes, type 2 diabetes, BMD, QCT, HR-pQCT, DXA, TBS, MRI, skeletal fragility
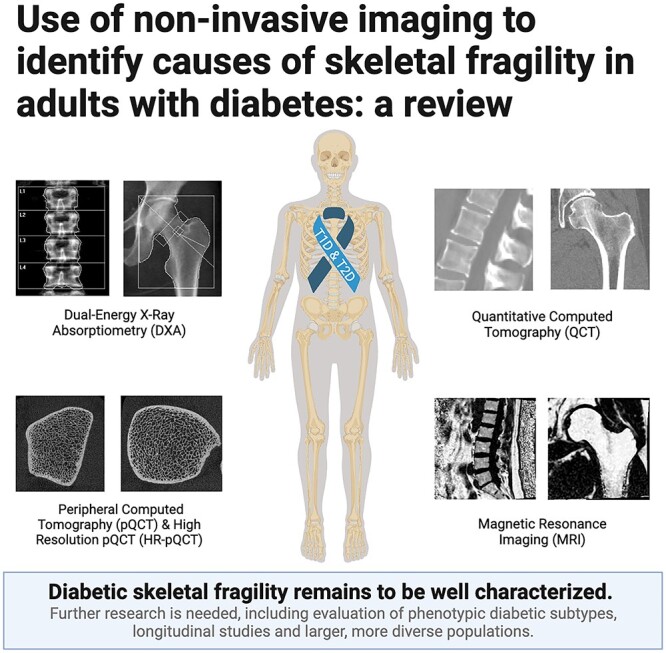
Graphical Abstract
Graphical Abstract.
Introduction
Diabetes is a highly prevalent disease characterized by habitually elevated blood glucose levels. In the USA alone, more than 37 million adults have diabetes, accounting for over 11% of the population.1 The major categories of the disease include type 1 diabetes (T1D, 5%–10% of cases) and type 2 diabetes (T2D, 90%–95% of cases)2 which differ in pathophysiology and clinical manifestation. T1D, typically diagnosed in children or young adults, is an autoimmune condition that leads to the destruction of insulin-producing pancreatic beta cells resulting in little to no insulin production. In contrast, T2D is often diagnosed in adulthood, is strongly associated with obesity and lifestyle factors, and is characterized by insulin resistance.
Both T1D and T2D lead to chronic hyperglycemia if not adequately managed, which can result in complications like neuropathy, nephropathy, retinopathy, and cardiovascular disease. More recently, skeletal fragility has emerged as a common and potentially severe complication of diabetes. This is particularly notable as fracture risk increases with age and nearly 30% of individuals over age 65 have diabetes.3 Both T1D and T2D are associated with an increased risk of fracture.4–13 In meta-analyses, individuals with T1D had a 30%–88% increased risk of fracture at any skeletal site,8–10 with a 3.8- to 8.7-fold increased risk of hip fracture.4–11 and 2.9-fold increased risk of vertebral fracture6 compared to similar-aged controls without diabetes. The increase in fracture risk among individuals with T2D is more moderate compared to those with T1D,4,11 with meta-analyses reporting that individuals with T2D have 20% to 70% increased risk of hip and other nonvertebral fractures compared to nondiabetic controls.4,5,7,9–13 Regardless of diabetic type, there is significant heterogeneity in fracture risk,4–13 suggesting some individuals with diabetes have substantially greater risk of fracture than others, possibly due to the substantial heterogeneity in the pathophysiology and resulting clinical phenotypes within T1D and T2D.14–17 Overall, factors associated with greater duration or severity of diabetic disease herald increased risk of fractures.18,19
The reason for higher fracture risk in those with diabetes is multifactorial, with increased risk of falls and reduced bone strength likely to be key contributors. However, the increased risk of falling, in part due to hypoglycemic events, only partially explains the increased risk of fracture in adults with diabetes.20–27 Importantly, the factors that diminish bone strength and increase skeletal fragility in patients with diabetes have not yet been fully elucidated. Although one possible factor is reduced bone quantity, increased fracture risk in those with T1D is only partially explained by lower areal bone mineral density (aBMD) measurements via DXA.4 Moreover, paradoxically, individuals with T2D have normal to elevated aBMD, yet increased fracture risk.28 As aBMD by DXA underestimates fracture risk in both T1D and T2D,4,29 numerous other skeletal imaging techniques have been utilized to better understand the factors which may negatively impact bone strength, thereby increasing fracture risk, in patients with diabetes. Several important contributors to whole bone strength can be assessed with noninvasive imaging, including bone mass (bone density and BMC), morphology (geometry and shape), and microarchitecture. Noninvasive imaging has also been utilized to quantify bone marrow adiposity, another potential contributor to skeletal fragility.30,31
The aim of this review is to discuss the key findings from studies that have used noninvasive imaging to assess skeletal outcomes in adults with T1D and T2D. Furthermore, we highlight the varying skeletal phenotypes associated with T1D and T2D and identify knowledge gaps regarding bone health in the setting of diabetes. Although antidiabetic medications have been shown to influence the risk of hip fracture,32–34 their effect on fracture risk and bone density is out of the scope of this review.
Impact of diabetes on areal bone mineral density (aBMD), trabecular bone score (TBS), and hip structural analysis (HSA) by DXA
With DXA, a 2D projection of the proximal femur, lumbar spine and/or forearm is used to assess aBMD. Although DXA-derived aBMD is the clinical standard for osteoporosis diagnosis and evaluation of fracture risk, its 2D acquisitions cannot reflect structural aspects of the bone and prohibit independent assessment of cortical and trabecular bone. To compensate for this limitation, additional DXA-based analyses have been developed. Trabecular bone score (TBS), a texture metric of grey-level variations in lumbar spine DXA images, is intended to reflect bone quality via indirect measurement of bone structure. A higher TBS value indicates better bone “structure” and lower risk of fracture.35,36 Another DXA-based method, hip structural analysis (HSA), uses 2D DXA scans to derive measurements of femoral geometry (eg, hip axis length, cross-sectional area, cortical thickness, buckling ratio, cross-sectional moment of inertia, section modulus) by making a few assumptions: constant mineral density, circular cross-sectional shape at the neck and shaft and elliptical shape at the trochanter, and a fixed percentage of cortical bone at different anatomical regions.37 Additionally, 3D modeling methods have been developed to derive the cortex, femoral shape, and trabecular macrostructure from conventional hip DXA scans, called 3D-DXA.38
Areal bone mineral density
Most studies have reported lower aBMD in T1D compared to nondiabetic controls, particularly at the hip, although the magnitude of difference between T1D and nondiabetic controls varies substantially between studies.39–41 This deficit in hip aBMD appears to occur early in the disease42–44 and persists throughout early and middle adulthood.45–48 For example, a meta-analysis showed that femoral neck aBMD is mildly lower (~0.45 standard deviation deficit), whereas lumbar spine aBMD is similar to or slightly lower in T1D compared to controls.41 These moderate aBMD deficits in T1D only partially explain the increased risk of fracture.4 Longitudinal studies in adults with T1D, particularly older adults, are lacking and therefore it is unknown whether individuals with T1D are more prone to accelerated bone loss than those without diabetes.
Diabetic history and complications may influence aBMD in patients with T1D. For example, increased HbA1c is associated with lower aBMD in individuals with T1D at the hip, but not the spine.6,41,49 In older adults with T1D, nephropathy, but not neuropathy or retinopathy, has been associated with lower total hip aBMD.49,50 As data are limited, further studies are needed to better define the association between diabetic complications and aBMD in T1D.
Paradoxically, although T2D is associated with increased fracture risk, numerous studies have showed that individuals with T2D have normal to high aBMD at both lumbar spine and hip (~0.25–0.50 standard deviation higher), perhaps due to increased body weight and/or hyperinsulinemia.4,51 Although aBMD underestimates fracture risk in T2D and those with T2D have higher fracture rate at a given T-score than nondiabetics,29 aBMD does stratify fracture risk among them.29,52 Longitudinal studies have suggested that women with T2D experience greater age-related declines in aBMD, particularly at the hip, which might contribute to their higher risk of fracture.53–55 Meta-analyses in T2D have shown a positive association between BMI and both spine and hip aBMD.4,51 However, in some studies, higher aBMD among T2D remains even after adjustment for BMI,51 suggesting that other mechanisms contribute to increased aBMD, such as insulin resistance and hyperinsulinemia.56,57 Importantly, T2D is known to develop along a continuum starting with prediabetes and insulin resistance and culminating in diabetes, and eventually hypoinsulinemia. Studies suggest that even at the earlier stage of prediabetes, aBMD is already elevated compared to normoglycemic individuals, perhaps due to hyperinsulinemia.58–60 However, over time, worsening insulin resistance has negative effects on bone; the longitudinal Study of Women’s Health Across the Nation found that greater increase in insulin resistance is associated with more rapid BMD decline among nondiabetics.61
As with T1D, diabetes characteristics may influence aBMD in patients with T2D. One meta-analysis found that HbA1c was positively associated with aBMD at the lumbar spine and hip,51 whereas another meta-analysis found no association between aBMD and HbA1c or diabetes duration.4 In the Rotterdam study, individuals with T2D and poor glycemic control (HbA1c ≥ 7.5%) had higher lumbar spine and hip aBMD than individuals with well-controlled diabetes (HbA1c <7.5%).62 In contrast, glycemic control did not influence aBMD in the Health, Aging, and Body Composition Study, though longer duration of diabetes was negatively associated with hip aBMD.63 Similarly, men with T2D duration greater than 5 yr had lower hip aBMD compared to those with shorter T2D duration.64 More studies are needed to understand how the evolution of diabetes, from insulin resistance to T2D with complications, affects BMD.
Trabecular bone score
Despite similar lumbar aBMD between individuals with T1D and non-diabetic controls, some studies report lower TBS in T1D,23,65–67 whereas others show no differences.68,69 Patients with T1D and history of any clinical fracture (excluding ribs, toes and fingers) have lower TBS values than those with T1D and no prior fracture, despite having similar lumbar aBMD.68 When considering diabetic complications, a large study found no association between TBS and HbA1c or presence of nephropathy in patients with T1D.49 However, TBS data in T1D are limited and further studies are needed, particularly with larger sample sizes and in prospective cohorts to determine whether TBS predicts fracture risk in T1D.
Numerous studies have reported lower TBS in individuals with T2D compared to nondiabetic controls (−1.5% to −15.6%).70–81 Notably, TBS is lower among women, but not men, with T2D compared to nondiabetic controls.82–86 A few studies have further reported a negative association between TBS and HbA1c.71,83,87,88 However, these studies are difficult to interpret, as TBS is negatively associated with waist circumference,77,88 abdominal soft tissue thickness,80,89 and visceral fat mass,90 suggesting TBS might be reflecting body composition in those with T2D, rather than deficits in bone structure. Accordingly, additional studies are needed to delineate the extent to which increased abdominal fat contributes to lower TBS values among individuals with T2D. An update to TBS (v4.0)91 has been introduced that minimizes the body composition associations; however few studies of diabetic skeletal fragility have used the newer software version that accounts for soft tissue thickness.
TBS has also been evaluated as a predictor of fracture in T2D. In a Canadian cohort of postmenopausal women with T2D, low TBS values predicted incident major osteoporotic fractures independently of aBMD.70 In addition, reduced TBS is associated with prevalent vertebral fractures in those with T2D,78,92–95 although only one study included men.94 It is unclear to what extent abdominal thickness may modulate the observed relationships between TBS and fracture risk in diabetes, as studies were performed with TBS prior to soft tissue correction. Thus, future prospective studies are required to assess whether TBS v4.0 also predicts fracture in those with T2D, particularly among men.
Hip structural analysis
A few studies have used HSA to assess hip geometry in individuals with T1D. In middle-aged men with T1D, hip strength indices by HSA were similar to healthy age-, weight-, and height-matched controls.96 However, in slightly older men and women, T1D was associated with deficits in hip geometry, including thinner cortices and higher buckling ratios.97 Furthermore, in middle-aged adults with T1D, earlier onset of diabetes was associated with a smaller femoral neck, including smaller cross-sectional area, section modulus, and outer diameters.98 Due to the limited number of studies examining hip structure among T1D, small sample sizes, and lack of information about hip structure in individuals with fracture, it remains unknown whether deficits in hip structure contribute to increased fracture risk in T1D.
Similarly, little is known regarding altered hip structure in individuals with T2D. Pre- and postmenopausal women with T2D have unfavorable hip structure compared to nondiabetics, with lower composite strength, section modulus, cross-sectional moment of inertia and buckling ratio, as well as regionally higher stresses at the femoral neck.78,81,99–102 However, these studies vary in reported outcomes and adjustment for cofounders. One study found no differences in HSA outcomes between men with T2D and nondiabetic controls.103 Another study applied 3D-DXA in a cohort of men and women with T2D but did not identify any impairment in 3D-DXA–derived cortical and trabecular parameters compared to nondiabetic controls.81
Quantitative computed tomography and peripheral quantitative computed tomography
Like DXA, quantitative computed tomography (QCT) enables imaging at numerous anatomical sites relevant to bone fragility assessment, including the proximal femur, lumbar spine, and distal radius. In contrast to DXA, QCT permits 3D evaluation of bone morphology and structure, differentiation between trabecular and cortical bone compartments, and quantification of volumetric BMD (vBMD) if a reference phantom or internal calibration is used. However, QCT is limited in its ability to evaluate bone microstructure, including trabecular bone microarchitecture and cortical porosity. Peripheral quantitative computed tomography (pQCT) is also used to assess bone density and geometry but is limited to a relatively small region within the appendicular skeleton, generally the radius and tibia.104,105
Only a handful of studies have used QCT to assess bone health in individuals with T1D (Table 1).106–108 Specifically, in young adult men with relatively well-controlled T1D (n = 17, age 18–49 yr), CT scans of the hip and spine revealed cortical deficits in the proximal femur, but normal trabecular bone in both the hip and lumbar spine compared to nondiabetic age- and sex- matched controls (n = 18).106,107 In contrast, another study showed that spine DXA-aBMD and vertebral trabecular vBMD were lower among young adult men, but not women, with T1D compared to age- and sex-matched controls.108 Given the limited and conflicting CT-based imaging studies in patients with T1D, additional investigations are needed.
Table 1.
Volumetric bone mineral density at the spine and hip as measured with QCT. Reported as percent differences in means between adults with diabetes and nondiabetic controls.
| First author | Year | Sample size (% diabetic) | % Female | Age (yr) | Spine | Femoral neck | |||
|---|---|---|---|---|---|---|---|---|---|
| Level | Tb.BMD | Tot.BMD | Tb.BMD | Ct.BMD | |||||
| Type 1 Diabetes | |||||||||
| Ishikawa | 2015 | 35 (49%) | 0 | 38 | L2-L4 | −5.1% | −8.8% | −4.2% | |
| Barmpa | 2023 | 212 (56%) | 55 | 30 | L3 | −7.3% | |||
| Barmpa (Women) | 2023 | 117 (56%) | 100 | 31 | L3 | −1.9% | |||
| Barmpa (Men) | 2023 | 95 (56%) | 0 | 29 | L3 | −13.7% | |||
| Type 2 Diabetes | |||||||||
| Strotmeyer | 2004 | 2979 (19%) | 43 | 73 | L3 | 15.1% | |||
| Register (Women) | 2006 | 483 (85%) | 100 | 62 | T12-L3 | 0.1% | |||
| Register (Men) | 2006 | 398 (92%) | 0 | 63 | T12-L3 | −5.3% | |||
| Melton | 2008 | 700 (7%) | 57 | 72 | L1-L3 | 16.3% | 15.6% | 19.5% | 5.4% |
| Baum | 2012 | 26 (50%) | 100 | 59 | L1-L3 | 4.7% | |||
| Patsch (Fx−) | 2013 | 33 (48%) | 100 | 61 | L1-L3 | −6.8% | |||
| Patsch (Fx+) | 2013 | 34 (50%) | 100 | 66 | L1-L3 | 22.0% | |||
| Heilmeier (Fx−) | 2015 | 39 (51%) | 100 | 60 | 8.5% | 14.4% | 4.0% | ||
| Heilmeier (Fx+) | 2015 | 38 (50%) | 100 | 63 | −0.4% | −13.5% | 4.4% | ||
| Wang (Women) | 2022 | 4420 (7%) | 100 | 64 | L1-L2 | −28.2% | |||
| Wang (Men) | 2022 | 5889 (10%) | 0 | 59 | L1-L2 | −4.6% | |||
| Gao (50–65 yr) | 2022 | 163 (54%) | 100 | 59 | L1-L3 | 16.5% | |||
| Gao (>65 yr) | 2022 | 150 (59%) | 100 | 73 | L1-L3 | 46.7% | |||
Proportion of females (%) and mean age are presented for the diabetic group.
Data presented as percent difference between reported unadjusted group means for diabetic vs control, unless otherwise specified.
Abbreviations: Ct, cortical; Tb, trabecular; Tot, total (integral)
Fx−, no fracture; Fx +, fracture
Bold indicates significant difference between those with diabetes and nondiabetic controls (P < .05).
Studies using QCT scans have shown that older adults with T2D have greater vBMD at the femoral neck109,110 and lumbar spine63,109,111 compared to age- and sex-matched nondiabetic controls (Table 1). However, patients with T2D may not benefit from elevated BMD, as they have deficits in femoral neck geometry112 and similar ratio of estimated fall force to bone strength (ie, load-to-strength ratio113) at the hip and spine compared to nondiabetic controls, indicating that improvements in bone strength are offset by higher loads upon falling.109 In contrast, in younger cohorts of adults with T2D (mean age < 65 yr), no differences have been detected in hip or spine vBMD compared to controls,111,114–116 suggesting that age and/or T2D duration may play an important role in diabetes-related differences in BMD. Notably, postmenopausal women with T2D and prior history of fragility fracture have lower femoral neck vBMD compared to non-fracturing patients with T2D, but similar vBMD compared to nondiabetic controls,110 suggesting measures of vBMD by QCT might identify patients with T2D at highest risk of fracture. However, it is also possible that individuals who suffered a fracture subsequently lost bone mass, and therefore evaluation of vBMD in prospective cohorts is needed to elucidate whether QCT will be useful to predict fracture risk in patients with T2D.
Due to its very low radiation dose, pQCT has been frequently used in pediatric diabetic populations, but few studies have been conducted in adults with diabetes. Deficits in pQCT measures have been observed in the tibia of young adult women,117 the radius of middle-aged adults,118 and the radius and tibia postmenopausal women with T1D,119 with lower trabecular vBMD and cortical thickness compared to nondiabetic controls. Importantly, postmenopausal women who were diagnosed with T1D before the age of 20 had greater deficits in pQCT measures compared to those diagnosed later in life, with lower total vBMD (−28%), trabecular vBMD (−30%) and cortical thickness (−15%) at the tibia.119 In older adults with T2D, most studies show greater total and trabecular vBMD (+3–15%) but lower cross-sectional area (−5%) at the distal radius and tibia, and no significant differences in cortical bone, compared to nondiabetics.109,120–123
High-resolution peripheral quantitative computed tomography
An increasing number of studies are using high-resolution peripheral quantitative computed tomography (HR-pQCT) for 3D evaluation of vBMD, geometry, and microstructure at the distal radius and tibia. At a relatively small isotropic voxel size (82 μm and 61 μm for the first- and second-generation scanners, respectively) and low radiation dose (<5 μSv per scan), HR-pQCT allows for assessment of cortical and trabecular bone compartments. A standardized analysis provides measures of total, cortical, and trabecular vBMD, trabecular bone microarchitecture (ie, trabecular number, thickness, and separation), cortical thickness, and cortical porosity.124 In addition, HR-pQCT images can be used to build finite element models to estimate bone strength.124
Like QCT, only a few cross-sectional studies have evaluated trabecular bone microarchitecture and cortical bone microstructure via HR-pQCT in adults with T1D (Table 2). A recent meta-analysis proposed a T1D bone phenotype defined by trabecular deficits at the radius but no differences at the tibia.125 However, few individual studies exhibit this proposed T1D phenotype (Table 2), possibly due to the small number of studies included in the meta-analysis (4), half of which were in adolescents.125 Overall, some studies found that adults with T1D have lower total vBMD,126,127 but no differences in failure load at the radius and similar vBMD and failure load at the tibia126,128 compared to nondiabetic controls. When considering microstructure, most studies suggest that patients with T1D have similar trabecular and cortical bone microstructure at both the radius and tibia compared to nondiabetic controls (Table 2).50,126–128 In contrast to these studies, a large recent cross-sectional study in men and women with T1D129 showed greater total vBMD, cortical vBMD, cortical area, and cortical thickness with lower cortical porosity at the radius compared to nondiabetic controls, potentially due to the relatively small proportion of patients with diabetic complications.
Table 2.
Bone density, microarchitecture, and biomechanical strength at the tibia and radius as measured with HR-pQCT. Reported as percent differences in means between adults with type 1 diabetes (T1D) and nondiabetic controls.
| First author | Year | Sample size (% T1D) | % Female | Age (yr) | Volumetric BMD | Trabecular microarchitecture | Cortical microstructure | Failure load | ||||||
|---|---|---|---|---|---|---|---|---|---|---|---|---|---|---|
| Tot.BMD | Ct.BMD | Tb.BMD | Tb.N | Tb.Th | Tb.Sp | Ct.Ar | Ct.Th | Ct.Po | ||||||
| Radius | ||||||||||||||
| Shanbhogue | 2015 | 110 (50%) | 49 | 46 | −10.7% | −3.1% | −8.2% | −4.0% | −4.2% | 5.7% | −3.3% | −8.0% | 15.9% | −2.1% |
| Vilaca (N−)a | 2021 | 40 (50%) | 40 | 50 | 4.9% | 0.0% | 1.8% | −1.0% | 2.9% | 1.0% | 11.6% | 12.5% | −21.2% | 8.9% |
| Vilaca (N+) | 2021 | 40 (50%) | 40 | 48 | 1.3% | 0.1% | 1.8% | −4.0% | 5.7% | 6.2% | 10.2% | 8.3% | 27.3% | 11.1% |
| Xu | 2021 | 64 (50%) | 0 | 34 | −16.1% | −0.1% | −21.7% | −6.8% | −11.5% | 11.3% | - | −13.4% | −4.8% | - |
| Sewingb | 2022 | 136 (43%) | 41 | 60 | ↑ | ↑ | ↓ | ↑ | ↑ | ↑ | - | ↓ | ↓ | ↓ |
| Rasmussen | 2023 | 269 (41%) | 58 | 53 | 17.0% | 4.2% | 4.6% | 0.0% | −3.0% | 0.0% | 12.0% | 8.6% | −50.0% | 8.7% |
| Tibia | ||||||||||||||
| Shanbhogue | 2015 | 110 (50%) | 49 | 46 | −6.8% | −2.2% | −5.8% | −3.9% | −2.7% | −1.0% | −4.2% | −5.3% | 11.3% | −2.5% |
| Vilaca (N−)a | 2021 | 40 (50%) | 40 | 50 | 5.0% | 1.0% | 9.3% | 8.3% | 0.0% | −9.3% | 3.1% | −0.8% | −17.4% | 5.9% |
| Vilaca (N+) | 2021 | 40 (50%) | 40 | 48 | −2.3% | −5.3% | 5.8% | 8.9% | −2.5% | −17.2% | −3.2% | −6.5% | 28.7% | 4.2% |
| Xu | 2021 | 64 (50%) | 0 | 34 | −12.4% | −2.5% | −10.0% | 3.8% | −7.1% | −1.3% | - | −12.6% | 21.3% | - |
| Sewingb | 2022 | 136 (43%) | 41 | 60 | ↓ | ↓↓ | ↓ | ↓ | ↓ | ↑ | - | ↓↓ | ↓ | ↓↓ |
| Rasmussen | 2023 | 269 (41%) | 58 | 53 | 7.0% | 4.9% | 4.4% | 0.0% | −2.4% | 0.0% | 6.9% | 3.4% | −11.1% | 10.3% |
Proportion of females (%) and mean age are presented for the diabetic group.
Data presented as percent difference between reported unadjusted group means for T1D vs control, unless otherwise specified.
Ct.BMD, Tb.Sp, Ct.Po calculated as percent difference of medians for T1D vs control.
Published data presented as estimates of the difference; percent difference could not be calculated. Arrows indicate direction of estimate. Double arrows indicate significant difference between T1D vs nondiabetic controls.
Abbreviations: Ct, cortical; Ct.Ar, cortical area; Ct.Th, cortical thickness; Ct.Po, cortical porosity; Tb, trabecular; Tb.N, trabecular number; Tb.Sp, trabecular separation; Tb.Th, trabecular thickness; Tot, total (integral)
N−,without neuropathy; N+, with neuropathy
Bold text or double arrows indicate significant difference between those with diabetes and nondiabetic controls (P < .05).
Consideration of clinical factors and comorbidities is critical when examining diabetic bone disease. For patients with T1D, age at diagnosis127 and presence of complications such as microvascular diseases126 and neuropathy50,128 have been shown to affect bone outcomes. For example, the presence of microvascular diseases was associated with significant trabecular bone deficits and lower bone strength at the radius and tibia in older adults with T1D.126 These differences persisted after adjustment (age, BMI, sex, disease duration, glycemic control), suggesting that the presence of microvascular disease may be an independent risk factor for trabecular bone microarchitecture deficits.126 In contrast, recent studies have not shown an association between neuropathy and deficits in trabecular bone, but rather deficits in cortical bone. In adults with T1D, increased cortical porosity128 and diminished cortical vBMD50 were associated with the presence of neuropathy. More studies are needed to better understand bone microarchitecture outcomes in T1D and to establish which clinical factors and comorbidities common in patients with diabetes may influence the observed skeletal heterogeneity.
Numerous studies have used HR-pQCT in individuals with T2D, though findings are heterogeneous. Patients with T2D generally have similar to enhanced total vBMD,129,130 trabecular microarchitecture,129–132 and cortical thickness129,132,133 at both the radius and tibia compared to nondiabetic controls (Table 3). Differences in cortical porosity have been mixed, with some studies showing an increase in porosity,131,134–138 while others have found no difference compared to controls.20,129,133,139,140 A recent meta-analysis sought to synthesize these results in a proposed a T2D skeletal phenotype with improved trabecular bone structure and cortical thickness at the radius and tibia with greater cortical porosity only at the load-bearing tibia.125 As with T1D, it is important to consider clinical factors and comorbidities among those with T2D. After adjustment for weight or BMI, differences in trabecular and cortical bone measures in patients with T2D no longer differed from nondiabetic controls,130,133,139,141 suggesting body composition may play an important role in the T2D skeletal phenotype. Furthermore, increased soft tissue thickness overlying the radius or tibia leads to decreased measures of total and cortical vBMD,142 suggesting that HR-pQCT outcomes must be interpreted carefully when comparing individuals with different body size and BMI. Patients with longer T2D duration, presence of microvascular complications, or higher fasting glucose levels may have higher cortical porosity134,137–139 but more advantageous trabecular microarchitecture compared to nondiabetic controls.133 This suggests that the primary T2D phenotype might be dominated by deficits in cortical bone, but it is not clear whether the cortical bone deficits (often quite small) are driving the skeletal fragility or serving as a biomarker of disease severity and/or duration. Additional investigations, including longitudinal studies, are needed to clarify the connection between clinical factors, altered bone microstructure, and fracture risk in diabetes.
Table 3.
Bone density, microarchitecture, and biomechanical strength at the tibia and radius as measured with HR-pQCT. Reported as percent differences in means between adults with type 2 diabetes (T2D) and nondiabetic controls.
| First author | Year | Sample size (% T2D) | % Female | Age (yr) | Volumetric BMD | Trabecular microarchitecture | Cortical microstructure | Failure load | ||||||||
|---|---|---|---|---|---|---|---|---|---|---|---|---|---|---|---|---|
| Tot.BMD | Ct.BMD | Tb.BMD | Tb.N | Tb.Th | Tb.Sp | Ct.Ar | Ct.Th | Ct.Po | ||||||||
| Radius | ||||||||||||||||
| Burghardt | 2010 | 38 (50%) | 100 | 63 | −2.2% | −3.0% | 3.4% | −0.9% | −4.0% | 0.3% | −0.7% | 123.9% | 2.9% | |||
| Shu | 2011 | 50 (50%) | 100 | 63 | 9.2% | 4.6% | 4.1% | 6.3% | −3.2% | 7.3% | 4.1% | 7.6% | ||||
| Farr | 2014 | 60 (50%) | 100 | 66 | −0.8% | 5.0% | −2.8% | −5.6% | 5.9% | 31.5% | ||||||
| Yu | 2015 | 100 (22%) | 100 | 60 | 5.2% | −2.5% | 2.3% | −3.2% | 0.0% | 9.3% | 2.0% | −2.2% | 26.1% | 0.8% | ||
| Paccou (Women)a | 2016 | 155 (7%) | 100 | 77 | −1.5% | 5.9% | 8.0% | −5.5% | −9.4% | 18.3% | 8.2% | 26.5% | ||||
| Paccou (Men)a | 2016 | 177 (10%) | 0 | 77 | −2.7% | 5.9% | 6.4% | 0.8% | −6.1% | −3.6% | −6.3% | 28.2% | ||||
| Shanbhogue (MVD−) | 2016 | 52 (50%) | 65 | 51 | −3.1% | −2.1% | 3.1% | −1.0% | 4.1% | −0.2% | −0.4% | 1.9% | 11.3% | 7.0% | ||
| Shanbhogue (MVD+) | 2016 | 50 (50%) | 52 | 65 | −3.5% | −1.3% | 11.2% | 11.2% | 2.8% | −8.6% | 0.1% | −9.0% | 31.9% | 4.6% | ||
| Nilsson | 2017 | 1053 (9%) | 100 | 78 | 12.6% | 2.1% | 14.2% | 0.0% | −16.9% | 11.8% | 16.2% | 12.9% | ||||
| Patsch (Women)b | 2017 | 33 (52%) | 100 | 58 | 14.0% | 2.2% | 10.3% | 15.6% | −4.9% | −13.4% | 29.0% | 24.0% | ||||
| Patsch (Men)b | 2017 | 52 (50%) | 0 | 57 | 10.9% | 4.6% | 3.2% | 14.4% | −9.8% | −13.5% | 13.6% | 19.9% | ||||
| de Waard | 2018 | 344 (19%) | 37 | 63 | 1.4% | −1.8% | 1.9% | 1.6% | 0.0% | −2.1% | 2.7% | 16.3% | 3.6% | |||
| Samelson | 2018 | 1069 (12%) | 42 | 66 | 0.1% | −0.3% | 0.0% | −0.5% | 0.8% | 1.7% | −0.5% | 5.4% | −3.0% | |||
| Starr | 2018 | 92 (46) | 100 | 62 | −0.4% | 15.2% | 7.3% | 6.8% | −1.9% | 5.8% | 6.5% | −5.0% | ||||
| Samakkarnthai | 2020 | 279 (61%) | 44 | 69 | −0.5% | −6.0% | 3.6% | 1.8% | 0.0% | 4.7% | 3.1% | −15.0% | 4.7% | |||
| Heilmeier (Fx−) | 2021 | 22 (45%) | 100 | 59 | 1.7% | −1.8% | −9.8% | 1.6% | −12.0% | −0.2% | 8.5% | 10.3% | 38.5% | −0.9% | ||
| Heilmeier (Fx+) | 2021 | 22 (45%) | 100 | 63 | −0.4% | −6.6% | −2.0% | 1.1% | −4.0% | −1.1% | 5.8% | 3.8% | 103.8% | −2.9% | ||
| Vigevano | 2021 | 112 (38%) | 0 | 51 | −3.3% | −0.1% | −5.4% | 0.0% | 5.2% | −3.5% | 0.0% | −5.0% | ||||
| Rasmussen | 2023 | 217 (40%) | 52 | 62 | 25.3% | 3.1% | 20.5% | 11.6% | 1.5% | −15.2% | 22.9% | 13.6% | −25.0% | 21.5% | ||
| Tibia | ||||||||||||||||
| Burghardt | 2010 | 38 (50%) | 100 | 63 | 9.2% | −0.6% | 13.1% | −0.9% | 13.8% | −0.5% | 7.8% | 7.0% | 36.2% | 11.2% | ||
| Shu | 2011 | 50 (50%) | 100 | 63 | −3.2% | 2.9% | −2.9% | 0.0% | −1.4% | 5.4% | 10.5% | −7.7% | ||||
| Farr | 2014 | 60 (50%) | 100 | 66 | 1.6% | −2.0% | 5.1% | −1.0% | 6.6% | −3.8% | ||||||
| Yu | 2015 | 100 (22%) | 100 | 60 | −0.7% | −1.8% | −1.4% | −4.3% | 2.7% | 7.8% | 2.3% | 2.4% | 14.3% | 1.2% | ||
| Paccou (Women)a | 2016 | 155 (7%) | 100 | 77 | −0.5% | 6.2% | −4.3% | 0.0% | 3.5% | 1.1% | −1.0% | 3.1% | ||||
| Paccou (Men)a | 2016 | 177 (10%) | 0 | 77 | −3.4% | 2.2% | 7.0% | −6.8% | −6.3% | 7.4% | 2.7% | 25.3% | ||||
| Shanbhogue (M−) | 2016 | 52 (50%) | 65 | 51 | 2.9% | 0.9% | 2.2% | −3.7% | 6.3% | 7.2% | 4.1% | 2.2% | −9.8% | −2.5% | ||
| Shanbhogue (M+) | 2016 | 50 (50%) | 52 | 65 | 3.2% | −3.2% | 8.7% | −5.1% | 14.1% | 6.7% | 7.2% | 0.8% | 35.6% | 6.3% | ||
| Nilsson | 2017 | 1053 (9%) | 100 | 78 | 11.2% | 1.9% | 10.7% | 0.0% | −13.2% | 12.0% | 5.8% | 7.7% | ||||
| Patsch (Women)b | 2017 | 33 (52%) | 100 | 58 | 18.0% | 3.5% | 8.9% | 24.6% | −12.1% | −19.4% | 30.1% | 25.9% | ||||
| Patsch (Men)b | 2017 | 52 (50%) | 0 | 57 | −1.4% | −1.0% | 2.7% | 25.0% | −18.0% | −20.8% | 0.2% | −2.1% | ||||
| de Waard | 2018 | 344 (19%) | 37 | 63 | 5.5% | 0.4% | 5.4% | 7.2% | −12.5% | −8.7% | 9.7% | 4.8% | 11.1% | |||
| Samelson | 2018 | 1069 (12%) | 42 | 66 | 1.2% | −2.2% | 3.7% | 2.4% | 1.8% | −3.0% | −1.8% | 7.2% | −2.5% | |||
| Starr | 2018 | 92 (46) | 100 | 62 | −3.6% | 9.9% | 3.4% | 0.0% | −3.7% | 1.8% | 0.8% | 10.7% | ||||
| Samakkarnthai | 2020 | 279 (61%) | 44 | 69 | −0.5% | 7.5% | 0.8% | 3.9% | 1.1% | 2.2% | 1.6% | 11.9% | 3.9% | |||
| Heilmeier (Fx−) | 2021 | 22 (45%) | 100 | 59 | 0.1% | 5.9% | −9.0% | −9.7% | −1.0% | 11.5% | 2.1% | 4.4% | −29.2% | −0.6% | ||
| Heilmeier (Fx+) | 2021 | 22 (45%) | 100 | 63 | −9.3% | −3.4% | −11.3% | −4.5% | −9.3% | 11.1% | 9.7% | 1.8% | 17.7% | 3.3% | ||
| Vigevano | 2021 | 112 (38%) | 0 | 51 | −5.8% | 1.1% | −8.0% | 0.0% | 4.8% | −2.6% | 0.0% | −4.8% | ||||
| Rasmussen | 2023 | 217 (40%) | 52 | 62 | 14.3% | 3.4% | 16.0% | 8.7% | −1.5% | −11.6% | 19.4% | 12.1% | 0.0% | 31.4% | ||
Proportion of females and mean age are presented for the diabetic group.
Data presented as percent difference between reported unadjusted group means for T2D vs control, unless otherwise specified.
Calculated as percent difference of medians for T2D vs control.
Data reported on adjusted group means. Authors analyzed only a select number of measures, which are italicized.
Abbreviations: Ct, cortical; Ct.Ar, cortical area; Ct.Th, cortical thickness; Ct.Po, cortical porosity; Tb, trabecular; Tb.N, trabecular number; Tb.Sp, trabecular separation; Tb.Th, trabecular thickness; Tot, total (integral)
Fx−, no fracture; Fx + , fracture; M−, no microvascular disease; M+, microvascular disease
Bold text indicates significant difference between those with diabetes and non-diabetic controls (P < .05).
Bone marrow adiposity from MRI
In contrast to the imaging modalities mentioned previously, MRI enables 3D evaluation of trabecular bone microstructure and bone marrow composition without ionizing radiation. However, MRI does not enable quantification of BMD. To date, a few studies with small sample sizes have used MRI techniques in patients with diabetes. Patients with T1D have similar bone marrow adipose tissue (BMAT) content in the lumbar spine, distal femur, and proximal tibia compared to nondiabetic controls.143–145 Postmenopausal women with T2D also have similar BMAT content at the spine compared to controls.116,146,147 Data in men with T2D are conflicting, with one study showing increased vertebral BMAT content123 and another showing decreased vertebral BMAT content148 compared to nondiabetic controls. Much work remains to be done to evaluate trabecular bone and BMAT using MRI in adults with diabetes.
Conclusion
As patients with diabetes have increased risk of fracture that is not well explained by DXA-BMD, other noninvasive imaging techniques have been implemented to elucidate the diabetic skeletal phenotype, including measures of 3D bone density, microstructure, and strength. Overall, adults with T1D are characterized by mildly lower aBMD at the hip as well as lower total vBMD but similar microarchitecture at the radius and tibia. In contrast, adults with T2D generally have normal to elevated aBMD and vBMD with improved trabecular but deficient cortical bone structure at the radius and tibia.
Studies of bone density and structure in both T1D and T2D are notably heterogeneous in their findings. These conflicting results might in part be due to factors such as differences in study design, outcome assessments, adjustments for potential confounders, and/or possible misclassification of T1D and T2D when using electronic medical records to identify subjects. However, it is also critical to recognize that diabetes is a heterogenous group of hyperglycemic disorders with varying pathophysiology and clinical tendencies.17 For example, a new categorization of phenotypic diabetes subtypes has been proposed based on a combination of clinical phenotypes and pathophysiology, encompassing severe autoimmune diabetes, severe insulin-deficient diabetes, severe insulin-resistant diabetes, mild obesity–related diabetes, and mild age–related diabetes.17 The risk of diabetic complications, such as nephropathy and neuropathy, appears to vary based on these diabetes subtypes.17,149,150 Genotypic information may be able to further aid in categorizing diabetic phenotypes.151 Overall, improved classification into more homogeneous diabetes subtypes offers the potential for more accurate phenotypic characterizations that may portend different types of skeletal fragility.
Our current understanding of diabetic bone disease as evaluated through clinical imaging presents significant knowledge gaps. Predominantly, the existing literature is characterized by cross-sectional studies with relatively small sample sizes, necessitating robust prospective, longitudinal research encompassing larger cohorts of both T1D and T2D populations to elucidate the impact of diabetes on bone health. It is also imperative to incorporate greater racial and ethnic diversity in future studies. Moreover, larger studies are needed to facilitate stratification based on the history of diabetes and associated comorbidities, something that is paramount to comprehensively discern fracture risk within the vast and varied diabetic population. For T2D, a conspicuous gap lies in the limited research available on men, with the current literature disproportionately skewed toward postmenopausal women.
Furthermore, recognizing the progressive nature of T2D—which often originates from obesity, progresses through metabolic syndrome/insulin resistance, and culminates into diabetes—is essential. Although initial phases might be manageable through lifestyle alterations, unchecked progression can lead to poorly controlled diabetes and subsequent complications, like macro- and microvascular diseases. Epidemiological data consistently suggest that fracture risk in diabetes depends on multiple factors, such as the disease’s duration, insulin use, microvascular complications, and glycemic management. As such, the relationship between bone fragility and diabetes may fluctuate depending on the disease’s stage. Notably, the initial stages of insulin resistance might even have a paradoxical enhancement effect on bone health, making comparisons with baseline health challenging, as these individuals could be starting from an inadvertently advantageous position induced by insulin resistance.152 Current evidence is equivocal about whether prediabetes is associated with increased risk of fracture.153,154 Thus, longitudinal studies along the progression of diabetes are desperately needed to gain further insight.
Finally, given the rapidly changing landscape of treatments for obesity and diabetes, additional studies are needed to understand the effects of these interventions on skeletal health in adults with diabetes.155 Several pharmacological treatments for diabetes, such as thiazolidinediones and canagliflozin, are already known to have negative skeletal effects and to increase risk of fracture.156 Indeed, one limitation of existing work is the confounding factor of diabetic treatments, which are accounted for differently in different studies and may contribute to the heterogeneity of skeletal outcomes in this population. Furthermore, newer antidiabetic agents, especially those resulting in pronounced weight loss such as with GLP-1 agonists, will likely have resultant skeletal effects.156 As the prevalence of diabetes continues to rise globally, understanding the full spectrum of side effects associated with treatment modalities is imperative.
In summary, diabetic skeletal fragility remains to be well characterized. There is an opportunity to recognize that both T1D and T2D are heterogeneous diseases and future studies should consider assessing skeletal fragility by phenotypic diabetic subtypes.14–17 Further research including longitudinal studies and larger, more diverse populations are needed to fully understand the nuanced effects of T1D and T2D on bone structure and fracture outcomes in this growing population.
Acknowledgments
Graphical abstract MRI images courtesy of Julio Carballido-Gamio.
Contributor Information
Shannon R Emerzian, Center for Advanced Orthopedic Studies, Beth Israel Deaconess Medical Center and Harvard Medical School, Boston, MA 02215, United States.
Fjola Johannesdottir, Center for Advanced Orthopedic Studies, Beth Israel Deaconess Medical Center and Harvard Medical School, Boston, MA 02215, United States.
Elaine W Yu, Department of Medicine, Endocrine Division, Massachusetts General Hospital and Harvard Medical School, Boston, MA 02114, United States.
Mary L Bouxsein, Center for Advanced Orthopedic Studies, Beth Israel Deaconess Medical Center and Harvard Medical School, Boston, MA 02215, United States; Department of Medicine, Endocrine Division, Massachusetts General Hospital and Harvard Medical School, Boston, MA 02114, United States.
Author contributions
Shannon R. Emerzian (Conceptualization; Formal analysis; Writing—original draft [co-first author]), Fjola Johannesdottir (Conceptualization; Formal analysis; Writing—original draft [co-first author]), Elaine W. Yu (Conceptualization; Supervision; Writing—review & editing [co-senior author]), and Mary L. Bouxsein (Conceptualization; Supervision; Writing—review & editing [co-senior author]).
Funding
The authors are supported by grants from National Institutes of Health National Institute of Diabetes and Digestive and Kidney Diseases R01DK124710; National Institutes of Health National Institute on Aging R03AG068314 and T32AG023480.
Conflicts of interest
E.W.Y. has received research grants to the Massachusetts General Hospital from Amgen Inc. for unrelated studies. S.R.E., F.J., and M.L.B. declare that they have no known competing financial interests or personal relationships that could appear to influence the work reported in this article.
Data availability
Data available on request. The data underlying this article will be shared on reasonable request to the corresponding author.
References
- 1. Centers for Disease Control and Prevention . National Diabetes Statistics Report website. https://www.cdc.gov/diabetes/data/statistics-report/index.html. Accessed May 14 2023.
- 2. Xu G, Liu B, Sun Y, et al. Prevalence of diagnosed type 1 and type 2 diabetes among US adults in 2016 and 2017: population based study. BMJ. 2018;362:k1497. 10.1136/bmj.k1497. [DOI] [PMC free article] [PubMed] [Google Scholar]
- 3. Laiteerapong N, Huang ES. Diabetes in older adults. In: Cowie C, Casagrande S, Menke A, eds. Diabetes in America. 3rd ed. Bethesda, MD: National Institute of Diabetes and Digestive and Kidney Diseases (US); 2018. CHAPTER 16. Available from: https://www.ncbi.nlm.nih.gov/books/NBK567980/. [PubMed] [Google Scholar]
- 4. Vestergaard P. Discrepancies in bone mineral density and fracture risk in patients with type 1 and type 2 diabetes - a meta-analysis. Osteoporos Int. 2007;18(4):427–444. 10.1007/s00198-006-0253-4. [DOI] [PubMed] [Google Scholar]
- 5. Janghorbani M, Van Dam RM, Willett WC, Hu FB. Systematic review of type 1 and type 2 diabetes mellitus and risk of fracture. Am J Epidemiol. 2007;166(5):495–505. 10.1093/aje/kwm106. [DOI] [PubMed] [Google Scholar]
- 6. Shah VN, Shah CS, Snell-Bergeon JK. Type 1 diabetes and risk of fracture: meta-analysis and review of the literature. Diabet Med. 2015;32(9):1134–1142. [DOI] [PMC free article] [PubMed] [Google Scholar]
- 7. Fan Y, Wei F, Lang Y, Liu Y. Diabetes mellitus and risk of hip fractures: a meta-analysis. Osteoporos Int. 2016;27(1):219–228. 10.1007/s00198-015-3279-7. [DOI] [PubMed] [Google Scholar]
- 8. Thong EP, Herath M, Weber DR, et al. Fracture risk in young and middle-aged adults with type 1 diabetes mellitus: a systematic review and meta-analysis. Clin Endocrinol. 2018;89(3):314–323. [DOI] [PMC free article] [PubMed] [Google Scholar]
- 9. Bai J, Gao Q, Wang C, Dai J. Diabetes mellitus and risk of low-energy fracture: a meta-analysis. Aging Clin Exp Res. 2020;32(11):2173–2186. 10.1007/s40520-019-01417-x. [DOI] [PubMed] [Google Scholar]
- 10. Wang H, Ba Y, Xing Q, Du J-L. Diabetes mellitus and the risk of fractures at specific sites: a meta-analysis. BMJ Open. 2019;9(1):e024067. 10.1136/bmjopen-2018-024067. [DOI] [PMC free article] [PubMed] [Google Scholar]
- 11. Vilaca T, Schini M, Harnan S, et al. The risk of hip and non-vertebral fractures in type 1 and type 2 diabetes: a systematic review and meta-analysis update. Bone. 2020;137:115457. 10.1016/j.bone.2020.115457. [DOI] [PubMed] [Google Scholar]
- 12. Dytfeld J, Michalak M. Type 2 diabetes and risk of low-energy fractures in postmenopausal women: meta-analysis of observational studies. Aging Clin Exp Res. 2017;29(2):301–309. 10.1007/s40520-016-0562-1. [DOI] [PMC free article] [PubMed] [Google Scholar]
- 13. Moayeri A, Mohamadpour M, Mousavi SF, Shirzadpour E, Mohamadpour S, Amraei M. Fracture risk in patients with type 2 diabetes mellitus and possible risk factors: a systematic review and meta-analysis. Ther Clin Risk Manag. 2017;13:455–468. 10.2147/TCRM.S131945. [DOI] [PMC free article] [PubMed] [Google Scholar]
- 14. Redondo MJ, Morgan NG. Heterogeneity and endotypes in type 1 diabetes mellitus. Nat Rev Endocrinol. 2023;19(9):542–554. 10.1038/s41574-023-00853-0. [DOI] [PubMed] [Google Scholar]
- 15. Nair ATN, Wesolowska-Andersen A, Brorsson C, et al. Heterogeneity in phenotype, disease progression and drug response in type 2 diabetes. Nat Med. 2022;28(5):982–988. 10.1038/s41591-022-01790-7. [DOI] [PubMed] [Google Scholar]
- 16. Ahlqvist E, Storm P, Käräjämäki A, et al. Novel subgroups of adult-onset diabetes and their association with outcomes: a data-driven cluster analysis of six variables. Lancet Diabetes Endocrinol. 2018;6(5):361–369. 10.1016/S2213-8587(18)30051-2. [DOI] [PubMed] [Google Scholar]
- 17. Deutsch AJ, Ahlqvist E, Udler MS. Phenotypic and genetic classification of diabetes. Diabetologia. 2022;65(11):1758–1769. 10.1007/s00125-022-05769-4. [DOI] [PMC free article] [PubMed] [Google Scholar]
- 18. Napoli N, Conte C. Bone fragility in type 1 diabetes: new insights and future steps. Lancet Diabetes Endocrinol. 2022;10(7):475–476. 10.1016/S2213-8587(22)00137-1. [DOI] [PubMed] [Google Scholar]
- 19. Axelsson KF, Litsne H, Kousoula K, Franzén S, Eliasson B, Lorentzon M. Risk of fracture in adults with type 2 diabetes in Sweden: a national cohort study. PLoS Med. 2023;20(1):e1004172. 10.1371/journal.pmed.1004172. [DOI] [PMC free article] [PubMed] [Google Scholar]
- 20. Wallander M, Axelsson KF, Nilsson AG, Lundh D, Lorentzon M. Type 2 diabetes and risk of hip fractures and non-skeletal fall injuries in the elderly: a study from the fractures and fall injuries in the elderly cohort (FRAILCO). J Bone Miner Res. 2017;32(3):449–460. 10.1002/jbmr.3002. [DOI] [PubMed] [Google Scholar]
- 21. Schwartz AV, Hillier TA, Sellmeyer DE, et al. Older women with diabetes have a higher risk of falls: a prospective study. Diabetes Care. 2002;25(10):1749–1754. 10.2337/diacare.25.10.1749. [DOI] [PubMed] [Google Scholar]
- 22. Maurer MS, Burcham J, Cheng H. Diabetes mellitus is associated with an increased risk of falls in elderly residents of a long-term care facility. J Gerontol A Biol Sci Med Sci. 2005;60(9):1157–1162. 10.1093/gerona/60.9.1157. [DOI] [PubMed] [Google Scholar]
- 23. Shah VN, Wu M, Foster N, Dhaliwal R, Al MM. Severe hypoglycemia is associated with high risk for falls in adults with type 1 diabetes. Arch Osteoporos. 2018;13(1):66. 10.1007/s11657-018-0475-z. [DOI] [PubMed] [Google Scholar]
- 24. Mori H, Kuroda A, Yoshida S, et al. High prevalence and clinical impact of dynapenia and sarcopenia in Japanese patients with type 1 and type 2 diabetes: findings from the impact of diabetes mellitus on Dynapenia study. J Diabetes Investig. 2021;12(6):1050–1059. 10.1111/jdi.13436. [DOI] [PMC free article] [PubMed] [Google Scholar]
- 25. Schwartz AV, Vittinghoff E, Sellmeyer DE, et al. Diabetes-related complications, glycemic control, and falls in older adults. Diabetes Care. 2008;31(3):391–396. 10.2337/dc07-1152. [DOI] [PMC free article] [PubMed] [Google Scholar]
- 26. Strotmeyer ES, Cauley JA, Schwartz AV, et al. Nontraumatic fracture risk with diabetes mellitus and impaired fasting glucose in older White and Black adults. Arch Intern Med. 2005;165(14):1612–1617. 10.1001/archinte.165.14.1612. [DOI] [PubMed] [Google Scholar]
- 27. Kachroo S, Kawabata H, Colilla S, et al. Association between Hypoglycemia and fall-related events in type 2 diabetes mellitus: analysis of a U.S. commercial database. J Manag Care Spec Pharm. 2015;21(3):243–253. 10.18553/jmcp.2015.21.3.243. [DOI] [PMC free article] [PubMed] [Google Scholar]
- 28. Ma L, Oei L, Jiang L, et al. Association between bone mineral density and type 2 diabetes mellitus: a meta-analysis of observational studies. Eur J Epidemiol. 2012;27(5):319–332. 10.1007/s10654-012-9674-x. [DOI] [PMC free article] [PubMed] [Google Scholar]
- 29. Schwartz AV, Vittinghoff E, Bauer DC, et al. Study of osteoporotic fractures (SOF) research group, osteoporotic fractures in men (MrOS) research group, health, aging and BC Health ARG. Association of BMD and FRAX score with risk of fracture in older adults with type 2 diabetes. JAMA. 2011;305(21):2184–2192. 10.1001/jama.2011.715. [DOI] [PMC free article] [PubMed] [Google Scholar]
- 30. Ali D, Tencerova M, Figeac F, Kassem M, Jafari A. The pathophysiology of osteoporosis in obesity and type 2 diabetes in aging women and men: the mechanisms and roles of increased bone marrow adiposity. Front Endocrinol. 2022;13:13. 10.3389/fendo.2022.981487. [DOI] [PMC free article] [PubMed] [Google Scholar]
- 31. Sollmann N, Löffler MT, Kronthaler S, et al. MRI-based quantitative osteoporosis imaging at the spine and femur. J Magn Reson Imaging. 2021;54(1):12–35. 10.1002/jmri.27260. [DOI] [PubMed] [Google Scholar]
- 32. Bahardoust M, Yarali M, Donyadideh G, et al. The use of metformin, sulfonylurea compounds and insulin and the risk of hip fractures in diabetic patients: a systematic review and meta-analysis of observational studies. BMC Musculoskelet Disord. 2023;24(1):367. 10.1186/s12891-023-06493-9. [DOI] [PMC free article] [PubMed] [Google Scholar]
- 33. Hu J, Han J, Jin M, Jin J, Zhu J. Effects of metformin on bone mineral density and bone turnover markers: a systematic review and meta-analysis. BMJ Open. 2023;13(6):e072904. 10.1136/bmjopen-2023-072904. [DOI] [PMC free article] [PubMed] [Google Scholar]
- 34. Van Hulten V, Rasmussen N, Driessen JHM, Burden AM, Kvist A, van den Bergh JP. Fracture patterns in type 1 and type 2 diabetes mellitus: a narrative review of recent literature. Curr Osteoporos Rep. 2021;19(6):644–655. 10.1007/s11914-021-00715-6. [DOI] [PMC free article] [PubMed] [Google Scholar]
- 35. Hans D, Goertzen AL, Krieg MA, Leslie WD. Bone microarchitecture assessed by TBS predicts osteoporotic fractures independent of bone density: the Manitoba study. J Bone Miner Res. 2011;26(11):2762–2769. 10.1002/jbmr.499. [DOI] [PubMed] [Google Scholar]
- 36. Shevroja E, Cafarelli FP, Guglielmi G, Hans D. DXA parameters, trabecular bone score (TBS) and bone mineral density (BMD), in fracture risk prediction in endocrine-mediated secondary osteoporosis. Endocrine. 2021;74(1):20–28. 10.1007/s12020-021-02806-x. [DOI] [PMC free article] [PubMed] [Google Scholar]
- 37. Beck TJ. Extending DXA beyond bone mineral density: understanding hip structure analysis. Curr Osteoporos Rep. 2007;5(2):49–55. 10.1007/s11914-007-0002-4. [DOI] [PubMed] [Google Scholar]
- 38. Humbert L, Martelli Y, Fonolla R, et al. 3D-DXA: assessing the femoral shape, the trabecular macrostructure and the cortex in 3D from DXA images. IEEE Trans Med Imaging. 2017;36(1):27–39. 10.1109/TMI.2016.2593346. [DOI] [PubMed] [Google Scholar]
- 39. Hough FS, Pierroz DD, Cooper C, Ferrari SL. Mechanisms and evaluation of bone fragility in type 1 diabetes mellitus. Eur J Endocrinol. 2016;174(4):R127–R138. 10.1530/EJE-15-0820. [DOI] [PubMed] [Google Scholar]
- 40. Pan H, Wu N, Yang T, He W. Association between bone mineral density and type 1 diabetes mellitus: a meta-analysis of cross-sectional studies. Diabetes Metab Res Rev. 2014;30(7):531–542. 10.1002/dmrr.2508. [DOI] [PubMed] [Google Scholar]
- 41. Shah VN, Harrall KK, Shah CS, et al. Bone mineral density at femoral neck and lumbar spine in adults with type 1 diabetes: a meta-analysis and review of the literature. Osteoporos Int. 2017;28(9):2601–2610. [DOI] [PubMed] [Google Scholar]
- 42. Gunczler P, Lanes R, Paoli M, Martinis R, Villaroel O, Weisinger JR. Decreased bone mineral density and bone formation markers shortly after diagnosis of clinical type 1 diabetes mellitus. J Pediatr Endocrinol Metab. 2001;14(5):525–528. 10.1515/JPEM.2001.14.5.525. [DOI] [PubMed] [Google Scholar]
- 43. López-Ibarra PJ, Pastor MMC, Escobar-Jiménez F, et al. Bone mineral density at time of clinical diagnosis of adult-onset type 1 diabetes mellitus. Endocr Pract. 2001;7(5):346–351. 10.4158/EP.7.5.346. [DOI] [PubMed] [Google Scholar]
- 44. Liu EY, Wactawski-Wende J, Donahue RP, Dmochowski J, Hovey KM, Quattrin T. Does low bone mineral density start in post-teenage years in women with type 1 diabetes? Diabetes Care. 2003;26(8):2365–2369. 10.2337/diacare.26.8.2365. [DOI] [PubMed] [Google Scholar]
- 45. Campos Pastor MM, López-Ibarra PJ, Escobar-Jiménez F, Serrano Pardo MD, García-Cervigón AG. Intensive insulin therapy and bone mineral density in type 1 diabetes mellitus: a prospective study. Osteoporos Int. 2000;11(5):455–459. 10.1007/s001980070114. [DOI] [PubMed] [Google Scholar]
- 46. Hamilton EJ, Drinkwater JJ, Chubb SAP, et al. A 10-year prospective study of bone mineral density and bone turnover in males and females with type 1 diabetes. J Clin Endocrinol Metab. 2018;103(9):3531–3539. 10.1210/jc.2018-00850. [DOI] [PubMed] [Google Scholar]
- 47. Hamilton EJ, Rakic V, Davis WA, et al. A five-year prospective study of bone mineral density in men and women with diabetes: the Fremantle diabetes study. Acta Diabetol. 2012;49(2):153–158. 10.1007/s00592-011-0324-7. [DOI] [PubMed] [Google Scholar]
- 48. Mastrandrea LD, Wactawski-Wende J, Donahue RP, Hovey KM, Clark A, Quattrin T. Young women with type 1 diabetes have lower bone mineral density that persists over time. Diabetes Care. 2008;31(9):1729–1735. 10.2337/dc07-2426. [DOI] [PMC free article] [PubMed] [Google Scholar]
- 49. Schwartz AV, Backlund JYC, de Boer IH, et al. DCCT/EDIC research group risk factors for lower bone mineral density in older adults with type 1 diabetes: a cross-sectional study. Lancet Diabetes Endocrinol Elsevier Ltd. 2022;10(7):509–518. 10.1016/S2213-8587(22)00103-6. [DOI] [PubMed] [Google Scholar]
- 50. Sewing L, Potasso L, Baumann S, et al. Bone microarchitecture and strength in long-standing type 1 diabetes. J Bone Miner Res. 2022;37(5):837–847. [DOI] [PMC free article] [PubMed] [Google Scholar]
- 51. Ma L, Oei L, Jiang L, et al. Association between bone mineral density and type 2 diabetes mellitus: a meta-analysis of observational studies. Eur J Epidemiol. 2012;27(5):319–332. 10.1007/s10654-012-9674-x. [DOI] [PMC free article] [PubMed] [Google Scholar]
- 52. Schacter GI, Leslie WD. DXA-based measurements in diabetes: can they predict fracture risk? Calcif Tissue Int. 2017;100(2):150–164. 10.1007/s00223-016-0191-x. [DOI] [PubMed] [Google Scholar]
- 53. Khalil N, Sutton-Tyrrell K, Strotmeyer ES, et al. Menopausal bone changes and incident fractures in diabetic women: a cohort study. Osteoporos Int. 2011;22(5):1367–1376. 10.1007/s00198-010-1357-4. [DOI] [PMC free article] [PubMed] [Google Scholar]
- 54. Schwartz AV, Ewing SK, Porzig AM, et al. Diabetes and change in bone mineral density at the hip, calcaneus, spine, and radius in older women. Front Endocrinol. 2013;4:62. 10.3389/fendo.2013.00062. [DOI] [PMC free article] [PubMed] [Google Scholar]
- 55. Leslie WD, Morin SN, Majumdar SR, Lix LM. Effects of obesity and diabetes on rate of bone density loss. Osteoporos Int. 2018;29(1):61–67. 10.1007/s00198-017-4223-9. [DOI] [PubMed] [Google Scholar]
- 56. Stolk RP, Van Daele PL, Pols HA, et al. Hyperinsulinemia and bone mineral density in an elderly population: the Rotterdam study. Bone. 1996;18(6):545–549. 10.1016/8756-3282(96)00079-8. [DOI] [PubMed] [Google Scholar]
- 57. Conte C, Epstein S, Napoli N. Insulin resistance and bone: a biological partnership. Acta Diabetol. 2018;55(4):305–314. 10.1007/s00592-018-1101-7. [DOI] [PubMed] [Google Scholar]
- 58. Yuan J, Jia P, Zhou J-B. Comparison of bone mineral density in US adults with diabetes, prediabetes and normoglycemia from 2005 to 2018. Front Endocrinol. 2022;13:890053. 10.3389/fendo.2022.890053. [DOI] [PMC free article] [PubMed] [Google Scholar]
- 59. Liu B, Liu J, Pan J, Zhao C, Wang Z, Zhang Q. The association of diabetes status and bone mineral density among US adults: evidence from NHANES 2005-2018. BMC Endocr Disord. 2023;23(1):27. 10.1186/s12902-023-01266-w. [DOI] [PMC free article] [PubMed] [Google Scholar]
- 60. Pan R, Ji H, Xu Y, et al. The association between prediabetes and bone mineral density: a meta-analysis. Diabetes Metab Res Rev. 2023;39(7):e3691. 10.1002/dmrr.3691. [DOI] [PubMed] [Google Scholar]
- 61. Shieh A, Greendale GA, Cauley JA, Srikanthan P, Karlamangla AS. Longitudinal associations of insulin resistance with change in bone mineral density in midlife women. JCI Insight. 2022;7(20):e162085. 10.1172/jci.insight.162085. [DOI] [PMC free article] [PubMed] [Google Scholar]
- 62. Oei L, Zillikens MC, Dehghan A, et al. High bone mineral density and fracture risk in type 2 diabetes as skeletal complications of inadequate glucose control: the Rotterdam study. Diabetes Care. 2013;36(6):1619–1628. 10.2337/dc12-1188. [DOI] [PMC free article] [PubMed] [Google Scholar]
- 63. Strotmeyer ES, Cauley JA, Schwartz AV, et al. Diabetes is associated independently of body composition with BMD and bone volume in older white and black men and women: the health, aging, and body composition study. J Bone Miner Res. 2004;19(7):1084–1091. 10.1359/JBMR.040311. [DOI] [PubMed] [Google Scholar]
- 64. Jang M, Kim H, Lea S, Oh S, Kim JS, Oh B. Effect of duration of diabetes on bone mineral density: a population study on east Asian males. BMC Endocr Disord. 2018;18(1):61. 10.1186/s12902-018-0290-y. [DOI] [PMC free article] [PubMed] [Google Scholar]
- 65. Syversen U, Mosti MP, Mynarek IM, et al. Evidence of impaired bone quality in men with type 1 diabetes: a cross-sectional study. Endocr Connect. 2021;10(8):955–964. 10.1530/EC-21-0193. [DOI] [PMC free article] [PubMed] [Google Scholar]
- 66. Coll JC, Garceau É, Leslie WD, et al. Prevalence of vertebral fractures in adults with type 1 diabetes: DenSiFy study (diabetes spine fractures). J Clin Endocrinol Metab. 2022;107(5):E1860–E1870. 10.1210/clinem/dgac031. [DOI] [PubMed] [Google Scholar]
- 67. Carvalho AL, Massaro B, Silva LTPE, et al. Emerging aspects of the body composition, bone marrow adipose tissue and skeletal phenotypes in type 1 diabetes mellitus. J Clin Densitom. 2019;22(3):420–428. http://www.ncbi.nlm.nih.gov/pubmed/30100221. 10.1016/j.jocd.2018.06.007. [DOI] [PubMed] [Google Scholar]
- 68. Neumann T, Lodes S, Kästner B, et al. Trabecular bone score in type 1 diabetes—a cross-sectional study. Osteoporos Int. 2016;27(1):127–133. [DOI] [PubMed] [Google Scholar]
- 69. Thangavelu T, Silverman E, Akhter MP, Lyden E, Recker RR, Graeff-Armas LA. Trabecular bone score and transilial bone trabecular histomorphometry in type 1 diabetes and healthy controls. Bone. 2020;137:115451. 10.1016/j.bone.2020.115451. [DOI] [PMC free article] [PubMed] [Google Scholar]
- 70. Leslie WD, Aubry-Rozier B, Lamy O, Hans D, for the Manitoba Bone Density Program . TBS (trabecular bone score) and diabetes-related fracture risk. J Clin Endocrinol Metab. 2013;98(2):602–609. 10.1210/jc.2012-3118. [DOI] [PubMed] [Google Scholar]
- 71. Dhaliwal R, Cibula D, Ghosh C, Weinstock RS, Moses AM. Bone quality assessment in type 2 diabetes mellitus. Osteoporos Int. 2014;25(7):1969–1973. [DOI] [PubMed] [Google Scholar]
- 72. Bonaccorsi G, Fila E, Messina C, et al. Comparison of trabecular bone score and hip structural analysis with FRAX® in postmenopausal women with type 2 diabetes mellitus. Aging Clin Exp Res. 2017;29(5):951–957. [DOI] [PubMed] [Google Scholar]
- 73. Caffarelli C, Giambelluca A, Ghini V, et al. In Type-2 diabetes subjects trabecular bone score is better associated with carotid intima-media thickness than BMD. Calcif Tissue Int. 2017;101(4):404–411. [DOI] [PubMed] [Google Scholar]
- 74. Holloway KL, De Abreu LLF, Hans D, et al. Trabecular bone score in men and women with impaired fasting glucose and diabetes. Calcif Tissue Int. 2018;102(1):32–40. [DOI] [PubMed] [Google Scholar]
- 75. Ho-Pham LT, Tran B, Do AT, Nguyen TV. Association between pre-diabetes, type 2 diabetes and trabecular bone score: the Vietnam osteoporosis study. Diabetes Res Clin Pract. 2019;155(September 2019):107790. 10.1016/j.diabres.2019.107790. [DOI] [PubMed] [Google Scholar]
- 76. Delbari N, Rajaei A, Oroei M, Ahmadzadeh A, Farsad F. A comparison between femoral neck and LS-BMD with LS-TBS in T2DM patients: a case control study. Musculoskelet Disord. 2021;22(1):582. 10.1186/s12891-021-04471-7. [DOI] [PMC free article] [PubMed] [Google Scholar]
- 77. Hayón-Ponce M, García-Fontana B, Avilés-Pérez MD, et al. Lower trabecular bone score in type 2 diabetes mellitus: a role for fat mass and insulin resistance beyond hyperglycaemia. Diabetes Metab. 2021;47(6):101276. 10.1016/j.diabet.2021.101276. [DOI] [PubMed] [Google Scholar]
- 78. Paul J, Devarapalli V, Johnson JT, et al. Do proximal hip geometry, trabecular microarchitecture, and prevalent vertebral fractures differ in postmenopausal women with type 2 diabetes mellitus? A cross-sectional study from a teaching hospital in southern India. Osteoporos Int. 2021;32(8):1585–1593. 10.1007/s00198-021-05855-0. [DOI] [PubMed] [Google Scholar]
- 79. Pechmann LM, Petterle RR, Moreira CA, Borba VZC. Osteosarcopenia and trabecular bone score in patients with type 2 diabetes mellitus. Arch Endocrinol Metab. 2021;65(6):801–810. [DOI] [PMC free article] [PubMed] [Google Scholar]
- 80. Palomo T, Dreyer P, Muszkat P, et al. Effect of soft tissue noise on trabecular bone score in postmenopausal women with diabetes: a cross sectional study. Bone. 2022;157:116339. 10.1016/j.bone.2022.116339. [DOI] [PubMed] [Google Scholar]
- 81. Ubago-Guisado E, Moratalla-Aranda E, González-Salvatierra S, et al. Do patients with type 2 diabetes have impaired hip bone microstructure? A study using 3D modeling of hip dual-energy X-ray absorptiometry. Front Endocrinol. 2023;13. 10.3389/fendo.2022.1069224. [DOI] [PMC free article] [PubMed] [Google Scholar]
- 82. Xue Y, Baker AL, Nader S, et al. Lumbar spine trabecular bone score (TBS) reflects diminished bone quality in patients with diabetes mellitus and oral glucocorticoid therapy. J Clin Densitom. 2018;21(2):185–192. [DOI] [PubMed] [Google Scholar]
- 83. Iki M, Fujita Y, Kouda K, et al. Hyperglycemia is associated with increased bone mineral density and decreased trabecular bone score in elderly Japanese men: the Fujiwara-kyo osteoporosis risk in men (FORMEN) study. Bone. 2017;105:18–25. [DOI] [PubMed] [Google Scholar]
- 84. Rianon N, Ambrose CG, Buni M, et al. Trabecular bone score is a valuable addition to bone mineral density for bone quality assessment in older Mexican American women with type 2 diabetes. J Clin Densitom. 2018;21(3):355–359. [DOI] [PMC free article] [PubMed] [Google Scholar]
- 85. Gani LU, Saripalli KR, Fernandes K, et al. Bone mineral density and trabecular bone score in elderly type 2 diabetes Southeast Asian patients with severe osteoporotic hip fractures. PLoS One. 2020;15(11):e0241616. 10.1371/journal.pone.0241616. [DOI] [PMC free article] [PubMed] [Google Scholar]
- 86. Ho-Pham LT, Tran B, Do AT, Nguyen TV. Association between pre-diabetes, type 2 diabetes and trabecular bone score: the Vietnam osteoporosis study. Diabetes Res Clin Pract. 2019;155:107790. 10.1016/j.diabres.2019.107790. [DOI] [PubMed] [Google Scholar]
- 87. Kim JH, Choi HJ, Ku EJ, et al. Trabecular bone score as an indicator for skeletal deterioration in diabetes. J Clin Endocrinol Metab. 2015;100(2):475–482. 10.1210/jc.2014-2047. [DOI] [PubMed] [Google Scholar]
- 88. Depczynski B, Liew PY, White C. Association of glycaemic variables with trabecular bone score in post-menopausal women with type 2 diabetes mellitus. Diabet Med. 2020;37(9):1545–1552. [DOI] [PubMed] [Google Scholar]
- 89. Shevroja E, Aubry-Rozier B, Hans G, et al. Clinical performance of the updated trabecular bone score (TBS) algorithm, which accounts for the soft tissue thickness: the OsteoLaus study. J Bone Miner Res. 2019;34(12):2229–2237. 10.1002/jbmr.3851. [DOI] [PubMed] [Google Scholar]
- 90. Moon HU, Lee N, Chung YS, Choi YJ. Reduction of visceral fat could be related to the improvement of TBS in diabetes mellitus. J Bone Miner Metab. 2020;38(5):702–709. 10.1007/s00774-020-01107-z. [DOI] [PubMed] [Google Scholar]
- 91. Shevroja E, Aubry-Rozier B, Hans G, et al. Clinical performance of the updated trabecular bone score (TBS) algorithm, which accounts for the soft tissue thickness: the OsteoLaus study. J Bone Miner Res. 2019;34(12):2229–2237. 10.1002/jbmr.3851. [DOI] [PubMed] [Google Scholar]
- 92. Zhukouskaya VV, Ellen-Vainicher C, Gaudio A, et al. The utility of lumbar spine trabecular bone score and femoral neck bone mineral density for identifying asymptomatic vertebral fractures in well-compensated type 2 diabetic patients. Osteoporos Int. 2016;27(1):49–56. [DOI] [PubMed] [Google Scholar]
- 93. Choi YJ, Ock SY, Chung YS. Trabecular bone score (TBS) and TBS-adjusted fracture risk assessment tool are potential supplementary tools for the discrimination of morphometric vertebral fractures in postmenopausal women with type 2 diabetes. J Clin Densitom. 2016;19(4):507–514. [DOI] [PubMed] [Google Scholar]
- 94. Yamamoto M, Yamauchi M, Sugimoto T. Prevalent vertebral fracture is dominantly associated with spinal microstructural deterioration rather than bone mineral density in patients with type 2 diabetes mellitus. PLoS One. 2019;14(9):e0222571. 10.1371/journal.pone.0222571. [DOI] [PMC free article] [PubMed] [Google Scholar]
- 95. Lin YC, Wu J, Kuo SF, et al. Vertebral fractures in type 2 diabetes patients: utility of trabecular bone score and relationship with serum bone turnover biomarkers. J Clin Densitom. 2020;23(1):37–43. [DOI] [PubMed] [Google Scholar]
- 96. Miazgowski T, Pynka S, Noworyta-Zietara M, Kryzanowska-Świniarska B, Pikul R. Bone mineral density and hip structural analysis in type 1 diabetic men. Eur J Endocrinol. 2007;156(1):123–127. 10.1530/eje.1.02309. [DOI] [PubMed] [Google Scholar]
- 97. Tinsley JP, Carpenter RD, Pyle LL, Snell-Bergeon JK, Sherk VD, Shah VN. Femoral neck structural properties are altered in adults with type 1 diabetes. J Diabetes Complicat. 2022;36(11):108308. 10.1016/j.jdiacomp.2022.108308. [DOI] [PMC free article] [PubMed] [Google Scholar]
- 98. Maser RE, Kolm P, Modlesky CM, Beck TJ, Lenhard MJ. Hip strength in adults with type 1 diabetes is associated with age at onset of diabetes. J Clin Densitom. 2012;15(1):78–85. 10.1016/j.jocd.2011.08.004. [DOI] [PubMed] [Google Scholar]
- 99. Ishii S, Cauley JA, Crandall CJ, et al. Diabetes and femoral neck strength: findings from the hip strength across the menopausal transition study. J Clin Endocrinol Metab. 2012;97(1):190–197. 10.1210/jc.2011-1883. [DOI] [PMC free article] [PubMed] [Google Scholar]
- 100. Moseley KF, Chia CW, Simonsick EM, Egan JM, Ferrucci L, Sellmeyer DE. Sex-specific differences in progressive glucose intolerance and hip geometry: the Baltimore longitudinal study of aging. Osteoporos Int. 2015;26(5):1555–1562. 10.1007/s00198-015-3027-z. [DOI] [PMC free article] [PubMed] [Google Scholar]
- 101. Garg R, Chen Z, Beck T, et al. Hip geometry in diabetic women: implications for fracture risk. Metabolism. 2012;61(12):1756–1762. 10.1016/j.metabol.2012.05.010. [DOI] [PMC free article] [PubMed] [Google Scholar]
- 102. Hamilton CJ, Jamal SA, Beck TJ, et al. Evidence for impaired skeletal load adaptation among Canadian women with type 2 diabetes mellitus: insight into the BMD and bone fragility paradox. Metabolism. 2013;62(10):1401–1405. 10.1016/j.metabol.2013.05.004. [DOI] [PubMed] [Google Scholar]
- 103. Akeroyd JM, Suarez EA, Bartali B, et al. Differences in skeletal and non-skeletal factors in a diverse sample of men with and without type 2 diabetes mellitus. J Diabetes Complicat. 2014;28(5):679–683. [DOI] [PubMed] [Google Scholar]
- 104. Engelke K, Adams JE, Armbrecht G, et al. Clinical use of quantitative computed tomography and peripheral quantitative computed tomography in the Management of Osteoporosis in adults: the 2007 ISCD official positions. J Clin Densitom. 2008;11(1):123–162. 10.1016/j.jocd.2007.12.010. [DOI] [PubMed] [Google Scholar]
- 105. Wong AK. A comparison of peripheral imaging technologies for bone and muscle quantification: a technical review of image acquisition. J Musculoskelet Neuronal Interact. 2016;16(4):265–282. [PMC free article] [PubMed] [Google Scholar]
- 106. Ishikawa K, Fukui T, Nagai T, et al. Type 1 diabetes patients have lower strength in femoral bone determined by quantitative computed tomography: a cross-sectional study. J Diabetes Investig. 2015;6(6):726–733. 10.1111/jdi.12372. [DOI] [PMC free article] [PubMed] [Google Scholar]
- 107. Kuroda T, Ishikawa K, Nagai T, Fukui T, Hirano T, Inagaki K. Quadrant analysis of quantitative computed tomography scans of the femoral neck reveals superior region-specific weakness in young and middle-aged men with type 1 diabetes mellitus. J Clin Densitom. 2018;21(2):172–178. [DOI] [PubMed] [Google Scholar]
- 108. Barmpa E, Karamagkiolis S, Tigas S, et al. Bone mineral density in adult patients with type 1 diabetes mellitus assessed by both DXA and QCT. J Diabetes Res. 2023;2023:1–9. 10.1155/2023/8925956. [DOI] [PMC free article] [PubMed] [Google Scholar]
- 109. Melton LJ, Riggs BL, Leibson CL, et al. A bone structural basis for fracture risk in diabetes. J Clin Endocrinol Metab. 2008;93(12):4804–4809. 10.1210/jc.2008-0639. [DOI] [PMC free article] [PubMed] [Google Scholar]
- 110. Heilmeier U, Carpenter DR, Patsch JM, et al. Volumetric femoral BMD, bone geometry, and serum sclerostin levels differ between type 2 diabetic postmenopausal women with and without fragility fractures. Osteoporos Int. 2015;26(4):1283–1293. 10.1007/s00198-014-2988-7. [DOI] [PubMed] [Google Scholar]
- 111. Gao L, Zhang P, Wang Y, et al. Relationship between body composition and bone mineral density in postmenopausal women with type 2 diabetes mellitus. BMC Musculoskelet Disord. 2022;23(1):893. 10.1186/s12891-022-05814-8. [DOI] [PMC free article] [PubMed] [Google Scholar]
- 112. Heckelman LN, Wesorick BR, DeFrate LE, Lee RH. Diabetes is associated with a lower minimum moment of inertia among older women: an analysis of 3D reconstructions of clinical CT scans. J Biomech. 2021;128(August):110707. 10.1016/j.jbiomech.2021.110707. [DOI] [PMC free article] [PubMed] [Google Scholar]
- 113. Dufour AB, Roberts B, Broe KE, Kiel DP, Bouxsein ML, Hannan MT. The factor-of-risk biomechanical approach predicts hip fracture in men and women: the Framingham study. Osteoporos Int. 2012;23(2):513–520. 10.1007/s00198-011-1569-2. [DOI] [PMC free article] [PubMed] [Google Scholar]
- 114. Register TC, Lenchik L, Hsu FC, et al. Type 2 diabetes is not independently associated with spinal trabecular volumetric bone mineral density measured by QCT in the diabetes heart study. Bone. 2006;39(3):628–633. 10.1016/j.bone.2006.03.003. [DOI] [PubMed] [Google Scholar]
- 115. Wang L, Zhao K, Zha X, et al. Hyperglycemia is not associated with higher volumetric BMD in a Chinese health check-up cohort. Front Endocrinol. 2022;12(January):1–8. 10.3389/fendo.2021.794066. [DOI] [PMC free article] [PubMed] [Google Scholar]
- 116. Baum T, Yap SP, Karampinos DC, et al. Does vertebral bone marrow fat content correlate with abdominal adipose tissue, lumbar spine bone mineral density, and blood biomarkers in women with type 2 diabetes mellitus? J Magn Reson Imaging. 2012;35(1):117–124. 10.1002/jmri.22757. [DOI] [PMC free article] [PubMed] [Google Scholar]
- 117. Jiang H, Robinson DL, Nankervis A, et al. Bone measures by dual-energy X-ray absorptiometry and peripheral quantitative computed tomography in young women with type 1 diabetes mellitus. J Clin Densitom. 2021;24(2):259–267. [DOI] [PubMed] [Google Scholar]
- 118. Verroken C, Pieters W, Beddeleem L, et al. Cortical bone size deficit in adult patients with type 1 diabetes mellitus. J Clin Endocrinol Metab. 2017;102(8):2887–2895. [DOI] [PubMed] [Google Scholar]
- 119. Shah VN, Joshee P, Sippl R, et al. Type 1 diabetes onset at young age is associated with compromised bone quality. Bone. 2019;123(March):260–264. 10.1016/j.bone.2019.03.039. [DOI] [PMC free article] [PubMed] [Google Scholar]
- 120. Petit MA, Paudel ML, Taylor BC, et al. Bone mass and strength in older men with type 2 diabetes: the osteoporotic fractures in men study. J Bone Miner Res. 2010;25(2):285–291. 10.1359/jbmr.090725. [DOI] [PMC free article] [PubMed] [Google Scholar]
- 121. Holloway-Kew KL, Anderson KB, Tembo MC, et al. Peripheral quantitative computed tomography-derived bone parameters in men with impaired fasting glucose and diabetes. J Bone Miner Metab. 2023;41(1):131–142. 10.1007/s00774-022-01389-5. [DOI] [PubMed] [Google Scholar]
- 122. Ho-Pham LT, Chau PMN, Do AT, Nguyen HC, Nguyen TV. Type 2 diabetes is associated with higher trabecular bone density but lower cortical bone density: the Vietnam osteoporosis study. Osteoporos Int. 2018;29(9):2059–2067. 10.1007/s00198-018-4579-5. [DOI] [PubMed] [Google Scholar]
- 123. Sheu Y, Amati F, Schwartz AV, et al. Vertebral bone marrow fat, bone mineral density and diabetes: the osteoporotic fractures in men (MrOS) study. Bone. 2017;97:299–305. [DOI] [PMC free article] [PubMed] [Google Scholar]
- 124. Whittier DE, Boyd SK, Burghardt AJ, et al. Guidelines for the assessment of bone density and microarchitecture in vivo using high-resolution peripheral quantitative computed tomography. Osteoporos Int. 2020;31(9):1607–1627. 10.1007/s00198-020-05438-5. [DOI] [PMC free article] [PubMed] [Google Scholar]
- 125. Walle M, Whittier DE, Frost M, Müller R, Collins CJ. Meta-analysis of diabetes mellitus-associated differences in bone structure assessed by high-resolution peripheral quantitative computed tomography. Curr Osteoporos Rep. 2022;20(6):398–409. 10.1007/s11914-022-00755-6. [DOI] [PMC free article] [PubMed] [Google Scholar]
- 126. Shanbhogue VV, Hansen S, Frost M, et al. Bone geometry, volumetric density, microarchitecture, and estimated bone strength assessed by HR-pQCT in adult patients with type 1 diabetes mellitus. J Bone Miner Res. 2015;30(12):2188–2199. [DOI] [PubMed] [Google Scholar]
- 127. Xu L, Yu J, Wang O, et al. Comparison of differences in bone microarchitecture in adult- versus juvenile-onset type 1 diabetes Asian males versus non-diabetes males: an observational cross-sectional pilot study. Endocrine. 2021;71(1):87–95. 10.1007/s12020-020-02480-5. [DOI] [PMC free article] [PubMed] [Google Scholar]
- 128. Vilaca T, Paggiosi M, Walsh JS, Selvarajah D, Eastell R. The effects of type 1 diabetes and diabetic peripheral neuropathy on the musculoskeletal system: a case–control study. J Bone Miner Res. 2021;36(6):1048–1059. [DOI] [PubMed] [Google Scholar]
- 129. Hessellund RNH, Dal J, Kvist AV, Van den Bergh JP, Jensen MH, Vestergaard P. Bone parameters in T1D and T2D assessed by DXA and HR-pQCT – a cross-sectional study: the DIAFALL study. Bone. 2023;172:116753. 10.1016/j.bone.2023.116753. [DOI] [PubMed] [Google Scholar]
- 130. Nilsson AG, Sundh D, Johansson L, et al. Type 2 diabetes mellitus is associated with better bone microarchitecture but lower bone material strength and poorer physical function in elderly women: a population-based study. J Bone Miner Res. 2017;32(5):1062–1071. [DOI] [PubMed] [Google Scholar]
- 131. Paccou J, Ward KA, Jameson KA, Dennison EM, Cooper C, Edwards MH. Bone microarchitecture in men and women with diabetes: the importance of cortical porosity. Calcif Tissue Int. 2016;98(5):465–473. [DOI] [PubMed] [Google Scholar]
- 132. Patsch JM, Rasul S, Huber FA, et al. Similarities in trabecular hypertrophy with site-specific differences in cortical morphology between men and women with type 2 diabetes mellitus. PLoS One. 2017;12(4):e0174664. 10.1371/journal.pone.0174664. [DOI] [PMC free article] [PubMed] [Google Scholar]
- 133. Farr JN, Drake MT, Amin S, Melton LJ, McCready LK, Khosla S. In vivo assessment of bone quality in postmenopausal women with type 2 diabetes. J Bone Miner Res. 2014;29(4):787–795. 10.1002/jbmr.2106. [DOI] [PMC free article] [PubMed] [Google Scholar]
- 134. Samelson EJ, Demissie S, Cupples LA, et al. Diabetes and deficits in cortical bone density, microarchitecture, and bone size: Framingham HR-pQCT study. J Bone Miner Res. 2018;33(1):54–62. [DOI] [PMC free article] [PubMed] [Google Scholar]
- 135. Heilmeier U, Joseph GB, Pasco C, et al. Longitudinal evolution of bone microarchitecture and bone strength in type 2 diabetic postmenopausal women with and without history of fragility fractures—a 5-year follow-up study using high resolution peripheral quantitative computed tomography. Front Endocrinol. 2021;12:599316. 10.3389/fendo.2021.599316. [DOI] [PMC free article] [PubMed] [Google Scholar]
- 136. Burghardt AJ, Issever AS, Schwartz AV, et al. High-resolution peripheral quantitative computed tomographic imaging of cortical and trabecular bone microarchitecture in patients with type 2 diabetes mellitus. J Clin Endocrinol Metab. 2010;95(11):5045–5055. 10.1210/jc.2010-0226. [DOI] [PMC free article] [PubMed] [Google Scholar]
- 137. Yu EW, Putman MS, Derrico N, Abrishamanian-Garcia G, Finkelstein JS, Bouxsein ML. Defects in cortical microarchitecture among African-American women with type 2 diabetes. Osteoporos Int. 2015;26(2):673–679. [DOI] [PMC free article] [PubMed] [Google Scholar]
- 138. Shanbhogue VV, Hansen S, Frost M, et al. Compromised cortical bone compartment in type 2 diabetes mellitus patients with microvascular disease. Eur J Endocrinol. 2016;174(2):115–124. 10.1530/EJE-15-0860. [DOI] [PubMed] [Google Scholar]
- 139. de Waard EAC, de Jong JJA, Koster A, et al. The association between diabetes status, HbA1c, diabetes duration, microvascular disease, and bone quality of the distal radius and tibia as measured with high-resolution peripheral quantitative computed tomography—the Maastricht Study. Osteoporos Int. 2018;29(12):2725–2738. [DOI] [PMC free article] [PubMed] [Google Scholar]
- 140. Vigevano F, Gregori G, Colleluori G, et al. In men with obesity, T2DM is associated with poor trabecular microarchitecture and bone strength and low bone turnover. J Clin Endocrinol Metab. 2021;106(5):1362–1376. 10.1210/clinem/dgab061. [DOI] [PMC free article] [PubMed] [Google Scholar]
- 141. Starr JF, Bandeira LC, Agarwal S, et al. Robust trabecular microstructure in type 2 diabetes revealed by individual trabecula segmentation analysis of HR-pQCT images. J Bone Miner Res. 2018;33(9):1665–1675. [DOI] [PMC free article] [PubMed] [Google Scholar]
- 142. Caksa S, Yuan A, Rudolph SE, Yu EW, Popp KL, Bouxsein ML. Influence of soft tissue on bone density and microarchitecture measurements by high-resolution peripheral quantitative computed tomography. Bone. 2019;124:47–52. 10.1016/j.bone.2019.04.008. [DOI] [PubMed] [Google Scholar]
- 143. Abdalrahaman N, McComb C, Foster JE, et al. Deficits in trabecular bone microarchitecture in young women with type 1 diabetes mellitus. J Bone Miner Res. 2015;30(8):1386–1393. 10.1002/jbmr.2465. [DOI] [PubMed] [Google Scholar]
- 144. Carvalho AL, Massaro B, Silva LTPE, et al. Emerging aspects of the body composition, bone marrow adipose tissue and skeletal phenotypes in type 1 diabetes mellitus. J Clin Densitom. 2019;22(3):420–428. 10.1016/j.jocd.2018.06.007. [DOI] [PubMed] [Google Scholar]
- 145. Slade JM, Coe LM, Meyer RA, McCabe LR. Human bone marrow adiposity is linked with serum lipid levels not T1-diabetes. J Diabetes Complicat. 2012;26(1):1–9. [DOI] [PubMed] [Google Scholar]
- 146. de Araújo IM, Salmon CEG, Nahas AK, Nogueira-Barbosa MH, Elias J, de Paula FJA. Marrow adipose tissue spectrum in obesity and type 2 diabetes mellitus. Eur J Endocrinol. 2017;176(1):21–30. [DOI] [PubMed] [Google Scholar]
- 147. Patsch JM, Burghardt AJ, Yap SP, et al. Increased cortical porosity in type 2 diabetic postmenopausal women with fragility fractures. J Bone Miner Res. 2013;28(2):313–324. 10.1002/jbmr.1763. [DOI] [PMC free article] [PubMed] [Google Scholar]
- 148. Wu P-H, Joseph G, Saeed I, et al. Bone marrow adiposity alterations in type 2 diabetes are sex-specific and associated with serum lipid levels. J Bone Miner Res. 2023;38(12):1877–1884. 10.1002/jbmr.4931. [DOI] [PMC free article] [PubMed] [Google Scholar]
- 149. Saatmann N, Zaharia O-P, Strassburger K, et al. Physical fitness and cardiovascular risk factors in novel diabetes subgroups. J Clin Endocrinol Metab. 2022;107(4):1127–1139. 10.1210/clinem/dgab810. [DOI] [PMC free article] [PubMed] [Google Scholar]
- 150. Zaharia OP, Strassburger K, Strom A, et al. Risk of diabetes-associated diseases in subgroups of patients with recent-onset diabetes: a 5-year follow-up study. Lancet Diabetes Endocrinol. 2019;7(9):684–694. 10.1016/S2213-8587(19)30187-1. [DOI] [PubMed] [Google Scholar]
- 151. Udler MS, Kim J, von Grotthuss M, et al. Type 2 diabetes genetic loci informed by multi-trait associations point to disease mechanisms and subtypes: a soft clustering analysis. PLoS Med. 2018;15(9):e1002654. 10.1371/journal.pmed.1002654. [DOI] [PMC free article] [PubMed] [Google Scholar]
- 152. Shanbhogue VV, Finkelstein JS, Bouxsein ML, Yu EW. Association between insulin resistance and bone structure in nondiabetic postmenopausal women. J Clin Endocrinol Metab. 2016;101(8):3114–3122. 10.1210/jc.2016-1726. [DOI] [PMC free article] [PubMed] [Google Scholar]
- 153. Ji S, Jiang X, Han H, Wang C, Wang C, Yang D. Prediabetes and osteoporotic fracture risk: a meta-analysis of prospective cohort studies. Diabetes Metab Res Rev. 2022;38(7):e3568. 10.1002/dmrr.3568. [DOI] [PubMed] [Google Scholar]
- 154. Shieh A, Greendale GA, Cauley JA, Karvonen-Gutierrez CA, Karlamangla AS. Prediabetes and fracture risk among midlife women in the study of Women’s health across the nation. JAMA Netw Open. 2023;6(5):e2314835. 10.1001/jamanetworkopen.2023.14835. [DOI] [PMC free article] [PubMed] [Google Scholar]
- 155. ElSayed NA, Aleppo G, Aroda VR, et al. Pharmacologic approaches to glycemic treatment: standards of care in diabetes-2023. Diabetes Care. 2023;46(Supplement_1):S140–S157. 10.2337/dc23-S009. [DOI] [PMC free article] [PubMed] [Google Scholar]
- 156. Daniilopoulou I, Vlachou E, Lambrou GI, et al. The impact of GLP1 agonists on bone metabolism: a systematic review. Medicina. 2022;58(2):224. 10.3390/medicina58020224. [DOI] [PMC free article] [PubMed] [Google Scholar]
Associated Data
This section collects any data citations, data availability statements, or supplementary materials included in this article.
Data Availability Statement
Data available on request. The data underlying this article will be shared on reasonable request to the corresponding author.