

Abstract
Background
Free‐breathing 1H ventilation MRI shows promise but only single‐center validation has yet been performed against methods which directly image lung ventilation in patients with cystic fibrosis (CF).
Purpose
To investigate the relationship between 129Xe and 1H ventilation images using data acquired at two centers.
Study type
Sequence comparison.
Population
Center 1; 24 patients with CF (12 female) aged 9–47 years. Center 2; 7 patients with CF (6 female) aged 13–18 years, and 6 healthy controls (6 female) aged 21–31 years. Data were acquired in different patients at each center.
Field Strength/Sequence
1.5 T, 3D steady‐state free precession and 2D spoiled gradient echo.
Assessment
Subjects were scanned with 129Xe ventilation and 1H free‐breathing MRI and performed pulmonary function tests. Ventilation defect percent (VDP) was calculated using linear binning and images were visually assessed by H.M., L.J.S., and G.J.C. (10, 5, and 8 years' experience).
Statistical Tests
Correlations and linear regression analyses were performed between 129Xe VDP, 1H VDP, FEV1, and LCI. Bland–Altman analysis of 129Xe VDP and 1H VDP was carried out. Differences in metrics were assessed using one‐way ANOVA or Kruskal–Wallis tests.
Results
129Xe VDP and 1H VDP correlated strongly with; each other (r = 0.84), FEV1 z‐score (129Xe VDP r = −0.83, 1H VDP r = −0.80), and LCI (129Xe VDP r = 0.91, 1H VDP r = 0.82). Bland–Altman analysis of 129Xe VDP and 1H VDP from both centers had a bias of 0.07% and limits of agreement of −16.1% and 16.2%. Linear regression relationships of VDP with FEV1 were not significantly different between 129Xe and 1H VDP (P = 0.08), while 129Xe VDP had a stronger relationship with LCI than 1H VDP.
Data Conclusion
1H ventilation MRI shows large‐scale agreement with 129Xe ventilation MRI in CF patients with established lung disease but may be less sensitive to subtle ventilation changes in patients with early‐stage lung disease.
Evidence Level
2
Technical Efficacy
Stage 2
Keywords: ventilation, MRI, xenon‐129, proton, cystic fibrosis
Hyperpolarized (HP) gas MRI using 129Xe or 3He provides ventilation images with signal directly proportional to the density of the inhaled tracer gas. 1 From these images, the proportion of the lung that is nonventilated, known as the ventilation defect percent (VDP), can be calculated. 2 HP gas MRI is highly sensitive to early‐stage lung disease, disease progression and antibiotic treatment in children with CF, it is also repeatable and sensitive to the effects of acute exercise. 3 , 4 , 5 , 6 , 7 Nevertheless, HP gas MRI is not yet widely available and requires additional equipment that is costly.
Free‐breathing 1H MRI can produce surrogate maps of ventilation without the use of a contrast agent. 8 1H ventilation metrics correlate strongly with lung clearance index (LCI), show good short‐term reproducibility, and can detect ventilation changes following antibiotic treatment in children with cystic fibrosis (CF). 9 , 10 , 11 However, only single‐center validation has been performed against methods which directly image lung ventilation in patients with CF. 11 , 12 , 13
Recent work comparing 129Xe and free‐breathing 1H ventilation MRI in children with CF showed that 129Xe and 1H VDP were both significantly greater in CF patients undergoing pulmonary exacerbation than healthy controls, but no significant difference was found between clinically stable CF patients with normal forced expiratory volume in 1 second (FEV1) and controls. 12 Another study from the same site found that both 129Xe and 1H VDP decreased significantly following antibiotic treatment in eight children with CF. 11 In both studies 1H VDP of the single coronal slice acquired with 1H free‐breathing MRI correlated with 129Xe VDP, lung clearance index (LCI) and forced expiratory volume in 1 second (FEV1). Eight children with CF were also included in a larger study (including 20 patients with chronic obstructive pulmonary disease (COPD) and 6 healthy volunteers) comparing free‐breathing 129Xe and 1H ventilation MRI that found a close relationship between the imaging techniques. 13
It is increasingly recognized that multiple‐center studies and standardization of imaging techniques and outcome metrics are essential to transition novel imaging techniques such as 129Xe and 1H ventilation MRI into tools which can be employed for international clinical research and drug development. 14 , 15
The aim of this work was to investigate the relationship between 129Xe and 1H ventilation images across the whole lungs of patients with a broad spectrum of CF lung disease, using data acquired at two centers.
Methods
Center 1: University of Sheffield, UK
The study was approved by the Yorkshire and the Humber ‐ Leeds West research ethics committee (16/YH/03391). All adult patients and parents/guardians of children provided written informed consent.
Center 2: Hannover Medical School, Germany
The study was approved by the institutional review board of Hannover Medical School. All adults and parents/guardians of children provided written informed consent.
Center 1
Inclusion criteria: patients with CF older than 5 years who were clinically stable for 4 weeks prior to scanning. Exclusion criteria: FEV1 < 30% predicted within the previous 6 months, MRI contraindication or pregnancy.
Center 2
Patients with CF, inclusion criteria: diagnosis of CF and aged 12–60 years. Exclusion criteria: respiratory tract exacerbation within the last month, chronic oxygen therapy, any other severe comorbidities that could limit imaging, MRI contraindication or pregnancy.
Healthy controls, inclusion criteria: aged 18–60 years. Exclusion criteria: lung disease within the last month, known history of chronic lung disease, known history of congenital lung disease, MRI contraindication or pregnancy.
Center 1
A total of 24 patients with CF were scanned using a 1.5 T wholebody MRI system (GE Signa HDx, Milwaukee, WI). Patients underwent spirometry, multiple breath washout and body plethysmography on the same day.
Center 2
Seven patients with CF and six healthy volunteers were scanned using a 1.5 T whole‐body MRI system (Siemens Avanto, Erlangen, Germany). Patients performed spirometry and body plethysmography on the same day, healthy volunteers performed spirometry on the same day.
129Xe Ventilation MRI
CENTER 1
Patients were positioned supine in a 129Xe transmit‐receive coil (Clinical MR Solutions, Brookfield, WI). A mix (0.50–1 L) of hyperpolarized 129Xe (~25% polarization, 86% 129Xe, 0.35–0.5 L) and N2 was inhaled from functional residual capacity (FRC), with inhaled gas volumes determined by patient height (details in the online repository [OR] Supplementary material S1; Table 1). Ventilation images were acquired during breath‐hold directly after inhalation of the 129Xe and N2 mixture using a 3D coronal steady‐state free precession (SSFP) sequence with full lung coverage (voxel size = 3.5 × 3.5 × 10 mm to 4.5 × 4.5 × 10 mm, flip angle = 10°, echo time (TE)/repetition time (TR) = 2.2/6.7 msec, bandwidth (BW) = 16 kHz, duration = 14 seconds; Table 1). 16
TABLE 1.
Ventilation Sequence Parameters
| Center 1 | Center 2 | |||
|---|---|---|---|---|
| Parameter (unit) | 129Xe Ventilation | 1H PREFUL | 129Xe Ventilation | 1H PREFUL |
| Sequence | 3D SSFP | 2D SPGR | 3D SSFP | 2D SPGR |
| Coverage | Full lung | Seven coronal slices | Full lung | Seven coronal slices |
| Slice thickness (mm) | 10 | 15 | 15 | 15 |
| Slice gap (mm) | 0 | 5 | 0 | 0 or 5 |
| Matrix | 100 × 80 | 128 × 128 | 96 × 96 | 128 × 128 |
| FOV (cm) | 35–45 | 48 | 38.4 | 38–50 |
| Flip angle (°) | 10 | 4 | 10 | 5 |
| TE (msec) | 2.2 | 0.8 | 1.72 | 0.82–0.88 |
| TR (msec) | 6.7 | 2.5 | 3.57 | 3.0 |
| Bandwidth (kHz) | 16 | 167 | 50 | 192 |
| Temporal resolution (seconds) | N/A | 0.37 | N/A | 0.19 |
| Acquisition time (seconds) | 14 | 648 | 5.8 | 333 |
FOV = field of view; SSFP = steady‐state free precession; SPGR = spoiled gradient echo; N/A = not applicable.
1H anatomical images of the same imaging volume were acquired with the in‐built transmit‐receive body coil (GE, Milwaukee, WI) using a 3D spoiled gradient echo sequence (voxel size = 3.5 × 3.5 × 5 mm to 4.5 × 4.5 × 5 mm, flip angle = 5°, TE/TR = 0.6/1.9 msec, BW = 167 kHz, duration = 4 seconds).
CENTER 2
Subjects were positioned supine in a linearly polarized 129Xe birdcage transmit coil and 16‐channel receive coil (Rapid Biomedical, Rimpar, Germany). A mix (1 L) of hyperpolarized 129Xe (~20%–30% polarization, 87%–92% 129Xe, 0.45–0.9 L) and N2 was inhaled from FRC, with gas volumes determined by patient age and height (details in the OR of the Supplementary material S1). Ventilation images were acquired during breath‐hold directly after inhalation of the 129Xe and N2 mixture using a 3D coronal SSFP sequence with full lung coverage (voxel size = 4.0 × 4.0 × 15 mm, flip angle = 10°, TE/TR = 1.72/3.57 msec, BW = 50 kHz, duration = 5.8 seconds; Table 1). The sequence used a stack of stars trajectory with 90 spokes per k‐space partition and symmetric readout. Gradient delay correction was performed assuming an isotropic delay using the method described by Herrmann et al. 17 Relative coil sensitivities were estimated from the central portion of k‐space and images reconstructed using the parallel imaging/compressed sensing routine in the Berkeley Advanced Reconstruction Toolbox after Fourier transformation of data along the slice direction. 18
1H anatomical images of the same imaging volume were acquired with the in‐built transmit‐receive body coil (Siemens) using a 3D spoiled gradient echo sequence (voxel size = 2.6 × 2.6 × 5 mm, flip angle = 5°, TE/TR = 0.99/3 msec, BW = 106.56 kHz, duration = 16 seconds).
Free‐Breathing 1H MRI
CENTER 1
Patients were positioned supine in an eight‐element chest array (GE) and 250 dynamic images per slice were acquired during relaxed free‐breathing using a 2D spoiled gradient echo (SPGR) sequence with seven coronal slices centered on the carina (voxel size = 3.75 × 3.75 × 15 mm with 5 mm slice gap, flip angle = 4°, TE/TR = 0.8/2.5 msec, BW = 167 kHz, temporal resolution = 0.37 seconds, duration = 648 seconds; Table 1).
CENTER 2
Patients were positioned supine in a six‐element chest array (Siemens Healthcare) and 250 dynamic images per slice were acquired during relaxed free‐breathing using a 2D spoiled gradient echo (SPGR) sequence with seven coronal slices centered on the carina (voxel size = 2.97 × 2.97 × 15 mm to 3.9 × 3.9 × 15 mm with 0 mm or 5 mm slice gap, flip angle = 5°, TE = 0.82–0.88 msec, TR = 3 msec, BW = 192 kHz, generalized auto‐calibrated partially parallel acquisitions (GRAPPA) R = 2, temporal resolution = 0.19 seconds, duration = 333 seconds; Table 1). 19
Image Analysis
Phase‐resolved functional lung (PREFUL) analysis was performed on the free‐breathing 1H images from both centers, as detailed by Voskrebenzev et al, and included registration, low‐pass filtering and calculation of fractional ventilation. 20 PREFUL analysis of center 1 data was performed at center 1 using code provided by center 2. PREFUL analysis of center 2 data was performed at center 2.
All further image analysis took place at center 1. The 1H anatomical images of the same imaging volume as the 129Xe ventilation images were registered to the 129Xe ventilation images using a supervised approach, that selects preregistered images, within a set computed by an in‐house software written in MATLAB (Mathworks, Natick, MA), or manually registered images, using the open‐source software itksnap, when the alignment of the automatically registered images is not satisfactory (assessed by A.M.B., 5 years' experience). 21 In order to assist segmentation, for each PREFUL image slice, a 1H free‐breathing image corresponding to inspiration (i.e. with low signal in the lung parenchyma to provide high contrast at the lung boundary) was chosen manually for segmentation by H.M. (10 years' experience). Registration had previously been performed on these 1H free‐breathing images as part of the PREFUL reconstruction and so they were intrinsically registered to the PREFUL ventilation images. 20
VDP (regions with no ventilation) and low ventilation percent (LVP, regions with reduced ventilation) were calculated from the 129Xe and PREFUL ventilation images in the same manner. The co‐registered ventilation and anatomical images were segmented automatically using spatial fuzzy C‐means thresholding to produce initial lung cavity masks that were then edited manually to remove the large airways and main vessels, and correct any segmentation errors (by L.J.S., 5 years' experience for the 129Xe images and H.M., 10 years' experience for the PREFUL images). 22 Large vessels were excluded where they were visible in the anatomical 1H images. Linear binning of the ventilation images was performed with six bins on N4 bias‐field‐corrected images scaled by the mean signal inside the lung cavity mask. 23 , 24 , 25 The resulting ventilation defect region (first bin, with signal <1/3) was used to calculate VDP and the low ventilation region (second bin, with signal <2/3) was used to calculate LVP. 23 VDP and LVP were added to generate VDP + LVP, a further metric of abnormal ventilation. Ventilation images were assessed qualitatively by H.M., L.J.S., and G.J.C. (10, 5, and 8 years' experience, respectively).
Pulmonary Function Tests
At both centers, spirometry and body plethysmography were performed to international standards using recommended reference equations. 26 , 27 , 28 At center 1 only, multiple breath washout was performed using a modified open‐circuit Innocor (Innovision, Glamsbjerg, Denmark) and 0.2% sulfur hexafluoride (SF6). 29
Statistical Analysis
Statistical analysis was carried out using GraphPad Prism (San Diego, CA). The normality of data was assessed using a Shapiro–Wilk normality test and data were treated appropriately. Correlations between metrics were performed, and Bland–Altman analysis was used to assess agreement between 129Xe and 1H VDP, including in subgroups of CF patients with 129Xe VDP < 10%, with normal FEV1 and with abnormal FEV1. A P‐value < 0.05 was considered significant. To test whether 1H ventilation imaging was noninferior to 129Xe ventilation imaging, equivalence tests were performed using Wilcoxon matched‐pairs signed rank tests on the 1H and 129Xe VDP of patients with CF, with the equivalence margin set to the minimum difference to be considered real based on same‐day repeatability of 129Xe VDP in patients with CF; 1.6%. 7 , 30 , 31 Linear regression was performed between FEV1 and imaging metrics, and between LCI and imaging metrics. The slopes of the 129Xe metric relationships with PFTs and the 1H metric relationships with PFTs were tested for significant difference. One‐way ANOVA with Tukey tests for multiple comparisons or Kruskal–Wallis tests with Dunn's multiple comparison tests were used to assess the differences in metrics between CF patients scanned at center 1, CF patients scanned at center 2, and controls scanned at center 2. Unpaired t‐tests or Mann–Whitney tests were used to assess differences between patients with a large disparity in 129Xe and 1H VDP values and those without, by applying a threshold of 5% absolute difference between 129Xe VDP and 1H VDP.
Results
A total of 24 patients with CF (aged 9–47, median 20.6 years) were scanned at center 1. Seven patients with CF (aged 13–18, median 14.8 years) and six healthy volunteers (aged 21–31, median 24.0 years) were scanned at center 2. Patient demographics, pulmonary function test, and MRI metrics are shown in Table 2. FEV1 z‐score, 129Xe VDP, 1H VDP, 129Xe VDP + LVP, and 1H VDP + LVP were significantly different between CF patients scanned at center 1 and controls but not between CF patients scanned at center 2 and controls (P = 0.08, P = 0.37, P = 0.21, P = 0.23, and P = 0.05, respectively). 129Xe LVP and 1H LVP were significantly greater for CF patients scanned at center 2 than controls. 129Xe LVP was significantly lower for patients scanned at center 1 than patients scanned at center 2.
TABLE 2.
Patient Demographics, Pulmonary Function Test and Ventilation MRI Metrics
| Measure (units) | CF Patients, Center 1 | CF Patients, Center 2 | Controls, Center 2 |
|---|---|---|---|
| n subjects (n female) | 24 (12) | 7 (6) | 6 (6) |
| Age (years) | 23.3 + 10.2 | 15.4 + 2.0 | 25.8 + 4.4 |
| Height (cm) | 163.7 + 12.7 | 161.1 + 6.4 | 170.2 + 8.6 |
| FEV1 z‐score | −2.29 + 1.91 a | −2.26 + 1.42 | −0.13 + 0.88 a |
| RV/TLC (%) | 32.7 (17.8, 57.6) | 31.5 + 10.2 | ‐ |
| LCI | 8.79 (6.57, 22.2) | ‐ | ‐ |
| 129Xe VDP (%) | 9.9 (1.1, 44.5) a | 2.8 + 3.4 | 0.005 (0, 0.09) a |
| 1H VDP (%) | 13.6 + 10.7 a | 10.6 + 7.6 | 1.6 + 0.7 a |
| 129Xe LVP (%) | 12.2 + 2.3 b | 17.1 + 6.2 b , c | 11.8 + 2.9 c |
| 1H LVP (%) | 15.3 (11.5, 24.8) | 18.3 + 3.6 c | 12.2 + 3.1 c |
| 129Xe VDP + LVP (%) | 25.2 (10.6, 54.6) a | 19.9 + 8.9 | 11.8 + 2.9 a |
| 1H VDP + LVP (%) | 29.9 + 12.5 a | 28.9 + 10.0 | 13.9 + 3.5 a |
Significant difference between CF patients at center 1 and controls.
Significant difference between CF patients at center 1 and CF patients at center 2.
Significant difference between CF patients at center 2 and controls.
n = number; FEV1 = forced expiratory volume in 1 second; RV = residual volume; TLC = total lung capacity; LCI = lung clearance index; VDP = ventilation defect percent; LVP = low ventilation percent.
Presented as mean ± SD for normally distributed data and median (minimum, maximum) for non‐normally distributed data.
Comparisons Between 129Xe VDP, 1H VDP, FEV1 , and LCI
There were significant correlations between 129Xe VDP and 1H VDP (center 1: r = 0.89, center 2: r = 0.75, and centers 1 and 2: r = 0.84; Fig. 1, Table 3). FEV1 z‐score correlated with both 129Xe VDP and 1H VDP (Table 3). LCI (measured at center 1 only) correlated with 129Xe VDP (r = 0.91) and 1H VDP (r = 0.82). There were also correlations between 129Xe VDP + LVP and 1H VDP + LVP (center 1: r = 0.88, center 2: r = 0.73, and centers 1 and 2: r = 0.81; Table 3; OR Fig. S3) and of 129Xe VDP + LVP and 1H VDP + LVP with FEV1 z‐score and LCI. The correlations of 129Xe LVP and 1H LVP with other metrics, and between themselves, were not consistent between centers (OR Table S3).
FIGURE 1.

(Top row) correlation plots and (bottom row) Bland–Altman plots between 129Xe and 1H VDP for (a, b) center 1, (c, d) center 2, and (e, f) both centers (black = center 1, grey = center 2). In the correlation plots, the lines of best fit are indicated as a solid line and the lines of identity as a dashed line. In the Bland–Altman plots, bias is indicated as a solid line and limits of agreement as dashed lines.
TABLE 3.
Correlations of 129Xe VDP and 1H VDP, 129Xe VDP + LVP and 1H VDP + LVP with FEV1 z‐score, LCI and Each Other
| Metric 1 | Metric 2 | r | P | |
|---|---|---|---|---|
| Center 1 | 129Xe VDP | 1H VDP | 0.89 | 4.9 × 10⁻⁹ |
| 129Xe VDP | FEV1 z‐score | −0.83 | 4.9 × 10⁻⁷ | |
| 129Xe VDP | LCI | 0.91 | 5.7 × 10⁻¹⁰ | |
| 1H VDP | FEV1 z‐score | −0.78 | 2.0 × 10⁻⁵ | |
| 1H VDP | LCI | 0.82 | 1.1 × 10⁻⁶ | |
| 129Xe VDP + LVP | 1H VDP + LVP | 0.88 | 1.8 × 10⁻⁸ | |
| 129Xe VDP + LVP | FEV1 z‐score | −0.90 | 1.7 × 10⁻⁹ | |
| 129Xe VDP + LVP | LCI | 0.93 | 2.7 × 10⁻¹¹ | |
| 1H VDP + LVP | FEV1 z‐score | −0.78 | 8.1 × 10⁻⁶ | |
| 1H VDP + LVP | LCI | 0.82 | 9.0 × 10⁻⁷ | |
| Center 2 | 129Xe VDP | 1H VDP | 0.75 | 0.005 |
| 129Xe VDP | FEV1 z‐score | −0.70 | 0.01 | |
| 1H VDP | FEV1 z‐score | −0.85 | 3.9 × 10⁻⁴ | |
| 129Xe VDP + LVP | 1H VDP + LVP | 0.73 | 0.005 | |
| 129Xe VDP + LVP | FEV1 z‐score | −0.51 | 0.08 | |
| 1H VDP + LVP | FEV1 z‐score | −0.78 | 0.002 | |
| Centers 1 and 2 | 129Xe VDP | 1H VDP | 0.84 | 6.3 × 10⁻¹¹ |
| 129Xe VDP | FEV1 z‐score | −0.75 | 9.8 × 10⁻⁸ | |
| 1H VDP | FEV1 z‐score | −0.80 | 2.6 × 10⁻⁹ | |
| 129Xe VDP + LVP | 1H VDP + LVP | 0.81 | 1.0 × 10⁻⁹ | |
| 129Xe VDP + LVP | FEV1 z‐score | −0.77 | 3.1 × 10⁻⁸ | |
| 1H VDP + LVP | FEV1 z‐score | −0.77 | 2.3 × 10⁻⁸ |
For data acquired at center 1, mean 1H VDP was lower than mean 129Xe VDP with a bias of 2.8% and limits of agreement at −13.7% and 19.3% (Fig. 1b). For data acquired at center 2, mean 1H VDP was higher than mean 129Xe VDP with a bias of −4.9% and limits of agreement at −14.9% and 5.1% (Fig. 1d). When the data from both centers were pooled the bias was 0.07% and limits of agreement were −16.1% and 16.2% (Fig. 1f). When compared to 129Xe VDP, 1H ventilation MRI tended to overestimate VDP for milder disease and underestimate VDP for more severe disease. These trends were not apparent when LVP and VDP were combined (OR Fig. S3). Bland–Altman analysis between 129Xe VDP + LVP and 1H VDP + LVP showed similar magnitudes of bias and limits of agreement, with mean 1H VDP + LVP greater than mean 129Xe VDP + LVP at center 1, at center 2 and when the data from both centers were combined (OR Fig. S3).
All data acquired at center 2 had 1H VDP greater than 129Xe VDP and a trend toward increased bias for larger VDP (Fig. 1c). The bias and limits of agreement were larger for patients with CF (Fig. 2b) than healthy controls (Fig. 2c). All patients scanned at center 2 had 129Xe VDP < 10%. Patients scanned at center 1 with 129Xe VDP < 10% also showed a negative bias (Fig. 2d), although the magnitude of the bias was less than at center 2 (Fig. 2e). There were significant correlations between 129Xe VDP and 1H VDP for patients with 129Xe VDP < 10% (center 1: r = 0.73, centers 1 and 2: r = 0.56) (Table 4).
FIGURE 2.

Bland–Altman plots between 129Xe and 1H VDP for (a) CF patients at center 1, (b) CF patients at center 2, (c) healthy controls at center 2, (d) CF patients at center 1 with 129Xe VDP < 10%, (e) CF patients at center 2 with 129Xe VDP < 10%, and CF patients at both centers with 129Xe VDP < 10% (black = center 1, grey = center 2). Bias is indicated as a solid line and limits of agreement as dashed lines.
TABLE 4.
Correlations of 129Xe VDP and 1H VDP for CF Patients at Each Center and With Data Pooled and for Sub‐Groups of CF Patients With 129Xe VDP < 10%, With Normal FEV1 and With Abnormal FEV1
| Center(s) | Age (years) | Number of Patients | r | P | |
|---|---|---|---|---|---|
| All CF patients | 1 | 20.6 (9.6, 47.5) | 24 | 0.89 | 4.9 × 10⁻⁹ |
| 2 | 14.8 (13.3, 18.4) | 7 | ‐ | ‐ | |
| 1 and 2 | 17.7 (9.6, 47.5) | 31 | 0.82 | 1.6 × 10⁻⁸ | |
| CF patients with 129Xe VDP < 10% | 1 | 21.0 (9.6, 33.2) | 12 | 0.73 | 0.007 |
| 2 | 14.8 (13.3, 18.4) | 7 | ‐ | ‐ | |
| 1 and 2 | 17.1 (9.6, 33.2) | 19 | 0.56 | 0.012 | |
| CF patients with normal FEV1 | 1 | 21.0 (9.6, 33.2) | 12 | 0.73 | 0.007 |
| 2 | 17.3 (14.8, 18.4) | 3 | ‐ | ‐ | |
| 1 and 2 | 18.2 (9.6, 33.2) | 15 | 0.72 | 0.003 | |
| CF patients with abnormal FEV1 | 1 | 20.4 (12.0, 47.5) | 12 | 0.49 | 0.10 |
| 2 | 13.9 (13.3, 16.2) | 4 | ‐ | ‐ | |
| 1 and 2 | 17.0 (12.0, 47.5) | 16 | 0.61 | 0.013 |
Dash indicates that correlation was not performed due to low patient numbers. Age shown as median (range).
At center 1, the patients with 129Xe VDP < 10% were the same as the patients with normal FEV1. Bland–Altman analysis of patients with normal FEV1 showed a negative bias (OR Fig. S2a–c) and there were significant correlations between 129Xe VDP and 1H VDP (center 1: r = 0.73, centers: 1 and 2 r = 0.72) (Table 4). Patients with abnormal FEV1 from center 1 (who all had 129Xe VDP > 10%) showed a bias of 6.9% (Supplementary OR Fig. S2d) while patients with abnormal FEV1 from center 2 (who all had 129Xe VDP < 10%) showed a bias of −11.3% (Supplementary OR Fig. S2e). Pooled data showed larger limits of agreement for patients with abnormal FEV1 (−21.1%, 25.9%) (Supplementary OR Fig. S2f) than patients with normal FEV1 (−7.8, 4.3) (Supplementary OR Fig. S2c). There were significant correlations between 129Xe VDP and 1H VDP for patients with abnormal FEV1 when data from both centers were pooled (r = 0.61) but not for patients with abnormal FEV1 scanned at center 1 alone (r = 0.49, P = 0.1) (Table 4).
The 90% confidence intervals of the equivalence test between 1H and 129Xe VDP using all data from patients with CF were −3.1% and 2.3%. As these values fell outside the equivalence margins (−1.6%, 1.6%), equivalence between 1H and 129Xe VDP could not be established. 30 The 90% confidence intervals of the equivalence tests also fell outside the equivalence margins (−1.6%, 1.6%) for CF patients with VDP < 10% (1.7%, 5.8%), normal FEV1 (0.3%, 3.1%) and abnormal FEV1 (−7.7, 2.9).
There were nine patients with absolute difference between 129Xe VDP and 1H VDP of more than 5%. These patients had significantly larger 1H VDP, worse FEV1 and were shorter than the other patients. 129Xe VDP (P = 0.13), age (P = 0.08), and RV/TLC (P = 0.24) were not significantly different between the groups (Supplementary OR Table S4).
The relationships of VDP with FEV1 and LCI are shown in Fig. 3. The slopes of 129Xe VDP with FEV1 (−6.10) and 1H VDP with FEV1 (−4.42) were not significantly different (P = 0.08). The slope of 129Xe VDP with LCI (3.27) was significantly greater than the slope of 1H VDP with LCI (1.82). The slopes of VDP + LVP with FEV1 and VDP + LVP with LCI were not significantly different for 129Xe and 1H (P = 0.52 and P = 0.14, respectively, Supplementary OR Fig. S4 and OR Table S5). While 1H LVP had significantly stronger relationships with FEV1 and LCI than 129Xe LVP had with FEV1 and LCI (Supplementary OR Fig. S4 and OR Table S5).
FIGURE 3.
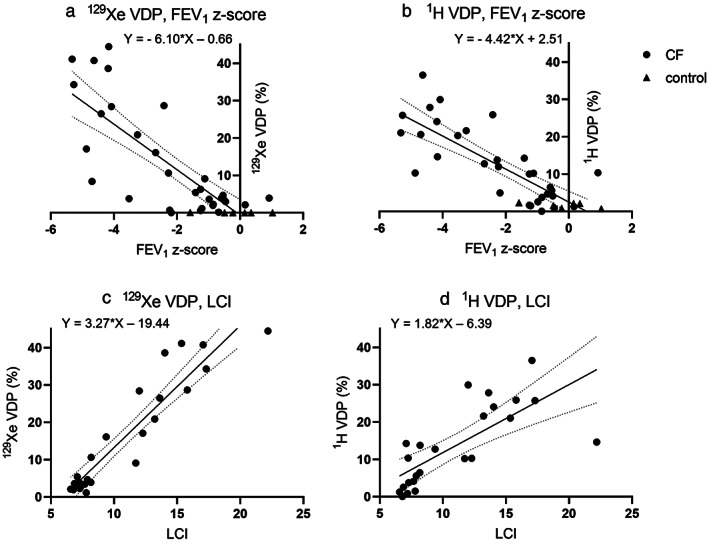
Linear regression results; (a) 129Xe VDP with FEV1 z‐score, (b) 1H VDP with FEV1 z‐score, (c) 129Xe VDP with LCI, and (d) 1H VDP with LCI. All slopes were significantly greater than zero (P < 0.0001).
Similarities and Differences Between 129Xe and 1H Ventilation Images
Ventilation images of controls were mostly uniform with more ventilation heterogeneity in 1H ventilation images than in 129Xe ventilation images (Fig. 4). In most cases, regions of 1H VDP in controls were adjacent to vessels (Fig. 4c) and the heart, however, some were not (Fig. 4b). In one control with FEV1 z‐score at the low end of normal (−1.58), both 129Xe and 1H ventilation images showed abnormalities in the posterior right lung (Fig. 4d). There were five controls where ventilation defects were seen on 1H ventilation images but not on 129Xe ventilation images.
FIGURE 4.

129Xe and 1H ventilation images from four controls; (a) FEV1 z‐score = 1.03, 129Xe VDP = 0.00%, 1H VDP = 0.7%, (b) FEV1 z‐score = −0.23, 129Xe VDP = 0.01%, 1H VDP = 0.9%, (c) FEV1 z‐score = 0.15, 129Xe VDP = 0.03%, 1H VDP = 2.1%, and (d) FEV1 z‐score = −1.58, 129Xe VDP = 0.09%, 1H VDP = 2.4%. Ventilation binning maps are shown with red = ventilation defect percent (VDP), orange = low ventilation percent (LVP), green = normal ventilation, blue = hyperventilation, brown = major airways. All images were acquired at center 2.
Figure 5 shows images from CF patients with normal FEV1 and Fig. 6 shows images from CF patients with abnormal FEV1. Regions of reduced 1H ventilation were often associated with 129Xe ventilation defects or heterogeneity but did not always capture their full extent or detailed patterns evident on 129Xe images. In general, 1H ventilation defects tended to be larger than 129Xe ventilation defects (Figs. 5b,d and 6c). There were regional similarities and differences between 129Xe and 1H ventilation images, but the distribution of medium‐to‐large scale ventilation abnormalities throughout the lungs was generally similar. There were five CF patients with normal FEV1 where small ventilation abnormalities (fully unventilated and partially ventilated) were observed in 129Xe ventilation images without corresponding regions of low or no ventilation present in 1H ventilation images (Fig. 5a). There was one patient with abnormal FEV1 where no ventilation defects were observed on 129Xe ventilation images and minimal ventilation defects were seen on 1H images.
FIGURE 5.

129Xe and 1H ventilation images from four CF patients with normal FEV1; (a) FEV1 z‐score = 0.16, LCI = 6.6, 129Xe VDP = 2.1%, 1H VDP = 1.3%, center 1, (b) FEV1 z‐score = −0.59, LCI = 8.2, 129Xe VDP = 3.9%, 1H VDP = 6.5%, center 1, (c) FEV1 z‐score = −1.25, 129Xe VDP = 6.3%, 1H VDP = 10.0%, center 2, and (d) FEV1 z‐score = −0.68, 129Xe VDP = 0.1%, 1H VDP = 4.7%, center 2. Ventilation binning maps are shown with red = ventilation defect percent (VDP), orange = low ventilation percent (LVP), green = normal ventilation, blue = hyperventilation, brown = major airways.
FIGURE 6.

129Xe and 1H ventilation images from four CF patients with abnormal FEV1; (a) FEV1 z‐score = −4.18, LCI = 14.0, 129Xe VDP = 38.6%, 1H VDP = 24.1%, center 1, (b) FEV1 z‐score = −4.16, LCI = 22.2, 129Xe VDP = 44.5%, 1H VDP = 14.6%, center 1, (c) FEV1 z‐score = −2.23, 129Xe VDP = 0.7%, 1H VDP = 12.0%, center 2, and (d) FEV1 z‐score = −3.52, 129Xe VDP = 3.8%, 1H VDP = 20.3%, center 2. Ventilation binning maps are shown with red = ventilation defect percent (VDP), orange = low ventilation percent (LVP), green = normal ventilation, blue = hyperventilation, brown = major airways.
Discussion
Analyses of VDP and VDP + LVP show strong relationships between 129Xe and 1H ventilation images and with LCI and FEV1. Data were acquired at two centers from different cohorts of patients, and image analysis was standardized and performed at a single center. In linear regression analyses, relationships of VDP and VDP + LVP with FEV1 were not significantly different for 129Xe and 1H ventilation imaging, although 129Xe VDP had a significantly stronger relationship with LCI than 1H VDP had with LCI. There were small‐to‐moderate differences in VDP between 129Xe and 1H images for most subjects; however, there were some cases with substantially greater differences in VDP. Patients with greater differences between 129Xe and 1H VDP had higher 1H VDP, worse FEV1 and were shorter than patients with smaller differences in VDP. In patients with milder disease (VDP < 10% and normal FEV1) 1H ventilation MRI overestimated VDP, while in patients with more severe disease (abnormal FEV1) the relationship was less clear with underestimation of VDP at center 1 and overestimation of VDP at center 2. Qualitatively, although the appearance and exact location of ventilation defects differed between 129Xe and 1H ventilation images, larger scale ventilation patterns tended to be similar, that is, the agreement between techniques was greater for larger defects. However, statistical analysis found that 1H and 129Xe VDP could not be considered equivalent. The five cases (16% of the CF cohort) where small defects and ventilation heterogeneity present on the 129Xe ventilation images of CF patients with normal FEV1 were not detected by 1H ventilation imaging are suggestive that 129Xe ventilation imaging is more sensitive to early‐stage lung disease than 1H ventilation imaging. The 1H ventilation defects present in controls, albeit amounting to 1H VDPs of less than 2.5% in all controls, which tended to be adjacent to vessels, show that 1H ventilation imaging may have a higher susceptibility to false positive ventilation defects than 129Xe ventilation imaging. While medium‐sized vessels can cause reduced signal due to partial‐volume effects in 129Xe ventilation images, medium‐sized vessels appear to have a greater influence on 1H ventilation images, which can result in reduced or no signal. Regions of VDP where there was a vessel present on the matching anatomical image were removed for both 129Xe and 1H ventilation images, but sometimes ventilation defects adjacent to vessels or in the shape and potential location of vessels remained on 1H ventilation images contributing to VDP. Other studies have also reported 1H VDP in healthy volunteers despite removal of the large vessels during image analysis. 13 , 32 Recently, more extensive vessel segmentation using an automatic deep learning method was found to reduce 1H VDP and increase its reproducibility. 33 Improved vessel segmentation such as this could be implemented to reduce this source of error for 1H ventilation in the future.
Differences between the ventilation imaging techniques are likely due in part to the fundamentally different sources of image contrast; inhaled 129Xe gas density and 1H signal modulation due to respiratory motion. Other factors include differing voxel size, lung coverage, lung volumes during image acquisition and some error in the matching of image planes for visual comparison. The lung volume during image acquisition was greater for 129Xe than 1H ventilation imaging (FRC plus 0.5–1 L for 129Xe and tidal breathing for 1H), and this is known to affect the appearance of ventilation defects due to airway closure/opening at lower and higher lung volumes, respectively. 34 Most 1H ventilation images were acquired with a 5 mm gap between slices to reduce overall acquisition time, in contrast to the full lung coverage of 129Xe ventilation images, however, recently developed 3D 1H ventilation imaging techniques could now be applied to provide full lung coverage and increased spatial resolution with 1H ventilation imaging. 35 Key differences in imaging techniques between the two centers were higher spatial resolution 129Xe images at center 1, a radial stack of stars k‐space trajectory at center 2 compared to a Cartesian k‐space trajectory at center 1, and the application of parallel imaging for 1H ventilation imaging at center 2 while auto‐calibrated parallel imaging was not available on the MRI system used at center 1. The scanners at the two centers were also made by different vendors. The thinner slices used for 129Xe ventilation imaging at center 1 may have contributed to higher mean 129Xe VDP than mean 1H VDP due to the reduction in partial volume effects with decreasing slice thickness, while at center 2 where both techniques used the same slice thickness mean 129Xe VDP was lower than mean 1H VDP.
The application of linear binning in the image analysis allowed user‐independent evaluation of VDP with both techniques treated equally. Partially ventilated defects often present in CF patients with milder lung disease were classified as LVP; however, the relationships of LVP with VDP, LCI and FEV1 were unclear particularly for 129Xe LVP. This is likely due to signal loss due to partial volume effects and reduced coil sensitivity also contributing to LVP. Despite this, combining LVP with VDP gave an additional metric of ventilation abnormality, which had strong correlations with LCI and FEV1, and showed significant differences between controls and CF patients. 1H ventilation MRI systematically overestimated VDP + LVP compared to 129Xe ventilation MRI, but there was no trend toward overestimation of VDP + LVP for milder disease and underestimation for more severe disease as was observed for VDP. VDP + LVP was not as specific as VDP, that is, the values were non‐negligible for controls due to the LVP caused by imaging effects rather than disease, but included the partially ventilated regions, which are often seen in patients with mild disease.
This dual‐center study using alike, but not identical, imaging techniques and systems at two centers, found comparable relationships between 129Xe and 1H ventilation images, showing the potential for multi‐site studies which will be necessary for these ventilation imaging techniques to be employed in large‐scale clinical research and drug development studies. Standardization of some of the imaging parameters was not possible due to the different imaging platforms at the two sites; however, image analysis was fully standardized in this study which was enabled by center 2 sharing PREFUL analysis code with center 1 and the remaining data analysis being performed by center 1.
The correlations observed between 1H VDP and 129Xe VDP, LCI and FEV1 were stronger than in previously published work and Bland–Altman bias and limits of agreement between 1H VDP and 129Xe VDP were smaller. 11 , 12 This could be due to considering the whole lungs when compared to a single slice, different acquisition parameters, field strengths and/or variations in calculating VDP between the studies. The studies also included different patient groups; clinically stable patients with CF and a broad range of disease severity in the current study (median age = 17.7 years, 55% were children), vs. children with CF undergoing pulmonary exacerbations in the study by Couch et al and Munidasa et al and clinically stable children with CF and normal FEV1 in Couch et al. Previous work has shown correlations of varying strength between free‐breathing 1H ventilation imaging and gas ventilation MRI (HP 3He, HP 129Xe and 19F dynamic washout) in patients with COPD, bronchiectasis, asthma and non‐small cell lung cancer. 13 , 36 , 37 , 38 , 39
Limitations
The CF cohorts were not well‐matched physiologically between the two sites. Despite no significant differences in age, height, FEV1 z‐score or RV/TLC between the two cohorts, only center 1 enrolled patients older than 18 years who would likely have more progressive, severe disease. The group of patients scanned at center 2 had a higher proportion of females than the group of patients scanned at center 1, and there were no healthy controls scanned at center 1. The small number of healthy controls and patients scanned at center 2 is also a limitation. The small sample sizes were a limitation for the statistical methods used. Differences in spatial resolution, lung coverage and lung volumes during image acquisition between 129Xe and 1H MRI, and between centers, are limitations in the context of a truly matched comparison between techniques and sites.
Conclusions
Ventilation defect percentage calculated from 1H free‐breathing MRI showed strong correlations with 129Xe VDP, LCI and FEV1 in CF patients and controls scanned at two centers. When the data from both centers were pooled, bias between 1H VDP and 129Xe VDP was minimal and limits of agreement were moderately large. On a regional level, both similarities and differences between 129Xe and 1H ventilation images were observed across the range of disease severity but whole lung patterns of ventilation abnormality were similar in general. Some small defects and patchy ventilation heterogeneity observed in early‐stage CF lung disease on 129Xe ventilation images were not visualized with 1H ventilation MRI. Furthermore, imaging acquisition and analysis protocols were standardized between two centers (within MRI system capabilities). In summary, this study supports the potential use of 1H ventilation MRI in children and adults with CF.
Supporting information
Appendix S1 Supporting Information
Figure S1 Image analysis workflow. (Top left) for 129Xe ventilation analysis, the best‐matching registered 1H anatomical images were chosen. (Bottom left) for 1H ventilation analysis, PREFUL analysis was performed to produce 1H ventilation images and a 3D 1H anatomical image volume was built from inspiratory images. (Right) Linear binning was performed on the 129Xe and PREFUL ventilation images and their matching 1H anatomical images in the same manner. lce = lung cavity estimation, N4 = N4 bias field correction.
Figure S2 Bland–Altman plots between 129Xe and 1H VDP for CF patients with; (a) normal FEV1 at center 1, (b) normal FEV1 at center 2, (c) normal FEV1 at both centers (black = center 1, grey = center 2), (d) abnormal FEV1 at center 1, (e) abnormal FEV1 at center 2, and (f) abnormal FEV1 at both centers (black = center 1, grey = center 2). Bias is indicated as a solid line and limits of agreement as dashed lines.
Figure S3 Bland–Altman plots between 129Xe and 1H VDP + LVP for (a) center 1, (b) center 2 and (c) both centers (black = center 1, grey = center 2). (d) Correlation plots between 129Xe and 1H VDP + LVP for both centers (black = center 1, grey = center 2). In the Bland–Altman plots bias is indicated as a solid line and limits of agreement as dashed lines. In the correlation plot, the line of best fit is indicated as a solid line and the line of identity as a dashed line.
Figure S4 Linear regression results of (a) 129Xe LVP, (b) 1H LVP, (c) 129Xe VDP + LVP and (d) 1H VDP + LVP with FEV1 z‐score, and (e) 129Xe LVP, (f) 1H LVP, (g) 129Xe VDP + LVP, and (h) 1H VDP + LVP with LCI.
Acknowledgments
Thanks to Dave Capener and Jody Bray for patient scanning, and Leanne Armstrong for study visit co‐ordination at center 1. Thanks to Melanie Pfeifer and Frank Schröder for outstanding technical assistance in performing the MRI examinations at center 2. The views expressed in this publication are those of the author(s) and not necessarily those of the NHS, the National Institute for Health Research, Health Education England or the Department of Health.
References
- 1. Wild JM, Paley MN, Viallon M, Schreiber WG, van Beek EJ, Griffiths PD. k‐space filtering in 2D gradient‐echo breath‐hold hyperpolarized 3He MRI: Spatial resolution and signal‐to‐noise ratio considerations. Magn Reson Med 2002;47(4):687‐695. [DOI] [PubMed] [Google Scholar]
- 2. Woodhouse N, Wild JM, Paley MN, et al. Combined helium‐3/proton magnetic resonance imaging measurement of ventilated lung volumes in smokers compared to never‐smokers. J Magn Reson Imaging 2005;21(4):365‐369. [DOI] [PubMed] [Google Scholar]
- 3. Smith LJ, Marshall H, Bray J, et al. The effect of acute maximal exercise on the regional distribution of ventilation using ventilation MRI in CF. J Cyst Fibros 2021;20(4):625‐631. [DOI] [PubMed] [Google Scholar]
- 4. Marshall H, Horsley A, Taylor CJ, et al. Detection of early subclinical lung disease in children with cystic fibrosis by lung ventilation imaging with hyperpolarised gas MRI. Thorax 2017;72(8):760‐762. [DOI] [PubMed] [Google Scholar]
- 5. Smith L, Marshall H, Aldag I, et al. Longitudinal assessment of children with mild cystic fibrosis using hyperpolarized gas lung magnetic resonance imaging and lung clearance index. Am J Respir Crit Care Med 2018;197(3):397‐400. [DOI] [PMC free article] [PubMed] [Google Scholar]
- 6. Rayment JH, Couch MJ, McDonald N, et al. Hyperpolarised (129)Xe magnetic resonance imaging to monitor treatment response in children with cystic fibrosis. Eur Respir J 2019;53(5):1802188. [DOI] [PubMed] [Google Scholar]
- 7. Smith LJ, Horsley A, Bray J, et al. The assessment of short and long term changes in lung function in CF using (129)Xe MRI. Eur Respir J 2020;56:2000441. [DOI] [PubMed] [Google Scholar]
- 8. Bauman G, Puderbach M, Deimling M, et al. Non‐contrast‐enhanced perfusion and ventilation assessment of the human lung by means of fourier decomposition in proton MRI. Magn Reson Med 2009;62(3):656‐664. [DOI] [PubMed] [Google Scholar]
- 9. Nyilas S, Bauman G, Sommer G, et al. Novel magnetic resonance technique for functional imaging of cystic fibrosis lung disease. Eur Respir J 2017;50(6):1701464. [DOI] [PubMed] [Google Scholar]
- 10. Nyilas S, Bauman G, Pusterla O, et al. Ventilation and perfusion assessed by functional MRI in children with CF: Reproducibility in comparison to lung function. J Cyst Fibros 2019;18(4):543‐550. [DOI] [PubMed] [Google Scholar]
- 11. Munidasa S, Couch MJ, Rayment JH, et al. Free‐breathing MRI for monitoring ventilation changes following antibiotic treatment of pulmonary exacerbations in paediatric cystic fibrosis. Eur Respir J 2021;57(4):2003104. [DOI] [PubMed] [Google Scholar]
- 12. Couch MJ, Munidasa S, Rayment JH, et al. Comparison of functional free‐breathing pulmonary (1)H and hyperpolarized (129)Xe magnetic resonance imaging in pediatric cystic fibrosis. Acad Radiol 2021;28(8):e209‐e218. [DOI] [PubMed] [Google Scholar]
- 13. Kaireit TF, Kern A, Voskrebenzev A, et al. Flow volume loop and regional ventilation assessment using phase‐resolved functional lung (PREFUL) MRI: Comparison with (129) xenon ventilation MRI and lung function testing. J Magn Reson Imaging 2021;53(4):1092‐1105. [DOI] [PubMed] [Google Scholar]
- 14. Niedbalski PJ, Hall CS, Castro M, et al. Protocols for multi‐site trials using hyperpolarized (129) Xe MRI for imaging of ventilation, alveolar‐airspace size, and gas exchange: A position paper from the (129) Xe MRI clinical trials consortium. Magn Reson Med 2021;86(6):2966‐2986. [DOI] [PubMed] [Google Scholar]
- 15. Couch MJ, Thomen R, Kanhere N, et al. A two‐center analysis of hyperpolarized (129)Xe lung MRI in stable pediatric cystic fibrosis: Potential as a biomarker for multi‐site trials. J Cyst Fibros 2019;18(5):728‐733. [DOI] [PMC free article] [PubMed] [Google Scholar]
- 16. Stewart NJ, Norquay G, Griffiths PD, Wild JM. Feasibility of human lung ventilation imaging using highly polarized naturally abundant xenon and optimized three‐dimensional steady‐state free precession. Magn Reson Med 2015;74(2):346‐352. [DOI] [PubMed] [Google Scholar]
- 17. Herrmann KH, Kramer M, Reichenbach JR. Time efficient 3D radial UTE sampling with fully automatic delay compensation on a clinical 3T MR scanner. PLoS One 2016;11(3):e0150371. [DOI] [PMC free article] [PubMed] [Google Scholar]
- 18. Uecker M, Tamir JI, Bahri D, et al. Berkley advanced reconstruction toolbox. Toronto: International Society for Magnetic Resonance in Medicine; 2015. p 2486. [Google Scholar]
- 19. Griswold MA, Jakob PM, Heidemann RM, et al. Generalized autocalibrating partially parallel acquisitions (GRAPPA). Magn Reson Med 2002;47(6):1202‐1210. [DOI] [PubMed] [Google Scholar]
- 20. Voskrebenzev A, Gutberlet M, Klimes F, et al. Feasibility of quantitative regional ventilation and perfusion mapping with phase‐resolved functional lung (PREFUL) MRI in healthy volunteers and COPD, CTEPH, and CF patients. Magn Reson Med 2018;79(4):2306‐2314. [DOI] [PubMed] [Google Scholar]
- 21. Yushkevich PA, Piven J, Hazlett HC, et al. User‐guided 3D active contour segmentation of anatomical structures: Significantly improved efficiency and reliability. Neuroimage 2006;31(3):1116‐1128. [DOI] [PubMed] [Google Scholar]
- 22. Hughes PJC, Horn FC, Collier GJ, Biancardi A, Marshall H, Wild JM. Spatial fuzzy c‐means thresholding for semiautomated calculation of percentage lung ventilated volume from hyperpolarized gas and (1) H MRI. J Magn Reson Imaging 2018;47(3):640‐646. [DOI] [PubMed] [Google Scholar]
- 23. Collier GJ, Acunzo L, Smith LJ, et al. Linear binning maps for image analysis of pulmonary ventilation with hyperpolarized gas MRI: Transferability and clinical applications. Paris: International Society for Magnetic Resonance in Medicine; 2018. p 4482. [Google Scholar]
- 24. He M, Driehuys B, Que LG, Huang YT. Using hyperpolarized (129)Xe MRI to quantify the pulmonary ventilation distribution. Acad Radiol 2016;23(12):1521‐1531. [DOI] [PMC free article] [PubMed] [Google Scholar]
- 25. Tustison NJ, Avants BB, Cook PA, et al. N4ITK: Improved N3 bias correction. IEEE Trans Med Imaging 2010;29(6):1310‐1320. [DOI] [PMC free article] [PubMed] [Google Scholar]
- 26. Quanjer PH, Stanojevic S, Cole TJ, et al. Multi‐ethnic reference values for spirometry for the 3‐95‐yr age range: The global lung function 2012 equations. Eur Respir J 2012;40(6):1324‐1343. [DOI] [PMC free article] [PubMed] [Google Scholar]
- 27. Miller MR, Hankinson J, Brusasco V, et al. Standardisation of spirometry. Eur Respir J 2005;26(2):319‐338. [DOI] [PubMed] [Google Scholar]
- 28. Wanger J, Clausen JL, Coates A, et al. Standardisation of the measurement of lung volumes. Eur Respir J 2005;26(3):511‐522. [DOI] [PubMed] [Google Scholar]
- 29. Horsley AR, Gustafsson PM, Macleod KA, et al. Lung clearance index is a sensitive, repeatable and practical measure of airways disease in adults with cystic fibrosis. Thorax 2008;63(2):135‐140. [DOI] [PubMed] [Google Scholar]
- 30. Walker E, Nowacki AS. Understanding equivalence and noninferiority testing. J Gen Intern Med 2011;26(2):192‐196. [DOI] [PMC free article] [PubMed] [Google Scholar]
- 31. Weir JP. Quantifying test‐retest reliability using the intraclass correlation coefficient and the SEM. J Strength Cond Res 2005;19(1):231‐240. [DOI] [PubMed] [Google Scholar]
- 32. Pohler GH, Klimes F, Behrendt L, et al. Repeatability of phase‐resolved functional lung (PREFUL)‐MRI ventilation and perfusion parameters in healthy subjects and COPD patients. J Magn Reson Imaging 2021;53(3):915‐927. [DOI] [PubMed] [Google Scholar]
- 33. Wernz M, Zubke M, Voskrebenzev A, et al. Influence of lung vessel segmentation on the reproducibility of PREFUL MRI, 813. Hannover: International Workshop on Pulmonary Functional Imaging; 2022. [Google Scholar]
- 34. Smith LJ, Collier GJ, Marshall H, et al. Patterns of regional lung physiology in cystic fibrosis using ventilation magnetic resonance imaging and multiple‐breath washout. Eur Respir J 2018;52(5):1800821. [DOI] [PubMed] [Google Scholar]
- 35. Klimes F, Voskrebenzev A, Gutberlet M, et al. 3D phase‐resolved functional lung ventilation MR imaging in healthy volunteers and patients with chronic pulmonary disease. Magn Reson Med 2021;85(2):912‐925. [DOI] [PubMed] [Google Scholar]
- 36. Capaldi DPI, Guo F, Xing L, Parraga G. Pulmonary ventilation maps generated with free‐breathing proton MRI and a deep convolutional neural network. Radiology 2021;298(2):427‐438. [DOI] [PubMed] [Google Scholar]
- 37. Capaldi DP, Sheikh K, Guo F, et al. Free‐breathing pulmonary 1H and hyperpolarized 3He MRI: Comparison in COPD and bronchiectasis. Acad Radiol 2015;22(3):320‐329. [DOI] [PubMed] [Google Scholar]
- 38. Capaldi DPI, Sheikh K, Eddy RL, et al. Free‐breathing functional pulmonary MRI: Response to bronchodilator and bronchoprovocation in severe asthma. Acad Radiol 2017;24(10):1268‐1276. [DOI] [PubMed] [Google Scholar]
- 39. Kaireit TF, Gutberlet M, Voskrebenzev A, et al. Comparison of quantitative regional ventilation‐weighted fourier decomposition MRI with dynamic fluorinated gas washout MRI and lung function testing in COPD patients. J Magn Reson Imaging 2018;47(6):1534‐1541. [DOI] [PubMed] [Google Scholar]
Associated Data
This section collects any data citations, data availability statements, or supplementary materials included in this article.
Supplementary Materials
Appendix S1 Supporting Information
Figure S1 Image analysis workflow. (Top left) for 129Xe ventilation analysis, the best‐matching registered 1H anatomical images were chosen. (Bottom left) for 1H ventilation analysis, PREFUL analysis was performed to produce 1H ventilation images and a 3D 1H anatomical image volume was built from inspiratory images. (Right) Linear binning was performed on the 129Xe and PREFUL ventilation images and their matching 1H anatomical images in the same manner. lce = lung cavity estimation, N4 = N4 bias field correction.
Figure S2 Bland–Altman plots between 129Xe and 1H VDP for CF patients with; (a) normal FEV1 at center 1, (b) normal FEV1 at center 2, (c) normal FEV1 at both centers (black = center 1, grey = center 2), (d) abnormal FEV1 at center 1, (e) abnormal FEV1 at center 2, and (f) abnormal FEV1 at both centers (black = center 1, grey = center 2). Bias is indicated as a solid line and limits of agreement as dashed lines.
Figure S3 Bland–Altman plots between 129Xe and 1H VDP + LVP for (a) center 1, (b) center 2 and (c) both centers (black = center 1, grey = center 2). (d) Correlation plots between 129Xe and 1H VDP + LVP for both centers (black = center 1, grey = center 2). In the Bland–Altman plots bias is indicated as a solid line and limits of agreement as dashed lines. In the correlation plot, the line of best fit is indicated as a solid line and the line of identity as a dashed line.
Figure S4 Linear regression results of (a) 129Xe LVP, (b) 1H LVP, (c) 129Xe VDP + LVP and (d) 1H VDP + LVP with FEV1 z‐score, and (e) 129Xe LVP, (f) 1H LVP, (g) 129Xe VDP + LVP, and (h) 1H VDP + LVP with LCI.