

Abstract
A commonly held belief by the Canadian media and public is that the Australian influenza season is a fairly reliable indicator of what the Canadian influenza season that follows might be like. However, this claim is not well substantiated with epidemiological evidence. Therefore, the objective of this work was to qualitatively compare the timing of the onset, peak, and intensity of influenza activity, the dominant circulating influenza strains, and the seasonal vaccine and vaccination policies from 2014 to 2020 between Canada and Australia, using a combination of FluNet data and influenza surveillance reports and publications. Across the epidemiological indicators considered, the epidemics between Canada and Australia often differ. While vaccination policies and coverage are similar between the two countries, vaccine composition and vaccine effectiveness estimates also differ. Ultimately, there are many differences and confounding variables between the Australian and Canadian influenza seasons across numerous indicators that preclude the use of the Australian influenza season as the sole predictor of the Canadian influenza season. However, the availability of global surveillance data and robust national and sub-national surveillance data can provide lead time and inform within-season resource and capacity planning, as well as mitigation measures, for seasonal influenza epidemics.
Keywords: influenza, surveillance, seasonality, epidemiology, vaccine
Introduction
Seasonal influenza primarily circulates in the winter months. In Australia, the influenza season typically occurs during the months of May to October, while in Canada, the influenza season typically occurs during the months of October to May. A commonly held belief by the Canadian media and public is that the Australian influenza season is a fairly reliable indicator of what the Canadian influenza season that follows might be like ((1–4)) The origin of this belief is unknown, but likely became widespread after the severe influenza seasons in both the Southern and Northern Hemispheres in 2017 ((2)).
As of December 2021, only one empirical study has been published on whether Australian influenza data can predict influenza activity in the Northern Hemisphere (the United States, United Kingdom, and China). Zhang et al. applied a multivariate seasonal autoregression integrated moving average model and found that using World Health Organization (WHO) FluNet surveillance data from 2010 to 2018 for the Southern Hemisphere, in combination with local data from internet queries, nominally improved prediction of the influenza positive incidence in these three Northern Hemisphere countries ((5)). Beyond this, the claim that the Australian influenza season can be used to predict the Canadian influenza season is not well investigated nor substantiated by epidemiological evidence.
The objective of this commentary is to compare the timing of the onset, peak, and intensity of influenza activity, the dominant circulating influenza strains, and the seasonal vaccine and vaccination policies from 2014 to 2020 between Canada and Australia to determine whether there is sufficient evidence to support whether the seasonal influenza epidemic in Australia can be used as a predictor of the Canadian influenza season.
Scope and methods
Data from seven consecutive seasons (Northern Hemisphere seasons 2014–2015 to 2020–2021 and corresponding Southern Hemisphere seasons 2014 to 2020) were used for qualitative comparison. The WHO FluNet data were used to determine the dominant circulating subtype and to calculate and generate the influenza A and B percent positivity epidemiological curves for Australia and Canada from January 2014 to August 2021 ((6)). To enable the comparison of seasons, start and end, epidemiological week 35 of a Canadian season was aligned to week 1 of an Australian season and periods. Australia does not set a threshold to call the start and end to their seasonal epidemic; therefore, to enable a direct comparison, Canada’s threshold of two consecutive weeks of ≥5% influenza test positivity was used to define a seasonal influenza epidemic (7). Epidemiological curves were compared and analyzed. All analyses were done in R software ((8)) and figures were produced in Excel.
Hospitalizations, while an important surveillance indicator for severity, were excluded from this comparison, as hospitalization data between the two countries were not comparable. Data used for the comparison of epidemiological trends and vaccination recommendations were limited to official surveillance reports and immunization handbooks and statements published by the Government of Canada and the Australian Government. Information on seasonal influenza vaccine composition was obtained from the meeting reports published by the WHO. Vaccine effectiveness (VE) results were obtained from published journal articles that were collected, collated and saved as part of active surveillance of global VE results by Canada’s national influenza surveillance program (FluWatch).
Key findings
Virologic
Influenza A was the dominant circulating virus type in both Canada and Australia across seasons, with the exception of the 2015 season in Australia, where influenza A and B circulated in similar proportions (Table 1). Over the seven seasons compared, in only three did the dominant Australian influenza A subtype correspond to the following season’s dominant Canadian influenza A subtype (2016/2016–2017 [A(H3N2)], 2017/2017–2018 [A(H3N2)] and 2018/2018–2019 [A(H1N1)] seasons). While strain information on the influenza A subtypes in circulation were unavailable in the Australian surveillance reports, dominant influenza A subtype in circulation in Australia during the three seasons were determined to be well matched, reasonably well matched, or antigenically similar to the vaccine components, respectively (9–11). This suggests that the dominant circulating strains of influenza A subtypes were similar to those in Canada during these three seasons (12–14).
Table 1. Number and proportion of Influenza detections by type, Australia and Canada, 2014–2020a.
| Season | Country | Total influenza detections | Influenza A | Influenza B | Among subtyped influenza A detections | |||||
|---|---|---|---|---|---|---|---|---|---|---|
| Influenza H1N1 | Influenza H3N2 | |||||||||
| n | % | n | % | n | % | n | % | |||
| 2014/2014–2015 | Australia | 3,473 | 3,011 | 86.7 | 462 | 13.3 | 1,701 | 60.2 | 1,124 | 39.8 |
| Canada | 45,048 | 36,428 | 80.9 | 8,620 | 19.1 | 104 | 0.8 | 13,168 | 99.2 | |
| 2015/2015–2016 | Australia | 3,625 | 1,825 | 50.3 | 1,800 | 49.7 | 244 | 13.7 | 1,533 | 86.3 |
| Canada | 39,449 | 28,495 | 72.2 | 10,954 | 27.8 | 11,168 | 90.5 | 1,172 | 9.5 | |
| 2016/2016–2017 | Australia | 6,705 | 5,566 | 83.0 | 1,139 | 17.0 | 588 | 16.9 | 2,893 | 83.1 |
| Canada | 39,512 | 35,001 | 88.6 | 4,511 | 11.4 | 176 | 1.0 | 17,524 | 99.0 | |
| 2017/2017–2018 | Australia | 10,509 | 7,684 | 73.1 | 2,825 | 26.9 | 507 | 18.4 | 2,248 | 81.6 |
| Canada | 64,250 | 36,039 | 56.1 | 28,211 | 43.9 | 1,274 | 10.3 | 11,074 | 89.7 | |
| 2018/2018–2019 | Australia | 4,264 | 3,869 | 90.7 | 395 | 9.3 | 2,058 | 74.8 | 695 | 25.2 |
| Canada | 47,763 | 45,240 | 94.7 | 2,523 | 5.3 | 10,981 | 67.9 | 5,196 | 32.1 | |
| 2019/2019–2020 | Australia | 14,002 | 12,035 | 86.0 | 1,967 | 14.0 | 674 | 12.8 | 4,586 | 87.2 |
| Canada | 53,789 | 30,986 | 57.6 | 22,803 | 42.4 | 4,956 | 69.1 | 2,215 | 30.9 | |
| 2020/2020–2021 | Australia | 949 | 876 | 92.3 | 73 | 7.7 | 267 | 80.7 | 64 | 19.3 |
| Canada | 72 | 49 | 68.1 | 23 | 31.9 | 5 | 38.5 | 8 | 61.5 | |
a Dominant circulating type and influenza A subtype by country and season are indicated in bold
During this period, both Canada and Australia had seasons with influenza B circulation, but the seasons with higher influenza B incidence had no correspondence (2015 in Australia vs. 2017–2018 and 2019–2020 in Canada). Across most seasons, Canada had a large wave of influenza A followed by a smaller wave of influenza B, except in seasons 2017–2018 and 2019–2020, where influenza B co-circulated with influenza A (Figure 1). In Australia, influenza A and B generally co-circulated in all seasons, with influenza B circulating at lower levels. Due to the coronavirus disease 2019 (COVID-19) pandemic and public health response measures, both Australia and Canada had minimal circulating influenza in 2020–2021.
Figure 1.
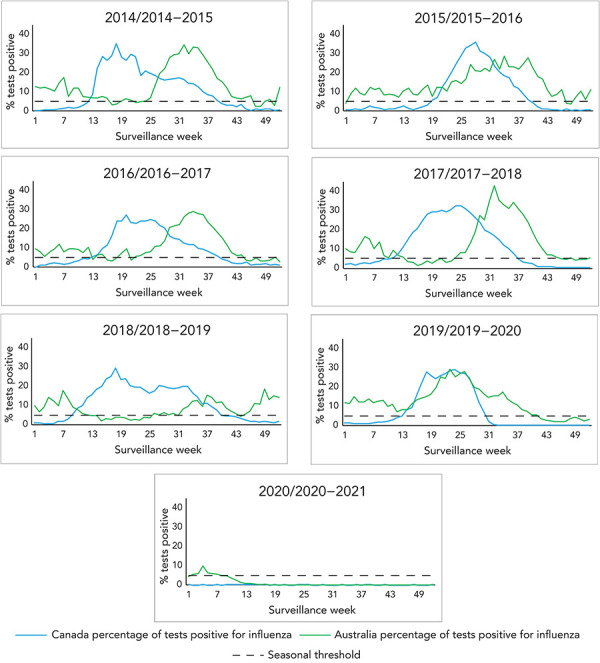
Historical comparison of influenza percent positivity in Canada and Australia, by surveillance week and season
Influenza activity
Australia and Canada also show different seasonal dynamics and differ from one season to another (Figure 2). Using Canada’s thresholds for seasonal influenza epidemics (at least two consecutive weeks where ≥5% of tests are positive for influenza) as a marker for epidemic activity, Australia appears to experience a short and less intense epidemic period of influenza activity in most seasons before experiencing the main, larger epidemic, while Canada usually experiences one continuous period of epidemic activity. Excluding the Canadian 2019–2020 and 2020–2021 seasons and the Australian 2020 season due to the COVID-19 pandemic, the average epidemic length in Canada was 27 weeks (range: 22–31 weeks) and 31 weeks in Australia (range: 23–45 weeks). Excluding the seasons affected by the COVID-19 pandemic, Australia sees an average of 40 weeks where at least 5% positivity was reported, compared to Canada’s average of 27 weeks.
Figure 2.

Historical comparison of influenza A and B percent positivity in Canada and Australia by surveillance week and season
Epidemic activity rises more quickly in Canada (with seasons peaking on average during? 10.4 weeks in Canada [range: 8–15 weeks] vs. 17 weeks for Australia [range: 9–33 weeks]) from the time where 5% positivity is reached in the main epidemic curve. The intensity, as indicated by the magnitude of the peak, differed between Canada and Australia for most seasons. There was only one season (2016/2016–17), where the peak percent positivity in Canada and Australia was within 5%. There was no discernable peak pattern, as peak percent positivity ranged from 15.1%–42.9% in Australia and 27.1%–36.0% in Canada.
Vaccine policy and coverage
Vaccine policies are relatively similar between Australia and Canada. The Australian Immunisation Handbook and the Canadian Immunization Guide both outline similar groups recommended for seasonal influenza vaccination. For both countries, all individuals aged ≥6 months should be offered the seasonal influenza vaccine with a focus on groups that include individuals at high risk of influenza-related complications or hospitalization, individuals capable of transmitting influenza to those at high risk, individuals who provide essential community services and commercial poultry (both Canada and Australia), and swine workers (Australia only) during an outbreak of avian or swine influenza ((15,16)).
In the 2020/2020–2021 season, vaccine coverage in both countries was also relatively similar. Vaccine coverage was highest among individuals aged 65+ (62% in Australia and 70% in Canada) (17,18). Adults also had similar coverage in both countries (in Australia 23% and 35% of individuals aged 15 to ≤49 years and 50 to ≤64 years respectively were vaccinated and in Canada, 29% in individuals aged 18–64 years in Canada) (17,18). Vaccination coverage is relatively stable year to year in both countries.
Influenza vaccine composition and vaccine effectiveness
Vaccine strain recommendations were identical between Australia and Canada from 2014 to 2017, with both countries providing both trivalent and quadrivalent vaccines. The recommended B strains differed in 2018, 2019 and 2020 and A strains differed in 2019 and 2020 (19).
Vaccine effectiveness estimates generated using similar test negative case control designs for comparable seasons and intervals are summarized in Table 2. For three out of the four seasons where the vaccines were identical, Australia’s VE estimate was higher than that of Canada’s (with the exception of the 2016–2017 season); however, the confidence intervals overlapped in all but the 2014–2015 season, where the VE in Canada was 9% vs. 44% in Australia).
Table 2. Summary of published vaccine effectiveness estimates (interim or final) against medically attended influenza, Australia and Canada, seasons 2014 to 2020.
| Season (references) | Australia VE estimate (95% CI) |
Canada VE estimate (95% CI) |
Notes on VE estimatea |
|---|---|---|---|
| 2014/2014–2015 ((20,21) | 44% (31–55) | 9% (−14 –57) | VE against medically attended influenza (all types) |
| 2015/2015–2016 ((22,23)) | 54% (42–63) | 46% (32–57) | VE against medically attended influenza (all types) |
| 2016/2016–2017 ((24,25)) | 40% (18–56) | 44% (30–55) | VE against medically attended influenza (all types) |
| 2017/2017–2018 ((26,27)) | 55% (17–46) | 42% (25–55) | Interim VE against medically attended influenza (all types) |
| 2018/2018–2019b (28,29) | 68% (47–67) | 68% (55–77) | Interim VE against medically attended influenza (all types) |
| 2019/2019–2020c (30,31) | A(H1N1): 62% (39–78) A(H3N2): 37% (24–49) B: 63% (45–74) |
A(H1N1): 44% (26–58) A(H3N2): 62% (37–77) B: 69% (57–77) |
Interim VE against medically attended influenza (by type/subtype) |
| 2020/2020–2021d | N/A | N/A | N/A |
Abbreviations: CI, confidence interval; N/A, not applicable; VE, vaccine effectiveness
a The most up-to-date comparable estimates available were used: If only interim estimates were available for one country, the interim estimates for both countries were used for the comparison
b The 2018 Southern Hemisphere and 2018–2019 Northern Hemisphere vaccine had a different influenza B Victoria component
c The 2019 Southern Hemisphere and 2019–2020 Northern Hemisphere vaccine had different influenza A(H1N1) and A(H3N2) components
d The 2020 Southern Hemisphere and the 2020–2021 Northern Hemisphere vaccine had different influenza A(H1N1) and A(H3N2) components
Discussion
Australia and Canada have different seasonal dynamics and overall activity differs from one season to another. The Canadian influenza season appears to be more concentrated with activity peaking more quickly than that of the Australian influenza season. The dominant circulating type and subtype can have an effect on the burden and severity of a season. The dominant circulating type and subtype, length, intensity and activity of an influenza season are core surveillance indicators in Canada. Our comparison showed that these indicators are often different between the countries from season to season.
Vaccine policy and coverage are similar between the countries and among the seasons, with comparable vaccine components. No distinct VE estimate trends were found between the two countries. More recently, the composition of the Northern and Southern Hemispheres seasonal influenza vaccine began to differ, which limits the comparability and usefulness of the Australian VE estimates as a predictor of Canadian VE estimates. Differences and similarities in vaccine composition, policy and VE are other limitations that must be considered when comparing the influenza activity of the two countries and using one as a predictor of activity for the other.
In addition to the differences in seasonal activity, climatic and demographic factors are well-established factors that influence influenza disease dynamics ((32,33)). Both similarities and differences exist between Canada and Australia in climate and population. The climate of the two countries is different, with sub-zero degrees Celsius winter temperatures in Canada and above zero degrees Celsius in Australia. The population distribution, however, in 2020 by age and sex are similar between the two countries ((34,35)).
Confounding issues in the side-by-side analysis of standard surveillance indicators is a major limitation of this analysis. For example, laboratory-confirmed influenza is a nationally notifiable disease in both Australia and Canada; however, there can be differences in the populations being tested and testing practices between the countries. This is evidenced by the differences in the number of influenza detections reported between Canada and Australia. In some seasons, Canada has greater than 10 times the influenza detections; however, it is unknown whether this is due to differences in testing and reporting practices or actual differences in the number of detections (illness). Canada leans towards testing more severe disease in patients; however, Australia’s testing strategy may differ from Canada. The metadata to assess data comparability and potential threats to validity are often unavailable in routine surveillance reports or from the underlying surveillance systems.
Influenza activity is notoriously hard to predict. The attraction of using the seasonal influenza experience that occurred just months before in one country to predict the activity of another country is understandable from a planning perspective. The Australian influenza surveillance reports are available online and they have robust surveillance indicators; however, there are many important considerations outlined in this article that should be taken into account when interpreting the data and applying it to Canada.
Conclusion
This comparison is the first season-by-season comparison of Canadian and Australian influenza data to our knowledge, and it brings to light the challenges and limitations with using Australia’s data to predict Canada’s influenza season. Based on this comparison, the use of key indicators from the Australian season to predict trajectory, intensity or duration characteristics of the Canadian influenza season is unsupported by evidence. While we are not discounting the use of Australian influenza surveillance data, the data should be treated the same way as surveillance data obtained from any other country and used together as global intelligence to inform influenza trends and activity that could occur in Canada. Timely and robust national and sub-national surveillance data is a great asset in aiding the development of within-season predictions that can provide lead time and inform within-season resource and capacity planning, as well as mitigation measures ((36)).
Acknowledgements
Many thanks to all those across Canada who contribute to influenza surveillance. The FluWatch program consists of a volunteer network of labs, hospitals, doctors’ offices, provincial and territorial ministries of health and individuals who contribute as FluWatchers. 2014–2015
Competing interests
None.
Funding
FluWatch surveillance is funded by the Public Health Agency of Canada.
References
- 1.Miller A. What you need to know before flu season hits in Canada. 2019 [Accessed 2021 June 17]. https://www.cbc.ca/news/health/flu-shot-flu-season-canada-1.5318796
- 2.Young L. Australia is having a terrible flu season. Here’s why that matters for Canada. Global News; 2019. https://globalnews.ca/news/5435232/australia-flu-season-canada/
- 3.Duong D. Will Canada have a rebound flu season this year? – CMAJ News; 2021. https://cmajnews.com/2021/10/15/covid-rebound-duong-1095969/ [DOI] [PMC free article] [PubMed]
- 4.D’Andrea A. Australia’s flu season is off to a wild start. Is it a ‘precursor’ for Canada? Global News; 2022. https://globalnews.ca/news/8908225/influenza-flu-canada-australia/
- 5.Zhang Y, Yakob L, Bonsall MB, Hu W. Predicting seasonal influenza epidemics using cross-hemisphere influenza surveillance data and local internet query data. Sci Rep 2019;9(1):3262. https://www.nature.com/articles/s41598-019-39871-2 10.1038/s41598-019-39871-2 [DOI] [PMC free article] [PubMed] [Google Scholar]
- 6.World Health Organization. Global Influenza Programme. Geneva, CH: WHO. https://www.who.int/tools/flunet
- 7.Schanzer DL, Saboui M, Lee L, Domingo FR, Mersereau T. Leading Indicators and the Evaluation of the Performance of Alerts for Influenza Epidemics. PLoS One 2015;10(10):e0141776. 10.1371/journal.pone.0141776 [DOI] [PMC free article] [PubMed] [Google Scholar]
- 8.R Core Team. R: A language and environment for statistical computing. Vienna, Austria: R Foundation for Statistical Computing; 2022. [Google Scholar]
- 9.Australian Government Department of Health. Australian Influenza Surveillance Report No. 11, 2016 Reporting Period 15 – 28 October 2016. https://www1.health.gov.au/internet/main/publishing.nsf/Content/66FDD755F7DEB366CA258065007BCE6E/$File/Australian-Influenza-Surveillance-Report.pdf
- 10.Australian Government Department of Health. Australian Influenza Surveillance Report No. 12, 2017 Reporting Period 14 – 27 October 2017. https://www1.health.gov.au/internet/main/publishing.nsf/Content/8FC4EA9E4C6E3F5CCA2581D4001BBC9A/$File/ozflu-surveil-no12-2017.pdf
- 11.Australian Government Department of Health. Australian Influenza Surveillance Report No. 11, 2018 Reporting Period 8 – 21 October 2018. https://www1.health.gov.au/internet/main/publishing.nsf/Content/95C0B11D8F89FAD9CA2583310081EB12/$File/flu-11-2018.pdf
- 12.Public Health Agency of Canada. FluWatch Report: August 20 to August 26, 2017 (week 34). Ottawa, ON: PHAC; 2017. https://www.canada.ca/en/public-health/services/publications/diseases-conditions/fluwatch/2016-2017/week34-august-20-26-2017.html
- 13.Public Health Agency of Canada. FluWatch Report: July 22 to August 25, 2018 (weeks 30-34). Ottawa, ON: PHAC; 2018. https://www.canada.ca/en/public-health/services/publications/diseases-conditions/fluwatch/2017-2018/week30-34-july-22-august-25-2018.html
- 14.Public Health Agency of Canada. FluWatch Report: July 21 to August 24, 2019 (weeks 30-34). Ottawa, ON: PHAC; 2019. https://www.canada.ca/en/public-health/services/publications/diseases-conditions/fluwatch/2018-2019/week30-34-july-21-august-24-2019.html
- 15.Australian Government Department of Health and Aged Care. Australian Immunisation Handbook. Influenza (flu). https://immunisationhandbook.health.gov.au/contents/vaccine-preventable-diseases/influenza-flu
- 16.National Advisory Committee on Immunization (NACI). Canadian Immunization Guide Chapter on influenza and statement on seasonal influenza vaccine for 2021–2022. Government of Canada; 2022. https://www.canada.ca/en/public-health/services/publications/vaccines-immunization/canadian-immunization-guide-statement-seasonal-influenza-vaccine-2021-2022.html
- 17.Government of Canada. Vaccination coverage in Canada. 2023. https://www.canada.ca/en/public-health/services/immunization-vaccines/vaccination-coverage.html
- 18.National Centre for Immunisation Research and Surveillance Australia. Influenza vaccination coverage data. https://ncirs.org.au/influenza-vaccination-coverage-data
- 19.World Health Organization. Recommendations for influenza vaccine composition. Geneva, CH: WHO. https://www.who.int/teams/global-influenza-programme/vaccines/who-recommendations
- 20.Sullivan SG, Carville KS, Chilver M, Fielding JE, Grant KA, Kelly H, Levy A, Stocks NP, Tempone SS, Regan AK. Pooled influenza vaccine effectiveness estimates for Australia, 2012-2014. Epidemiol Infect 2016;144(11):2317–28. 10.1017/S0950268816000819 [DOI] [PMC free article] [PubMed] [Google Scholar]
- 21.Skowronski DM, Chambers C, Sabaiduc S, De Serres G, Winter AL, Dickinson JA, Krajden M, Gubbay JB, Drews SJ, Martineau C, Eshaghi A, Kwindt TL, Bastien N, Li Y. A Perfect Storm: Impact of Genomic Variation and Serial Vaccination on Low Influenza Vaccine Effectiveness During the 2014-2015 Season. Clin Infect Dis 2016;63(1):21–32. 10.1093/cid/ciw176 [DOI] [PMC free article] [PubMed] [Google Scholar]
- 22.Fielding JE, Levy A, Chilver MB, Deng YM, Regan AK, Grant KA, Stocks NP, Sullivan SG. Effectiveness of seasonal influenza vaccine in Australia, 2015: an epidemiological, antigenic and phylogenetic assessment. Vaccine 2016;34(41):4905–12. 10.1016/j.vaccine.2016.08.067 [DOI] [PubMed] [Google Scholar]
- 23.Skowronski DM, Chambers C, Sabaiduc S, De Serres G, Winter AL, Dickinson JA, Gubbay JB, Drews SJ, Martineau C, Charest H, Krajden M, Bastien N, Li Y. Beyond Antigenic Match: Possible Agent-Host and Immuno-epidemiological Influences on Influenza Vaccine Effectiveness During the 2015-2016 Season in Canada. J Infect Dis 2017. Dec;216(12):1487–500. 10.1093/infdis/jix526 [DOI] [PMC free article] [PubMed] [Google Scholar]
- 24.Regan AK, Fielding JE, Chilver MB, Carville KS, Minney-Smith CA, Grant KA, Thomson C, Hahesy T, Deng YM, Stocks N, Sullivan SG. Intraseason decline in influenza vaccine effectiveness during the 2016 southern hemisphere influenza season: A test-negative design study and phylogenetic assessment. Vaccine 2019;37(19):2634–41. 10.1016/j.vaccine.2019.02.027 [DOI] [PubMed] [Google Scholar]
- 25.Skowronski DM, Leir S, Sabaiduc S, Chambers C, Zou M, Rose C, Olsha R, Dickinson JA, Winter AL, Jassem A, Gubbay JB, Drews SJ, Charest H, Chan T, Hickman R, Bastien N, Li Y, Krajden M, De Serres G. Influenza Vaccine Effectiveness by A(H3N2) Phylogenetic Subcluster and Prior Vaccination History: 2016-2017 and 2017-2018 Epidemics in Canada. J Infect Dis 2022;225(8):1387–98. 10.1093/infdis/jiaa138 [DOI] [PMC free article] [PubMed] [Google Scholar]
- 26.Sullivan SG, Chilver MB, Carville KS, Deng YM, Grant KA, Higgins G, Komadina N, Leung VK, Minney-Smith CA, Teng D, Tran T, Stocks N, Fielding JE. Low interim influenza vaccine effectiveness, Australia, 1 May to 24 September 2017. Euro Surveill 2017;22(43):17–00707. 10.2807/1560-7917.ES.2017.22.43.17-00707 [DOI] [PMC free article] [PubMed] [Google Scholar]
- 27.Skowronski DM, Chambers C, De Serres G, Dickinson JA, Winter AL, Hickman R, Chan T, Jassem AN, Drews SJ, Charest H, Gubbay JB, Bastien N, Li Y, Krajden M. Early season co-circulation of influenza A(H3N2) and B(Yamagata): interim estimates of 2017/18 vaccine effectiveness, Canada, January 2018. Euro Surveill 2018;23(5):18–00035. 10.2807/1560-7917.ES.2018.23.5.18-00035 [DOI] [PMC free article] [PubMed] [Google Scholar]
- 28.Australian Government Department of Health. 2018 Influenza Season in Australia Information Brief updated on 16 November 2018. https://www1.health.gov.au/internet/main/publishing.nsf/Content/CA086525758664B4CA25836200807AF9/$File/2018-Season-Summary.pdf
- 29.Skowronski DM, Leir S, Sabaiduc S, Murti M, Dickinson JA, Olsha R, Gubbay JB, Croxen MA, Charest H, Chan T, Bastien N, Li Y, Krajden M, De Serres G. Interim estimates of 2018/19 vaccine effectiveness against influenza A(H1N1)pdm09, Canada, January 2019. Euro Surveill 2019;24(4):1900055. 10.2807/1560-7917.ES.2019.24.4.1900055 [DOI] [PMC free article] [PubMed] [Google Scholar]
- 30.Sullivan SG, Arriola CS, Bocacao J, Burgos P, Bustos P, Carville KS, Cheng AC, Chilver MB, Cohen C, Deng YM, El Omeiri N, Fasce RA, Hellferscee O, Huang QS, Gonzalez C, Jelley L, Leung VK, Lopez L, McAnerney JM, McNeill A, Olivares MF, Peck H, Sotomayor V, Tempia S, Vergara N, von Gottberg A, Walaza S, Wood T. Heterogeneity in influenza seasonality and vaccine effectiveness in Australia, Chile, New Zealand and South Africa: early estimates of the 2019 influenza season. Euro Surveill 2019;24(45):1900645. 10.2807/1560-7917.ES.2019.24.45.1900645 [DOI] [PMC free article] [PubMed] [Google Scholar]
- 31.Skowronski DM, Zou M, Sabaiduc S, Murti M, Olsha R, Dickinson JA, Gubbay JB, Croxen MA, Charest H, Jassem A, Krajden M, Bastien N, Li Y, De Serres G. Interim estimates of 2019/20 vaccine effectiveness during early-season co-circulation of influenza A and B viruses, Canada, February 2020. Euro Surveill 2020;25(7):2000103. 10.2807/1560-7917.ES.2020.25.7.2000103 [DOI] [PMC free article] [PubMed] [Google Scholar]
- 32.Deyle ER, Maher MC, Hernandez RD, Basu S, Sugihara G. Global environmental drivers of influenza. Proc Natl Acad Sci USA 2016;113(46):13081–6. 10.1073/pnas.1607747113 [DOI] [PMC free article] [PubMed] [Google Scholar]
- 33.Lofgren E, Fefferman NH, Naumov YN, Gorski J, Naumova EN. Influenza seasonality: underlying causes and modeling theories. J Virol 2007;81(11):5429–36. 10.1128/JVI.01680-06 [DOI] [PMC free article] [PubMed] [Google Scholar]
- 34.Australia vs Canada Geography Stats Compared. https://www.nationmaster.com/country-info/compare/Australia/Canada/Geography
- 35.Canada vs. Australia - Country Comparison. https://www.indexmundi.com/factbook/compare/canada.australia
- 36.Smetanin P, Biel RK, Stiff D, McNeil D, Svenson L, Usman HRet al. An Early Warning Influenza Model using Alberta Real- Time Syndromic Data (ARTSSN). Online J Public Health Inform 2015;7(1): 10.5210/ojphi.v7i1.5719 [DOI] [Google Scholar]