

Abstract
Aim
To describe the cumulative incidence of child protection (CP) system contact, maltreatment type, source of reports to age 7 years, and socio‐demographic characteristics for culturally and linguistically diverse (CALD) Australian children.
Methods
We used CP, education, health, and birth registrations data for children followed from birth up to age 7 from the South Australian Better Evidence, Better Outcomes, Linked Data (SA BEBOLD) platform. Participants: SA born children enrolled in their first year of school from 2009 to 2015 (n = 76 563). CALD defined as non‐Aboriginal or Torres Strait Islander, spoken language other than English, Indigenous or Sign, or had at least one parent born in a non‐English speaking country. Outcomes measures: For CALD and non‐CALD children, we estimated the cumulative incidence (risk) of CP contacts up to age 7, relative risk and risk differences for all levels of CP contact from notification to out‐of‐home care (OOHC), primary maltreatment type, reporter type, and socio‐economic characteristics. Sensitivity analyses explored different population selection criteria and CALD definitions.
Results
By age 7, 11.2% of CALD children had ‘screened‐in’ notifications compared to 18.8% of non‐CALD (risk difference [RD] 7.6 percentage points (95% confidence interval: 6.9–8.3)), and 0.6% of CALD children experienced OOHC compared to 2.2% of non‐CALD (RD 1.6 percentage points (95% confidence interval: 1.3–1.8)). Emotional abuse was the most common substantiated maltreatment type for CALD and neglect for non‐CALD. Among both groups, the most common reporter sources were police and education sector. Socio‐economic characteristics were broadly similar. Sensitivity analyses results were consistent with primary analyses.
Conclusion
By age 7, CALD children had lower risk of contact with all levels of CP. Estimates based on primary and sensitivity analyses suggested CALD children were 5–9 percentage points less likely to have a report screened‐in, and from 1.0 to 1.7 percentage points less likely to have experienced OOHC.
Keywords: child abuse and neglect, child maltreatment, culturally and linguistically diverse
What is already known on this topic
In Australia, Aboriginal and/or Torres Strait Islander children are over represented in the child protection system.
In England and the United States, child protection contacts vary between ethnicities with over‐representation of Black and African American, and under‐representation of Asian children.
Disparities in child protection contact between ethnicities have been attributed to greater socio‐economic disadvantage.
What this paper adds
Culturally and linguistically diverse (CALD) children were less likely to have contact across all levels of child protection from reporting to out‐of‐home care. By age 7, 11.2% of CALD children were screened‐in compared to 18.8% of non‐CALD.
Sensitivity analysis suggested CALD children were 5–9 percentage points less likely to have a report screened‐in, and from 1.0 to 1.7 percentage points less likely to have experienced out‐of‐home care.
CALD and non‐CALD groups differed by the type of maltreatment, but were similar by source of report, or on background socio‐economic factors.
Child maltreatment is abuse and/or neglect of a child, and has long been recognised as an important public health issue. 1 , 2 , 3 In 2020–2021, child protection (CP) agencies in Australia received 531 900 notifications for 293 600 children. 4 In South Australia (SA), 25% of children were notified at least once to CP services by the age of 10 years. 5 In New South Wales (NSW), 13.8% of children are the subject of screened‐in notifications by age 5. 6 Adverse effects of maltreatment on mental 7 , 8 and physical health, education attainment, labour market participation, 9 and increased risk of antisocial behaviours 10 , 11 have been shown in previous research.
Racial or ethnic disparities in CP contact are well recognised. 12 In the United States, 13 , 14 , 15 Canada, 16 Australia 17 , 18 and New Zealand, 19 children of First Nations communities are over‐represented in the CP system, as a consequence of colonialism, dispossession and systemic discrimination. The CP experience is heterogeneous within subgroups of racialised or ethnic minority groups. In England, the rate of children substantiated was higher in Mixed heritage (84 per 10 000) compared to White (50 per 10 000) children. 20 Asian children had a lower rate compared to White at 23 per 10 000 children. 20 However, the rate of Black (87 per 10 000) and mixed heritage (99 per 10 000) children in out‐of‐home care (OOHC) far exceeded that of White children (64 per 10 000). 20 In the United States, approximately 20% of African American children and between 10 and 13% of Latino/Hispanic children were substantiated for maltreatment compared to 10% of White children. 13 , 14 Conversely the cumulative incidence of substantiated maltreatment in Asian and Pacific Islander children was less than 5%. 13 , 14 In both countries the disparities in contact patterns between White and racialised or ethnic minority children have been attributed to greater socio‐economic disadvantage. 12 , 13 , 14 , 20 , 21 , 22 , 23 , 24 , 25 While the over‐representation of Aboriginal and Torres Strait Islander children and families in the CP system has long been documented, little is known about the CP contact of children from other racialised non‐Indigenous ethnic minority groups in Australia.
Culturally and linguistically diverse (CALD) background is a term unique to Australia. It is intended to identify groups who are not of the mainstream English‐speaking Anglo‐Celtic group and do not identify as Aboriginal or Torres Strait Islander (Australia's First Nations population). Although the term CALD is widely used in public and policy discourse, there are no consensus guidelines on how to enumerate this heterogeneous population. 26 Despite the availability of data collection frameworks for being counted as CALD, such as country of birth and language spoken, enumerating the CALD population lacks an operational definition. 26 , 27 Using data from the 2016 Australian Census, we have shown that applying different definitions that might identify the CALD population results in an estimated proportion of CALD children aged 0–17 ranging from 11 to 44%. 27
Only five previous studies have discussed CP contact for CALD children in Australia. Three of these involved considerations of the need to understand cultural diversity in regard to CALD and refugee CP contact but provided no data on incidence or prevalence. 28 , 29 , 30 These studies explored experiences of children within the CP system. Two studies conducted case file reviews with sample sizes of 81 and 120. 29 , 30 One surveyed organisations providing 20% of OOHC services in Victoria. 28 Hotton and Raman 31 presented data on country of origin among 279 children referred for child maltreatment assessment in South West Sydney health district, noting large variation among CALD groups and higher representation of Pacific Island children, but this study did not have whole population denominators to determine incidence or prevalence.
Our study objective is to describe, 32 , 33 cumulative incidence (risk) of child maltreatment, maltreatment type, and source of notification up to age 7, as well as socio‐demographic characteristics using our preferred definition of CALD and non‐CALD children attending government schools in South Australia (SA). Sensitivity analyses explored different population selection criteria and CALD definition, and accounted for the over‐representation of Aboriginal and/or Torres Strait Islander children in the CP system. This study utilised administrative data of all reports to the statutory CP agency. These reports are one indicator of maltreatment, of which the true burden in the community is unknown.
Methods
Data sources
This study used whole population de‐identified data from the SA Better Evidence, Better Outcomes Linked Data platform. Child protection records were linked with data from the Perinatal Statistics Collection, Births, Deaths and Marriages Registry, Government School Enrolment Census (SEC) and the 2009, 2012 and 2015 Australian Early Development Census (AEDC). Linkage was conducted by SANT Datalink, an independent agency. 34 The estimated false positive linkage error is 0.4%. 35
Population
Primary analysis included children born in SA who started in a government school between 2009 and 2015 (n = 76 563), corresponding to children born 2003–2010. Additional analysis describing socio‐economic characteristics was limited to children with complete information recorded at birth (n = 72 209) (Fig. 1).
Fig. 1.
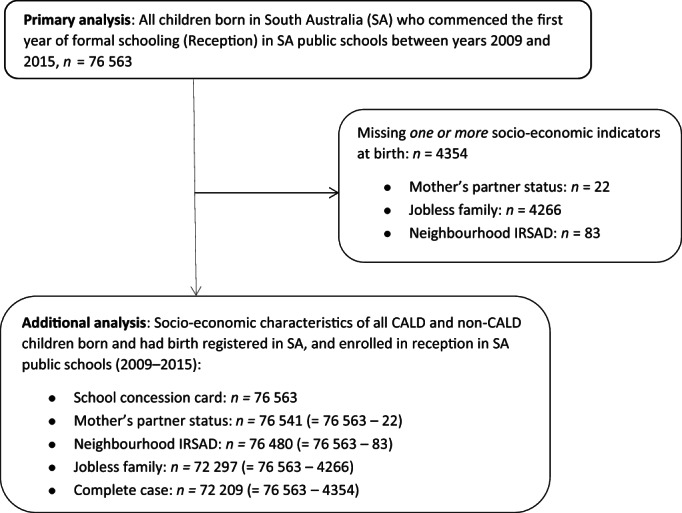
Flowchart of study population and sample for primary and additional analysis. CALD, culturally and linguistically diverse; IRSAD, Index of Relative Socioeconomic Advantage and Disadvantage.
Child protection contact
CP data cover the entire CP system from initial notifications by mandatory and non‐mandatory sources to experience of OOHC. These include initial notifications, notifications not screened‐in, screened‐in notifications not investigated, investigations not substantiated, substantiations, and OOHC. Other CP data included child age, reporter source (e.g. health, education, police), primary alleged (screened‐in notifications) and substantiated maltreatment type as determined by the Department for Child Protection. Definitions of maltreatment type are included in the Supporting Information.
CALD identification
Consistent with the theory behind understanding social experiences of racialised groups such as CALD, 36 , 37 we used an indicator of CALD based on a combination of language(s) spoken at home and parental country of birth. As many CALD children born in Australia have parents who were immigrants, the child's country of birth was not used. We defined CALD children as non‐Aboriginal or Torres Strait Islander who spoke a first or second language other than English, Celtic, Australian Indigenous or sign at home, and/or had at least one parent born in countries other than Australia, New Zealand, United Kingdom, Ireland, United States and Canada. These items were only available in the SEC for children attending government schools. Non‐CALD were all Aboriginal or Torres Strait Islander and non‐Indigenous peoples who spoke English, Celtic, any Australian Indigenous or sign language at home and had both parents born in Australia, New Zealand, United Kingdom, Ireland, United States, Canada or South Africa.
For sensitivity analysis to include children in non‐government schools, we used data from the AEDC to define CALD. This is similar to the definition above except that the child's country of birth was used, as parental country of birth was not available. Those from a non‐English language background and/or born in non‐English speaking countries were classified as CALD.
Socio‐economic disadvantage
Socio‐economic indicators were obtained from perinatal and birth registration data, and SEC. This included mother's partner status, mother's residential postcode, and father's and mother's workforce participation. Jobless families were those with no parent(s) participating in the workforce. 38 The Index of Relative Socioeconomic Advantage and Disadvantage was based on residential postcode, and a school concession card that subsidises education expenses. 39
Analysis
Primary analysis
Cumulative incidence of all levels of contact with CP was calculated at each age up to 7 years, by dividing the number of CALD and non‐CALD children who had contact with each level of CP by the total number of children. We estimated the risk of ever having CP contact by age 4 (to capture experiences before school), and by age 7, and relative risks and differences. Within the population of children who were reported we: (i) calculated proportions of children by age at first notification in infancy (<1 year), early childhood (1–4 years) and the first 3 years of formal schooling (5–7 years), by sex; (ii) calculated reporter type for reports up to age 4, and between ages 5 and 7; and (iii) examined primary alleged and substantiated maltreatment type for all reports up to age 7.
Additional analysis
We explored socio‐economic characteristics of families of CALD and non‐CALD children on a subset of the primary analysis population with complete data.
Sensitivity analysis
Agreement between two measures of CALD
We calculated classification agreement in a sub‐population with CALD indicators based on the SEC and AEDC. This population comprised children with an AEDC in government schools in 2009, 2012 or 2015, and included children not born in SA. To account for imbalanced outcomes we used the agreement coefficient (AC1) as a measure of concordance 40 , 41 between the measures of CALD (see Table S1, Supporting Information).
Variations to the study population
We undertook four sensitivity analyses: (i) We included children attending independent schools in addition to those in government schools, and used an alternative definition of CALD derived from the AEDC (where child's country of birth was used as parental country of birth was not available); (ii) We limited the analysis to an overlapping subset of the study population comprised of children who sat the AEDC in a government school in 2009, 2012 and 2015, and who were identified as CALD by either definition; (iii) Given the over‐representation of Aboriginal and Torres Strait Islander children in the CP system, the third sensitivity analysis excluded those children from the non‐CALD comparison group; and (iv) We repeated the primary, and the first and second sensitivity analyses to include all children, including migrant children who were not born in SA and so would not have a perinatal or birth record but could have AEDC and school records.
Ethics approval
Ethics approval was granted by the Human Research Ethics Committee of the South Australian Department of Health and Ageing (SA Health) (ref HREC/13/SAH/106; HREC/13/SAH/106/AM18), the University of Adelaide Human Research Ethics Committee (H‐185‐2011), and the Aboriginal Health Council Research Ethics Committee (ref 04‐13‐538).
Results
Primary analysis
Of the 76 563 children in the study population, 12.1% were CALD. Figure 2 shows the cumulative incidence of at least one notification was lower in CALD children at all ages. The cumulative incidence of CP notifications was 3.6 and 7.5% at under age 1 for CALD and non‐CALD children respectively. By age 7, the cumulative incidence of CP notifications was 21.4% for CALD and 35.1% for non‐CALD children. This corresponds to risk differences of 3.9 percentage points at age 0, and 13.7 percentage points at age 7. Cumulative incidence up to age 7 by different birth cohorts is shown in Figure S1 (Supporting Information).
Fig. 2.

Cumulative incidence of child protection notifications up to age 7 and enrolled in school from 2009 to 2015, followed to the end of 2017 (n = 76 563). ( ), culturally and linguistically diverse (CALD); (
 ), non‐CALD.
Table 1 shows all CP contact patterns. By ages 4 and 7, the risk of CP contact was lower for CALD compared to non‐CALD children across all levels of contact from notifications to OOHC. For example, by age 7, the risk difference between CALD and non‐CALD children for screened‐in was 7.6 percentage points, whilst for OOHC it was 1.6 percentage points. Risk ratios increased with greater intensity of contact so that by age 7 non‐CALD children had over three times the risk of being in OOHC (risk ratio = 3.52, 95% confidence interval (CI) 2.70–4.58).
Table 1.
Child protection contact by ages 4 and 7 years for children born in SA and in SA public schools between 2009 and 2015, followed to the end of 2017 (n = 76 563)
| Child protection contact | Non‐CALD, n = 67 339 | CALD, n = 9224 | Total, n = 76 563 | Risk difference (95% CI) (no‐nCALD‐ CALD) | Risk ratio (95% CI) (non‐CALD/CALD) |
|---|---|---|---|---|---|
| % with contact | % with contact | n (%) | |||
| By age 4 (prior to school years) | |||||
| Notified | 19.8 | 11.9 | 14 431 (18.8) | 7.8 (7.1, 8.6) | 1.66 (1.56, 1.75) |
| Screened in | 14.6 | 8.0 | 10 577 (13.8) | 6.6 (5.9, 7.2) | 1.82 (1.69, 1.95) |
| Investigated | 8.0 | 3.4 | 5693 (7.4) | 4.6 (4.2, 5.0) | 2.35 (2.11, 2.63) |
| Substantiated | 4.1 | 1.5 | 2914 (3.8) | 2.7 (2.4, 3.0) | 2.82 (2.38, 3.35) |
| OOHC | 1.6 | 0.5 | 1153 (1.5) | 1.1 (0.9, 1.3) | 3.09 (2.32, 4.11) |
| By age 7 (including first 3 years of school) | |||||
| Notified | 26.4 | 17.9 | 19 465 (25.4) | 8.5 (7.7, 9.4) | 1.48 (1.41, 1.54) |
| Screened in | 18.8 | 11.2 | 13 696 (17.9) | 7.6 (6.9, 8.3) | 1.68 (1.58, 1.78) |
| Investigated | 9.9 | 4.2 | 7078 (9.2) | 5.7 (5.3, 6.2) | 2.36 (2.14, 2.61) |
| Substantiated | 5.6 | 1.9 | 3931 (5.1) | 3.7 (3.4, 4.0) | 2.99 (2.57, 3.48) |
| OOHC | 2.2 | 0.6 | 1522 (2.0) | 1.6 (1.3, 1.8) | 3.52 (2.70, 4.58) |
CALD, culturally and linguistically diverse; CI, confidence interval; OOHC, out‐of‐home care.
Table 2 shows alleged and substantiated maltreatment type for screened‐in reports. Children may have multiple alleged and substantiated reports therefore may have more than one type of primary maltreatment. The maltreatment type at substantiation may differ from the alleged type following CP investigation. Emotional abuse was the most common alleged maltreatment, affecting 39.9% of CALD and 32.8% of non‐CALD children by age 7. Emotional abuse and neglect were the most common substantiated maltreatment for CALD and non‐CALD children, respectively, affecting approximately 40% of children in each group. CALD children were less likely to be screened‐ in or substantiated for neglect and sexual abuse compared to non‐CALD children. However, they are more likely to be screened in or substantiated for physical abuse than non‐CALD children. The proportion of CALD children who were substantiated for sexual abuse was approximately half that of non‐CALD children.
Table 2.
Primary maltreatment type by screened‐in allegations for 13 696 children, and substantiations for 3931 children up to age 7 years†, followed to the end of year 2017
| Maltreatment type | Screened in allegations (n children = 13 696) | Substantiations (n children = 3931) | ||||||
|---|---|---|---|---|---|---|---|---|
| Non‐CALD (n children = 12 664) | CALD (n children = 1032) | Non‐CALD (n children = 3759) | CALD (n children = 172) | |||||
| Allegations, n | Column percentage (%) | Allegations, n | Column percentage (%) | Substantiations, n | Column percentage (%) | Substantiations, n | Column percentage (%) | |
| Emotional abuse | 7970 | 32.8 | 616 | 39.9 | 1848 | 35.9 | 85 | 41.9 |
| Neglect | 7219 | 29.7 | 352 | 22.8 | 2029 | 39.5 | 61 | 30.0 |
| Physical abuse | 5632 | 23.2 | 410 | 26.6 | 859 | 16.7 | 49 | 24.1 |
| Sexual abuse | 3477 | 14.3 | 166 | 10.7 | 406 | 7.9 | 8 | 3.9 |
| Total screened in and substantiations | 24 298 | 100 | 1544 | 100 | 5142 | 100 | 203 | 100 |
Children can have more than one type of maltreatment due to multiple screened‐in or substantiated reports.
CALD, culturally and linguistically diverse.
Age patterns showed that of children notified to CP, 19.9% of CALD compared to 28.3% of non‐CALD children were notified before age 1, and 33.4% of CALD children were notified when school aged (5–7 years), compared with 25.2% of non‐CALD children. There were few sex differences with the exception of a higher proportion of CALD children substantiated by age 7 were females (55.2%) (age and sex data not shown).
Figure 3a shows the distribution of reporter type was similar with police as the main source under age 4, followed by reports from health, and family and personal social networks. Figure 3b shows that schools and police accounted for over half of reports in CALD and non CALD children aged 5 to 7 years.
Fig. 3.
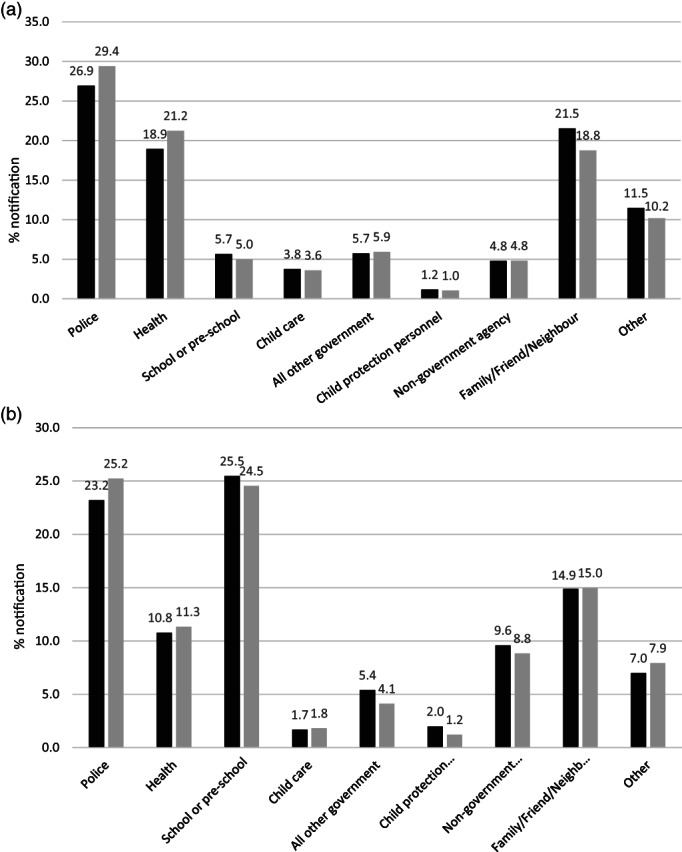
(a) Sources of all reports for children first notified by age 4 years. Denominator: number of notifications for children born in SA and attended reception in SA public schools between years 2009 and 2015 (n = 50 790). (b) Sources of all reports for children first reported between ages 5 and 7 years. Denominator: number of notifications for children born in SA and attended reception in SA public schools between years 2009 and 2015 (n = 40 968). Each child may be notified more than once. ( ), non‐culturally and linguistically diverse (CALD); (
 ), CALD.
Socioeconomic characteristics
Table 3 shows few socio‐economic differences, except mothers of CALD children were more likely to be partnered at birth.
Table 3.
Socio‐economic characteristics of culturally and linguistically diverse (CALD) and non‐CALD children
| Non‐CALD, n = 63 771 | CALD, n = 8438 | Total, n = 72 209 | |
|---|---|---|---|
| Column percentage (%) | Column percentage (%) | n Column percentage (%) | |
| Mother's partner status | |||
| Partner | 84.3 | 90.2 | 85.0 |
| No partner | 15.7 | 9.8 | 15.0 |
| Jobless family | |||
| No | 89.6 | 86.1 | 89.2 |
| Yes | 10.4 | 13.9 | 10.8 |
| IRSAD area‐based decile within Australia based on IRSAD for child year of birth | |||
| Most disadvantaged | 17.7 | 16.3 | 17.5 |
| 2 | 10.0 | 10.2 | 10.0 |
| 3 | 11.3 | 8.9 | 11.0 |
| 4 | 13.7 | 12.2 | 13.5 |
| 5 | 11.2 | 10.6 | 11.1 |
| 6 | 6.3 | 6.8 | 6.3 |
| 7 | 8.1 | 9.9 | 8.3 |
| 8 | 10.2 | 10.5 | 10.3 |
| 9 | 8.4 | 10.8 | 8.7 |
| Most advantaged | 3.1 | 3.8 | 3.2 |
| School concession card | |||
| No | 80.7 | 80.6 | 80.7 |
| Yes | 19.3 | 19.4 | 19.3 |
Study population: complete cases of children born and had birth registered in SA who attend reception in a SA public school between years 2009 and 2015, followed up until the end of year 2017 (n = 72 209).
IRSAD, Index of Relative Socioeconomic Advantage and Disadvantage.
Sensitivity analyses
Agreement between the two definitions of CALD (AC1 = 0.92) was high (see Table S1, Supporting Information).
Sensitivity analyses were consistent with the primary analysis where the risk of all forms of contact was lower in CALD children. Primary analysis showed that by age 7, the risk difference between CALD and non‐CALD was 7.6 percentage points. Sensitivity analyses bounded these risk differences from 5 to 9 percentage points. For OOHC risk differences ranged between 1.0 and 1.7 percentage points. Results of the sensitivity analyses are shown in Tables S2–S7 (Supporting Information).
Discussion
Previous Australian studies exploring CP contact in CALD children sampled those known to the CP system therefore did not aim to quantify the incidence of contact in the broader community. This study is the first in Australia to examine the risk of CP contact for CALD children at population level.
Using whole‐of‐population linked administrative data we demonstrated that the risk of all forms of contact with the CP system up to age 7 was lower for CALD than non‐CALD children. Our primary analysis showed that by age 7, CALD children were 7.6 percentage points (95% CI: 6.9–8.3) less likely to have been screened‐in, and of 1.6 percentage points (95% CI: 1.3–1.8) less likely to have experienced OOHC than non‐CALD children. In the absence of self‐identification, there is no gold standard for defining CALD populations. Using different definitions of CALD applied in different, and the same populations showed consistent findings. The magnitude of risk differences depends on which definitions and populations are used, but our estimates and sensitivity analyses showed that CALD children were from 5 to 9 percentage points less likely to have reached a risk threshold to be screened‐in, and from 1.0 to 1.7 percentage points less likely to have experienced OOHC. CALD and non‐CALD families appeared to have broadly similar socio‐economic profiles. Although beyond the scope of this study, further research could investigate these patterns of CP contact. A proposed framework theorising ethnic inequalities in child welfare identified different approaches, including examining data artefacts such as poor identification of ethnicity, ‘demand’ factors like cultural practices in child rearing and population distribution of known risk factors for child maltreatment, and ‘supply’ factors such as systemic bias and varying opportunities for surveillance. 20
We highlight some challenges to our study and how these were considered. First, the lack of an official definition of CALD poses a challenge in identifying this group. There is no consistency in how information to identify CALD are collected in administrative datasets used in this study. We endeavoured to address this issue by utilising a preferred definition which maximised the use of information consistent with the data collection framework for CALD specified by the Australian Bureau of Statistics. Additionally, we performed sensitivity analysis using an alternative definition of CALD which validated the findings of the primary analysis. Second, despite the obvious heterogeneity in a diverse CALD population, we did not do a further breakdown of CALD subgroups due to the challenge in creating meaningful subgroups of CALD. If CALD children were to be meaningfully categorised according to language spoken or parental country of birth, the small numbers that would be generated raises the risk of re‐identification. Conversely, creating broad categories (e.g. Asian, African) as has been done in studies elsewhere 20 , 21 may not support meaningful interpretation, and may inadvertently stigmatise subsets of the CALD community. Lastly, many CALD people would identify as immigrants, but we were not able to examine this because data on immigrant status is not currently available from the Australian government. Information on immigration status may enable further analysis to identify high need CALD subpopulations, such as refugees who are identified by visa subclass.
Conclusion
Up to age 7, CALD children had lower risk of contact across all levels of the CP system in South Australia, from notification to OOHC. CALD and non‐CALD groups differed by maltreatment type, but were similar for source of notification, or on background socio‐economic factors. This general pattern of lower risk among CALD populations was consistent across sensitivity analyses exploring different definitions of CALD and using different study populations.
Supporting information
Fig. S1. Cumulative incidence of child protection reports by age and year commenced Reception, 2009–2015 (A): CALD (B): non‐CALD.
Table S1. Number of children classified as CALD and non‐CALD by the preferred and alternative definitions of CALD (n = 34 217).
Table S2. Child protection contact by ages 4 and 7 years for children born in SA and sat the AEDC in SA in years 2009, 2012 and 2015, followed to the end of 2017 (n = 46 759).
Table S3. Child protection contact by ages 4 and 7 years for children born in SA and sat the AEDC in SA government school in years 2009, 2012 and 2015, followed to the end of 2017 (n = 29 172).
Table S4. Child protection contact by ages 4 and 7 years for non‐Indigenous children born in SA and attended reception in government schools between years 2009 and 2015, followed to the end of 2017 (n = 72 394).
Table S5. Child protection contact by ages 4 and 7 years for all children who attended reception in government schools between years 2009 and 2015, followed to the end of 2017 (n = 91 395).
Table S6. Child protection contact by ages 4 and 7 years for all children who sat the AEDC in SA in government and independent schools in years 2009, 2012 and 2015, followed to the end of 2017 (n = 55 232).
Table S7. Child protection contact by ages 4 and 7 years for all children who sat the AEDC in SA government schools in years 2009, 2012 and 2015, followed to the end of 2017 (n = 34 271).
Acknowledgements
J Lynch was awarded a National Health and Medical Research Council (NHMRC) Australia Fellowship (570120); the NHMRC Centre of Research Excellence (1099422); and the NHMRC Partnership Project Grant (1056888); Rhiannon Megan Pilkington, A Montgomerie was supported by funds from the NHMRC Centre for Research Excellence; AM Procter was supported by funds from the Westpac Scholars Trust; and RA Rahim was supported by the University of Adelaide Faculty of Health and Medical Sciences Divisional Scholarship. Open access publishing facilitated by The University of Adelaide, as part of the Wiley ‐ The University of Adelaide agreement via the Council of Australian University Librarians.
Conflict of interest: None declared.
References
- 1. Gilbert R, Spatz Widom C, Browne K, Fergusson D, Webb E, Janson S. Burden and consequences of child maltreatment in high‐income countries. Lancet 2009; 373: 68–81. [DOI] [PubMed] [Google Scholar]
- 2. Malvaso C, Pilkington R, Montgomerie A, Delfabbro P, Lynch J. A public health approach to preventing child maltreatment: An intelligent information infrastructure to help us know what works. Child Abuse Negl. 2020; 106: 104466. [DOI] [PubMed] [Google Scholar]
- 3. Higgins D, Lonne B, Herrenkohl TI, Scott D. The successes and limitations of contemporary approaches to child protection. In: Lonne B, Higgins D, Scott D, Herrenkohl TI, eds. Re‐Visioning Public Health Approaches for Protecting Children. Child Maltreatment, Contemporary Issues in Research and Policy, 22119701;9, 1st edn. Switzerland; Cham: Springer International Publishing; 2019. [Google Scholar]
- 4. Australian Institute of Health and Welfare . Child protection Australia 2020–21 . AIHW; 2022. Report No: CWS 87.
- 5. Pilkington R, Grant J, Chittleborough C, Gialamas A, Montgomerie A, Lynch J. Child Protection in South Australia. The University of Adelaide, BetterStart Child Health and Development Research Group School of Public Health ; 2017.
- 6. Falster K, Hanly M, Pilkington R et al. Cumulative incidence of child protection services involvement before age 5 years in 153 670 Australian children. JAMA Pediatr. 2020; 174: 995–7. [DOI] [PMC free article] [PubMed] [Google Scholar]
- 7. Croft J, Heron J, Teufel C et al. Association of trauma type, age of exposure, and frequency in childhood and adolescence with psychotic experiences in early adulthood. JAMA Psychiat. 2019; 76: 79–86. [DOI] [PMC free article] [PubMed] [Google Scholar]
- 8. Mills R, Scott J, Alati R, O'Callaghan M, Najman JM, Strathearn L. Child maltreatment and adolescent mental health problems in a large birth cohort. Child Abuse Negl. 2013; 37: 292–302. [DOI] [PMC free article] [PubMed] [Google Scholar]
- 9. Mills R, Kisely S, Alati R, Strathearn L, Najman JM. Cognitive and educational outcomes of maltreated and non‐maltreated youth: A birth cohort study. Aust. N. Z. J. Psychiatry 2019; 53: 248–55. [DOI] [PubMed] [Google Scholar]
- 10. Strathearn L, Giannotti M, Mills R, Kisely S, Najman J, Abajobir A. Long‐term cognitive, psychological, and health outcomes associated with child abuse and neglect. Pediatrics 2020; 146: e20200438. [DOI] [PMC free article] [PubMed] [Google Scholar]
- 11. Gilbert R, Fluke J, O'Donnell M et al. Child maltreatment: Variation in trends and policies in six developed countries. Lancet 2012; 379: 758–72. [DOI] [PubMed] [Google Scholar]
- 12. Rosenthal CM, Parker DM, Thompson LA. Racial disparities in child abuse medicine. JAMA Pediatr. 2021; 176: 119–20. [DOI] [PubMed] [Google Scholar]
- 13. Putnam‐Hornstein E, Ahn E, Prindle J, Magruder J, Webster D, Wildeman C. Cumulative rates of child protection involvement and terminations of parental rights in a California birth cohort, 1999–2017. Am. J. Public Health 2021; 111: 1157–63. [DOI] [PMC free article] [PubMed] [Google Scholar]
- 14. Wildeman C, Emanuel N, Leventhal JM, Putnam‐Hornstein E, Waldfogel J, Lee H. The prevalence of confirmed maltreatment among US children, 2004 to 2011. JAMA Pediatr. 2014; 168: 706–13. [DOI] [PMC free article] [PubMed] [Google Scholar]
- 15. Kim H, Wildeman C, Jonson‐Reid M, Drake B. Lifetime prevalence of investigating child maltreatment among US children. Am. J. Public Health 2017; 107: 274–80. [DOI] [PMC free article] [PubMed] [Google Scholar]
- 16. Sinha V, Trocme N, Fallon B, MacLaurin B. Understanding the investigation‐stage overrepresentation of first nations children in the child welfare system: An analysis of the first nations component of the Canadian incidence study of reported child abuse and neglect 2008. Child Abuse Negl. 2013; 37: 821–31. [DOI] [PubMed] [Google Scholar]
- 17. Bilson A, Cant RL, Harries M, Thorpe DH. A longitudinal study of children reported to the child protection department in Western Australia. Br. J. Soc. Work 2015; 45: 771–91. [Google Scholar]
- 18. Australian Institute of Health and Welfare . Child Protection Australia 2019–20. Canberra: AIHW; 2021, no.74. Cat. no. CWS 78. [Google Scholar]
- 19. Rouland B, Vaithianathan R, Wilson D, Putnam‐Hornstein E. Ethnic disparities in childhood prevalence of maltreatment: Evidence from a New Zealand birth cohort. Am. J. Public Health 2019; 109: 1255–7. [DOI] [PMC free article] [PubMed] [Google Scholar]
- 20. Bywaters P, Scourfield J, Webb C et al. Paradoxical evidence on ethnic inequities in child welfare: Towards a research agenda. Child. Youth Serv. Rev. 2019; 96: 145–54. [Google Scholar]
- 21. Bywaters P, Kwhali J, Brady G, Sparks T, Bos E. Out of sight, out of mind: Ethnic inequalities in child protection and out‐of‐home care intervention rates. Br. J. Soc. Work 2017; 47: 1884–902. [Google Scholar]
- 22. Kim H, Drake B. Child maltreatment risk as a function of poverty and race/ethnicity in the USA. Int. J. Epidemiol. 2018; 47: 780–7. [DOI] [PubMed] [Google Scholar]
- 23. Putnam‐Hornstein E, Needell B. Predictors of child protective service contact between birth and age five: An examination of California's 2002 birth cohort. Child. Youth Serv. Rev. 2011; 33: 1337–44. [Google Scholar]
- 24. Putnam‐Hornstein E, Needell B, King B, Johnson‐Motoyama M. Racial and ethnic disparities: A population‐based examination of risk factors for involvement with child protective services. Child Abuse Negl. 2013; 37: 33–46. [DOI] [PubMed] [Google Scholar]
- 25. Maguire‐Jack K, Lanier P, Johnson‐Motoyama M, Welch H, Dineen M. Geographic variation in racial disparities in child maltreatment: The influence of county poverty and population density. Child Abuse Negl. 2015; 47: 1–13. [DOI] [PubMed] [Google Scholar]
- 26. Pham TTL, Berecki‐Gisolf J, Clapperton A, O'Brien KS, Liu S, Gibson K. Definitions of culturally and linguistically diverse (CALD): A literature review of epidemiological research in Australia. Int. J. Environ. Res. Public Health 2021; 18: 737. [DOI] [PMC free article] [PubMed] [Google Scholar]
- 27. Abdul Rahim R, Pilkington R, D'Onise K, Lynch J. Capturing cultural and linguistic diversity in child health research in Australia. medRxiv 2020: 10.25.20219329. [Google Scholar]
- 28. Kaur J. Cultural Diversity and Child Protection: Australian Research Review on the Needs of Culturally and Linguistically Diverse (CALD) and Refugee Children and Families. Queensland, Australia: JK Diversity Consultants; 2012. [Google Scholar]
- 29. Sawrikar P, Katz I. ‘Normalizing the novel’: How is culture addressed in child protection work with ethnic‐minority families in Australia? J. Soc. Serv. Res. 2014; 40: 39–61. [Google Scholar]
- 30. Lewig K, Arney F, Salveron M. The Working with Refugees Families Project . Australian Centre for Child Protection, University of South Australia, 2009.
- 31. Hotton P, Raman S. Analysis of acute presentations for child protection medical assessments in a large, culturally diverse metropolitan setting. BMJ Paediatr. Open 2017; 1: e000120. [DOI] [PMC free article] [PubMed] [Google Scholar]
- 32. Hernan MA, Hsu J, Healy B. A second chance to get causal inference right: A classification of data science task. Chance. 2019; 32: 42–9. [Google Scholar]
- 33. Conroy S, Murray EJ. Let the question determine the methods: Descriptive epidemiology done right. Br. J. Cancer 2020; 123: 1351–2. [DOI] [PMC free article] [PubMed] [Google Scholar]
- 34. Pilkington R, Montgomerie A, Grant J et al. An Innovative Linked Data Platform to Improve the Wellbeing of Children – The South Australian Early Childhood Data Project. Australia's Welfare 2019 Data Insights. Australia's Welfare Series no. 14. AIHW: Canberra; 2019. [Google Scholar]
- 35. SA NT Datalink . Published Papers. Adelaide, South Australia: SA NT Datalink; 2020. Available from: https://www.santdatalink.org.au/Published_Papers [accessed 20 October 2021].
- 36. Krieger N. Discrimination and health inequities. Int. J. Health Serv. 2014; 44: 643–710. [DOI] [PubMed] [Google Scholar]
- 37. Priest N, Baxter J, Hayes L. Social and emotional outcomes of Australian children from indigenous and culturally and linguistically diverse backgrounds. Aust. N. Z. J. Public Health 2012; 36: 183–90. [DOI] [PubMed] [Google Scholar]
- 38. Procter AM, Pilkington RM, Lynch JW, Smithers LG, Chittleborough CR. Potentially preventable hospitalisations in children: A comparison of definitions. Arch. Dis. Child. 2020; 105: 375–81. [DOI] [PubMed] [Google Scholar]
- 39. Government of South Australia. School Card Scheme. South Australia: Government of South Australia; 2021. Available from: https://www.sa.gov.au/topics/education‐and‐learning/financial‐help‐scholarships‐and‐grants/school‐card‐scheme [accessed 10 February 2021].
- 40. Shankar V, Bangdiwala SI. Observer agreement paradoxes in 2×2 tables: Comparison of agreement measures. BMC Med. Res. Methodol. 2014; 14: 100. [DOI] [PMC free article] [PubMed] [Google Scholar]
- 41. Gwet KL. Computing inter‐rater reliability and its variance in the presence of high agreement. Br. J. Math. Stat. Psychol. 2008; 61: 29–48. [DOI] [PubMed] [Google Scholar]
Associated Data
This section collects any data citations, data availability statements, or supplementary materials included in this article.
Supplementary Materials
Fig. S1. Cumulative incidence of child protection reports by age and year commenced Reception, 2009–2015 (A): CALD (B): non‐CALD.
Table S1. Number of children classified as CALD and non‐CALD by the preferred and alternative definitions of CALD (n = 34 217).
Table S2. Child protection contact by ages 4 and 7 years for children born in SA and sat the AEDC in SA in years 2009, 2012 and 2015, followed to the end of 2017 (n = 46 759).
Table S3. Child protection contact by ages 4 and 7 years for children born in SA and sat the AEDC in SA government school in years 2009, 2012 and 2015, followed to the end of 2017 (n = 29 172).
Table S4. Child protection contact by ages 4 and 7 years for non‐Indigenous children born in SA and attended reception in government schools between years 2009 and 2015, followed to the end of 2017 (n = 72 394).
Table S5. Child protection contact by ages 4 and 7 years for all children who attended reception in government schools between years 2009 and 2015, followed to the end of 2017 (n = 91 395).
Table S6. Child protection contact by ages 4 and 7 years for all children who sat the AEDC in SA in government and independent schools in years 2009, 2012 and 2015, followed to the end of 2017 (n = 55 232).
Table S7. Child protection contact by ages 4 and 7 years for all children who sat the AEDC in SA government schools in years 2009, 2012 and 2015, followed to the end of 2017 (n = 34 271).