

Abstract
Human genome-wide association studies found single nucleotide polymorphisms (SNPs) near LYPLAL1 (Lysophospholipase 1) that have sex-specific effects on fat distribution and metabolic traits. To determine whether altering LYPLAL1 affects obesity and metabolic disease we created and characterized a mouse knockout of Lyplal1. We fed the experimental group of mice high fat, high sucrose (HFHS) diet for 23 weeks, and the controls were fed regular chow diet. Here we show that CRISPR-Cas9 whole-body Lyplal1 knockout (KO) mice fed a HFHS diet showed sex-specific differences in weight gain and fat accumulation as compared to chow diet. Female, not male, KO mice weighed less than WT mice, had reduced body fat percentage, white fat mass, and adipocyte diameter not accounted for by changes in metabolic rate. Female, but not male, KO mice had increased serum triglycerides, decreased aspartate, and alanine aminotransferase. Lyplal1 KO mice of both sexes have reduced liver triglycerides and steatosis. These diet-specific effects resemble the effects of SNPs near LYPLAL1 in humans, suggesting that LYPLAL1 has an evolutionary conserved sex-specific effect on adiposity. This murine model can be used to study this novel gene-by-sex-by-diet interaction to elucidate the metabolic effects of LYPLAL1 on human obesity.
Keywords: adipose, steatosis, diet-induced obesity, sex-based phenotype
Introduction
Obesity is global health problem that promotes morbidity and mortality but has few effective treatments making it a large unmet medical need. Abdominal obesity, measured as a high waist to hip ratio (WHR) or high visceral to subcutaneous adipose tissue (VAT/SAT) ratio more than overall obesity measured as high body mass index (BMI) correlates with the development of diabetes, cardiovascular disease, dyslipidemia and nonalcoholic fatty liver disease (NAFLD) (Britton et al., 2013, Censin et al., 2019, Kaess et al., 2012, Preis et al., 2010, Speliotes et al., 2010). Body fat distribution is heritable and varies by sex but the underlying genetic causes of this variation are not fully known (Schleinitz et al., 2014).
Human genome-wide association studies (GWAS) identified genetic variants near the LYPLAL1 gene that reproducibly associate with VAT/SAT ratio (Chu et al., 2017, Fox et al., 2012, Wang et al., 2016), WHR (Heid et al., 2010, Lindgren et al., 2009, Randall et al., 2013), and NAFLD (Leon-Mimila et al., 2015, Speliotes et al., 2011). Variants near LYPLAL1 have also been associated with metabolic traits including: insulin clearance (Goodarzi et al., 2013), insulin resistance (Bille et al., 2011, Manning et al., 2012, Scott et al., 2012), fasting serum triglyceride levels (Bille et al., 2011) and levels of the adipose tissue derived adiponectin hormone (Dastani et al., 2012). Associations between variants near LYPLAL1 with several of these metabolic traits were more significant in females than males including VAT/SAT ratio (Fox et al., 2012, Wang et al., 2016), WHR (Heid et al., 2010, Lindgren et al., 2009), and WHR adjusted for BMI (Randall et al., 2013, Shungin et al., 2015). Whether associated SNPs function to cause these effects via LYPLAL1 is not known.
LYPLAL1 encodes the protein Lysophospholipase Like 1 (LYPLAL1), which is presumed to be an acyl protein thioesterase based upon significant sequence homology and structural similarities with LYPLA1 (Lysophospholipase 1, also known as Acyl-Protein Thioesterase 1 or APT1) (Burger et al., 2012). Acyl protein thioesterases are enzymes that remove lipid moieties from proteins that have been modified by the addition of palmitate or other acyl groups on cysteine residues (Davda and Martin, 2014). LYPLAL1 may also function as an acyl thioesterase and have a role in the regulation of protein acylation and thereby protein localization and activity (Tian et al., 2012).
To determine whether disruption of LYPLAL1 would affect obesity and metabolic phenotypes we generated a mouse model lacking LYPLAL1(referred to as Lyplal1 KO mice) using Cas9/CRISPR to induce a one base pair deletion in the first coding exon of the gene. Since Lyplal1 mRNA expression and effects on metabolic phenotype appear to be at least in part diet responsive(Lei et al., 2015) we investigated the effects of a “Western diet” containing high fat and high sucrose on the phenotype of WT mice versus mice lacking LYPLAL1.
Materials and Methods
I. Animal Studies
All experiments were carried out in accordance with the University of Michigan Institutional Animal Care and Use Committees (IACUC) under the protocol #PRO00007699. Methods are reported in accordance with the ARRIVE guidelines. mice were maintained in individually vented cages in a pathogen free Unit for Laboratory Animal Medicine (ULAM) at 23.2°C to 23.9°C, 37% to 41% relative humidity, and in a standard 12-h light/12-h dark cycle.
II. Generation and confirmation of Lyplal1 KO mice
CRISPR/Cas9 technology (Cong et al., 2013, Jinek et al., 2013, Mali et al., 2013) was used to generate a C57BL6/J mouse strain with a one base pair deletion in the first exon of Lyplal1.
III. Research Study Design
Littermates were separated by sex and placed on a HFHS diet (D12327; 40% kCal from fat, from Research Diets, New Brunswick, NJ) or standard control diet (chow; Lab Diet 5L0D) and water ad libitum at 6-weeks of age and remained on this diet until 29 weeks of age (23 weeks on diet) with whole body weights collected weekly. HFHS fed mice had (1) NMR (Nuclear Magnetic Resonance) and Comprehensive Laboratory Animal Monitoring System (CLAMS) analyses at 17-weeks and 23-weeks of age, respectively (11 and 17-weeks on diet), (2) Intravenous Glucose Tolerance Tests (GTT) and Intravenous Insulin Tolerance Tests (ITT) at 21 and 24-weeks of age (15 and 18-weeks on diet) respectively and ex-vivo analyses at 29-weeks of age (23 weeks on diet) . Chow fed animals had (1) NMR and CLAMS analyses at 39–45 weeks of age, GTT at 26–40weeks of age, and ex-vivo analyses at 32–52 weeks of age.
IV. In-vivo analysis
A. NMR (Nuclear Magnetic Resonance) Analysis:
Lean, fat, and fluid tissue composition percentages were measured using a Bruker Minispec LF 90II NMR machine by the Michigan Mouse Metabolic Phenotyping Center (MMPC) at the University of Michigan according to standard protocols.
B. Comprehensive Laboratory Animal Monitoring System (CLAMS):
Indirect calorimetry was carried out on mice fed HFHS using a Columbus Instruments Comprehensive Lab Animal Monitoring System (CLAMS, Columbus, OH). Measurements and analyses were performed by the University of Michigan Animal Phenotyping Core according to standard protocols.
C. Intraperitoneal glucose tolerance tests (GTT) and intraperitoneal insulin tolerance tests (ITT):
Both GTT and ITT were performed in accordance with NIH National Mouse Metabolic Phenotyping Centers (MMPC) protocols. Animals were transferred to non-edible bedding and fasted 5 hours prior to measuring fasting glucose. Animals were injected intraperitoneally with sterile dextrose solution (in saline) at 2.0 mg dextrose/g bodyweight for GTT or insulin solution (Human recombinant insulin in saline; Novolin-R, Novo Nordisk) at 2.0 U/kg bodyweight for ITT. Blood samples were collected from a distal tail nick and blood glucose determined with a handheld glucometer (Bayer Contour next EZ) at 0, 15, 30, 60, 90, and 120-minute time points post-injection. Animals had free access to water during testing, but food was withheld until the end of the 120-minute time course. Blood glucose concentration (mg/dL) over time (minutes) was plotted and area under the curved calculated with Prism8 (GraphPad).
V. Ex-vivo analysis
A. Blood collection and Tissue harvest:
Mice were sacrificed under isoflurane anesthesia by cardiac puncture. Blood (400–600 µl) was collected into BD Microtainer Blood Collection tubes with clot activator gel containing heparin (BD, Franklin Lakes, NJ). Serum was generated by centrifugation and sent to the University of Michigan In-Vivo Animal Core (IVAC) for quantitation of serum liver enzymes and serum lipid traits. Liver, kidney, and 4 fat depots (Brown adipose tissue [BAT], perirenal WAT [pWAT], gonadal WAT [gWAT] and inguinal WAT [iWAT]) were collected immediately post-sacrifice. Tissue samples were either flash frozen on dry ice for biochemical analyses or incubated at 4°C in 4% paraformaldehyde (PFA) in phosphate buffered saline (PBS) for histology.
B. Protein extraction and Western blot:
Western blots from kidney tissue lysate of WT and Lyplal1 KO mice were used to confirm loss of LYPLAL1 protein in Lyplal1 KO animals. We also examined the level of abundance of the estrogen receptor alpha subunit (ERalpha) in protein extracts from different tissues using western blots. Antibodies used were rabbit anti-Lyplal1 (Proteintech Group, Rosemont, IL, USA; Catalog #: 16146-1-AP; RRID: AB_2138521; 1:400), rabbit anti-ERalpha (Proteintech Group, Rosemont, IL, USA; Catalog # 21244-1-AP; 1:1000), mouse anti-GAPDH (Proteintech Group, Rosemont, IL, USA; Catalog #: 60004-1-lg; RRID:AB_2107436; 1:5000 (Figure 1)) and rabbit anti-GAPDH (CellSignaling Technology, Danvers, MA, USA; Catalog #:2118; 1:2000 (Figure 10)).
Figure 1: Female Lyplal1 KO mice have reduced body weight on high fat high sucrose diet, but not chow diet.

(A) A genomic single base pair deletion (cyan, downward pointing arrow) located within the guide RNA (gRNA) DNA target sequence (orange) of exon 1 of murine Lyplal1 was generated utilizing CRISPR-Cas9 editing. This deletion resulted in a frameshift in the gene and expression of mRNA encoding 11 correct (green) and 13 incorrect (red) amino acids before terminating prematurely. Early termination of the transcript triggers nonsense-mediated decay of Lyplal1 mRNA, resulting in loss of Lyplal1 expression. Exons are depicted proportional in size to the number of base pairs within each exon.
(B) Western blot from kidney tissue lysate of WT and Lyplal1 KO mice probed with antibodies against LYPLAL1 and GAPDH confirm loss of LYPLAL1 protein in Lyplal1 KO animals. Three mice from each genotype and sex are shown. Also see Supplemental Figure 8.
(C) Average weekly body weight (grams) of male and female WT, Lyplal1 heterozygous, and Lyplal1 KO mice at initiation of HFHS diet (6 weeks of age) to 20 weeks on HFHS diet (26 weeks of age) is shown. Error bars indicate SEM.
(D) Two-tailed t-test p values for weekly body weight (grams) of male and female WT, Lyplal1 heterozygous, and Lyplal1 KO mice at initiation of HFHS diet (6 weeks of age) to 20 weeks on HFHS diet (26 weeks of age) is shown.
(E) Average body weight (grams) of male and female WT and Lyplal1 KO mice at the time of sacrifice on standard control diet (chow) and HFHS diet by sex.
Lyplal1 KO mice are abbreviated as KO and wildtype mice as WT in all figures. Data are depicted as the mean ± SD. Unless otherwise stated, all data are from n= 32 mice on HFHS diet (females: 8 WT & 9 Lyplal1 KO, males: 8 WT & 7 Lyplal1 KO mice) and n= 36 mice on chow diet (females: 8 WT & 11 KO, males: 9 WT & 8 KO). *, p<0.05; **, p<0.01; ***, p<0.001.
Figure 10: Western Blotting of protein extracts from adipose, liver and muscle tissue with anti Estrogen Receptor alpha antibody.

(A) Protein extracts from adipose tissue (iWAT, gWAT), liver tissue, or muscle tissue (Female WT left, Female KO left right) were western blotted with anti-ERα and anti-GAPDH antibodies. (B) Plots of the ratio of ERα/GAPDH signal. Data are depicted as mean and individual data points. *, p<0.05; **, p<0.01; ***, p<0.001. WT females are red circles, KO females are blue squares.
C. Triglyceride extraction:
Frozen liver tissue samples (0.1g) were homogenized in 1X triglyceride extraction buffer (1 m of 50 mM Tris, pH7.4; 5 mM EDTA; 5% NP-40% [Tergitol]) supplemented with 1X Halt protease and phosphatase inhibitor cocktail (from Thermo Scientific, Rockfold, IL, USA) and 1mM phenylmethylsulfonyl fluoride (PMSF) using a Benchmark D1000 Handheld Homogenizer (Benchmark Scientific, Edison, NJ, USA). The solution was slowly heated on a heat block to 80°C and the solution appeared cloudy. The samples were taken off heat and allowed to cool to RT. Samples were then slowly reheated to 80°C, incubated at this temperature for 5 minutes, centrifuged at 10,000 x g for 10 minutes at 4°C, and triglyceride content determined by comparison to a 2.5 mg/mL glycerol standard (Sigma, St. Louis, MO, USA) using the Sigma serum triglyceride kit (Sigma, St. Louis, MO, USA).
D. Glycogen extraction:
Liver tissue (0.05g) was homogenized on ice in 4ml of distilled water using a Benchmark D1000 Handheld Homogenizer (Benchmark Scientific, Edison, NJ, USA). Samples were heated to 100°C on a heat block for 10 minutes, centrifuged at 10,000 x g for 10 minutes at 4°C, supernatant collected and glycogen measured alongside a 2 mg/mL glycogen standard using the Sigma glycogen assay kit (Catalog No. MAK016, Sigma, St. Louis, MO, USA).
E. Histology and Immunochemistry:
Formalin-fixed tissues were processed through graded alcohols and cleared with xylene followed by infiltration with molten paraffin using an automated VIP5 or VIP6 tissue processor (TissueTek, Sakura-Americas, Torrance, CA) according to the In-Vivo Animal Core (IVAC) histology laboratory within ULAM at the University of Michigan. Following paraffin embedding using a Histostar Embedding Station (ThermoScientific, Hanover Park, IL), tissues were sectioned on a M 355S rotary microtome (ThermoFisher Scientific, Hanover Park, IL) at 4 μm thickness and mounted on glass slides. The sections were stained with Hematoxylin and Eosin (H&E), Masson’ Trichrome Staining, Periodic Acid Schiff Staining with and Without Diastase.
Brightfield images were taken at 20X using an Aperio AT2 scanner (Leica Biosystems, Buffalo Grove, IL) and visualized using Aperio ImageScope - Pathology Slide Viewing Software in the Department of Pathology, University of Michigan.
F. Assessment of liver pathology:
Blinded grading (0–3) of H&E-stained liver sections was performed by a board-certified liver pathologist (E.C.) based on previous classifications (Brunt et al., 2011, Kleiner et al., 2005). Periodic acid-Schiff (PAS) stain with and without diastase (PAS-D) pretreatment were assessed by a board-certified liver pathologist for changes suggestive of increased liver glycogen.
G. Adipocyte quantification:
H&E-stained slides were reimaged using an Olympus BX43 microscope. Adipocyte cell boundaries fluoresce under the Texas red filter (Peak excitation wavelength 592nm, Peak emission wavelength 614nm). Fluorescent images were quantified using an adapted CellProfiler pipeline (RRID:SCR_007358) (Carpenter et al., 2006, Jones et al., 2008) optimized for adipocyte histology (Berry et al., 2014). Adipocyte diameter was calculated from median AreaShape_Area determined by CellProfiler using the formula:
VI. Statistical analysis
Normally distributed values were expressed as the mean +/− standard deviation and non-normal data as median and interquartile range. Normal data was analyzed using a two tailed student’s test and non-normal data using a non-parametric, non-paired, Mann-Whitney test using Prism9 (GraphPad). Due to inherent biological differences in the level of liver triglycerides in male versus female mice, we used multiple linear regression on the triglyceride ranks adjusting for sex. p < 0.05 was considered statistically significant.
VII. Lead Contact and Materials Availability
Mouse lines generated in this study have been deposited to the Mutant Mouse Resource & Research Center (MMRRC) designated as Lyplal1em1Espel with the MMRRC strain ID number of 571.
Results
Female, but not male, Lyplal1 KO mice on HFHS diet weigh less than their WT littermates
In order to study the effects of LYPLAL1 on metabolic phenotypes and traits, we used CRIPSR-Cas9 to delete a single base pair within exon 1 of the murine Lyplal1 gene, resulting in nonsense-mediated LYPLAL1 mRNA decay (Figure 1A). Western blot analyses of kidney tissue confirmed lack of LYPLAL1 protein in Lyplal1 KO mice (Figure 1B and Supplemental Figure 1). Due to the absence of a phenotype in Lyplal1 KO mice on high fat diet (HFD) previously observed (Watson et al., 2017), we chose to study the effect of a challenge diet representative of the human “Western” diet (high fat high sucrose diet; HFHS diet) on Lyplal1 KO mice versus WT mice. WT mice, mice heterozygous for Lyplal1 KO (Lyplal1 Het mice), and mice homozygous for Lyplal1 KO (Lyplal1 KO mice) were placed on a HFHS diet for 23 weeks. Lyplal1 KO mice on HFHS diet showed reduced body weight gain over time in females, but not males when compared to WT littermates (Figure 1C). Female Lyplal1 KO mice showed significant weight difference (p <0.05) at 6 weeks on diet with respect to WT littermates and the significance in weight difference continued to increase with additional time on HFHS diet (Figure 1D). No significant differences between female Lyplal1 Het mice and their WT littermates were observed (Figure 1C). This suggests that the Lyplal1 KO phenotype is recessive and for this reason, only WT and homozygous Lyplal1 KO mice were compared for all further experiments. The difference in weight between female WT and Lyplal1 KO mice was observed up to the final measurement taken at time of sacrifice (29 weeks of age, 23 weeks of HFHS diet exposure; Figure 1E). As previously seen (Munoz-Fuentes et al., 2018, Watson et al., 2017), we did not observe differences in weight between WT and Lyplal1 KO mice of either sex when fed a standard control diet (chow) and measured at the time of sacrifice (32–52 weeks of age; Figure 1E).
Female, but not male, Lyplal1 KO mice on HFHS diet have less white, but not brown, adipose tissue than WT littermates
To determine whether the change in body weight was due to changes in fluid, lean tissue, or fat tissue mass we measured body composition using nuclear magnetic resonance (NMR) (Heymsfield et al., 2014, Tinsley et al., 2004). We also carried out quantitative dissection of four mouse fat depots (depicted in Figure 2A) (Bagchi et al., 2018). We found that female, but not male, Lyplal1 KO mice on HFHS diet had a reduced percentage of body fat and a concomitant increase in the percentage of lean tissue mass indicative of reduced fat accumulation (Figure 2B). The difference in average fat mass (9.36 g WT females vs 5.61 g Lyplal1 KO females) accounts for 77% of the difference in total body mass (29.95 g WT females vs 25.09 g Lyplal1 KO females). Quantitative dissection showed that female, but not male, Lyplal1 KO mice had reduced inguinal white adipose tissue (iWAT), gonadal white adipose tissue (gWAT), and perirenal white adipose tissue (pWAT; Figure 2C), but no change in intrascapular brown adipose tissue (BAT; Figure 2C) when compared to WT littermates. The liver and spleen weights of female and male WT vs. Lyplal1 KO mice on HFHS diet did not differ significantly (Figure 2D). Differences in body fat percentage were not observed in mice of either sex on chow diet (Figure 2E). Additionally, differences in fat depot mass were not observed in mice on chow diet, except for a slight but statistically significant decrease in iWAT mass in Lyplal1 KO chow-fed male mice (Figure 2F); however, this difference was largely driven by the grossly elevated iWAT mass from two male WT mice. Liver and spleen weights of these chow-fed mice did not differ by genotype (Figure 2G). These data indicate the observed difference in fat deposition between genotypes of female mice is induced by feeding a HFHS diet.
Figure 2: Reduced body weight in female Lyplal1 KO mice on HFHS diet is due to reduced white adipose tissue mass.

(A) Locations of inguinal white adipose tissue (iWAT), gonadal WAT (gWAT), perirenal WAT (pWAT), and intrascapular brown adipose tissue (BAT) that were dissected are noted. (B) Body composition of mice on HFHS diet assessed by NMR shows reduced percentage of fat and a concomitant increased percentage of lean tissue in female, but not male, Lyplal1 KO mice. (C) Female, but not male, Lyplal1 KO mice on HFHS diet have reduced white adipose depot mass (gWAT, pWAT, and iWAT), but no difference in BAT mass. (D). No difference, by sex or genotype, was observed in liver and spleen mass from mice on HFHS diet. With mice on chow diet (E-G), no difference in NMR measured body composition (E), fat depot mass (F), or liver and spleen mass (G) of mice on chow diet were observed.
Data are depicted as the mean ± SD. *, p<0.05; **, p<0.01; ***, p<0.001; ****, p<0.0001; (non-significant differences are marked ns) and are from n= 32 mice on HFHS diet (females: 8 WT & 9 Lyplal1 KO, males: 8 WT & 7 Lyplal1 KO mice) and from n= 36 mice on chow diet (females: 8 WT & 11 Lyplal1 KO, males: 9 WT & 8 Lyplal1 KO). WT females are red circles, KO females are blue squares, WT males are orange triangles and KO males are green diamonds. Mice on HFHS diet are closed symbols and mice on chow diet are open symbols.
Female, but not male, Lyplal1 KO mice on HFHS diet have smaller adipocytes than WT littermates
Excess calories promote an increase in adipocyte cell size called hypertrophy (Bluher, 2009). To determine if there were differences in adipocyte size between WT and Lyplal1 KO mice we quantified adipocyte diameter from 5 randomly sampled, representative images of hematoxylin and eosin (H&E) stained sections of gWAT (visceral) and iWAT (subcutaneous; Figure 3A, C). We found that female, but not male, Lyplal1 KO animals on HFHS diet had fewer large (> 60 µm diameter) adipocytes in gWAT and iWAT compared to WT littermates (Figure 3B & 3D). Conversely, we observed less pronounced changes in adipocyte diameter in chow-fed mice (Figure 4A-D). Decrease in adipocyte size of female Lyplal1 KO mice on HFHS is consistent with impaired diet-induced adipose cell hypertrophy.
Figure 3: Adipocyte diameter is reduced in female Lyplal1 KO mice on HFHS diet.

(A & C) Grayscale representative images of H&E stained sections of gWAT and iWAT from mice on HFHS diet are shown imaged in brightfield (top image row) alongside the objects identified as individual adipocytes by the CellProfiler adipocyte pipeline (bottom image row).
(B & D) Adipocyte diameter analyzed from gWAT (B) and iWAT (D) in female (left) and male (right) mice were generated by the CellProfiler adipocyte pipeline (see methods for more details) and are displayed as a histogram of adipocyte diameter in 10 µm bins.
All adipocyte analyses are from 5 randomly captured fields of each fat depot from the 32 mice on HFHS diet and are depicted as the mean ± SD of 2845 to 7076 individual adipocytes analyzed from each fat depot per genotype and sex. *, p<0.05; **, p<0.01; ***, p<0.001 (non-significant differences are marked ns). WT females are red circles, KO females are blue squares, WT males are orange triangles and KO males are green diamonds.
Figure 4: Differences in adipocyte diameter associated with disruption of Lyplal1 are less pronounced in mice on chow diet.

(A & C) Grayscale representative images of H&E stained sections of gWAT and iWAT from mice on chow diet are shown imaged in brightfield (top image row) alongside the objects identified as individual adipocytes by the CellProfiler adipocyte pipeline (bottom image row).
(B & D) Adipocyte diameter analyzed from gWAT (B) and iWAT (D) in female (left) and male (right) mice were generated by the CellProfiler adipocyte pipeline (see methods for more details) and are displayed as a histogram of adipocyte diameter in 10 µm bins.
All adipocyte analyses are from 5 randomly captured fields of each fat depot from n=16 mice on chow diet (females: 3 WT & 8 Lyplal1 KO, males: 2 WT & 3 Lyplal1 KO) and are depicted as the mean ± SD of 2845 to 7076 individual adipocytes analyzed from each fat depot per genotype and sex. *, p<0.05; **, p<0.01; ***, p<0.001 (non-significant differences are marked ns). WT females are red circles, KO females are blue squares, WT males are orange triangles and KO males are green diamonds.
Lyplal1 KO mice do not have differences in food intake or energy expenditure, however male, but not female, Lyplal1 KO mice have different fuel utilization compared to WT littermates
To determine whether food intake, energy expenditure, or fuel utilization was affected by disruption of Lyplal1 we measured these using the Comprehensive Lab Animal Monitoring System (CLAMS) on animals fed a HFHS diet. We found that food intake (Figure 5A), activity level (Figure 5B), and energy expenditure (Figure 5C) were not significantly different over the course of an individual day between WT and Lyplal1 KO mice of either sex. Decreased food intake was observed in both male and female Lyplal1 KO mice during the light cycle compared to WT littermates, but these differences were not significant across the entire day. Female mice showed no difference in respiratory exchange ratio (RER; Figure 5D), fat oxidation (Figure 5E) or glucose oxidation (Figure 5F) compared to WT littermates. Conversely, male Lyplal1 KO mice showed significant or trending decreases in glucose oxidation during the light (p=0.09) and dark cycles (p=0.04), as well as across the whole day (p=0.06), compared to WT littermates (Figure 5F). Male Lyplal1 KO mice had nominally lower RER during the light cycle compared to WT littermates, but these changes were not significant across the whole day (Figure 5D). These data indicate female Lyplal1 KO mice do not have reduced body weight gain and fat accumulation due to differences in food intake, energy expenditure or fuel utilization compared to WT littermates. Male Lyplal1 KO mice had a reduced rate of glucose utilization compared to WT littermates, but a significant weight difference was not observed between the male genotypes. We observed no clear differences in total RER and fat versus glucose oxidation measured by CLAMS in female Lyplal1 KO mice compared to WT mice on HFHS diet (Figure 5D-F). However, we did observe changes in male Lyplal1 KO mice versus WT mice (Figure 5D-F).
Figure 5: Daily differences in food intake, total activity, or energy expenditure were not observed between WT and Lyplal1 KO mice on HFHS diet, while male mice differed in substrate utilization preference by genotype.

(A-F) Average weight of food consumed (A; g/hr), total activity (B; counts/hr), energy expenditure (C; kcal/KgLBM/hr), respiratory exchange ratio (D; VCO2/VO2), fat oxidation (E; g/KgLBM/hr), and glucose oxidation (F; g/KgLBM/hr) calculated from direct measurements of food consumption, activity, VCO2, and VO2 of singly housed mice on HFHS diet are shown.
Data are shown as mean ± SD over 3 days for light cycle, dark cycle, and total day (light + dark). *, p<0.05; **, p<0.01; ***, p<0.001 (non-significant differences are marked ns) and are from n= 32 mice on HFHS diet (females: 8 WT & 9 Lyplal1 KO, males: 8 WT & 7 Lyplal1 KO mice).
Female, but not male, Lyplal1 KO mice have similar glucose and insulin tolerance compared to WT littermates
Insulin resistance, or the inability of cells to uptake glucose in response to insulin has been associated with obesity (Czech, 2017, Erion and Corkey, 2017, Reaven et al., 1993). To determine whether insulin secretion or responsiveness was affected by disruption of Lyplal1 we measured fasting glucose and insulin and performed both an intraperitoneal glucose tolerance test (GTT) and an intraperitoneal insulin tolerance test (ITT) on the mice. Female and male mice on either HFHS or chow diet had similar glucose and insulin tolerance over time and did not show differences by genotype (Figure 6A-D(HFHS) or E-H(Chow)).
Figure 6: Female Lyplal1 KO mice on HFHS diet have similar glucose and insulin tolerance compared to WT littermates.
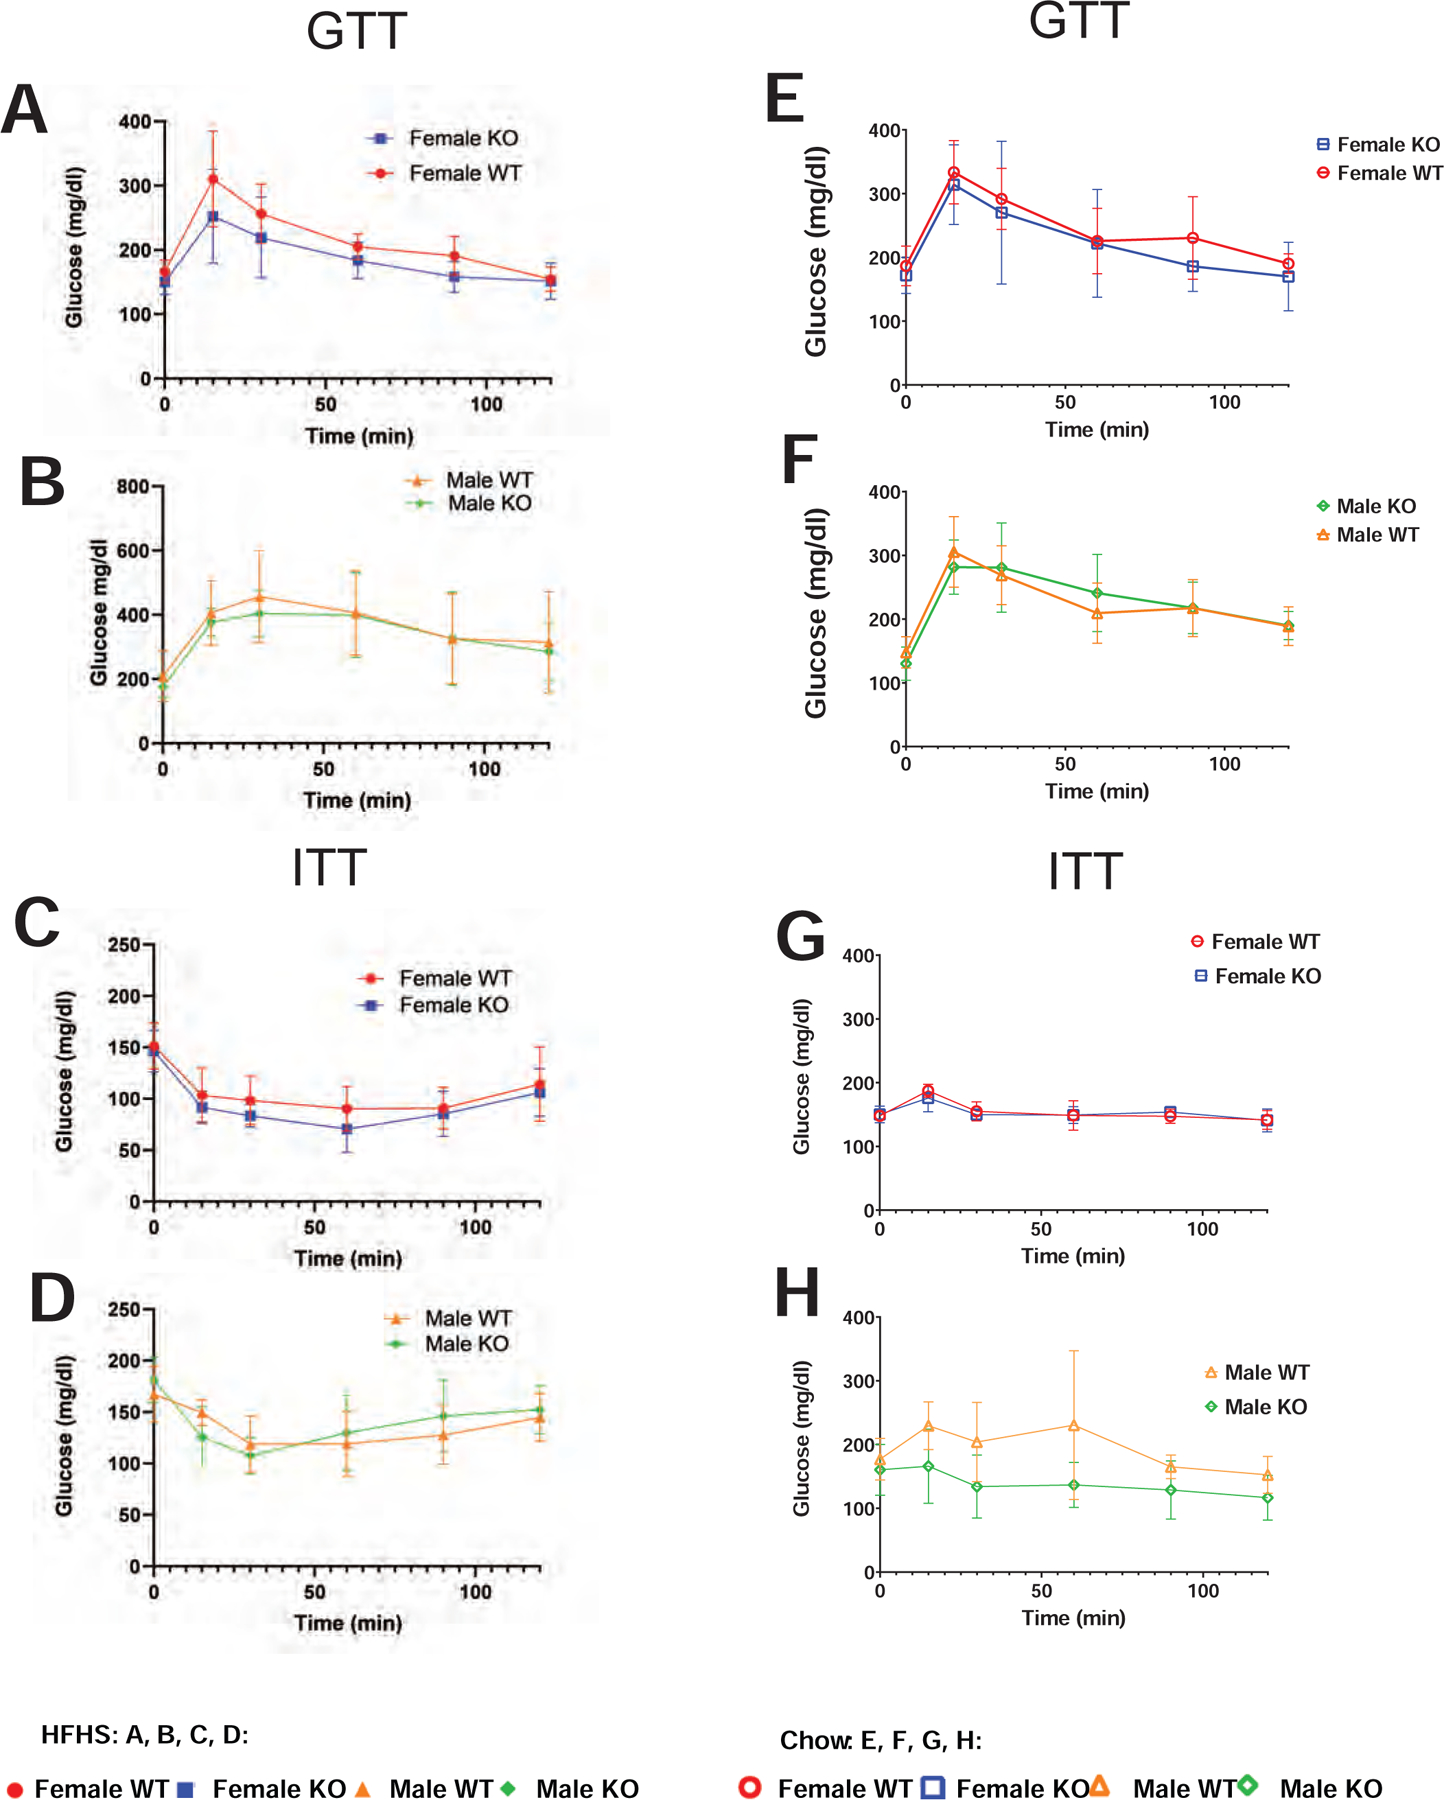
(A-D) Mice on HFHS diet. (A-B) Glucose tolerance test (GTT) with levels of serum glucose prior to (time 0) and following an intraperitoneal injection of glucose in female (A) and male mice (B) on HFHS diet are shown. (C-D) Insulin tolerance test (ITT) with levels of serum glucose prior to (time 0) and following an intraperitoneal injection of insulin in female (C) and male mice (D) on HFHS diet are shown. (E-H) Mice on chow diet. (E-F) Glucose tolerance test (GTT) with levels of serum glucose prior to (time 0) and following an intraperitoneal injection of glucose in female (E) and male mice (F) on chow diet are shown. (G-H) Insulin tolerance test (ITT) with levels of serum glucose prior to (time 0) and following an intraperitoneal injection of insulin in female (G) and male mice (H) on chow diet are shown.
Data are depicted as the mean ± SD. *, p<0.05; **, p<0.01; ***, p<0.001 (non-significant differences are marked ns) and are from n= 32 mice on HFHS diet (females: 8 WT & 9 Lyplal1 KO, males: 8 WT & 7 Lyplal1 KO mice) and from n= 36 mice on chow diet (females: 8 WT & 11 Lyplal1 KO, males: 9 WT & 8 Lyplal1 KO). WT females are red circles, KO females are blue squares, WT males are orange triangles and KO males are green diamonds. Mice on HFHS diet are closed symbols and mice on chow diet are open symbols.
Lyplal1 KO mice have reduced liver steatosis compared to WT littermates
Due to the reduced accumulation of fat storage in adipose depots of female Lyplal1 KO mice on a hypercaloric diet (HFHS diet; Figure 2) and association of SNPs near the Lyplal1 gene in humans with NAFLD, central adiposity/distribution of fat, and fasting serum triglyceride levels (Bille et al., 2011, Chu et al., 2017, Fox et al., 2012, Heid et al., 2010, Leon-Mimila et al., 2015, Lindgren et al., 2009, Randall et al., 2013, Speliotes et al., 2011, Wang et al., 2016, Yuan et al., 2015), we hypothesized that the female KO mice on HFHS diet may have elevated serum and liver triglycerides and increased liver damage as reflected by increased serum aspartate aminotransferase (AST) and alanine aminotransferase (ALT), or alkaline phosphatase (ALP). To determine whether disruption of Lyplal1 affected serum lipids or serum liver enzymes we assayed serum from non-fasted mice on both chow and HFHS diets. Non-fasted female, but not male, Lyplal1 KO mice on HFHS diet had increased serum triglycerides, but not cholesterol, compared to WT littermates (Figure 7A). Counter to what we hypothesized, serum AST and ALT, but not ALP, were decreased in female Lyplal1 KO mice on HFHS diet by 24 and 33% respectively when compared to WT littermates (Figure 7C). Mice fed a chow diet did not show altered levels of non-fasted serum lipids (triglycerides and cholesterol; Figure 7B) or serum liver enzymes (AST, ALT, or ALP; Figure 7D). These data indicate that Lyplal1 KO is protective against hypercaloric diet induced hepatocye damage, despite elevations in serum lipid values.
Figure 7: Female Lyplal1 KO mice on HFHS diet have elevated serum triglycerides and reduced serum markers of liver damage but disruption of Lyplal1 does not alter serum triglyceride or serum liver enzymes in mice on chow diet.

(A-B) Mice on HFHS diet. non-fasted serum lipid (triglyceride and cholesterol) (A), and non-fasted serum liver enzymes (ALT, AST, ALP) (B) for mice on HFHS diet show elevation in serum triglycerides and decreased AST and ALT in female Lyplal1 KO mice. (C-D) Mice on chow diet. Non-fasted serum lipid (triglyceride and cholesterol) (D), and non-fasted serum liver enzymes (ALT, AST, ALP) (D) for mice on chow diet show no differences by genotype.
Data are depicted as the mean ± SD. *, p<0.05; **, p<0.01; ***, p<0.001 (non-significant differences are marked ns) and are from n= 32 mice on HFHS diet (females: 8 WT & 9 Lyplal1 KO, males: 8 WT & 7 Lyplal1 KO mice) and from n=16 mice on chow diet (females: 3 WT & 8 Lyplal1 KO, males: 2 WT & 3 Lyplal1 KO).
genotype. WT females are red circles, KO females are blue squares, WT males are orange triangles and KO males are green diamonds. Mice on HFHS diet are closed symbols and mice on chow diet are open symbols.
To determine whether disruption of Lyplal1 affected liver lipid or glycogen deposition we quantitated these using stained liver sections and biochemical assays. Imaging of H&E-stained liver sections showed an obvious difference in the amount of steatosis present in WT vs. Lyplal1 KO mice (Figure 8A). Blinded grading (0–3) of macrosteatosis in H&E-stained liver sections by a board-certified pathologist revealed that Lyplal1 KO mice had trending decreases in steatosis grade in both female and male mice on HFHS diet when compared with WT littermates (Figure 8B). Additonally, sex combined analyses of steatosis grade showed a significant reduction in Lyplal1 KO mice versus their WT littermates (Figure 8C). Similar reductions were not observed in chow fed Lyplal1 KO versus WT mice (Figure 9A-C). Liver steatosis was quantitated as the %liver area occupied by macrosteatotic lipid droplets from the same H&E-stained liver sections using CellProfiler, which confirmed trending decreases in steatosis of female and male Lyplal1 KO mice separately and in sex combined analyses (Figure 8D, 8E). Similar reductions were not observed in chow-fed Lyplal1 KO versus WT mice (Figure 9D-E). Biochemical extraction and subsequent quantification of liver triglycerides confirmed a slight, but not significant, decrease in liver triglycerides of female Lyplal1 KO mice (13%), a significant 38% decrease in male Lyplal1 KO mice, and a significant 35% decrease in Lyplal1 KO mice using sex combined analyses when compared to their respective WT littermates on HFHS diet (Figure 8F-G). Notably, a single female Lyplal1 KO outlier mouse with two times the value of the second highest measurement of liver triglyceride within the KO cohort on HFHS diet was responsible for the loss in significance of female Lyplal1 KO mice compared to WT littermates. Removal of this single outlier results in a 25% decrease in the average liver triglyceride of the remaining female Lyplal1 KO as compared to their WT counterparts, which is significant with p=0.02 (data not shown). Amount of glycogen in the liver was quantified by staining serial sections of liver with Periodic Acid Schiff (PAS) alongside a PAS-diastase (PAS-D) control and by measuring glycogen biochemically. Both histological and biochemical analyses of liver glycogen did not differ by genotype on HFHS diet (Supplemental Figure 2A-C) or chow diet (Supplemental Figure 3A-C). These data indicate that loss of LYPLAL1 protein correlates with reduced liver triglycerides of female and male mice on HFHS diet. Protection from steatosis was observed in female mice, despite the presence of decreased peripheral fat deposition and increased serum triglycerides, which was absent in male mice and often correlates with increased liver fat deposition. This suggests differing mechanisms of effect on metabolism and lipid accumulation mediated by LYPLAL1 of male versus female mice.
Figure 8: Lyplal1 KO mice have reduced liver steatosis grade, %liver area with macrosteatosis, and liver triglycerides on HFHS diet.

(A) Representative brightfield images of H&E-stained sections of liver tissue from mice on HFHS diet are shown.
(B-C) Quantification of steatosis grade in mice on HFHS diet across an entire liver tissue section by sex and genotype (B) and sex combined (C) show reduced liver steatosis grade in Lyplal1 KO mice.
(D-E) Quantification of %liver area occupied by macrosteatotic fat droplets in HFHS-fed mice across an entire liver tissue section by sex and genotype (D) and sex combined analyses (E) show trending differences in % macrosteatosis by genotype. Data are from n=16 mice on chow diet (females: 3 WT & 8 Lyplal1 KO, males: 2 WT & 3 Lyplal1 KO).
(F-G) Biochemical analyses of liver triglycerides in mice on HFHS diet by sex and genotype (F) and sex combined (G) show reduced liver triglycerides in Lyplal1 KO mice.
Data are depicted as the mean ± SD. *, p<0.05; **, p<0.01; ***, p<0.001 (non-significant differences are marked ns). WT females are red circles, KO females are blue squares, WT males are orange triangles and KO males are green diamonds. Mice on HFHS diet are closed symbols.
Figure 9: Disruption of Lyplal1 does not alter steatosis grade or %liver area with macrosteatosis in mice on chow diet.

(A) Representative brightfield images of H&E-stained sections of liver tissue from mice on chow diet are shown.
(B-C) Quantification of steatosis grade (derived from %hepatocytes with fat droplets) in mice on chow diet across an entire liver tissue section by sex and genotype (B) and sex combined (C) show no differences in steatosis grade by genotype. Data are from n=16 mice on chow diet (females: 3 WT & 8 Lyplal1 KO, males: 2 WT & 3 Lyplal1 KO).
(D-E) Quantification of %liver area occupied by macrosteatotic fat droplets in chow-fed mice across an entire liver tissue section by sex and genotype (D) and sex combined (E) show no differences in %macrosteatosis by genotype. Data are from n=16 mice on chow diet (females: 3 WT & 8 Lyplal1 KO, males: 2 WT & 3 Lyplal1 KO).
Data are depicted as mean ± SD. *, p<0.05; **, p<0.01; ***, p<0.001. WT females are red circles, KO females are blue squares, WT males are orange triangles and KO males are green diamonds. Mice on chow diet are open symbols.
Since LYPLAL1 has a high degree of homology with LYPLA1/APT1, it is likely that LYPLAL1 may also function as an acyl thioesterase and have a role in the regulation of protein acylation and thereby protein localization and activity (Tian et al., 2012). We have observed a sex dependent difference in fat deposition between WT and LYPLAL1 KO mice. Given that it has been previously shown that the estrogen receptor is palmitoylated (Anderson and Ragan, 2016) and this modification plays a role in the localization of the estrogen receptor to the cell membrane (Acconcia et al., 2005, Acconcia et al., 2004, Li et al., 2003), we examined the level of abundance of the estrogen receptor alpha subunit in various tissues in female WT and LYPLAL1 KO mice (Figure 10). By western blotting of whole cell extracts from iWAT, gWAT, liver and muscle tissue we found that in the non-adipose tissues, there is no statistically significant difference detectable in the abundance of the estrogen receptor alpha subunit (Figure 10A-B). Within the adipose tissues, we observe a statistically significant difference in the iWAT fat depot but not in the gWAT fat depot (Figure 10A-B).
Discussion
In humans, SNPs near the LYPLAL1 gene are associated with human obesity and in particular altered fat distribution in females (Fox et al., 2012, Wang et al., 2016, Heid et al., 2010, Lindgren et al., 2009, Randall et al., 2013, Shungin et al., 2015). We show here that disruption of murine Lyplal1 reduces body mass, percentage body fat, and white adipose depot weight, and reduces liver triglyceride deposition and damage in female mice on HFHS but not chow diet. Collectively these phenotypes suggest female animals that lack LYPLAL1 may be impaired in storage of triglyceride which confers resistance to diet-induced obesity and its complications including insulin resistance and liver steatosis. These data suggest that LYPLAL1 regulates both glycemic traits and adiposity through a novel sex- and diet-specific mechanism. The sex-specific effects of this gene on fat distribution appear to be conserved and suggest that LYPLAL1 is the likely gene that the human variants work through to cause their effect. Indeed, this is the first mouse model of a gene implicated from human GWAS of fat distribution (Fox et al., 2012, Wang et al., 2016, Heid et al., 2010, Lindgren et al., 2009, Randall et al., 2013, Shungin et al., 2015) to show similar sex specific effects as in humans.
As a deacylating enzyme, murine LYPLAL1 has been shown to function in regulating the surface expression of membrane-associated proteins such as big potassium channels (BK) (Tian et al., 2012). However, the targets of LYPLAL1 protein’s enzymatic function remain poorly defined. Given the strong sex specific effects of eliminating LYPLAL1 in mice, one possibility is that Lyplal1 may regulate the localization of estrogen receptors (Anderson and Ragan, 2016). In support of this theory, acylation of estrogen receptors has been previously shown from the literature to be crucial to their localization and function (Acconcia et al., 2005, Acconcia et al., 2004, Li et al., 2003). Indeed, from the literature estrogen receptors, such as ERα, are protective against development of diet-induced obesity and its related complications. Examining the levels of the ERα in adipose and non-adipose tissue showed that there may be a difference in abundance of ERα in fat depots in WT vs Lyplal1 KO mice. Another possibility is that LYPLAL1 targets the insulin receptor, which has also been shown to be spatially regulated by acylation (Magee and Siddle, 1988). The sex specificity of most of the phenotypes observed in Lyplal1 KO mice more strongly supports the role of a target that disproportionately affects female verses male mice. It is possible, due to the absence of differences between WT and Lyplal1 KO mice on high fat diet without high sucrose (Watson et al., 2017), a metabolic pathway that is more active when sucrose is included in the diet may also be required to express the phenotype.
Lyplal1 knockout mice (Lyplal1tm1a(KOMP)Wtsi) were previously constructed as part of the KOMP project (Skarnes et al., 2011, Ryder et al., 2013) and have been phenotyped by several groups (Watson et al., 2017, Ushakov et al., 2014, Norheim et al., 2019, Bassett and Williams, 2016). While these studies and ours show that Lyplal1 KO mice are alive and fertile, they differ from ours in some key aspects. One study that unlike ours did not expose animals to a challenge diet and that used a (Cre/Lox) rather than the CRISPR method like us to generate tissue-specific KO animals did not see an effect on adiposity phenotypes(Ryder et al., 2013). Two other studies did expose animals to a HFHS diet. Watson et al. did not observe significant changes in body weight, fat accumulation, metabolism, histology of fat and liver, or serum values between KO and WT mice on HFHS diet for 22 weeks(Watson et al., 2017). Norheim et al. reported an increase in body fat percentage of KO mice as compared to combined analysis of WT and heterozygous mice at 2 weeks after initiation of HFHS diet(Norheim et al., 2019). One possible explanation of these differences is that they are due to our knockout being in a C57BL6/J background versus a C57BL6/N background; C57BL6/J animals are more prone to higher body weight and impaired glucose tolerance on a high fat (60%) diet than C57BL6/N mice(Nicholson et al., 2010). A second possibility is that our diet had more saturated fat and higher sucrose than the other diet (Watson et al., 2017, Norheim et al., 2019). While some models of diet-induced obesity show changes in metabolic rate that account for some of the resistance to weight gain (Molero et al., 2006, Klaman et al., 2000, Shin et al., 2015, Smith et al., 2000), we did not observe any changes in total RER and fat versus glucose oxidation in female Lyplal1 KO mice compared to WT mice on HFHS diet. One possibility for why we did not see these changes in females is that the large weight difference between Lyplal1 KO and WT female mice may be a confounding factor in detection of metabolic differences, despite normalization of RER to lean body mass (Speakman, 2013). Restriction of diet-induced obesity resistance to female Lyplal1 KO mice parallels the strong sex-specific effects of variants near LYPLAL1 in humans on fat distribution (Fox et al., 2012, Heid et al., 2010, Lindgren et al., 2009, Randall et al., 2013, Wang et al., 2016), suggesting the presence of an evolutionarily conserved mechanism. While animal husbandry or other factors may impact the results obtained, the differences in knockout construct, mouse strain background (Nicholson et al., 2010), and diet composition (Watson et al., 2017, Norheim et al., 2019) may individually or collectively explain differences between these studies and ours. Importantly, our model strongly parallels metabolic effects in humans and allows us to dissect this novel gene by sex by diet mechanism
Strengths of our study include the use of both male and female mice as well as use of various diets which was important in identifying the phenotype. Further, we analyzed tissue weights, serum characteristics, adipose and liver histology, as well as carried out molecular analyses in our animals to understand how Lyplal1 may affect fat distribution. Limitations of our study include that we do not know if these findings will transfer to humans.
In summary we show that our murine Lyplal1 KO strongly parallels metabolic effects in humans and adds to our understanding of the obesogenic pathophysiology of this locus. This information gives us insight into how we can possibly curb obesity in humans both by altering diet as well as by targeting genes that can reverse endogenous susceptibility to our current obesogenic environment. Further work on this mouse model will help us better understand how Lyplal1 and its human homolog LYPLAL1 contribute to obesity and metabolic diseases.
Supplementary Material
Acknowledgements
We thank Ormond MacDougald and Julie Hardij of the University of Michigan Adipose Tissue Core for their excellent training and assistance in fat depot dissection and their contributions to study design and data interpretation. Finally, we thank Nadine Halligan and the Dahmer Lab for use of their gel imager, as well as Suresh Madathilparambil, Vladislav Dolgachev, and Krishnan Raghavendran lab for use of their plate reader. Mouse phenotyping services were provided by the Mouse Metabolic Phenotyping Center (MMPC) at the University of Michigan (U2CDK110768). RBV, AK, YH, YC, AP, SKH, BDH, EKS were supported by the University of Michigan, Department of Internal Medicine. The project described was supported in part by Grant Number P30DK020572 (MDRC) from the National Institute of Diabetes and Digestive and Kidney Diseases. All the analyses pertaining to mouse work were carried out in accordance with the Institutional Animal Care and Use Committees (IACUC) under the protocol #PRO00007699 (EKS). University of Michigan, Animal Phenotyping Core was supported by P30 grants DK020572 (MDRC), DK089503 (MNORC), and 1U2CDK110678–01 (Mi-MMPC). This work utilized services from the Adipose Tissue Core, which is supported by the grant DK089503 to the University of Michigan. We also acknowledge support from the University of Michigan Biomedical Research Core Facilities Transgenic Animal Model Core.
Funding:
EKS, RBV, AK, YH, YuC, AP, MET, EYC, XD, YaC, SMM, VLC, LFB, DPB, LHM, TLS, HM, SKH, JZS, BDH are supported in part by NIH grants R01 DK106621 (to EKS), R01 DK107904 (to EKS), RO1 DK128871 (to EKS) RO1 DK131787 (to EKS) and the University of Michigan. VLC was supported in part by an American Association for the Study of Liver Disease Clinical, Translational and Outcomes Research Award.
Abbreviations:
- LYPLAL1, WT
lysophospholipase like 1
- KO
knockout
- SNP
Single Nucleotide Polymorphism
- HFD
high fat diet
- HFHS
high fat, high sucrose
- GWAS
genome-wide association studies
- WAT
white adipose tissue
- iWAT
inguinal white adipose tissue
- pWAT
perirenal white adipose tissue
- gWAT
gonadal white adipose tissue
- BAT
brown adipose tissue
- AST
aspartate aminotransferase
- ALT
alanine aminotransferase
- ALP
alkaline phosphatase
- GTT
glucose tolerance test
- ITT
insulin tolerance test
- CLAMS
comprehensive lab animal monitoring system
- NMR
nuclear magnetic resonance
- H&E
hematoxylin and eosin
- RER
respiratory exchange ratio
- PAS
periodic acid Schiff
- PAS-D
periodic acid Schiff – diastase
- Nnt
Nicotinamide nucleotide transhydrogenase
- UCP1
uncoupling protein 1
- BK
big potassium channel
- gRNA
guide RNA
- AUC
area under the curve
- PAM
protospacer adjacent motif
- PFA
paraformaldehyde
- PBS
phosphate buffered saline
- RIPA
radioimmunoprecipitation assay
- BSA
bovine serum albumin
- BCA
bicinchoninic acid
- TBST
tris buffered saline
- PMSF
phenylmethylsulfonyl fluoride
- FFPE
formalin-fixed, paraffin embedded
- RT
room temperature
Footnotes
Competing Interests: RBV, AK, YH, YuC, AP, EC, MET, SM, DPB, XD, YaC, HM, VLC, LFB, LHM, SKH, TLS, JZS, BDH, and EKS declare no competing interests. RBV is now an employee of Abcam and SKH is now an employee of Eli Lilly. Their participation in this work was during the time that they were employees of the University of Michigan.
References
- Acconcia F, Ascenzi P, Bocedi A, Spisni E, Tomasi V, Trentalance A, Visca P & Marino M 2005. Palmitoylation-dependent estrogen receptor alpha membrane localization: regulation by 17beta-estradiol. Mol Biol Cell, 16, 231–7. [DOI] [PMC free article] [PubMed] [Google Scholar]
- Acconcia F, Ascenzi P, Fabozzi G, Visca P & Marino M 2004. S-palmitoylation modulates human estrogen receptor-alpha functions. Biochem Biophys Res Commun, 316, 878–83. [DOI] [PubMed] [Google Scholar]
- Anderson AM & Ragan MA 2016. Palmitoylation: a protein S-acylation with implications for breast cancer. NPJ Breast Cancer, 2, 16028. [DOI] [PMC free article] [PubMed] [Google Scholar]
- Bagchi DP, Forss I, Mandrup S & Macdougald OA 2018. SnapShot: Niche Determines Adipocyte Character I. Cell Metab, 27, 264–264 e1. [DOI] [PMC free article] [PubMed] [Google Scholar]
- Bassett JD & Williams GR 2016. Rapid phenotyping of knockout mice to identify genetic determinants of bone strength [DOI] [PMC free article] [PubMed]
- Berry R, Church CD, Gericke MT, Jeffery E, Colman L & Rodeheffer MS 2014. Imaging of adipose tissue. Methods Enzymol, 537, 47–73. [DOI] [PMC free article] [PubMed] [Google Scholar]
- Bille DS, Banasik K, Justesen JM, Sandholt CH, Sandbaek A, Lauritzen T, Jorgensen T, Witte DR, Holm JC, Hansen T & Pedersen O 2011. Implications of central obesity-related variants in LYPLAL1, NRXN3, MSRA, and TFAP2B on quantitative metabolic traits in adult Danes. PLoS One, 6, e20640. [DOI] [PMC free article] [PubMed] [Google Scholar]
- Bluher M 2009. Adipose tissue dysfunction in obesity. Exp Clin Endocrinol Diabetes, 117, 241–50. [DOI] [PubMed] [Google Scholar]
- Britton KA, Massaro JM, Murabito JM, Kreger BE, Hoffmann U & Fox CS 2013. Body fat distribution, incident cardiovascular disease, cancer, and all-cause mortality. J Am Coll Cardiol, 62, 921–5. [DOI] [PMC free article] [PubMed] [Google Scholar]
- Brunt EM, Kleiner DE, Wilson LA, Belt P, Neuschwander-Tetri BA & Network NCR 2011. Nonalcoholic fatty liver disease (NAFLD) activity score and the histopathologic diagnosis in NAFLD: distinct clinicopathologic meanings. Hepatology, 53, 810–20. [DOI] [PMC free article] [PubMed] [Google Scholar]
- Burger M, Zimmermann TJ, Kondoh Y, Stege P, Watanabe N, Osada H, Waldmann H & Vetter IR 2012. Crystal structure of the predicted phospholipase LYPLAL1 reveals unexpected functional plasticity despite close relationship to acyl protein thioesterases. J Lipid Res, 53, 43–50. [DOI] [PMC free article] [PubMed] [Google Scholar]
- Carpenter AE, Jones TR, Lamprecht MR, Clarke C, Kang IH, Friman O, Guertin DA, Chang JH, Lindquist RA, Moffat J, Golland P & Sabatini DM 2006. CellProfiler: image analysis software for identifying and quantifying cell phenotypes. Genome Biol, 7, R100. [DOI] [PMC free article] [PubMed] [Google Scholar]
- Censin JC, Peters S. a. E., Bovijn J, Ferreira T, Pulit SL, Magi R, Mahajan A, Holmes MV & Lindgren CM 2019. Causal relationships between obesity and the leading causes of death in women and men. PLoS Genet, 15, e1008405. [DOI] [PMC free article] [PubMed] [Google Scholar]
- Chu AY, Deng X, Fisher VA, Drong A, Zhang Y, Feitosa MF, Liu CT, Weeks O, Choh AC, Duan Q, Dyer TD, Eicher JD, Guo X, Heard-Costa NL, Kacprowski T, Kent JW Jr., Lange LA, Liu X, Lohman K, Lu L, Mahajan A, O’connell JR, Parihar A, Peralta JM, Smith AV, Zhang Y, Homuth G, Kissebah AH, Kullberg J, Laqua R, Launer LJ, Nauck M, Olivier M, Peyser PA, Terry JG, Wojczynski MK, Yao J, Bielak LF, Blangero J, Borecki IB, Bowden DW, Carr JJ, Czerwinski SA, Ding J, Friedrich N, Gudnason V, Harris TB, Ingelsson E, Johnson AD, Kardia SL, Langefeld CD, Lind L, Liu Y, Mitchell BD, Morris AP, Mosley TH Jr., Rotter JI, Shuldiner AR, Towne B, Volzke H, Wallaschofski H, Wilson JG, Allison M, Lindgren CM, Goessling W, Cupples LA, Steinhauser ML & Fox CS 2017. Multiethnic genome-wide meta-analysis of ectopic fat depots identifies loci associated with adipocyte development and differentiation. Nat Genet, 49, 125–130. [DOI] [PMC free article] [PubMed] [Google Scholar]
- Cong L, Ran FA, Cox D, Lin S, Barretto R, Habib N, Hsu PD, Wu X, Jiang W, Marraffini LA & Zhang F 2013. Multiplex genome engineering using CRISPR/Cas systems. Science, 339, 819–23. [DOI] [PMC free article] [PubMed] [Google Scholar]
- Czech MP 2017. Insulin action and resistance in obesity and type 2 diabetes. Nat Med, 23, 804–814. [DOI] [PMC free article] [PubMed] [Google Scholar]
- Dastani Z, Hivert MF, Timpson N, Perry JR, Yuan X, Scott RA, Henneman P, Heid IM, Kizer JR, Lyytikainen LP, Fuchsberger C, Tanaka T, Morris AP, Small K, Isaacs A, Beekman M, Coassin S, Lohman K, Qi L, Kanoni S, Pankow JS, Uh HW, Wu Y, Bidulescu A, Rasmussen-Torvik LJ, Greenwood CM, Ladouceur M, Grimsby J, Manning AK, Liu CT, Kooner J, Mooser VE, Vollenweider P, Kapur KA, Chambers J, Wareham NJ, Langenberg C, Frants R, Willems-Vandijk K, Oostra BA, Willems SM, Lamina C, Winkler TW, Psaty BM, Tracy RP, Brody J, Chen I, Viikari J, Kahonen M, Pramstaller PP, Evans DM, St Pourcain B, Sattar N, Wood AR, Bandinelli S, Carlson OD, Egan JM, Bohringer S, Van Heemst D, Kedenko L, Kristiansson K, Nuotio ML, Loo BM, Harris T, Garcia M, Kanaya A, Haun M, Klopp N, Wichmann HE, Deloukas P, Katsareli E, Couper DJ, Duncan BB, Kloppenburg M, Adair LS, Borja JB, DIAGRAM+ Consortium, MAGIC Consortium, GLGC Investigators, MuTHER Consortium, Wilson JG, Musani S, Guo X, Johnson T, Semple R, Teslovich TM, Allison MA, Redline S, Buxbaum SG, Mohlke KL, Meulenbelt I, Ballantyne CM, Dedoussis GV, Hu FB, Liu Y, Paulweber B, Spector TD, Slagboom PE, Ferrucci L, Jula A, et al. 2012. Novel loci for adiponectin levels and their influence on type 2 diabetes and metabolic traits: a multi-ethnic meta-analysis of 45,891 individuals. PLoS Genet, 8, e1002607. [DOI] [PMC free article] [PubMed] [Google Scholar]
- Davda D & Martin BR 2014. Acyl protein thioesterase inhibitors as probes of dynamic S-palmitoylation. Medchemcomm, 5, 268–276. [DOI] [PMC free article] [PubMed] [Google Scholar]
- Erion KA & Corkey BE 2017. Hyperinsulinemia: a Cause of Obesity? Curr Obes Rep, 6, 178–186. [DOI] [PMC free article] [PubMed] [Google Scholar]
- Fox CS, Liu Y, White CC, Feitosa M, Smith AV, Heard-Costa N, Lohman K, GIANT Consortium MAGIC Consortium, GLGC Consortium, Johnson AD, Foster MC, Greenawalt DM, Griffin P, Ding J, Newman AB, Tylavsky F, Miljkovic I, Kritchevsky SB, Launer L, Garcia M, Eiriksdottir G, Carr JJ, Gudnason V, Harris TB, Cupples LA & Borecki IB 2012. Genome-wide association for abdominal subcutaneous and visceral adipose reveals a novel locus for visceral fat in women. PLoS Genet, 8, e1002695. [DOI] [PMC free article] [PubMed] [Google Scholar]
- Goodarzi MO, Guo X, Cui J, Jones MR, Haritunians T, Xiang AH, Chen YD, Taylor KD, Buchanan TA, Hsueh WA, Raffel LJ & Rotter JI 2013. Systematic evaluation of validated type 2 diabetes and glycaemic trait loci for association with insulin clearance. Diabetologia, 56, 1282–90. [DOI] [PMC free article] [PubMed] [Google Scholar]
- Heid IM, Jackson AU, Randall JC, Winkler TW, Qi L, Steinthorsdottir V, Thorleifsson G, Zillikens MC, Speliotes EK, Magi R, Workalemahu T, White CC, Bouatia-Naji N, Harris TB, Berndt SI, Ingelsson E, Willer CJ, Weedon MN, Luan J, Vedantam S, Esko T, Kilpelainen TO, Kutalik Z, Li S, Monda KL, Dixon AL, Holmes CC, Kaplan LM, Liang L, Min JL, Moffatt MF, Molony C, Nicholson G, Schadt EE, Zondervan KT, Feitosa MF, Ferreira T, Lango Allen H, Weyant RJ, Wheeler E, Wood AR, Magic, Estrada K, Goddard ME, Lettre G, Mangino M, Nyholt DR, Purcell S, Smith AV, Visscher PM, Yang J, Mccarroll SA, Nemesh J, Voight BF, Absher D, Amin N, Aspelund T, Coin L, Glazer NL, Hayward C, Heard-Costa NL, Hottenga JJ, Johansson A, Johnson T, Kaakinen M, Kapur K, Ketkar S, Knowles JW, Kraft P, Kraja AT, Lamina C, Leitzmann MF, Mcknight B, Morris AP, Ong KK, Perry JR, Peters MJ, Polasek O, Prokopenko I, Rayner NW, Ripatti S, Rivadeneira F, Robertson NR, Sanna S, Sovio U, Surakka I, Teumer A, Van Wingerden S, Vitart V, Zhao JH, Cavalcanti-Proenca C, Chines PS, Fisher E, Kulzer JR, Lecoeur C, Narisu N, Sandholt C, Scott LJ, Silander K, Stark K, et al. 2010. Meta-analysis identifies 13 new loci associated with waist-hip ratio and reveals sexual dimorphism in the genetic basis of fat distribution. Nat Genet, 42, 949–60. [DOI] [PMC free article] [PubMed] [Google Scholar]
- Heymsfield SB, Gonzalez MC, Shen W, Redman L & Thomas D 2014. Weight loss composition is one-fourth fat-free mass: a critical review and critique of this widely cited rule. Obes Rev, 15, 310–21. [DOI] [PMC free article] [PubMed] [Google Scholar]
- Jinek M, East A, Cheng A, Lin S, Ma E & Doudna J 2013. RNA-programmed genome editing in human cells. Elife, 2, e00471. [DOI] [PMC free article] [PubMed] [Google Scholar]
- Jones TR, Kang IH, Wheeler DB, Lindquist RA, Papallo A, Sabatini DM, Golland P & Carpenter AE 2008. CellProfiler Analyst: data exploration and analysis software for complex image-based screens. BMC Bioinformatics, 9, 482. [DOI] [PMC free article] [PubMed] [Google Scholar]
- Kaess BM, Pedley A, Massaro JM, Murabito J, Hoffmann U & Fox CS 2012. The ratio of visceral to subcutaneous fat, a metric of body fat distribution, is a unique correlate of cardiometabolic risk. Diabetologia, 55, 2622–2630. [DOI] [PMC free article] [PubMed] [Google Scholar]
- Klaman LD, Boss O, Peroni OD, Kim JK, Martino JL, Zabolotny JM, Moghal N, Lubkin M, Kim YB, Sharpe AH, Stricker-Krongrad A, Shulman GI, Neel BG & Kahn BB 2000. Increased energy expenditure, decreased adiposity, and tissue-specific insulin sensitivity in protein-tyrosine phosphatase 1B-deficient mice. Mol Cell Biol, 20, 5479–89. [DOI] [PMC free article] [PubMed] [Google Scholar]
- Kleiner DE, Brunt EM, Van Natta M, Behling C, Contos MJ, Cummings OW, Ferrell LD, Liu YC, Torbenson MS, Unalp-Arida A, Yeh M, Mccullough AJ, Sanyal AJ & Nonalcoholic Steatohepatitis Clinical Research, N. 2005. Design and validation of a histological scoring system for nonalcoholic fatty liver disease. Hepatology, 41, 1313–21. [DOI] [PubMed] [Google Scholar]
- Lei X, Callaway M, Zhou H, Yang Y & Chen W 2015. Obesity associated Lyplal1 gene is regulated in diet induced obesity but not required for adipocyte differentiation. Mol Cell Endocrinol, 411, 207–13. [DOI] [PubMed] [Google Scholar]
- Leon-Mimila P, Vega-Badillo J, Gutierrez-Vidal R, Villamil-Ramirez H, Villareal-Molina T, Larrieta-Carrasco E, Lopez-Contreras BE, Kauffer LR, Maldonado-Pintado DG, Mendez-Sanchez N, Tovar AR, Hernandez-Pando R, Velazquez-Cruz R, Campos-Perez F, Aguilar-Salinas CA & Canizales-Quinteros S 2015. A genetic risk score is associated with hepatic triglyceride content and non-alcoholic steatohepatitis in Mexicans with morbid obesity. Exp Mol Pathol, 98, 178–83. [DOI] [PubMed] [Google Scholar]
- Li L, Haynes MP & Bender JR 2003. Plasma membrane localization and function of the estrogen receptor alpha variant (ER46) in human endothelial cells. Proc Natl Acad Sci U S A, 100, 4807–12. [DOI] [PMC free article] [PubMed] [Google Scholar]
- Lindgren CM, Heid IM, Randall JC, Lamina C, Steinthorsdottir V, Qi L, Speliotes EK, Thorleifsson G, Willer CJ, Herrera BM, Jackson AU, Lim N, Scheet P, Soranzo N, Amin N, Aulchenko YS, Chambers JC, Drong A, Luan J, Lyon HN, Rivadeneira F, Sanna S, Timpson NJ, Zillikens MC, Zhao JH, Almgren P, Bandinelli S, Bennett AJ, Bergman RN, Bonnycastle LL, Bumpstead SJ, Chanock SJ, Cherkas L, Chines P, Coin L, Cooper C, Crawford G, Doering A, Dominiczak A, Doney AS, Ebrahim S, Elliott P, Erdos MR, Estrada K, Ferrucci L, Fischer G, Forouhi NG, Gieger C, Grallert H, Groves CJ, Grundy S, Guiducci C, Hadley D, Hamsten A, Havulinna AS, Hofman A, Holle R, Holloway JW, Illig T, Isomaa B, Jacobs LC, Jameson K, Jousilahti P, Karpe F, Kuusisto J, Laitinen J, Lathrop GM, Lawlor DA, Mangino M, Mcardle WL, Meitinger T, Morken MA, Morris AP, Munroe P, Narisu N, Nordstrom A, Nordstrom P, Oostra BA, Palmer CN, Payne F, Peden JF, Prokopenko I, Renstrom F, Ruokonen A, Salomaa V, Sandhu MS, Scott LJ, Scuteri A, Silander K, Song K, Yuan X, Stringham HM, Swift AJ, Tuomi T, Uda M, Vollenweider P, Waeber G, Wallace C, Walters GB, Weedon MN, et al. 2009. Genome-wide association scan meta-analysis identifies three Loci influencing adiposity and fat distribution. PLoS Genet, 5, e1000508. [DOI] [PMC free article] [PubMed] [Google Scholar]
- Magee AI & Siddle K 1988. Insulin and IGF-1 receptors contain covalently bound palmitic acid. J Cell Biochem, 37, 347–57. [DOI] [PubMed] [Google Scholar]
- Mali P, Yang L, Esvelt KM, Aach J, Guell M, Dicarlo JE, Norville JE & Church GM 2013. RNA-guided human genome engineering via Cas9. Science, 339, 823–6. [DOI] [PMC free article] [PubMed] [Google Scholar]
- Manning AK, Hivert MF, Scott RA, Grimsby JL, Bouatia-Naji N, Chen H, Rybin D, Liu CT, Bielak LF, Prokopenko I, Amin N, Barnes D, Cadby G, Hottenga JJ, Ingelsson E, Jackson AU, Johnson T, Kanoni S, Ladenvall C, Lagou V, Lahti J, Lecoeur C, Liu Y, Martinez-Larrad MT, Montasser ME, Navarro P, Perry JR, Rasmussen-Torvik LJ, Salo P, Sattar N, Shungin D, Strawbridge RJ, Tanaka T, Van Duijn CM, An P, De Andrade M, Andrews JS, Aspelund T, Atalay M, Aulchenko Y, Balkau B, Bandinelli S, Beckmann JS, Beilby JP, Bellis C, Bergman RN, Blangero J, Boban M, Boehnke M, Boerwinkle E, Bonnycastle LL, Boomsma DI, Borecki IB, Bottcher Y, Bouchard C, Brunner E, Budimir D, Campbell H, Carlson O, Chines PS, Clarke R, Collins FS, Corbaton-Anchuelo A, Couper D, De Faire U, Dedoussis GV, Deloukas P, Dimitriou M, Egan JM, Eiriksdottir G, Erdos MR, Eriksson JG, Eury E, Ferrucci L, Ford I, Forouhi NG, Fox CS, Franzosi MG, Franks PW, Frayling TM, Froguel P, Galan P, De Geus E, Gigante B, Glazer NL, Goel A, Groop L, Gudnason V, Hallmans G, Hamsten A, Hansson O, Harris TB, Hayward C, Heath S, Hercberg S, Hicks AA, Hingorani A, Hofman A, Hui J, Hung J, et al. 2012. A genome-wide approach accounting for body mass index identifies genetic variants influencing fasting glycemic traits and insulin resistance. Nat Genet, 44, 659–69. [DOI] [PMC free article] [PubMed] [Google Scholar]
- Molero JC, Waring SG, Cooper A, Turner N, Laybutt R, Cooney GJ & James DE 2006. Casitas b-lineage lymphoma-deficient mice are protected against high-fat diet-induced obesity and insulin resistance. Diabetes, 55, 708–15. [DOI] [PubMed] [Google Scholar]
- Munoz-Fuentes V, Cacheiro P, Meehan TF, Aguilar-Pimentel JA, Brown SDM, Flenniken AM, Flicek P, Galli A, Mashhadi HH, Hrabe De Angelis M, Kim JK, Lloyd KCK, Mckerlie C, Morgan H, Murray SA, Nutter LMJ, Reilly PT, Seavitt JR, Seong JK, Simon M, Wardle-Jones H, Mallon AM, Smedley D, Parkinson HE & IMPC consortium 2018. The International Mouse Phenotyping Consortium (IMPC): a functional catalogue of the mammalian genome that informs conservation. Conserv Genet, 19, 995–1005. [DOI] [PMC free article] [PubMed] [Google Scholar]
- Nicholson A, Reifsnyder PC, Malcolm RD, Lucas CA, Macgregor GR, Zhang W & Leiter EH 2010. Diet-induced Obesity in Two C57BL/6 Substrains With Intact or Mutant Nicotinamide Nucleotide Transhydrogenase (Nnt) Gene. Obesity, 18, 1902–1905. [DOI] [PMC free article] [PubMed] [Google Scholar]
- Norheim F, Hasin-Brumshtein Y, Vergnes L, Chella Krishnan K, Pan C, Seldin MM, Hui ST, Mehrabian M, Zhou Z, Gupta S, Parks BW, Walch A, Reue K, Hofmann SM, Arnold AP & Lusis AJ 2019. Gene-by-Sex Interactions in Mitochondrial Functions and Cardio-Metabolic Traits. Cell Metab, 29, 932–949 e4. [DOI] [PMC free article] [PubMed] [Google Scholar]
- Preis SR, Massaro JM, Robins SJ, Hoffmann U, Vasan RS, Irlbeck T, Meigs JB, Sutherland P, D’agostino RB Sr., O’donnell CJ & Fox CS 2010. Abdominal subcutaneous and visceral adipose tissue and insulin resistance in the Framingham heart study. Obesity (Silver Spring), 18, 2191–8. [DOI] [PMC free article] [PubMed] [Google Scholar]
- Randall JC, Winkler TW, Kutalik Z, Berndt SI, Jackson AU, Monda KL, Kilpelainen TO, Esko T, Magi R, Li S, Workalemahu T, Feitosa MF, Croteau-Chonka DC, Day FR, Fall T, Ferreira T, Gustafsson S, Locke AE, Mathieson I, Scherag A, Vedantam S, Wood AR, Liang L, Steinthorsdottir V, Thorleifsson G, Dermitzakis ET, Dimas AS, Karpe F, Min JL, Nicholson G, Clegg DJ, Person T, Krohn JP, Bauer S, Buechler C, Eisinger K, DIAGRAM Consortium, Bonnefond A, Froguel P, Investigators, M., Hottenga JJ, Prokopenko I, Waite LL, Harris TB, Smith AV, Shuldiner AR, Mcardle WL, Caulfield MJ, Munroe PB, Gronberg H, Chen YD, Li G, Beckmann JS, Johnson T, Thorsteinsdottir U, Teder-Laving M, Khaw KT, Wareham NJ, Zhao JH, Amin N, Oostra BA, Kraja AT, Province MA, Cupples LA, Heard-Costa NL, Kaprio J, Ripatti S, Surakka I, Collins FS, Saramies J, Tuomilehto J, Jula A, Salomaa V, Erdmann J, Hengstenberg C, Loley C, Schunkert H, Lamina C, Wichmann HE, Albrecht E, Gieger C, Hicks AA, Johansson A, Pramstaller PP, Kathiresan S, Speliotes EK, Penninx B, Hartikainen AL, Jarvelin MR, Gyllensten U, Boomsma DI, Campbell H, Wilson JF, Chanock SJ, Farrall M, Goel A, Medina-Gomez C, Rivadeneira F, Estrada K, Uitterlinden AG, et al. 2013. Sex-stratified genome-wide association studies including 270,000 individuals show sexual dimorphism in genetic loci for anthropometric traits. PLoS Genet, 9, e1003500. [DOI] [PMC free article] [PubMed] [Google Scholar]
- Reaven GM, Chen YD, Jeppesen J, Maheux P & Krauss RM 1993. Insulin resistance and hyperinsulinemia in individuals with small, dense low density lipoprotein particles. J Clin Invest, 92, 141–6. [DOI] [PMC free article] [PubMed] [Google Scholar]
- Ryder E, Gleeson D, Sethi D, Vyas S, Miklejewska E, Dalvi P, Habib B, Cook R, Hardy M, Jhaveri K, Bottomley J, Wardle-Jones H, Bussell JN, Houghton R, Salisbury J, Skarnes WC & Ramirez-Solis R 2013. Molecular Characterization of Mutant Mouse Strains Generated from the EUCOMM/KOMP-CSD ES Cell Resource. Mammalian Genome, 24, 286–294. [DOI] [PMC free article] [PubMed] [Google Scholar]
- Schleinitz D, Bottcher Y, Bluher M & Kovacs P 2014. The genetics of fat distribution. Diabetologia, 57, 1276–86. [DOI] [PubMed] [Google Scholar]
- Scott RA, Lagou V, Welch RP, Wheeler E, Montasser ME, Luan J, Magi R, Strawbridge RJ, Rehnberg E, Gustafsson S, Kanoni S, Rasmussen-Torvik LJ, Yengo L, Lecoeur C, Shungin D, Sanna S, Sidore C, Johnson PC, Jukema JW, Johnson T, Mahajan A, Verweij N, Thorleifsson G, Hottenga JJ, Shah S, Smith AV, Sennblad B, Gieger C, Salo P, Perola M, Timpson NJ, Evans DM, Pourcain BS, Wu Y, Andrews JS, Hui J, Bielak LF, Zhao W, Horikoshi M, Navarro P, Isaacs A, O’connell JR, Stirrups K, Vitart V, Hayward C, Esko T, Mihailov E, Fraser RM, Fall T, Voight BF, Raychaudhuri S, Chen H, Lindgren CM, Morris AP, Rayner NW, Robertson N, Rybin D, Liu CT, Beckmann JS, Willems SM, Chines PS, Jackson AU, Kang HM, Stringham HM, Song K, Tanaka T, Peden JF, Goel A, Hicks AA, An P, Muller-Nurasyid M, Franco-Cereceda A, Folkersen L, Marullo L, Jansen H, Oldehinkel AJ, Bruinenberg M, Pankow JS, North KE, Forouhi NG, Loos RJ, Edkins S, Varga TV, Hallmans G, Oksa H, Antonella M, Nagaraja R, Trompet S, Ford I, Bakker SJ, Kong A, Kumari M, Gigante B, Herder C, Munroe PB, Caulfield M, Antti J, Mangino M, Small K, Miljkovic I, et al. 2012. Large-scale association analyses identify new loci influencing glycemic traits and provide insight into the underlying biological pathways. Nat Genet, 44, 991–1005. [DOI] [PMC free article] [PubMed] [Google Scholar]
- Shin JH, Kim IY, Kim YN, Shin SM, Roh KJ, Lee SH, Sohn M, Cho SY, Lee SH, Ko CY, Kim HS, Choi CS, Bae YS & Seong JK 2015. Obesity Resistance and Enhanced Insulin Sensitivity in Ahnak−/− Mice Fed a High Fat Diet Are Related to Impaired Adipogenesis and Increased Energy Expenditure. PLoS One, 10, e0139720. [DOI] [PMC free article] [PubMed] [Google Scholar]
- Shungin D, Winkler TW, Croteau-Chonka DC, Ferreira T, Locke AE, Magi R, Strawbridge RJ, Pers TH, Fischer K, Justice AE, Workalemahu T, Wu JMW, Buchkovich ML, Heard-Costa NL, Roman TS, Drong AW, Song C, Gustafsson S, Day FR, Esko T, Fall T, Kutalik Z, Luan J, Randall JC, Scherag A, Vedantam S, Wood AR, Chen J, Fehrmann R, Karjalainen J, Kahali B, Liu CT, Schmidt EM, Absher D, Amin N, Anderson D, Beekman M, Bragg-Gresham JL, Buyske S, Demirkan A, Ehret GB, Feitosa MF, Goel A, Jackson AU, Johnson T, Kleber ME, Kristiansson K, Mangino M, Leach IM, Medina-Gomez C, Palmer CD, Pasko D, Pechlivanis S, Peters MJ, Prokopenko I, Stancakova A, Sung YJ, Tanaka T, Teumer A, Van Vliet-Ostaptchouk JV, Yengo L, Zhang W, Albrecht E, Arnlov J, Arscott GM, Bandinelli S, Barrett A, Bellis C, Bennett AJ, Berne C, Bluher M, Bohringer S, Bonnet F, Bottcher Y, Bruinenberg M, Carba DB, Caspersen IH, Clarke R, Daw EW, Deelen J, Deelman E, Delgado G, Doney AS, Eklund N, Erdos MR, Estrada K, Eury E, Friedrich N, Garcia ME, Giedraitis V, Gigante B, Go AS, Golay A, Grallert H, Grammer TB, Grassler J, Grewal J, Groves CJ, Haller T, Hallmans G, et al. 2015. New genetic loci link adipose and insulin biology to body fat distribution. Nature, 518, 187–196. [DOI] [PMC free article] [PubMed] [Google Scholar]
- Skarnes WC, Rosen B, West AP, Koutsourakis M, Bushell W, Iyer V, Mujica AO, Thomas M, Harrow J, Cox T, Jackson D, Severin J, Biggs P, Fu J, Nefedov M, De Jong PJ, Stewart AF & Bradley A 2011. A conditional knockout resource for the genome-wide study of mouse gene function. Nature, 474, 337–342. [DOI] [PMC free article] [PubMed] [Google Scholar]
- Smith SJ, Cases S, Jensen DR, Chen HC, Sande E, Tow B, Sanan DA, Raber J, Eckel RH & Farese RV Jr. 2000. Obesity resistance and multiple mechanisms of triglyceride synthesis in mice lacking Dgat. Nat Genet, 25, 87–90. [DOI] [PubMed] [Google Scholar]
- Speakman JR 2013. Measuring energy metabolism in the mouse - theoretical, practical, and analytical considerations. Front Physiol, 4, 34. [DOI] [PMC free article] [PubMed] [Google Scholar]
- Speliotes EK, Massaro JM, Hoffmann U, Vasan RS, Meigs JB, Sahani DV, Hirschhorn JN, O’donnell CJ & Fox CS 2010. Fatty liver is associated with dyslipidemia and dysglycemia independent of visceral fat: the Framingham Heart Study. Hepatology, 51, 1979–87. [DOI] [PMC free article] [PubMed] [Google Scholar]
- Speliotes EK, Yerges-Armstrong LM, Wu J, Hernaez R, Kim LJ, Palmer CD, Gudnason V, Eiriksdottir G, Garcia ME, Launer LJ, Nalls MA, Clark JM, Mitchell BD, Shuldiner AR, Butler JL, Tomas M, Hoffmann U, Hwang SJ, Massaro JM, O’donnell CJ, Sahani DV, Salomaa V, Schadt EE, Schwartz SM, Siscovick DS, Nash CRN, GIANT Consortium, MAGIC Investigators, Voight BF, Carr JJ, Feitosa MF, Harris TB, Fox CS, Smith AV, Kao WH, Hirschhorn JN, Borecki IB & GOLD Consortium 2011. Genome-wide association analysis identifies variants associated with nonalcoholic fatty liver disease that have distinct effects on metabolic traits. PLoS Genet, 7, e1001324. [DOI] [PMC free article] [PubMed] [Google Scholar]
- Tian L, Mcclafferty H, Knaus HG, Ruth P & Shipston MJ 2012. Distinct acyl protein transferases and thioesterases control surface expression of calcium-activated potassium channels. J Biol Chem, 287, 14718–25. [DOI] [PMC free article] [PubMed] [Google Scholar]
- Tinsley FC, Taicher GZ & Heiman ML 2004. Evaluation of a quantitative magnetic resonance method for mouse whole body composition analysis. Obes Res, 12, 150–60. [DOI] [PubMed] [Google Scholar]
- Ushakov D, Hng K, Laing A, Abeler-Dörner L & Hayday AJI 2014. High-throughput phenotyping for the 3i consortium: 536 143. [Google Scholar]
- Wang T, Ma X, Peng D, Zhang R, Sun X, Chen M, Yan J, Wang S, Yan D, He Z, Jiang F, Bao Y, Hu C & Jia W 2016. Effects of Obesity Related Genetic Variations on Visceral and Subcutaneous Fat Distribution in a Chinese Population. Sci Rep, 6, 20691. [DOI] [PMC free article] [PubMed] [Google Scholar]
- Watson RA, Gates AS, Wynn EH, Calvert FE, Girousse A, Lelliott CJ & Barroso I 2017. Lyplal1 is dispensable for normal fat deposition in mice. Dis Model Mech, 10, 1481–1488. [DOI] [PMC free article] [PubMed] [Google Scholar]
- Yuan C, Lu L, An B, Jin W, Dong Q, Xin Y & Xuan S 2015. Association Between LYPLAL1 rs12137855 Polymorphism With Ultrasound-Defined Non-Alcoholic Fatty Liver Disease in a Chinese Han Population. Hepat Mon, 15, e33155. [DOI] [PMC free article] [PubMed] [Google Scholar]
Associated Data
This section collects any data citations, data availability statements, or supplementary materials included in this article.