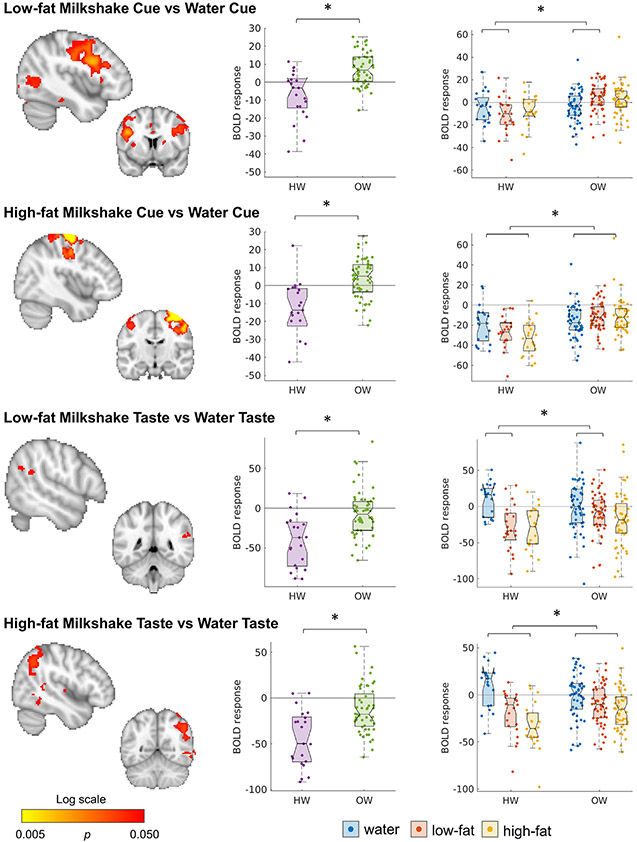
Fig. 2.
Different activation in HW and OW in response to a low-fat or high-fat cue preceding the possible receipt of a milkshake drop (compared to a cue indicating receipt water), and receipt of low-fat and high-fat milkshake taste (compared to a tasteless solution). Maps are thresholded at p < 0.05, whole-brain corrected with TFCE and FWE. Boxplots show the mean BOLD response over all significant voxels of the significant contrasts. Boxplots are shown for all conditions using the mask of the significant contrast. See also Tables S2-3; Fig. S1a,b.

