Abstract
Magnetic resonance imaging (MRI) has gained popularity in the field of prenatal imaging due to the ability to provide high quality images of soft tissue. In this paper, we presented a novel method for extracting different textural and morphological features of the placenta from MRI volumes using topographical mapping. We proposed polar and planar topographical mapping methods to produce common placental features from a unique point of observation. The features extracted from the images included the entire placenta surface, as well as the thickness, intensity, and entropy maps displayed in a convenient two-dimensional format. The topography-based images may be useful for clinical placental assessments as well as computer-assisted diagnosis, and prediction of potential pregnancy complications.
Keywords: Placenta, uterus, magnetic resonance imaging (MRI), placenta accreta spectrum, topography, feature extraction, deformable registration
INTRODUCTION
Normal growth and development of a human fetus is highly dependent on the concurrent normal development of the placenta. The placenta is highly responsible for gestational outcome, providing essential functions during pregnancy including fetal support, nourishment and protection [1]. Any changes in placental maturation can have dramatic and lasting effects on the growth of the fetus as well as maternal health [2]. Placental dysfunction causes prematurity, fetal growth restriction, and miscarriage or stillbirth, as well as “adult diseases” such as neurodevelopmental abnormalities [3–6]. Prenatal placental assessment is an integral part of the clinical gestational screening procedures that can be used to predict or detect conditions that result in potentially life-threatening complications during pregnancy and delivery [7,8]. The current gold standard technique for placental assessment is two-dimensional (2D) ultrasound. However, conventional 2D ultrasound imaging imposes several limitations on the physician, such as the lack of clear approximation of placental shape and localization of features [9]. Recent studies have shown that magnetic resonance imaging (MRI) could provide additional information that can be used for easier and more accurate diagnosis of placental disorders [8,10,11]. MRI can potentially make up for the limitations of 2D ultrasound by providing useful three-dimensional (3D) information of placental, uterine, and fetal features with high soft-tissue contrast. These derived features can be further harnessed in computer-assisted magnetic resonance (MR) image analysis for placental abnormality detection [12,13].
Topographic analysis is a technique commonly used in geoscience to study the surface properties of a land to characterize the land in many different ways. The extracted features (e.g., elevation data, complex spatial relationships between objects, etc.) are usually mapped on 2D plots from a bird’s eye view with latitude data as one axis and longitude data as the other axis. The value of each feature of interest for each point is plotted with a corresponding color or intensity. In this study, our objective was to adopt a similar approach to analyze the structural, morphological, and textural characteristics of the placenta in MRI from a new point of observation. We expect that this approach will provide additional details about the organ that could be used in machine-learning algorithms for fast and accurate diagnosis of placental abnormities with higher accuracy.
METHODS
Data
Our dataset for this study was composed of 241 T2-weighted MR image volumes of the uterus from 241 pregnant women. In the dataset, there were normal cases as well as patients with placenta accreta spectrum (PAS) or other placental complications, some of which later underwent postpartum hysterectomy. The data collection process and the research study were done observing IRB approved protocols. Each volume contained between 28 and 62 2D axial slices spaced 7 mm apart. The slices were 256 × 256 pixels in size except for three cases with sizes 208 × 208 pixels and 212 × 212 pixels. The physical sizes of the image pixels in the dataset ranged from 1.051 × 1.051 × 7 mm2 to 1.953 × 1.953 × 7 mm2. Manually segmented labels for the placenta and uterine cavity in each MR image volume were given by an expert radiologist.
Surface smoothing using non-rigid registration
One of the major issues with abdominal MRI is the long, non-simultaneous imaging time, which calls attention to respiration and additional patient motion in between acquisitions as factors impacting image quality. These confounding effects of respiration and motion show up in the form of misaligned even and odd slices and other artifacts in the constructed image volume when taken in the common interleaved acquisition scheme [14,15]. To reduce the motion artifacts in the generated topography maps of the placenta, we first proposed a minimally destructive method for rectifying even-odd slice misalignment in the prenatal images using non-rigid registration. The workflow is detailed in Figure 1.
Figure 1.
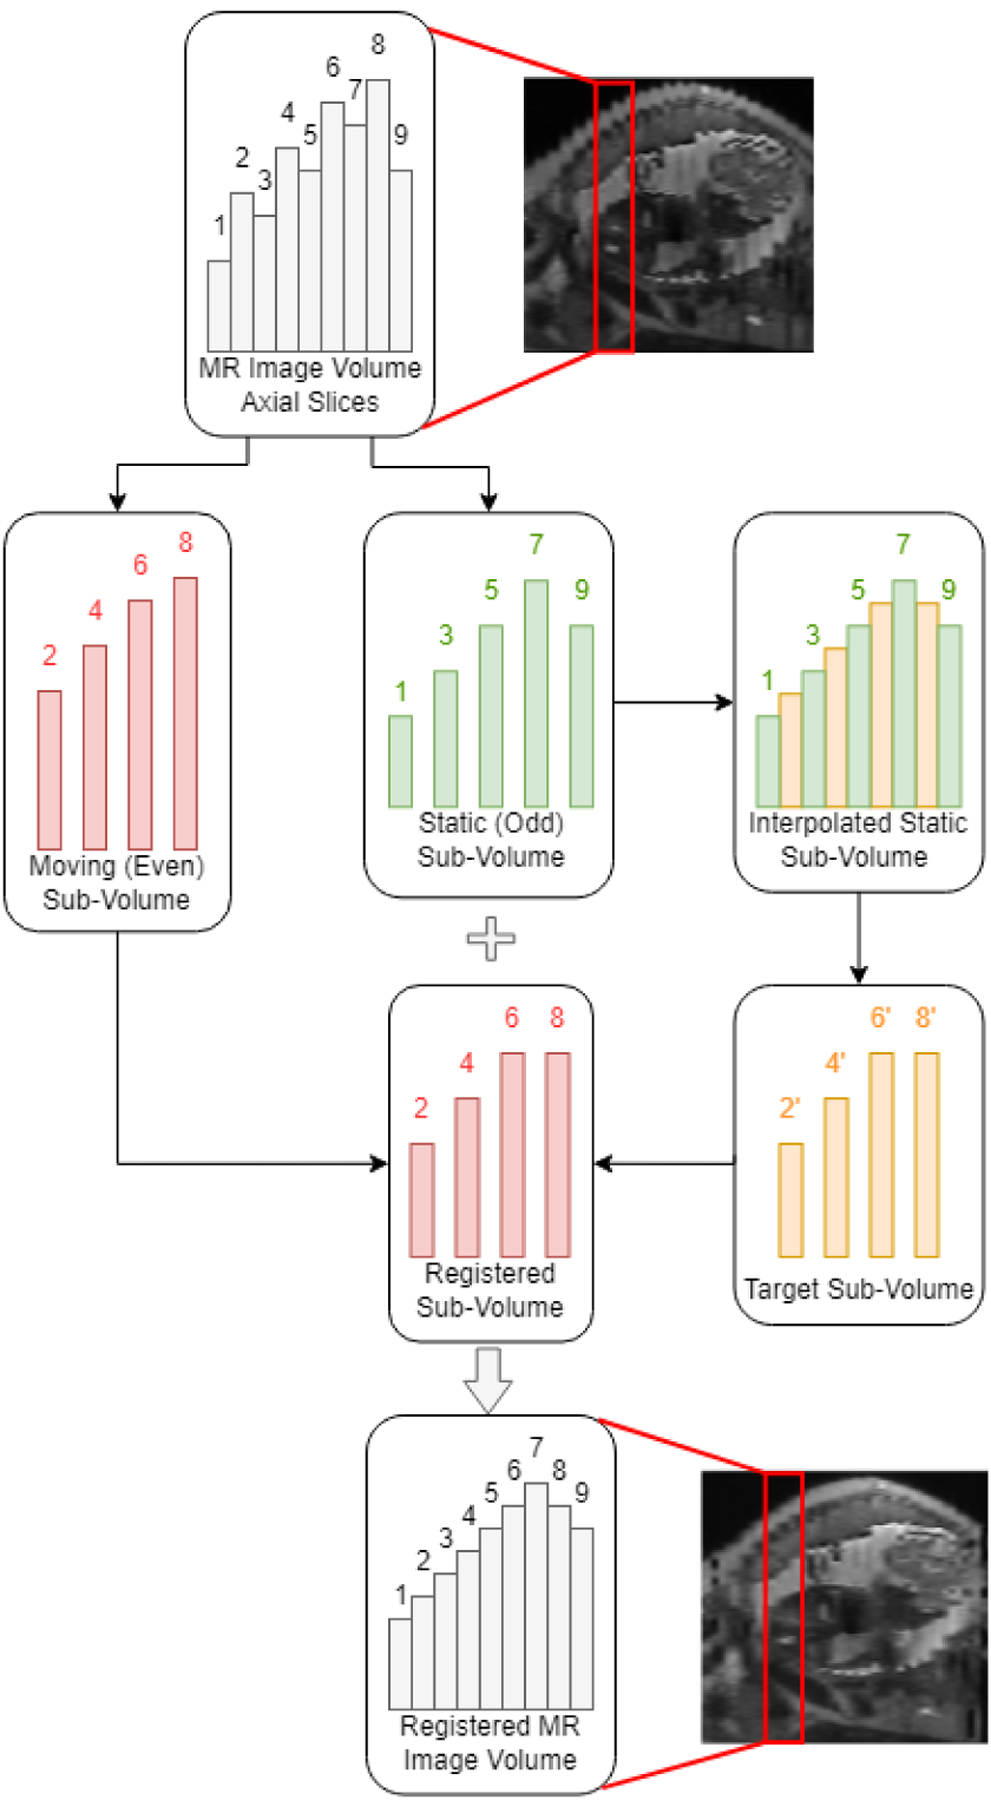
Process of interpolation and registration for alignment of even and odd slices in motion-corrupted prenatal MR images.
The approach taken to address the misalignment between even- and odd-numbered slices in MR imaging was a two-step process consisting of an interpolation step and a deformable registration step. In the interpolation step, each MR image volume, along with its placenta and uterine cavity segmentation labels, was first divided into an even and an odd sub-volume by extracting every two image and label slices, starting from the first slice to create the odd-numbered volume, and starting from the second slice to create the even-numbered sub-volume. To minimize the degrees of deformations imposed onto the image and to retain image fidelity, only one of the even and odd volumes was designated as the static, or fixed volume, while deformations were only applied to the floating, or moving sub-volume. The fixed sub-volume was chosen to be the volume with the positionally lowest uterine cavity center of mass, or the volume imaged at the time of greater exhalation. The reasoning for this was that deformation field singularities, or regions where the resultant registration deformation field would not be bijective, would mostly occur in image regions outside of the patient when the deformation field reflects compressing the patient’s abdominal region [16]. Because the MR images were acquired along the transverse axis with the patient in the supine position, the fixed sub-volume was the volume of which the uterine cavity center of mass was closer to the anatomical posterior position. The second sub-volume was selected as the moving volume to be registered.
A target image volume was generated by performing image up-sampling across the transverse axis of the fixed image volume. Using the MATLAB function meshgrid, a 3D-grid of coordinates with double the number of slices of the fixed volume minus one was created, keeping the overall image dimensions the same but introducing a new slice at each halfway point between slices. The fixed volume was then interpolated with spline interpolation to the grid using the function interp3. The interpolated slices at each halfway point were taken as a new target image volume. The target image volume was sharpened using unsharp masking with a Gaussian function radius of 1.5 and a sharpening ratio of 150% to better highlight edge information. The process of up-sampling a fixed odd-numbered volume and extracting the target volume is shown in Figure 1.
To register the moving sub-volume to the target sub-volume, we adopted the demons algorithm for automatic non-rigid image registration. The demons registration is based on the optical flow equation used to find small, local deformations in temporal sequences of images [17]. The demons registration algorithm calculated a displacement vector field (DVF) that maps the moving volume to the target volume, and the moving image volume and its corresponding placenta and uterine cavity labels were deformed using the imwarp function. The final image and segmentation label volumes were reconstructed by interleaving the static and registered volumes together. Sample results of the sagittal cross section before and after surface smoothing are shown in Figure 2. Finally, before generating the topography maps, the image volumes were up-sampled using three-dimensional (3D) cubic interpolation along the axial axis to ensure a smooth surface. The binary placenta and uterine cavity label volumes were up-sampled to the same size using level-set cubic interpolation [18].
Figure 2.
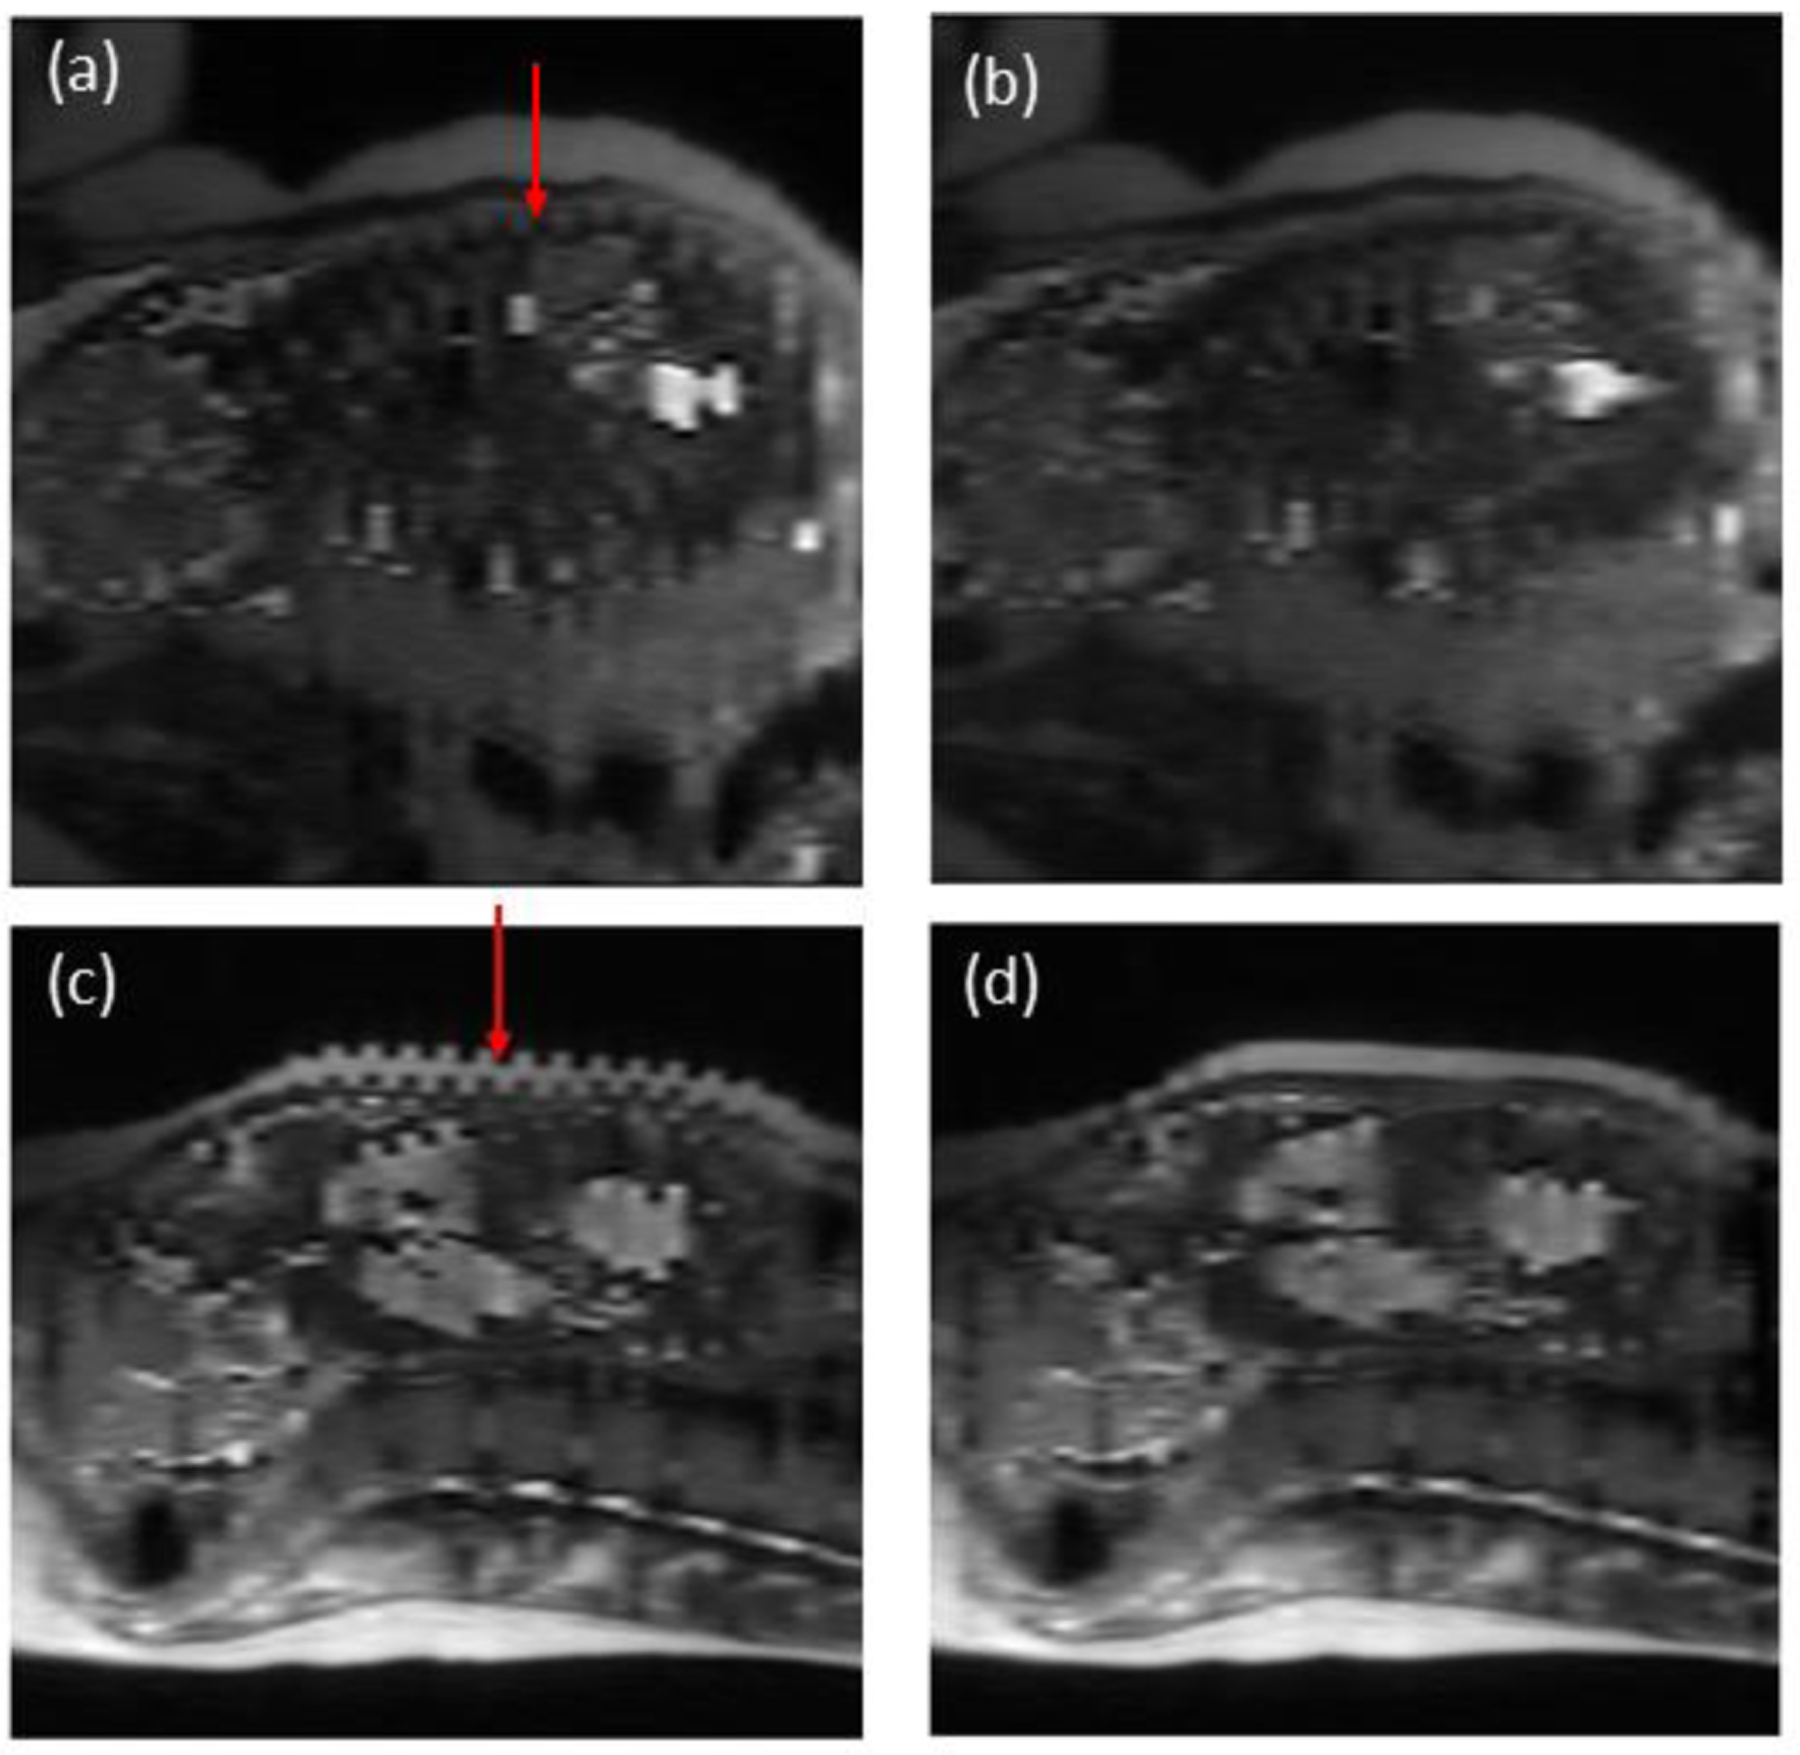
Sagittal cross section of MR image volumes pre- and post-registration for two patient cases with severe interleaved slice misalignment. A) and b) are pre- and post-registration results, respectively, for case 1. C) and d) are pre- and post-registration results, respectively, for case 2.
Polar topographic mapping
To initiate the topography-based feature extraction and mapping, we defined a fixed polar origin (PO). For this study, we selected a PO that was close to the center of mass of the uterine cavity while not being too close or distant from the placenta so as to generate clean, readable topography maps. The appointed standard for the PO was given as one and one-third times the distance vector from the placenta center of mass, or centroid, to the uterine cavity centroid, starting at the placenta centroid. A visualization of the choice of PO location is detailed in Figure 3a. After establishing the new PO, a set of feature values was extracted from each surface point in the placenta label volume. We converted the placenta label volume to a surface with a thickness of one pixel. Each surface point of the placenta label was mapped to a new polar coordinate, defined using azimuth (φ) and elevation (θ) angles. The azimuth angle ranged from −180 degrees to 180 degrees and the elevation angles ranged from −90 degrees to 90 degrees, creating a complete spherical view (see Figure 3b). In this study, we scanned the surface of the placenta with a one-degree step size for both azimuth and elevation angles and extracted the distance, intensity, patch-based local average of intensities, local standard deviation of intensities, and local entropy of intensities as features from the contact points of each extruding ray from the PO. The rays, intuitively, had at least two points of contact with the placenta surface volume, one when entering the placenta and the second while exiting. We generated two separate topography mappings for each image, one for the inner, or fetal surface closest to the PO, and the other for the outer, or maternal surface furthest from the PO. Figure 3c shows the two surfaces in relation to the PO location.
Figure 3.
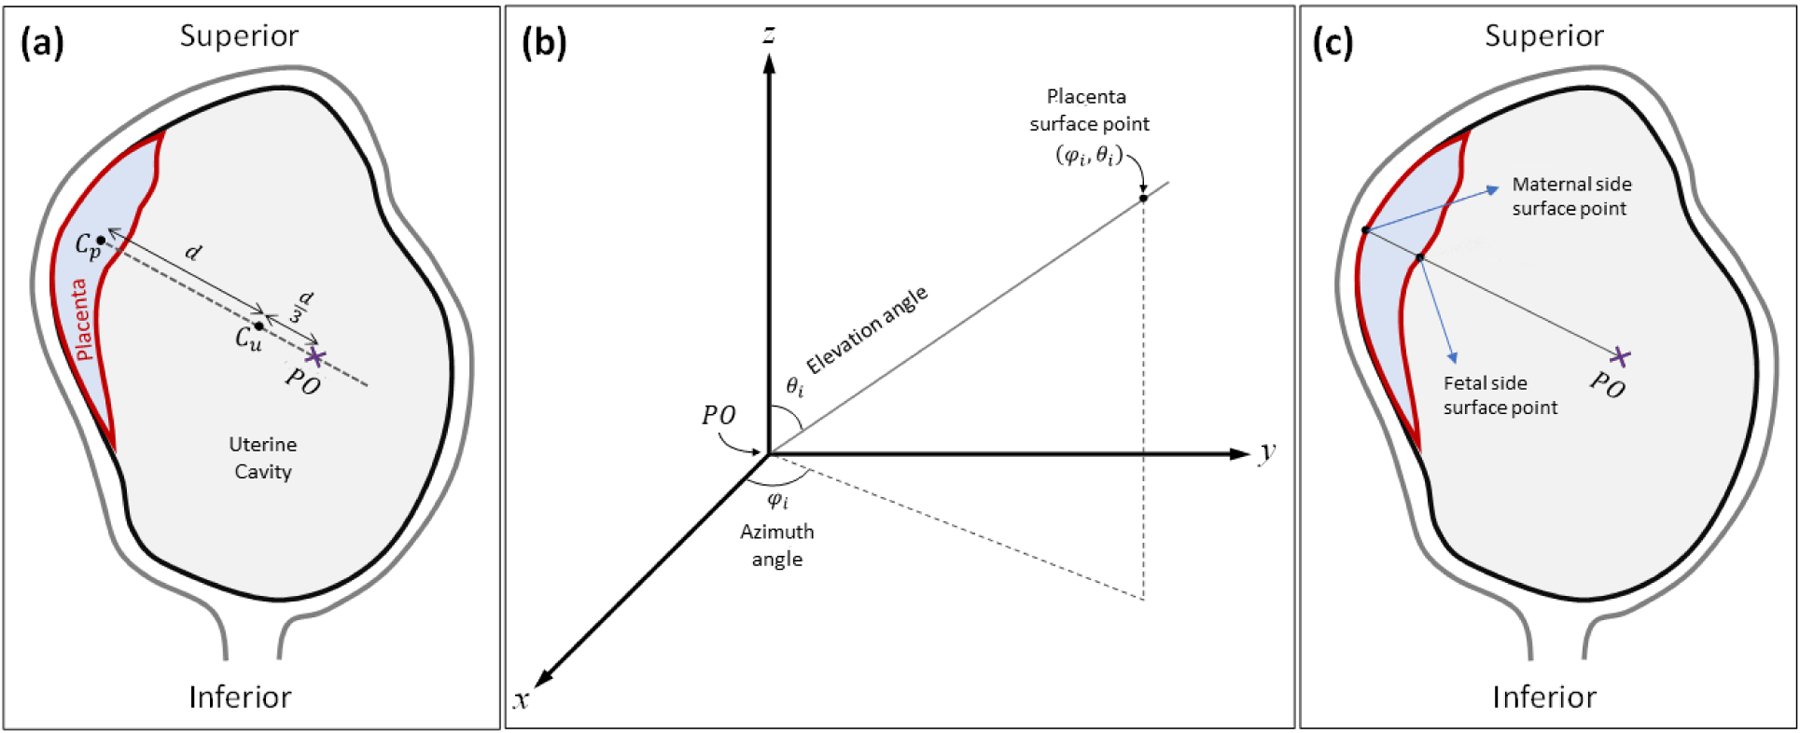
Topographic analysis approach. (a) Definition of PO location. Cp and Cu represent the centroid of the placenta and the uterine cavity, respectively. (b) Polar coordinate system used for topographic mapping. φi and θi are the azimuth angle and elevation angle of a given placenta surface point, respectively. (c) Definition of fetal and maternal side surfaces based on location of polar origin.
The azimuth and elevation angles were plotted on the x- and y- axes, respectively, to create a two-dimensional (2D) topography image of size 361 × 181 pixels, as shown in Figure 4. For inter-subject comparability of the topography maps, we normalized the placenta map by centering the centroid of the placenta. In this study, we extracted a total of eleven different feature maps per image volume as follows: Distance (Fetal and maternal): the distance of the placenta surface points from the PO. This reflects some topological characteristics of the placenta. Placenta thickness: the difference between the maternal side distances from the fetal side distances. Surface intensity (Fetal and maternal): the intensity of the image at the surface points. Local average of intensities (Fetal and maternal): the average of patch-based intensities, using patches of size 11 × 11 × 11 mm3 centered at each surface point. This is less affected by artifacts and noise observed on surface intensity maps. Local standard deviation of intensities (Fetal and maternal): the standard deviation of patch-based intensities, using patches of size 11 × 11 × 11 mm3 centered at each surface point. Local entropy of intensities (Fetal and maternal): the entropy of patch-based intensities, using patches of size 11 × 11 × 11 mm3 centered at each surface point.
Figure 4.
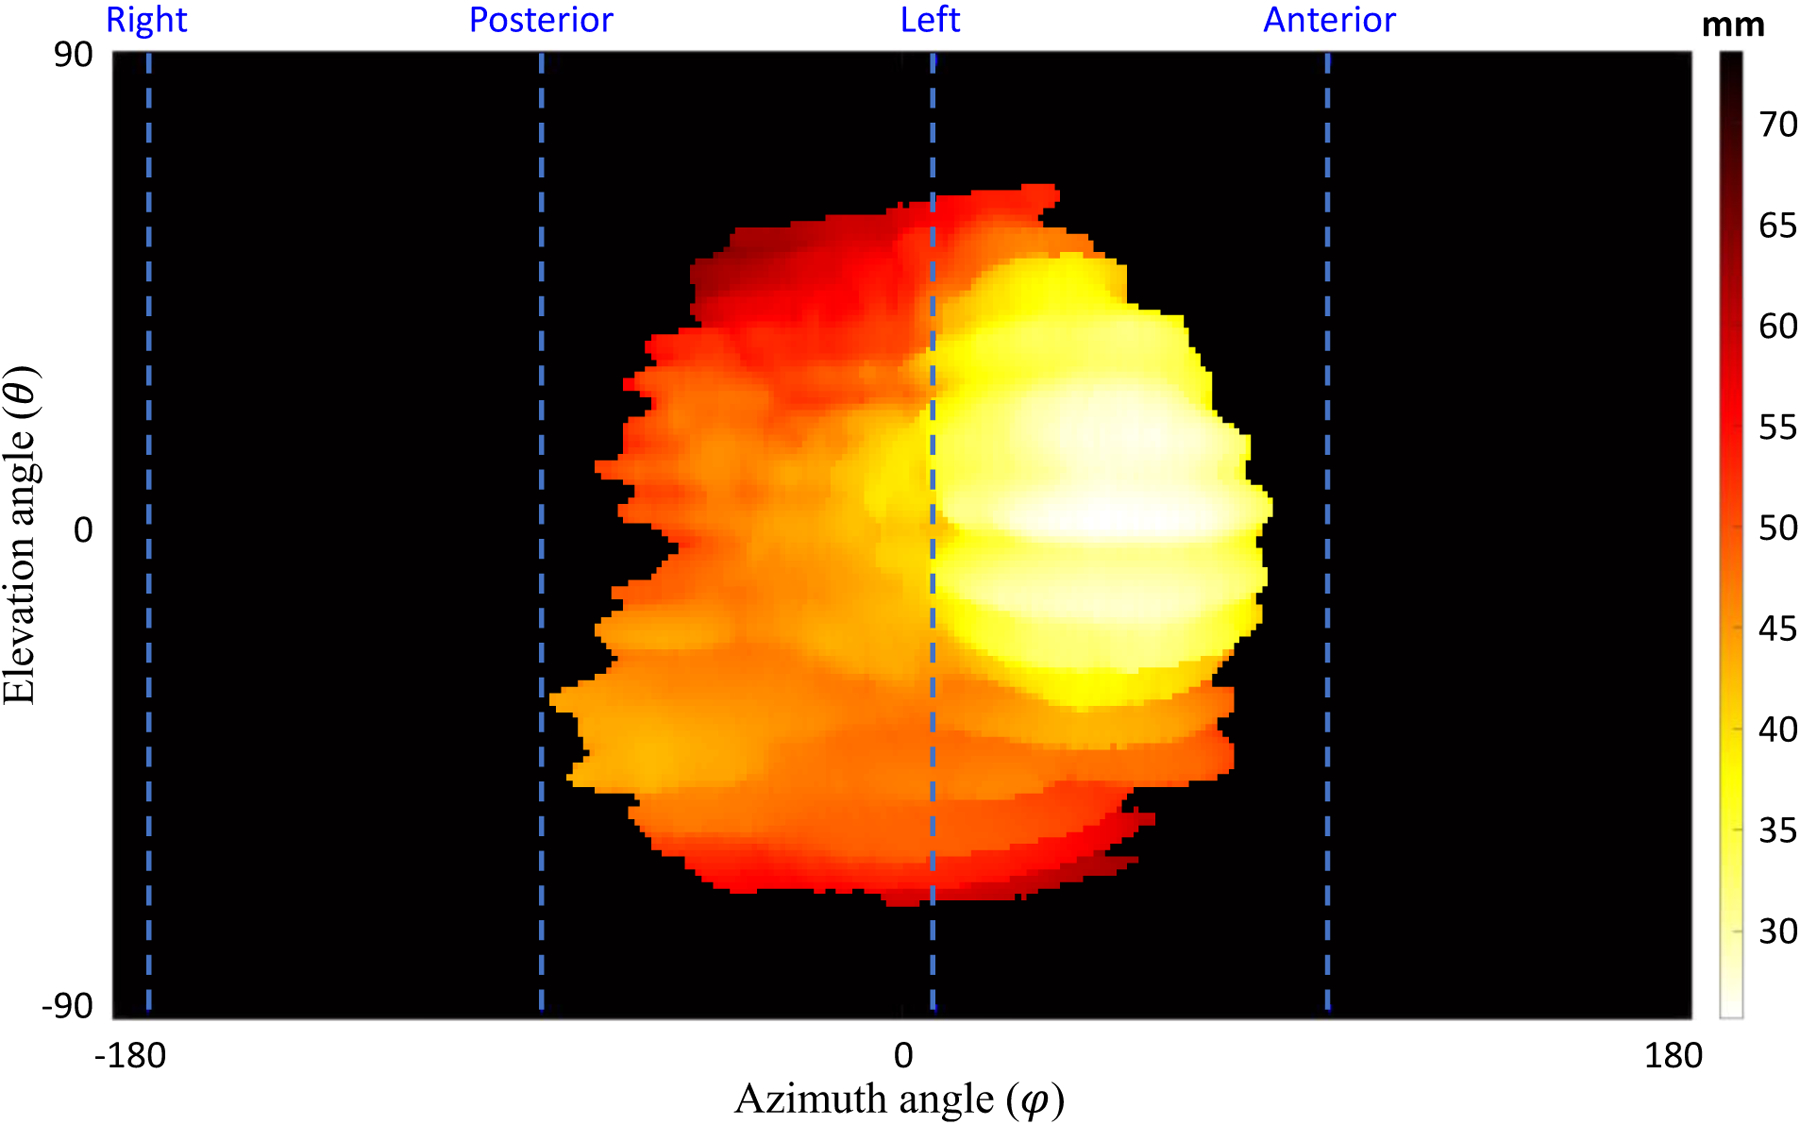
A topographic distance map for the maternal side surface points in a sample case. The dashed lines show the anterior, posterior, right, and left orientations based on the MR imaging axes. The top and bottom of the topography map show the superior and inferior sides, respectively.
Planar topographic mapping
In addition to the polar topographic mapping methodology, we implemented a planar topographic mapping. This method involved taking the placenta surface feature maps as viewed from the sagittal left-side plane and the coronal anterior-side plane of the MR image volume. The MR image volume and placenta label volume were first centered based on the placenta center of mass. Similar to the polar topographic mapping method, the placenta label was converted to a surface map with a thickness of one pixel. Parallel rays were cast from each point on the sagittal left-side plane and coronal anterior-side plane of the image volume and four separate topography mappings were generated, one for each placental surface closest to the sagittal left- and right-side and coronal anterior- and posterior-side planes (see Figure 5).
Figure 5.
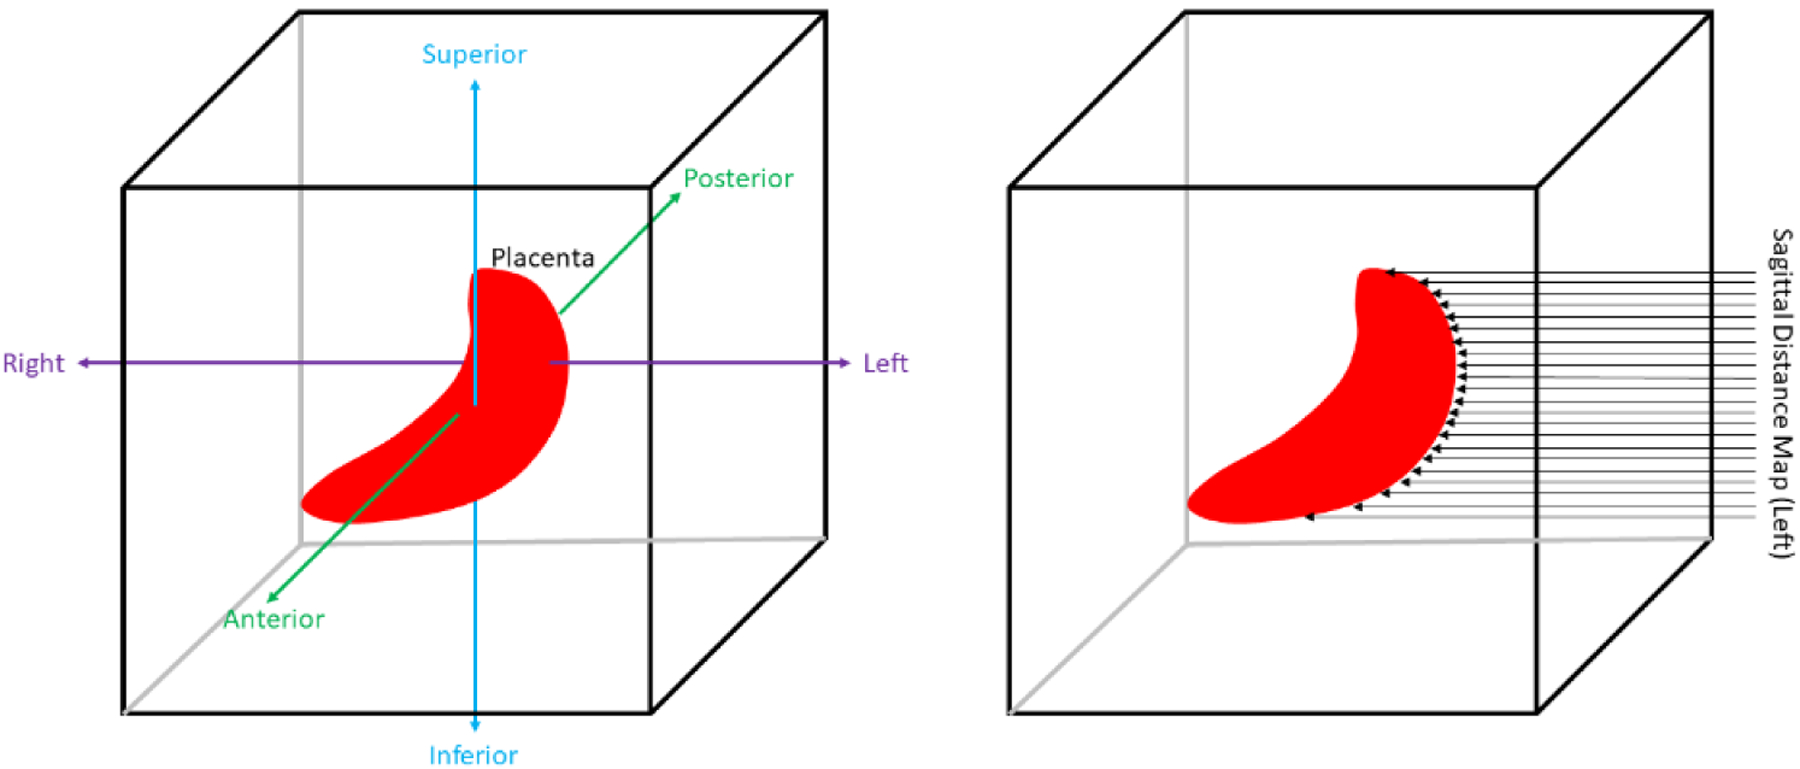
Planar topographic mapping scheme. Left image shows MR image axis definitions. Right image shows how a left-sided sagittal distance map is acquired.
Parallel rays were cast from each point on the sagittal left-side plane and coronal anterior-side plane of the image volume and four separate topography mappings were generated, one for each placental surface closest to the sagittal left- and right-side and coronal anterior- and posterior-side planes (see Figure 6). The coronal and sagittal distance maps were calculated referencing the coronal and sagittal planes intersecting the uterine cavity center of mass, respectively. For each surface point, the same features detailed in the polar topographic mapping section were extracted, which totaled to twenty-two different feature maps per image volume when including thickness.
Figure 6.
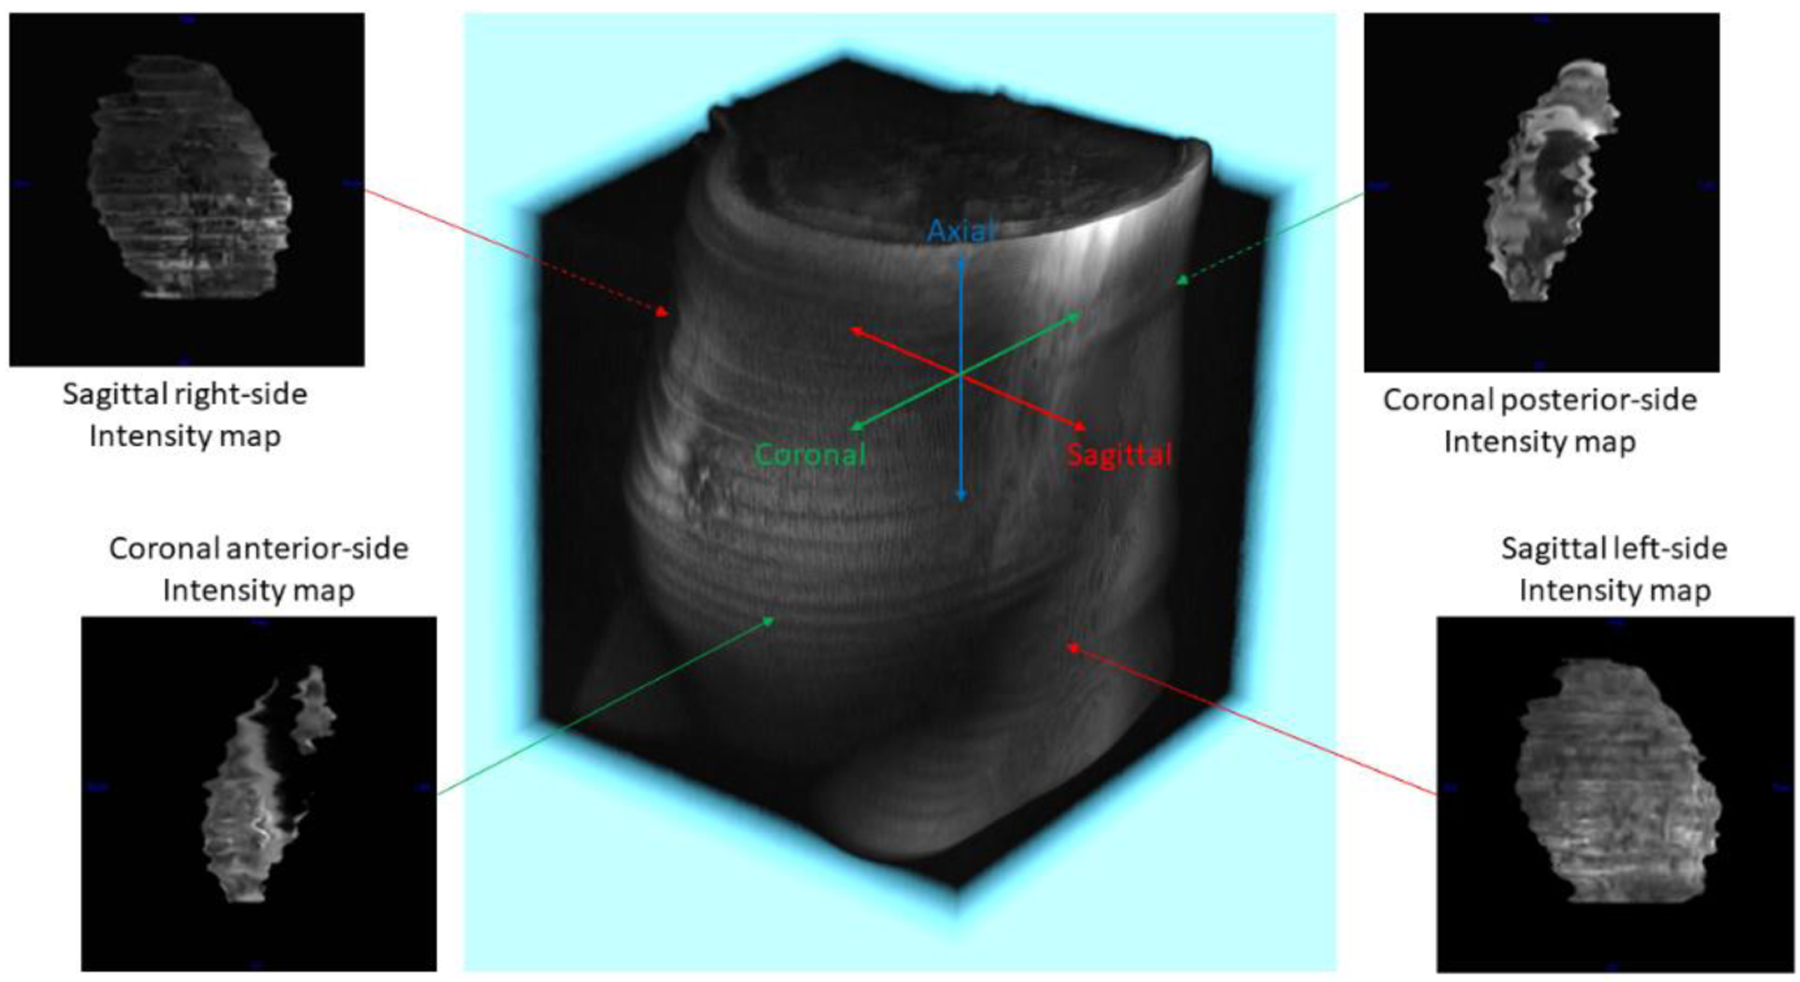
Planar topographic mapping definitions and sample feature maps. The four surfaces extracted and featurized were the sagittal left- and right-side and the coronal anterior- and posterior-side surfaces. Sample feature maps shown are intensity maps taken from each of the four surfaces
RESULTS
Figure 7 shows the extracted planar topography-based features for a normal case. Figure 8 shows the extracted polar topography-based features for a normal case. Figure 9 shows the polar topography-based features extracted from a prenatal MRI of a PAS suspected pregnant woman with postpartum hysterectomy.
Figure 7.
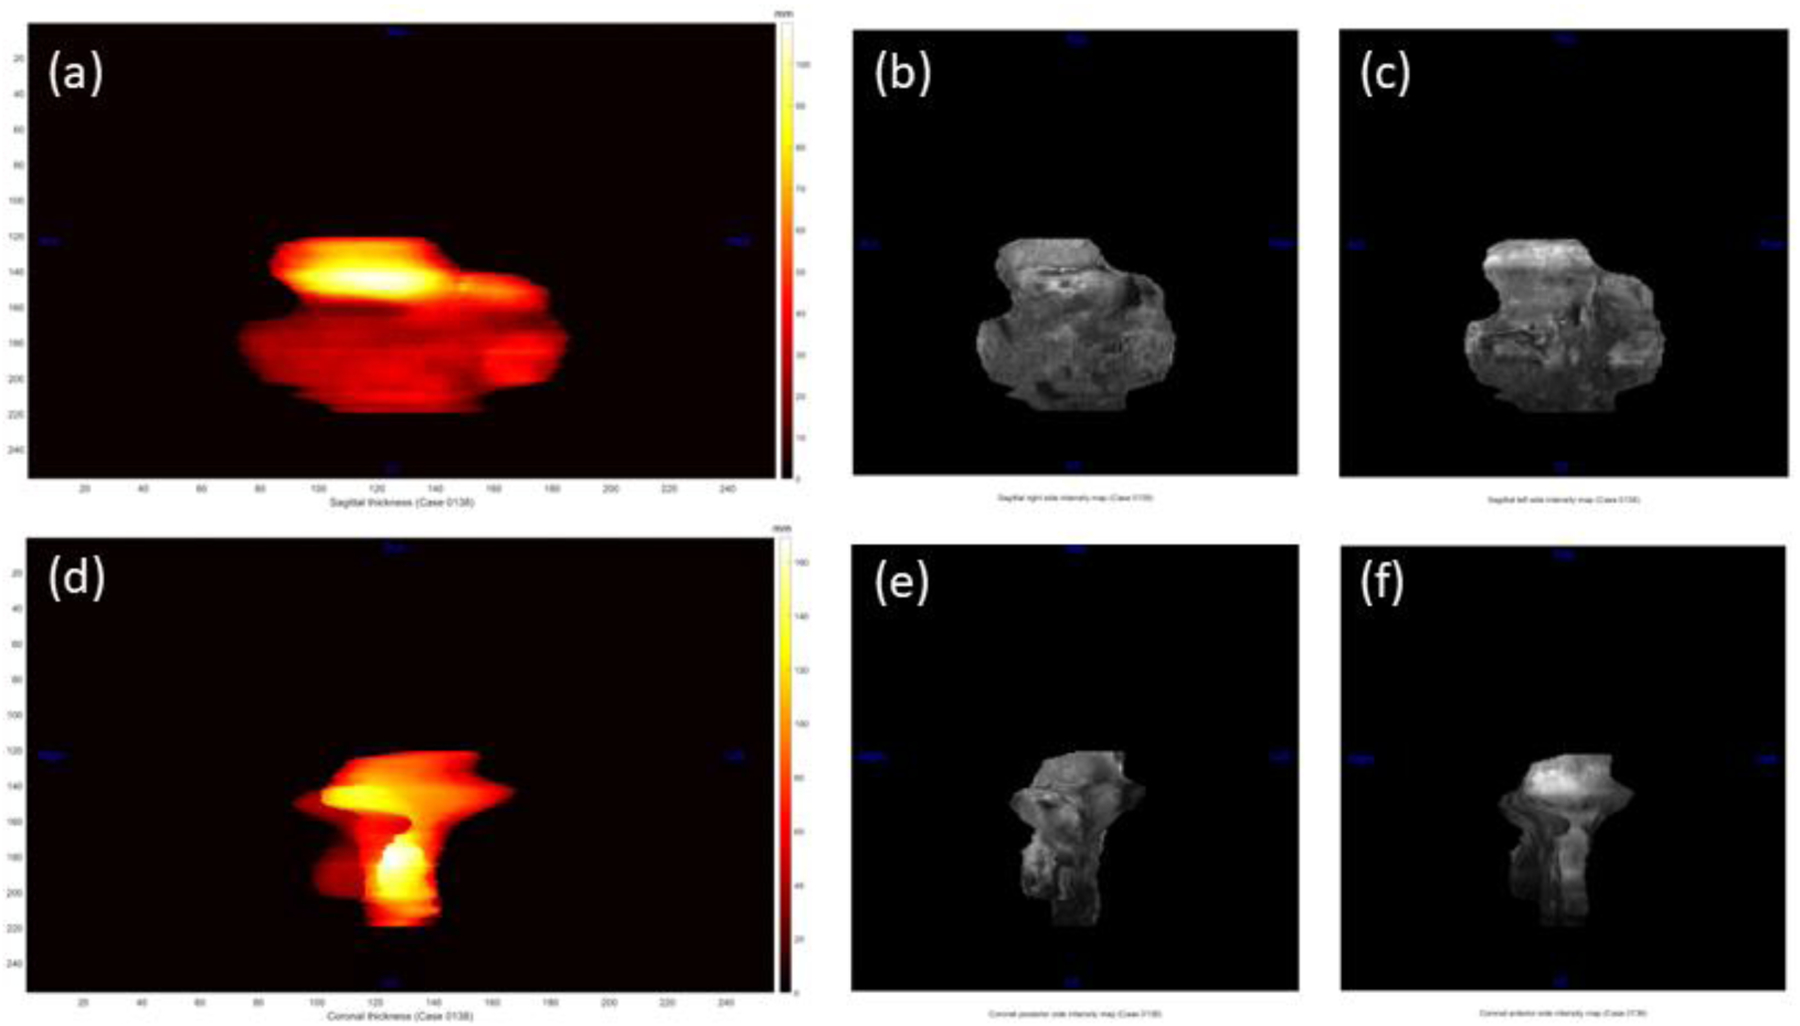
Planar topographic feature maps from a normal case. For the sagittal plane, a) is the thickness map, b) is the left-side intensity map, and c) is the right-side intensity map. For the coronal plane, d) is the thickness map, e) is the posterior-side intensity map, and f) is the anterior-side intensity map.
Figure 8.
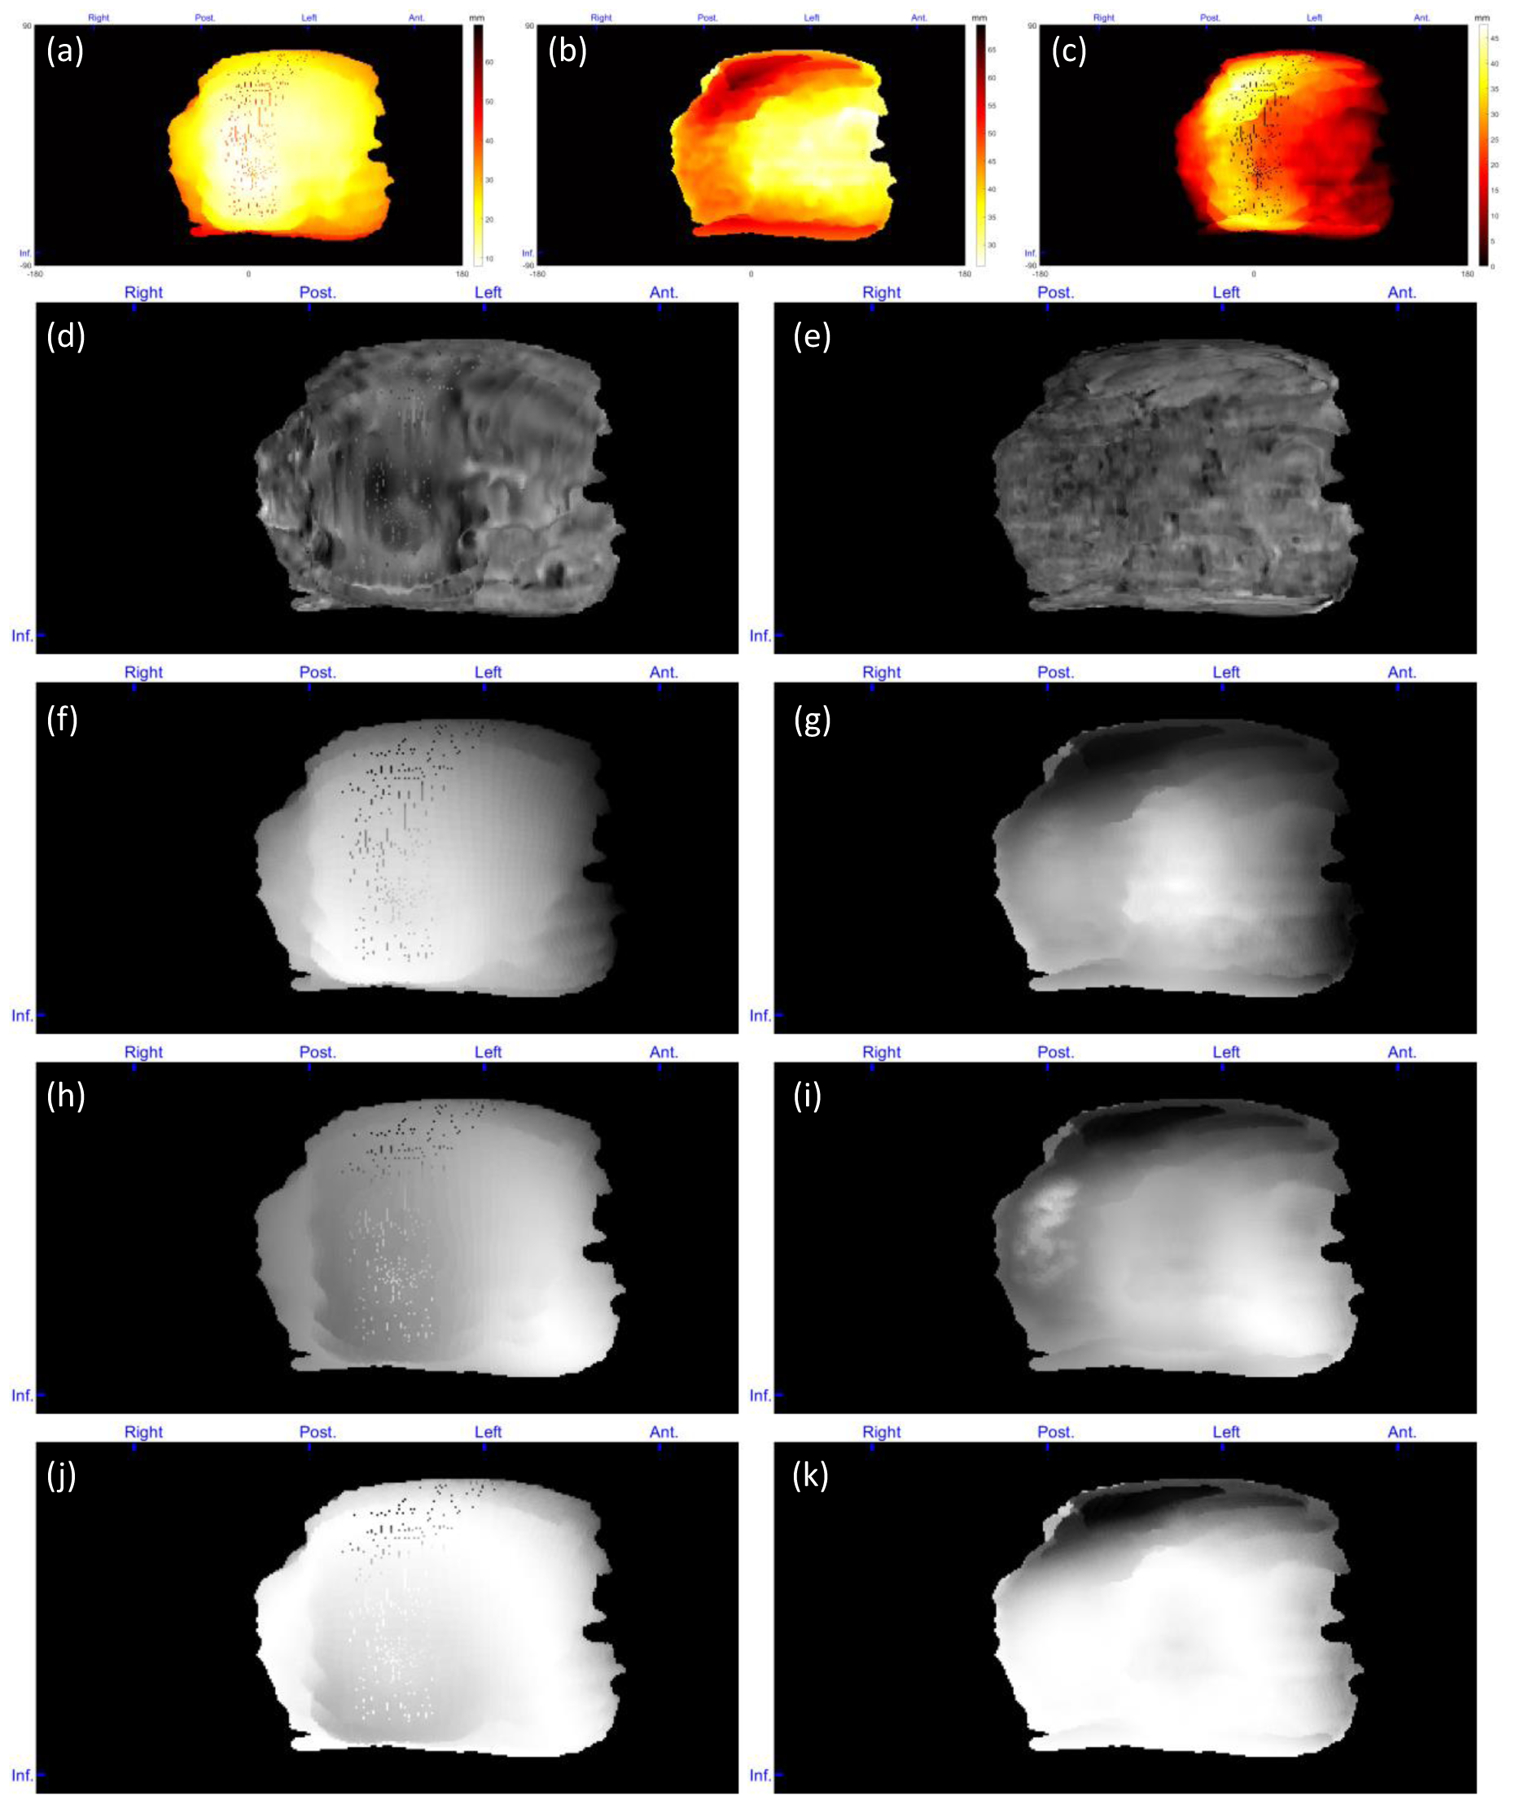
Topographic feature maps from a normal case. (a) Distance of the placenta fetal side from POV, (b) distance of the placenta maternal side from POV, (c) placenta thickness, (d) intensity of the placenta fetal side, (e) intensity of the placenta maternal side, (f) local average intensity of the placenta fetal side, (g) local average intensity of the placenta maternal side, (h) local intensity STD of the placenta fetal side, (i) local intensity STD of the placenta maternal side, (j) local entropy of the placenta fetal side, and (k) local entropy of the placenta maternal side. For patch-based feature extraction. The blue markers at the top and left side of each map show the orientations from which the features mapped (Ant. = anterior, Post. = posterior, and Inf. = inferior).
Figure 9.
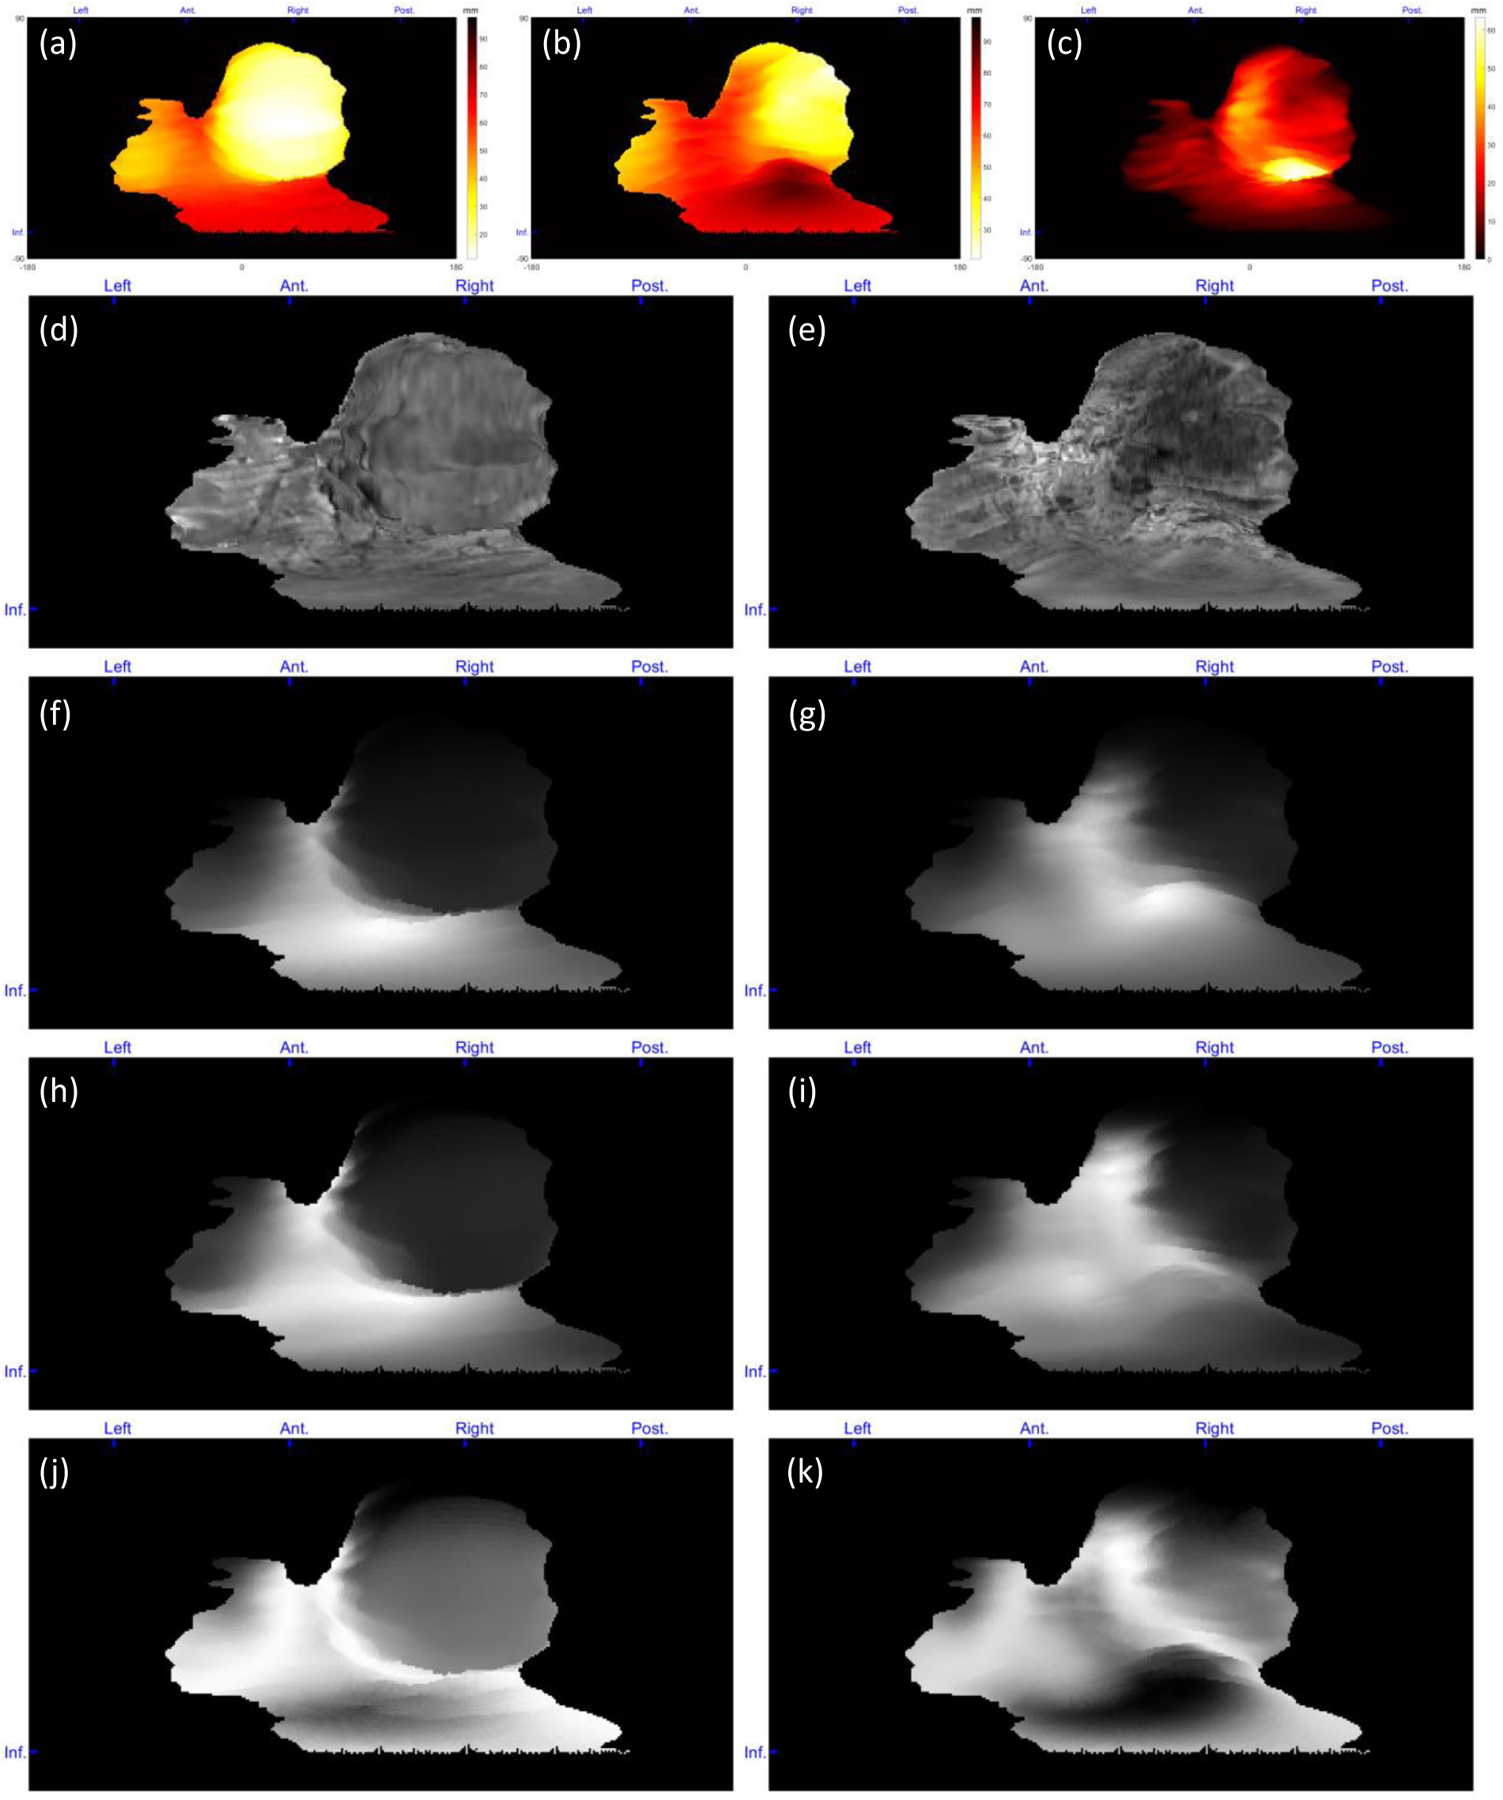
Topographic feature maps from a PAS suspected case with postpartum hysterectomy. (a) Distance of the placenta fetal side from POV, (b) distance of the placenta maternal side from POV, (c) placenta thickness, (d) intensity of the placenta fetal side, (e) intensity of the placenta maternal side, (f) local average intensity of the placenta fetal side, (g) local average intensity of the placenta maternal side, (h) local intensity STD of the placenta fetal side, (i) local intensity STD of the placenta maternal side, (j) local entropy of the placenta fetal side, and (k) local entropy of the placenta maternal side. For patch-based feature extraction. The blue markers at the top and left side of each map show the orientations from which the features mapped (Ant. = anterior, Post. = posterior, and Inf. = inferior).
CONCLUSIONS AND DISCUSSIONS
In this study, we presented a novel approach for extracting features from the placenta in MR images that can be utilized in future studies for computer-assisted diagnosis of placental abnormal conditions and hysterectomy prediction algorithms. To the best of our knowledge, this is the first time that a topographic analysis has been used for placenta MRI.
One limitation of this study is the movement of body and/or fetus during the relatively long MR imaging time. These movements cause some imaging artifacts that could be reflected on the maps, as shown in Figure 8a. Although smoothing of the surface following the registration in step was found to reduce the severity of visible artifacts in the constructed topography maps, they were not entirely eliminated. In addition, if the placenta is extended toward the inferior or superior sides of the uterus, an artifact is observed in polar topographic mapping because of the fewer number of placenta surface voxels with the elevation angels close to −90 and 90 degrees. Figure 10b–c shows two samples of this kind of artifact. This issue could be addressed by interpolating the maps at the regions with missing topographic data.
Figure 10.

Artifacts of the polar topography mapping. A) Effect of intra-volume slice misalignment on the topography map. Mapping artifacts at the b) superior and c) inferior sides of the placenta for two sample cases.
We proposed a topographical feature extraction and mapping approach for MR image volumes of pregnancies. Through this new technique, we aim to help analyze the images from a new point of observation. The extracted features could be useful for the detection of certain placental disorders and better prediction of life-threatening postpartum complications when combined with computational algorithms. As a future work, we are going to use the results of this work in a retrospective study on a deep learning-based classification for PAS detection and postpartum hysterectomy prediction, which should elucidate certain tradeoffs between the two methods for placental topography mapping.
ACKNOWLEDGMENTS
This research was supported in part by the U.S. National Institutes of Health (NIH) grants (R01CA156775, R01CA204254, R01HL140325, and R21CA231911), by the Cancer Prevention and Research Institute of Texas (CPRIT) grant RP190588.
REFERENCES
- [1].Costa M, “The endocrine function of human placetna: an overview,” Reproductive BioMedicine Online, vol. 32, no. 1, pp. 14–43, 2016. [DOI] [PubMed] [Google Scholar]
- [2].Gude N et al. , “Growth and function of the normal human placenta,” Thrombosis Research, vol. 114, no. 5–6, pp. 397–407, 2004. [DOI] [PubMed] [Google Scholar]
- [3].Norwitz E et al. , “Defective implantation and placentation: laying the blueprint for pregnancy complications,” Reprod Biomed Online, vol. 13, no. 4, pp. 591–599, 2006. [DOI] [PubMed] [Google Scholar]
- [4].Brosens I et al. , “The “Great Obstretrical Syndromes” are associated with disorders of deep placentation,” Am. J. Obstet. Gynecol, vol. 204, no. 3, pp. 193–201, 2011. [DOI] [PMC free article] [PubMed] [Google Scholar]
- [5].Rees S and Inder T, “Fetal and neonatal origins of altered brain development,” Early Hum Dev, vol. 81, no. 5, pp. 753–761, 2005. [DOI] [PubMed] [Google Scholar]
- [6].Guttmacher A et al. , “The Human Placenta Project: Placental structure, development, and function in real time,” Placenta, vol. 35, no. 5, pp. 303–304, 2014. [DOI] [PMC free article] [PubMed] [Google Scholar]
- [7].Leyendecker J et al. , “MRI of pregnancy-related issues: abnormal placentation,” American Journal of Roentgenology, vol. 198, no. 2, pp. 311–320, 2012. [DOI] [PubMed] [Google Scholar]
- [8].Maldjian C et al. , “MRI appearance of placenta percreta and placenta accreta,” Magnetic resonance imaging, vol. 17, no. 7, pp. 965–971, 1999. [DOI] [PubMed] [Google Scholar]
- [9].Switzer P et al. , “Value and limitations of obstetrical ultrasound: uncovering abnormalities at earlier stages,” Canadian Family Physician, vol. 38, p. 121, 1992. [PMC free article] [PubMed] [Google Scholar]
- [10].Kilcoyne A et al. , “MRI of placenta accreta, placenta increta, and placenta percreta: pearls and pitfalls,” American Journal of Roentgenology, vol. 208, no. 1, pp. 214–221, 2017. [DOI] [PubMed] [Google Scholar]
- [11].Derman A et al. , “MRI of placenta accreta: a new imaging perspective,” American Journal of Roentgenology, vol. 197, no. 6, pp. 1514–1521, 2011. [DOI] [PubMed] [Google Scholar]
- [12].Romeo V et al. , “Machine learning analysis of MRI-derived texture features to predict placenta accreta spectrum in patients with placenta previa,” Magnetic resonance imaging, vol. 64, pp. 71–76, 2019. [DOI] [PubMed] [Google Scholar]
- [13].Ueno Y et al. , “Novel MRI finding for diagnosis of invasive placenta praevia: evaluation of findings for 65 patients using clinical and histopathological correlations,” European radiology, vol. 24, no. 4, pp. 881–888, 2014. [DOI] [PubMed] [Google Scholar]
- [14].Guyader J et al. , “Influence of image registration on apparent diffusion coefficient images computed from free - breathing diffusion MR images of the abdomen,” Journal of Magnetic Resonance Imaging, vol. 42, no. 2, pp. 315–330, 2014. [DOI] [PubMed] [Google Scholar]
- [15].Keller S et al. , “Image artifacts from MR-based attenuation correction in clinical, whole-body PET/MRI,” Magnetic Resonance Materials in Physics, Biology and Medicine, vol. 26, no. 1, pp. 173–181, 2013. [DOI] [PubMed] [Google Scholar]
- [16].Murphy K et al. , “Evaluation of registration methods on thoracic CT: The EMPIRE10 challenge,” IEEE Transactions on Medical Imaging, vol. 30, no. 11, pp. 1901–20, 2011. [DOI] [PubMed] [Google Scholar]
- [17].Thirion J, “Image matching as a diffusion process: an analogy with Maxwell’s demons,” Medical Image Analysis, vol. 2, no. 3, pp. 243–260, 1998. [DOI] [PubMed] [Google Scholar]
- [18].Salarian M et al. , “Toward quantitative digital histopathology for prostate cancer: comparison of inter-slide interpolation methods for tumour measurement,” Medical Imaging 2013: Digital Pathology, vol. 8676, pp. 146–151, 2013. [Google Scholar]


