

SUMMARY
Microglia-mediated synaptic plasticity after CNS injury varies depending on injury severity, but the mechanisms that adjust synaptic plasticity according to injury differences are largely unknown. This study investigates differential actions of microglia on essential spinal motor synaptic circuits following different kinds of nerve injuries. Following nerve transection, microglia and C-C chemokine receptor type 2 signaling permanently remove Ia axons and synapses from the ventral horn, degrading proprioceptive feedback during motor actions and abolishing stretch reflexes. However, Ia synapses and reflexes recover after milder injuries (nerve crush). These different outcomes are related to the length of microglia activation, being longer after nerve cuts, with slower motor-axon regeneration and extended expression of colony-stimulating factor type 1 in injured motoneurons. Prolonged microglia activation induces CCL2 expression, and Ia synapses recover after ccl2 is deleted from microglia. Thus, microglia Ia synapse removal requires the induction of specific microglia phenotypes modulated by nerve regeneration efficiencies. However, synapse preservation was not sufficient to restore the stretch-reflex function.
Graphical abstract

In brief
Rotterman et al. show that peripheral nerve injury severity modulates microglia activation in the ventral horn of the spinal cord, which transforms spinal networks controlling motor function. Specifically, CCL2-expressing microglia are induced after more severe injuries, causing permanent removal of synapses carrying proprioceptive information necessary for fine movement coordination.
INTRODUCTION
A hallmark of nervous system injuries is extensive synaptic plasticity at the site of injury and also at remote locations connected with the injured networks. Synaptic changes can be permanent, adaptive, or maladaptive, affecting functional recovery after injury resolution and/or regeneration. Microglia are usually responsible for synapse and circuit remodeling that occurs at the injury site or remotely1–3; however, little is known about how microglia grade actions to injury severity, resulting in synaptic changes that are large or small and permanent or reversible.
A favorable model to study these mechanisms is synaptic plasticity inside the spinal cord after peripheral nerve injury. Much work has focused on dorsal horn reorganizations that enhance circuit excitability and induce chronic pain.4–6 However, significant synaptic changes also occur in ventral horn spinal motor circuits,7 impairing motor function recovery even after successful peripheral nerve regeneration. Because functional recovery varies widely depending on injury severity, it is important to understand mechanisms that adapt circuit plasticity to different injuries. We propose that this depends on the induction of different microglial properties modulated by nerve injury.
Spinal motor reflexes offer well-known circuits to evaluate synaptic changes after nerve injuries with different prognoses and relate them to microglia activation.8,9 Specifically, muscle-spindle Ia proprioceptive sensory afferents responsible for the monosynaptic stretch reflex are axotomized by nerve injuries, and while their peripheral axons regenerate, their synapses on motoneurons are remodeled dependent on injury severity: they are permanently removed after full nerve transections, but recover after milder injuries, like nerve crush.10–12 This explains a pioneering study prompted by the diversity of outcomes in military personnel after war-induced nerve injuries, which showed in rabbits that stretch reflexes recover after nerve crush, but not after nerve transection.13 Later analyses in cats demonstrated that after regeneration is completed, muscle stretch reflexes remain absent and stretch-evoked synaptic potentials (SSPs) in motoneurons diminish after nerve transection, but SSPs recover and reflexes are exaggerated following nerve crush.14,15 The loss of stretch reflexes after nerve transections was then confirmed in rats.16,17 Absent monosynaptic reflexes suggest reduced proprioceptive feedback to ventral horn motor circuits during ongoing movement, and their significance for motor dysfunction goes beyond reflex loss,7 being particularly detrimental for recovery of fine motor control. Thus, spinal circuits are more profoundly and permanently altered after nerve transections compared with nerve crush, but the mechanisms driving this differential plasticity are unknown. Both nerve injuries differ in axon regeneration speed and muscle targeting specificity,18–20 but it is unknown how these differences in peripheral nerve regeneration influence motor circuit plasticity in the spinal cord.
We previously reported that Ia-synapse deletion after nerve transection requires the C-C chemokine receptor type 2 (CCR2) and activation of ventral microglia dependent on colony-stimulating factor type 1 (CSF1/M-CSF) released from axotomized motoneurons.8 Microgliosis after nerve crush injury appears initially similar,21 but here we report that microglia remain activated for longer after nerve transection due to extended CSF1 expression in regenerating motoneurons. This causes a phenotypic switch in microglia toward expression of C-C chemokine ligand type 2 (CCL2). Microglia-specific deletion of the ccl2 gene rescues Ia synapses, but surprisingly, stretch reflexes did not recover. In conclusion, synapse loss depends on specific microglia phenotypes modulated by injury severity, and synapse preservation is a necessary step, but not sufficient, for functional recovery.
RESULTS
Nerve cut and crush differentially affect ventral horn proprioceptive synapses
Permanent loss of ventral horn Ia synapses after nerve transection depends on the dieback of ventral Ia axons toward medial lamina V (LV).10 To investigate Ia axon collateral stability after different nerve injuries, we examined proprioceptive axons in VGluT1Cre/+ Ai9:tdTomato mice. Genetically labeled VGluT1 (vesicular glutamate transporter 1) axons project throughout lamina IX (LIX) (Figure 1A1), but 8 weeks after sciatic nerve cut-repair, many are withdrawn from sciatic motor pool regions (Figure 1A2). However, after nerve crush, VGluT1 axon density was no different from that of controls (Figure 1A3). Peripherally, motor axons have reinnervated muscle at this time after either injury (Figures S2A–S2D). The results confirm in mice the permanent retraction of ventral Ia axon collaterals, specifically after nerve cut (Figure 1A4).
Figure 1. VGluT1 synapses recover following nerve crush but are permanently lost after nerve cut.
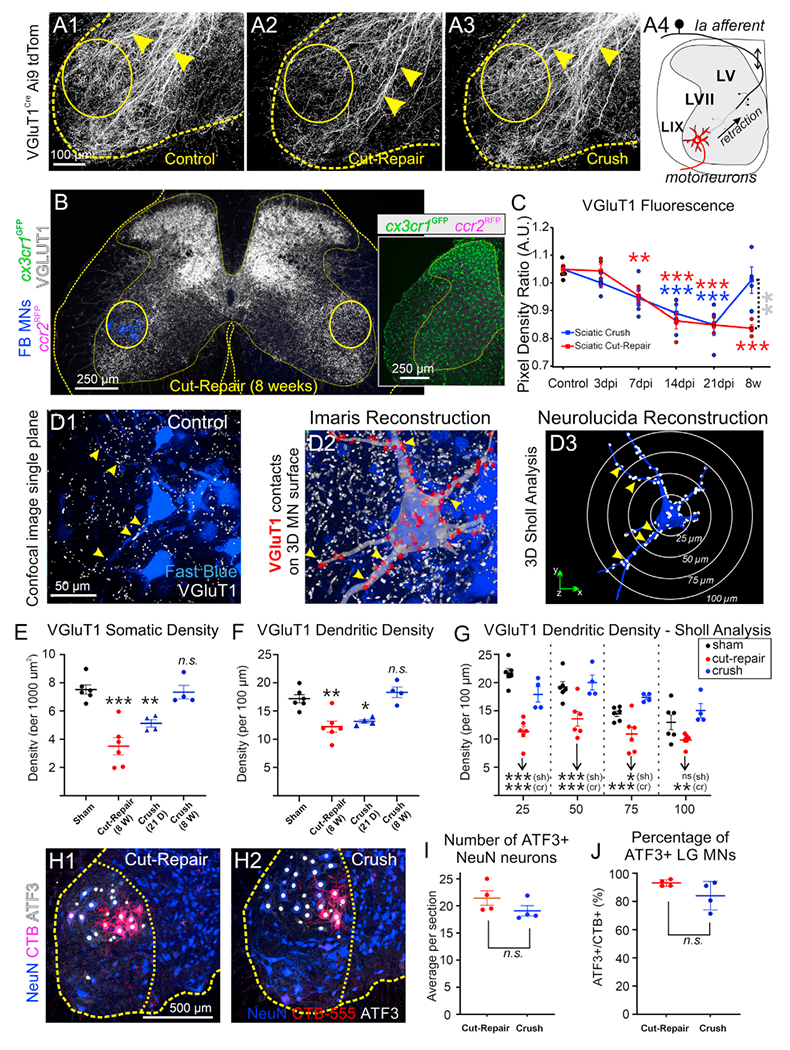
(A) VGluT1Cre/+ tdTomato axons (A1) in sham mice and 8 weeks after (A2) sciatic cut-repair or (A3) sciatic crush. Arrowheads, ventrally directed VGluT1 axons; circles, sciatic motor pools. In (A2), VGluT1 axon loss inside sciatic motor pools is shown. (A4) Model of Ia axon ventral collateral dieback after nerve cut.
(B) VGluT1-IR decreases in injured sciatic motor pools (circles) 8 weeks post-cut-repair. FB labels LG motoneurons (MNs). cx3cr1GFP/+::ccr2RFP/+ mice were used. Inset: GFP (microglia) and RFP (CCR2+ cells).
(C) VGluT1 density ratio (ipsilateral/contralateral to injury) after cut-repair (red) or crush (blue). Each mouse estimate is the average of 10 sections. Red and blue asterisks are comparisons to control. Gray asterisks compare cut-repair and crush. Statistics in the Table S1.
(D) VGluT1 synapses (arrowheads) on LG motoneurons. (D1) Single optical plane of a sham control. (D2) Neurolucida tracing on the confocal stack. Red dots mark VGluT1 synapses. (D3) VGluT1 synapses (white dots) on a reconstructed motoneuron. White circles indicate Sholl bins.
(E and F) VGluT1 density on (E) soma and (F) proximal dendrites. VGluT1 synapses are depleted in both compartments 8 weeks after cut-repair (red). Following crush (blue), they are significantly reduced 21 days after injury, but return to control 8 weeks post-injury. Dots are mouse estimates from six motoneurons each. Significance levels compared with sham controls. Statistics in the Tables S2 and S3.
(G) Sholl analyses 8 weeks post-injury (bin size: 25, 50, 75, and 100 μm from cell body). Following crush (blue), VGluT1 densities were not different from controls. After cut-repair (red), VGluT1 synapses were depleted at all dendrite distances. Asterisks indicate significance compared with crush (cr, blue) or sham (sh, black). Statistics in the Table S4.
(H) Nuclear ATF3 (white) in NeuN+ (blue) motoneurons and CTB-555-labeled LG motoneurons (red). Ventral horn and LIX indicated with dashed outlines.
(I) ATF3+ motoneurons per section (50 μm thick) 7 days post cut-repair (red) or crush (blue). No significant differences between injuries (t test, t(6) = 1.451, p = 0.197).
(J) Percentage of CTB+ motoneurons with ATF3. No significant differences (two-tailed t test, t(6) = 1.735, p = 0.134). In (I) and (J), each dot is the average of six sections per mouse.
In all graphs, each dot is an animal estimate, the animal’s average is represented by a bar or square, and error bars are ±SD. *p < 0.05, **p < 0.01, ***p < 0.001. Statistical comparisons are from two-way ANOVAs (injury type and time after injury in C; injury type and distance in G) or one-way ANOVAs (E and F) followed by post hoc Bonferroni’s t tests. Statistics in (I) and (J) are two-tailed t tests.
To describe proprioceptive Ia-synapses’ fates at different times after injury, we compared VGluT1 immunolabeling intensity after crush or cut-repair injuries around fast blue (FB) retrogradely labeled lateral gastrocnemius (LG) motoneurons (consistently used throughout this study as an injured motor pool example) (Figure 1B). We used cx3cr1GFP/+::ccr2RFP/+ dual-het mice to simultaneously visualize microglia (GFP) and blood-derived infiltrating CCR2+ cells (RFP) (Figure 1B, inset, and Figures 3 and 4). In quadruple-labeled sections (FB, LG motoneurons; GFP, microglia; RFP, CCR2 cells; Cy5, VGluT1) we estimated the ratio of VGluT1-integrated pixel density between the experimental side (marked by FB motoneurons) and a matching contralateral region (Figure 1C; n = 4 mice per condition, six sections per animal). VGluT1 ratios significantly decreased ipsilateral to the injury after sciatic nerve cut-repair or crush injury (two-way ANOVA, p < 0.0001; Table S1). Post hoc Bonferroni’s t test found significant depletions compared with controls (15%–19% reductions) after either injury at 14 days (cut-repair, p = 0.001; crush, p = 0.0011) and 21 days (p < 0.0001 after either injury). Eight weeks after nerve injury, VGluT1 density remained depleted ipsilateral to a cut-repair injury (20% ± 10% ± 95% CI; p < 0.0001) but recovered to control level after nerve crush.
Figure 3. The ventral horn microglial response is prolonged after sciatic nerve cut.

(A) Differences in ventral cx3cr1+ microglia (GFP) 14 days post cut-repair or crush. FB LG motoneurons are in blue. Dashed line divides dorsal and ventral horns.
(B) GFP+ cell counts in the ventral horn at different days post-injury (dpi) after cut-repair or crush. GFP+ microglia increase similarly in both injury models during the first week. Red and blue asterisks are comparisons to control. Gray asterisks compare cut-repair with crush. Statistics in the Table S5.
(C) cx3cr1-GFP cells at 3 and 7 days after cut-repair or crush injury incorporating EdU injected 24 h before.
(D) Percentage of cx3cr1+ cells with EdU. Similar numbers of microglia incorporate EdU at 2 days after cut-repair (red) or crush (blue). The percentage of microglia that incorporate EdU at 6 days drops below 10% after either injury. Differences between ages were significant (asterisks), but not between injuries. Statistics in the Table S7.
(E) cx3cr1-GFP cells with Ki67 at 3 and 7 days post-injury after cut-repair or crush injury.
(F) Percentage of cx3cr1+ cells with Ki67. Significant differences were found between 3 and 7 dpi following crush. After cut-repair two of three animals returned toward baseline at 7 dpi, while one remained elevated. Statistics in the Table S8.
(G and H) Colony-stimulating factor 1 (CSF1, red) is (G) strong in injured motoneurons, including FB + LG pools (blue), 14 days after cut-repair, but (H) weak after crush. Insets: high magnifications of areas outlined by boxes.
(I) CSF1 in individual FB+ motoneurons 14 days after cut-repair (red, mice 1–5) or crush (blue, mice 6–10). Average background + 2 SD is represented by gold bars. Black bars represent mouse averages, and error bars are ±SD. Motoneurons retained higher CSF1 14 days after cut-repair compared with nerve crush. Statistics in the Table S9.
(J) Percentage of FB+ motoneurons with CSF1 2XSD background 14 days post cut-repair (red) or crush (blue). A significantly larger proportion of motoneurons express CSF1 post cut-repair (two-tailed t test, t(8) = 3.604, p = 0.0069).
(K) Average fluorescence intensity in motoneurons that are CSF1+ 14 days post cut-repair (red) or crush (blue). Motoneurons express significantly more CSF1 after cut-repair compared with crush (two-tailed t test, t(8) = 4.523, p = 0.0019).
In all graphs (except I), each dot is one animal, animals’ averages are represented by a line, and error bars are ±SD. *p < 0.05, **p < 0.01, ***p < 0.001, ****p < 0.0001. In (B), (D), and (F), two-way ANOVA was used for injury type and days post-injury followed by post hoc Bonferroni’s test; in (J) and (K), t test.
Figure 4. CCR2+ cells preferentially infiltrate the ventral horn following nerve cut.

(A and B) Larger infiltration of CCR2+ cells (white) around FB LG motoneurons (blue) 14 days after (A) cut-repair compared with (B) crush. Bottom: enlarged images of areas outlined by yellow boxes.
(C) CCR2+ cell infiltration time course after cut-repair or crush. Graph represents average (±SD) number of RFP cells per ventral horn section (50 μm thick; six sections per animal). Peak infiltration occurs 14 days after injury. No significant infiltration of CCR2+ cells occurs after nerve crush. Statistics in the Table S10.
(D) cx3cr1+ cells (GFP) co-expressing CCR2 (RFP) are branched and “microglia-like.”
(E) Dual-expressing GFP::RFP cells per ventral horn are few, but significantly higher compared with control. Prolonged presence occurs only after cut-repair. Statistics in the Table S11.
(F and G) Iba1 microglia and FB LG motoneurons 14 days after unilateral sciatic cut-ligation in ccr2-CreERT2::tdTomato mice (F). (G) Same section showing CCR2+ cells lineage labeled prior to injury and visualized 14 days after cut-repair.
(H–J) Images of FB LG motoneurons, Iba1+ cells, tdTomato genetically labeled CCR2+ cells, and the T cell marker Cd3ε 14 days following sciatic cut-repair. Dashed boxes in (H) are shown at higher magnitude in (J) and (I). Iba1+ and CCR2+ cells surround axotomized motoneurons. Most lineage-labeled CCR2+ cells are T cells (single arrowheads). A few cells branch and express Iba1 (double arrowheads).
In graphs (C) and (E) each dot is one animal estimate, animals’ averages are represented by a line, and error bars are ±SD. *p < 0.05, **p < 0.01, ***p < 0.001, ****p < 0.0001. Two-way ANOVA for injury type and time followed by post hoc Bonferroni’s test. Red and blue asterisks are comparisons with control. Gray asterisks compare cut-repair with crush.
Loss of VGluT1 immunofluorescence intensity can be interpreted as loss of synaptic boutons, decrease in VGluT1 content, or reduced VGluT1 cluster size. To directly investigate VGluT1 synaptic density on motoneurons, we generated 3D reconstructions of FB LG motoneurons in Neurolucida from high-magnification confocal image stacks and mapped VGluT1 contacts on cell bodies and dendrites (Figures 1D1–D3). We examined four experimental groups: sham control (n = 6 mice), 8 weeks postcut-repair (n = 6), and two groups after nerve crush at 21 days and 8 weeks post-injury (n = 4 each). Six motoneurons per animal were analyzed (120 total). Average soma VGluT1 synaptic density in sham controls was 7.5 ± 0.3 (±SE) contacts per 1,000 μm2 (Figure 1E), and average dendritic linear density was 17.2 ± 0.7 contacts per 100 μm of dendritic length (Figure 1F). Synaptic densities significantly changed on cell bodies and dendrites (one-way ANOVA, p < 0.0001 cell body; p = 0.0002 dendrites; details in Tables S2 and S3). Post hoc comparisons revealed differences depending on injury and time after injury. Eight weeks after nerve surgeries VGluT1 synapses were depleted by 53.5% and 28.7%, respectively, on cell bodies and dendrites after cut-repair injury (cell body, p < 0.0001; dendrite, p = 0.001; Bonferroni’s t test) but they were no different from sham controls after nerve crush. To test whether this was due to synapse preservation or recovery, we analyzed animals 21 days after nerve crush injury. These showed significant VGluT1 synapse depletions on cell bodies (31.9% decrease, p = 0.0094) and dendrites (23.3%, p = 0.0139), suggesting a partial loss after nerve crush that recovers coincidently with nerve regeneration (Figures S2A–S2D).
To investigate whether there was preferential loss in specific dendrite regions, we analyzed VGluT1 densities at 25, 50, 75, and 100 μm Sholl distances 8 weeks after injury (Figure 1G) and found significant differences in both injury and dendritic distance(p < 0.001, two-way ANOVA for both). Briefly, VGluT1 density decreased with distance in sham controls, but not after cut-repair or crush (Table S4). After cut-repair, VGluT1 synapses were depleted at all Sholl distances (Figure 1G and corresponding Table S4). After crush, VGluT1 synapse density on dendrites recovered, but the proximodistal gradient was lost.
No significant sex differences were found in VGluT1 synapse density in controls or in their loss from dendrites after nerve injury (Figures S1A1, S1A2, and S1B2). We detected interanimal variability in VGluT1 losses on cell bodies after nerve cut-repair injuries, but this was unrelated to sex (Figure S1A2). Sex was therefore discarded as a significant variable affecting VGluT1 synapse plasticity in our experiments.
To rule out whether differences in axotomized axon numbers influenced VGluT1 synapse fate, we confirmed that similar numbers of motoneurons express activating transcription factor 3 (ATF3; an injury marker) after either injury. LG motor pools were retrogradely labeled with cholera toxin subunit B conjugated to Alexa 555 (CTB-555) 7 days prior to nerve injuries, and all neurons were immunolabeled with NeuN (neuronal nuclear marker) (Figure 1H). ATF3+ motoneuron numbers showed no significant differences between the two injuries (Figure 1I) (n = 4 mice per injury type; 10 sections per mouse; two-tailed t test, p = 0.197). Similarly, 93.1% ± 1.2% and 84.1% ± 5.1% of LG CTB-labeled motoneurons expressed ATF3 after cut-repair or crush (Figure 1J, two-tailed t test, p = 0.134). NeuN was downregulated after axotomy as previously reported,10 but was detectable in 74.9% ± 7.8% FB LG motoneurons and in 61.1% ± 6.9% of ATF3+ neurons. In conclusion, ATF3 upregulation and NeuN downregulation in motoneurons suggest comparable axotomy.
Both injuries differ, however, in the speed and specificity of regeneration: low after cut-repair and high after crush (Figure S2). Neuromuscular junction (NMJ) reinnervation was significantly slower after nerve cut-repair (Figures S2A–S2D). Specifically, 14 days after injury almost no NMJs were reinnervated by motor endplates after nerve cut-repair injury, while around 60% of NMJs were, at least partially, reinnervated at this time after nerve crush. Regeneration specificity was analyzed using a dual labeling strategy: LG motoneurons were retrogradely labeled with FB 5 days before nerve injury, and after waiting 8 weeks for muscle reinnervation to occur, motoneurons reinnervating the LG were retrogradely labeled with CTB-555 (n = 4 mice per condition). FB and CTB-555 co-localization was reduced after nerve cut compared with control or crush injury (Figures S1E and S1F), and this was paralleled by dispersion in LIX of CTB-555 motoneuron locations compared with the position of the original motor pool marked with FB (Figures S2G–S2M). Thus, motoneurons reinnervating the LG after a nerve cut originate from a diversity of motor pools before the injury, while muscle reinnervation is specific after nerve crush.
In summary, VGluT1 axons withdraw from LIX after nerve cut-repair, causing permanent loss of Ia synapses, while after nerve crush, Ia synapses recover. Ia-synapse recovery after nerve crush correlates with faster and more specific muscle reinnervation.
Stretch reflexes recover following nerve crush but remain absent after transection
VGluT1 loss and recovery after each injury followed trends similar to those reported in rats,10,12 but they were of lesser magnitude. To determine functional outcomes in mice, we measured stretch reflexes 12 weeks post-injury (extended time for more complete muscle reinnervation) and compared them with control values (Figure 2). Sensory afferents (identified by neurofilament heavy chain [NFH] and VGluT1) reinnervated muscle spindles at this time after both injuries. They formed normal annulospiral endings after crush but were structurally disorganized following regeneration after nerve cut-repair (Figure 2A). Despite this altered morphology, they accurately encoded muscle-length dynamics (Figure S3).
Figure 2. Stretch reflexes recover following regeneration after sciatic nerve crush but not after sciatic nerve cut-repair.

(A) Decerebrate mouse preparation for stretch-reflex testing. Triceps surae muscle tendon is attached to a servomotor to apply stretch (ramp-hold-release [ramp] or vibration), while simultaneously recording force and EMG activity. Insets: Muscle spindle reinnervation following cut-repair (top) and crush (bottom). Sensory axons were labeled with neurofilament heavy chain (NFH; green) and VGluT1 (magenta) antibodies.
(B) Raw muscle force traces (black) to ramp stretch (left) or vibration (right) in control, cut-repair, and crush mice and corresponding EMGs (blue). Passive force (red) to ramps was measured under isoflurane.
(C) Percentage of trials resulting in a reflex response. Each dot represents average data from 40 to 100 trials per animal. All mice produced a reflex in control and 8 weeks post-crush to either ramp or vibration. After cut-repair, only one mouse (of five) produced a reflex in 22% of trials in response to ramp stretch. None elicited responses after vibration.
(D) Time-integrated reflex muscle force. No reflex force was elicited after cut-repair, except for one mouse partially responsive to ramps. After nerve crush, reflex to ramps was significantly enhanced (two-tailed t test, t(7) = 2.776; p = 0.0275), but not to vibration (two-tailed t test, t(7) = 0.4256; p = 0.9832).
(E) Time-integrated EMGs in response to ramp or vibration. After cut-repair most mice had no response to either ramp or vibration, with the one exception noted in (C) and (D). After crush there was a trend toward larger responses to ramps, although this was not significant (two-tailed t test, t(7) = 1.066; p = 0.3220). Average responses to vibration were similar to control (two-tailed t test, t(7) = 0.1199; p = 0.9080).
In all graphs each dot is one animal estimate, animals’ averages are represented by a line, and error bars are ±SD. *p < 0.05. Statistical comparisons were not done when most data equal 0 (cut-repairs).
To test reflexes, decerebrate mice were prepared with the Achilles tendon attached to a servomotor that elicited graded muscle stretches and recorded muscle force. Electromyographic (EMG) responses were simultaneously recorded (Figure 2A). Two stretch stimuli were used. One-second ramp-hold-release stretches (0.5 mm; 5 mm/s) from a background force of 1–5 g activate various types of muscle proprioceptors modulating motoneuron firing through mono- and polysynaptic pathways, while vibration stimuli (100 Hz, 80 μm amplitude) specifically activate Ia afferents (Figure 2B). We calculated the percentage of trials evoking a reflex after each stimulus (33–100 trials per mouse for ramps and 23–100 for vibrations) (Figure 2C), the reflex forces integrated against time (Figure 2D), and the time-integrated reflex EMG amplitude (Figure 2E). Reflex force after ramps was calculated after subtracting the viscoelastic response of the muscle estimated under isoflurane anesthesia with the neural reflex abolished.
In control mice (n = 4) approximately 100% of trials resulted in reflex responses to ramps or vibration stretches. Twelve weeks after cut-repair injury (n = 5 mice) no reflex was elicited after either stimulation, with one exception that weakly responded to ramps. After nerve crush, all mice (n = 5) were responsive to ramp or vibration trials. In controls, ramp stretches produced an average force across test time of 5.2 ± 1.0 g/s (±SD), and after vibration, 2.9 ± 1.1 g/s. Both were associated with parallel EMG responses (ramp, 1.20 ± 1.04 mV/s; vibration, 3.55 ± 1.73 mV/s). After crush injury, reflex responses to ramp stretches were significantly larger compared with controls (84% increase, two-tailed t test, p = 0.0275), but comparable to control after vibration. Differences in force after nerve crush were paralleled by larger EMG responses, but EMG variability prevented reaching significance in our samples. In conclusion, after nerve crush, VGluT1 synapses recover, and reflexes become enhanced (in response to ramps), but after nerve cut-repair, both are permanently lost. One possible explanation is failure of regenerated afferent axons to encode muscle stretch after cut-repair injury. We ruled out this possibility by recording Ia afferent responses in the dorsal root after ramp-hold and vibration stretches (Figures S3A, S3B1–S3B3, and S3C1–S3C3). Responses in three mice tested 12 or more weeks after cut-repair injury were comparable to those recorded in three naive mice. We conclude that muscle-length information does enter the spinal cord, but it is not transferred to motoneurons. We also confirmed that motor axons are functionally coupled to muscle fibers (Figure S3D1–S3D3).
Both injuries elicit identical microglia proliferation during the first week, but they differ in microgliosis time course
To compare ventral horn microglial responses between both injuries we analyzed cx3cr1::GFP fluorescence intensities around FB-labeled motoneurons and ventral horn microglia numbers at 3, 7, 14, and 21 days and 8 weeks after injury (Tables S5 and S6; Figures 3A and 3B; n = 4–5 mice per age/injury, six sections per animal). Both estimates resulted in similar significant differences according to time after injury and injury type (two-way ANOVA; cx3cr1::GFP fluorescence, injury type, p < 0.0001 for both time and injury type; microglia number, injury type, p = 0.0016, time, p < 0.0001). Pairwise comparisons show that microglia numbers (Figure 3B, Table S5) and cx3cr1::GFP fluorescence increased similarly during the first week after both injuries (Figure S4B and Table S6), but the microglia reaction was maintained into the third week post-injury (21 days) after cut-repair, while it returned to control level during the second week after crush. Thus, differences between both injuries were significant at 14 days (p = 0.0006, microglia number; p < 0.0001, GFP fluorescence) and 21 days (p = 0.0471, microglia number; p = 0.0002, GFP fluorescence). All values returned to control levels 8 weeks after either injury. The ventral horn microglia reaction was not affected by sex (Figures S1C1–S1C3 and S1D1–S1D3). Comparisons 14 days after injury revealed some interanimal variability, but these were unrelated to sex. We interpret this variability as the result of animal differences in dynamic changes in activated microglia with time after injury and to the fact that ventral horn microglia number per section is influenced by the number of axotomized motoneurons within the individual sections sampled. We did not include a label to normalize for injured motoneuron number, and therefore, variability could be in part due to section sampling. In any case, interanimal variability was much smaller than differences in microglia numbers among the experimental groups.
To compare microglia proliferation between injuries, we examined 5-ethynyl-2′-deoxyuridine (EdU) incorporation and Ki67 immunoreactivity in cx3cr1::GFP microglia. Proliferation was restricted to the first week after both injuries (Figures 3C–3F). EdU injected 2 days post-injury and analyzed at 3 days after cut-repair or crush, labeled respectively 36.0% ± 1.0% (±SD) and 32.6% ± 4.0% of cx3cr1::GFP microglia. When EdU was injected at day 6 and analyzed at day 7, there was a large reduction in labeled cells (Table S7; n = 3 mice per time and injury, six sections per animal). We confirmed these results in serial sections with Ki67 antibodies (Figure 3F; Table S8). In this case, 51.5% ± 3.6% and 58.1% ± 11.4% of cx3cr1::GFP microglia were positive at 3 days after respectively cut-repair and crush injury. Higher percentages are explained because Ki67 is present in dividing cells during G1, S, G2, and M phases, while EdU labels cells only during S phase. Percentages of Ki67-labeled cx3cr1::GFP microglia dropped at 7 days post-injury in all animals examined after crush (average 3.0% ± 1.1%) and in two of the three animals examined after cut-repair (3.7% and 4.3%). Thus, different microglia numbers 14 days after injury are not due to extended proliferation, but to longer survival of activated microglia after nerve cut.
We previously showed that microglia activation depends on CSF1 expression in axotomized motoneurons.8 Therefore, we examined whether this differs between injuries at 14 days (Figures 3G and 3H), a time with the larger difference in microglia numbers. Motoneurons were considered CSF1+ when CSF1 immunoreactivity was 2 SD higher than the background average (Figure 3I). All FB-labeled LG motoneurons were CSF1 + in four of five mice with cut-repair injury. In the fifth mouse, we estimated 88% labeling. Fewer FB motoneurons retained CSF1 14 days after crush (Figure 3J, 57.7% ± 24.3%, with a range of 40.6%–100%; two-tailed t test, p = 0.0069). Moreover, after crush injury, CSF1+ motoneurons expressed significantly weaker immunofluorescence (Figure 3K, two-tailed t test, p = 0.0019). CSF1 maintenance in motoneurons correlated with retention of activated microglia. Moreover, muscle reinnervation 14 days after injury was advanced after nerve crush but limited after cut-repair (Figures S1A–S1D), suggesting that CSF1 expression is inversely correlated with muscle reinnervation. This offers a mechanism by which the speed of muscle reinnervation modulates motoneuron CSF1 expression and the duration of microglia activation.
CCR2+ immune cells infiltrate the spinal cord only after nerve cut-repair injury
VGluT1 synapse loss is prevented in ccr2 knockouts and correlates with CCR2+ immune cell infiltration.8 Therefore, we used the ccr2-RFP allele in cx3cr1GFP/+::ccr2RFP/+ dual-het mice and RFP antibody amplification to identify CCR2+ cells. CCR2+ cell infiltration occurs mainly in the ventral horn but differs according to injury type and time after injury (Figures 4A–4C, two-way ANOVA, p < 0.0001 for both variables and their interaction; Table S10, n = 4 for each injury and time point, except n = 3 after crush at 8 weeks; Table S10). CCR2+ cell infiltration is significantly larger after nerve cut-repair and is delayed with respect to the microglia reaction, peaking 14 days after injury and remaining elevated at 21 days (p < 0.0001, Bonferroni’s t test). Earlier infiltration is small and variable and significantly lower after nerve crush (p < 0.0001, Bonferroni’s t test). CCR2+ cell infiltration after cut-repair replicates our previous data after cut-ligation preventing regeneration,8 except that in that case, CCR2+ cell entry continued for 3 weeks, peaking at 21 days.
Most CCR2+ cells are rounded, but a few develop branched morphology and upregulate cx3cr1::GFP (Figures 4D and 4E). These microglia-like CCR2+ cells are few (one or two per section) and are present 14 days after both injuries. They are maintained for longer after cut-repair (Table S11). Interpretation of ccr2-RFP cell abundance is constrained by dynamic changes in ccr2 gene expression (and RFP) during tissue infiltration and transformation into local microglia-like phenotypes. Alternatively, activated microglia could upregulate ccr2 expression. To rule out these possibilities, we lineage labeled CCR2+ cells using ccr2CreERT2::lsl-tdtomato (ccr2::tdT) mice, inducing recombination with tamoxifen 24 h before the nerve injury (Figures 4F and 4G). This approach permanently labels peripheral CCR2+ cells before any possible injury-induced changes in ccr2 expression. Fourteen days after nerve cut-ligation (peak cell entry, n = 2 animals) ccr2::tdT cells in the spinal cord were similar to ccr2::RFP cells in cx3cr1GFP/+::ccr2RFP/+ dual-het mice. Most lineage-labeled ccr2::tdT cells were rounded and expressed the T cell marker CD3ε (cluster differentiation 3ε). A few were branched and Iba1 positive (Figures 4H, 4I1, 4I2, 4J1, and 4J2). This confirms our ccr2:RFP cell analyses and that all CCR2+ cells inside the spinal cord after either nerve injury are blood derived.
Microglia upregulate ccl2 expression only after nerve cut-repair injury
CCL2 is an important ligand of CCR2, and it is upregulated after nerve injury by Schwann cells and axotomized dorsal root ganglion (DRG) neurons.22,23 In both cases they were proposed to attract CCR2 macrophages that promote regeneration by either removing axon/myelin debris in the nerve or inducing regenerative mechanisms in sensory neurons. However, an alternative view of CCL2 being dispensable for CCR2+ cell recruitment was recently proposed.24
CCL2 roles and sources in the spinal cord ventral horn are less well characterized. To investigate this, we used ccl2-mCherryflox mice in which mCherry reports ccl2 gene expression in the absence of cre, and mCherry and ccl2 are simultaneously removed after cre recombination.25 We first used this mouse as a sensitive expression reporter and compared ccl2 expression in all ChAT+ motoneurons, FB-LG motoneurons, and Iba1+ microglia at 3 and 14 days after nerve crush or cut-repair (Figures 5A–5D). We analyzed two mice (one of each sex) for each combination of injury type and time after injury (n = 8 mice). Each mouse was analyzed through six or seven sections. We confirmed that there were no sex differences (Figure S5) and then pooled all sections from both animals for statistical comparisons. Motoneuron expression of ccl2 estimated either as total number of ChAT+ motoneurons or as a percentage of FB-LG ChAT+ motoneurons was similar after both injuries (Figure 5E and 5F), but ccl2::mCherry expression significantly changed with time after injury (two-way ANOVA, Tables S12 and S13). It was significantly reduced between 3 and 14 days after nerve cut-repair (50.2% reduction, p < 0.0001, Bonferroni’s t test) and after nerve crush (60.6% reduction, p < 0.0001) (Tables S12 and S13). In contrast, microglia had little ccl2::mCherry expression at any time after nerve crush or at 3 days after nerve cut-repair, but large numbers of microglia expressed ccl2::mCherry 14 days after cut-repair injury. This increase was significant when calculated as either total numbers of microglia or the percentage of microglia sampled from a region of interest (ROI) around injured motoneurons (Figures 5G and 5H; Tables S14 and S15). ccl2:mCherry microglia were not detected in the contralateral side or in the ipsilateral dorsal horn. Thus, motoneurons transiently express ccl2 after axotomy independent of injury severity and the fate of Ia synapses. In contrast, microglial ccl2 expression is associated with injury severity and correlated with Ia-synapse removal. It occurs only in ventral microglia when microgliosis extends past the first week post-injury. To obtain a more detailed time course of ccl2 expression after nerve cuts, we analyzed two mice at 3, 7, 14, and 21 days and 8 weeks post-injury (in this case the proximal stump was ligated, preventing regeneration). ccl2::mCherry in motoneurons peaked 3 days after sciatic nerve transection, was maintained for 3 weeks, and was downregulated 8 weeks post-injury, even without motor axon regeneration (Figure 5G). Around half of Iba1 + microglia surrounding FB-LG motoneurons expressed ccl2::mCherry the first week after injury and almost 100% by day 14. mCherry labeling was initially distributed throughout cell bodies and processes in microglia but later aggregated in intracytoplasmic clusters (Figure 5H). It is possible this represents faulty mCherry metabolism and not continued ccl2 expression.
Figure 5. Microglia and injured motoneurons differentially express CCL2 depending on injury type and time after injury.

(A–D) ccl2::mCherry (A and C) 3 and (B and D) 14 days after (A and B) nerve crush or (C and D) cut-repair injury. All sections contain four fluorochromes: FB LG motoneurons (FB, blue), ChAT+ motoneurons (FITC, green), mCherry (Cy3, magenta), and Iba1+ microglia (Cy5, green). Pseudocolors were chosen for best visualization. Motoneurons express ccl2:mCherry after either injury with stronger expression at 3 days. Microglia express ccl2::mCherry only 14 days after nerve cut-repair injuries (white/whitening green).
(E) ChAT+ motoneuron numbers expressing ccl2:mCherry are not significantly different among injuries. Expression significantly decreases from 3 to 14 days. Statistics in the Table S12.
(F) Similar results as in (E) estimating the percentage of FB LG motoneurons expressing ccl2::mCherry. Statistics in the Table S13.
(G) Few Iba1+ microglia contained within a circular ROI centered on FB motoneurons express ccl2::mCherry at any post-injury time after crush or 3 days after cut-repair injuries. This number significantly increases 14 days after a nerve cut-repair injury. Statistics in the Table S14.
(H) Same conclusion as in (G), but considering the percentage of Iba1+ microglia with ccl2::mCherry. Statistics in the Table S15.
(I) Time course of ccl2 expression in ChAT+ motoneurons and Iba1+ microglia after nerve cut-ligation (no regeneration, two animals per time point). Expression in motoneurons precedes that in microglia, which peaks 14 days post-injury. Left: number of ChAT+ motoneurons and Iba1+ cells with ccl2::mCherry over time. Right: percentage of FB+ motoneurons and Iba1+ cells with ccl2::mCherry.
(J) ccl2::mCherry signal (magenta) in Iba1+ microglia (green) 14 days and 8 weeks after a nerve cut-repair injury. At 14 days mCherry labeling fills the whole cell body and processes, at 8 weeks it is clustered in one side of the cytoplasm.
In graphs (E) to (H), each dot is one section from n = 2 animals (one male and one female; see Figure S5 for animals’ individualized data). Averages of all pooled sections are represented by a line and error bars are ±SD. *p < 0.05, ****p < 0.0001. Two-way ANOVA for injury type and days post-injury followed by post hoc Bonferroni’s test.
In conclusion, CCL2 sources in the ventral horn are transient and differ according to injury type, with ccl2-expressing microglia associated with the most severe injuries.
Deletion of ccl2 from microglia, but not from motoneurons, leads to VGluT1 synapse preservation, but without recovery of stretch reflexes
To test the significance of microglia or motoneuron CCL2 during removal of Ia/VGluT1 synapses, we used ChATIRES-Cre and cx3cr1CreERT2/+ mice to delete ccl2 in a cell-specific manner using ccl2-mCherryflox mice. In cx3cr1CreERT2/+::ccl2-mCherryflox/flox mice (MGΔccl2), we induced recombination by a dual tamoxifen injection (7 days prior to and on the day of nerve surgery). Motoneurons with CCL2 deleted (MNΔccl2) are generated in ChATIRES-Cre/+::ccl2-mCherryflox/flox mice. We confirmed ccl2::mCherry-specific deletion from motoneurons or microglia 14 days post-injury (Figures 6A and 7A). Thereafter, we analyzed VGluT1 density on cell bodies and dendrites of reconstructed FB-LG motoneurons in MNΔccl2 and MGΔccl2 mice at 12 weeks post-injury, with ccl2flox/flox serving as a genotype control (Figure 6B, seven or eight motoneurons per animal, six animals per genotype, total 191 motoneurons). VGluT1 depletion 12 weeks after sciatic nerve cut and repair in ccl2flox/flox mice was comparable to data in Figures 1E and 1F at 8 weeks post-injury in cx3cr1GFP/+::ccr2RFR/+ mice. VGluT1 density was not recovered on the cell bodies of motoneurons in MNΔccl2 or MGΔccl2 mice but recovered on dendrites specifically in MGΔccl2 mice. On cell bodies, VGluT1 density was significantly reduced by 48.7%, 42.0%, and 37.2% from control in respectively ccl2flox/flox, MNΔccl2, and MGΔccl2 mice (p = 0.007, 0.0033, and 0.0097, Bonferroni’s t test; Tables S16). On dendrites, VGluT1 densities remained reduced in ccl2flox/flox (−32.5%) and MNΔccl2 (−26.7%) (p = 0.0003 and 0.0028) but recovered in MGΔccl2 mice, which were no different from control (p = 0.2365). Thus, MGΔccl2 mice showed a 27.3% larger VGluT1 density on dendrites compared with ccl2flox/flox mice 12 weeks after injury (p = 0.055). Of all VGluT1 synapses in controls, 75.3% ± 3.0% (±SD) are on dendrites, and this proportion did not change in ccl2flox/flox, MNΔccl2, or MGΔccl2 mice (one-way ANOVA, F(3,20) = 0.3485, p = 0.7906), highlighting the significance of recovered VGluT1 input on dendrites.
Figure 6. Genetic ablation of ccl2 in microglia preserves VGluT1 synapses on motoneuron dendrites but does not recover stretch reflexes.

(A) Specific ccl2 deletion from motoneurons (MNΔccl2) or microglia (MGΔccl2) 14 days after cut-repair. White arrowheads, motoneurons; yellow arrowheads, microglia.
(B) VGluT1 synapses mapped on motoneuron reconstructions in uninjured controls and ccl2lfox/flox, MNΔccl2, and MGΔccl2 mice 12 weeks post-injury.
(C) VGluT1 density on soma (left) and dendrites (right) (six to eight motoneurons per animal estimate). Cell bodies show a significant loss compared with control in all nerve-injured animals. MGΔccl2 mice VGluT1 density on dendrites is not significantly different from that of control.
(D and E) ccl2 removal from motoneurons or microglia does not recover reflex force or EMG responses to (D) ramps or (E) vibration stretches. Twelve weeks of regeneration.
(F and G) Percentage of responding trials and integrated force after (F) ramp or (G) vibration stretches. These data demonstrate no reflex recovery in MNΔccl2 or MGΔccl2 mice.
(H) Spindles in MGΔccl2 mouse muscles ipsilateral and contralateral to the injury. Neurofilament heavy chain (NFH; green) labels motor and sensory axons. Sensory axons make annulospiral endings in control spindles (left) and are disorganized in reinnervated spindles (right). Motor axons end in α-bungarotoxin (α-BTx)-labeled intrafusal NMJs (white) in control and reinnervated spindles. DAPI labels intrafusal fiber nuclei.
In all graphs, each marker is one animal estimate, animals’ averages are represented by a bar or square, and error bars are ±SD. *p < 0.05, **p < 0.01, ***p < 0.001. Unless otherwise indicated, statistical comparisons are one-way ANOVA followed by post hoc pairwise comparisons using Bonferroni’s corrected t test.
Figure 7. Effect of removing ccl2 from motoneurons or microglia on peripheral immune cell entry.

(A) Peripheral immune cells analyzed in quadruple-immunofluorescence sections: FB LG motoneurons (FB; blue), ccl2::mCherry (magenta), microglia (Iba1; green), and the CD45 leukocyte marker (white). We compared genetic controls (ccl2flox/flox) with animals in which ccl2 was removed in cholinergic neurons (ChATcre/cre mice: MNΔccl2) or after tamoxifen in microglia (cx3cr1creERT2/+ mice: MGΔccl2). Specific removal of ccl2 from motoneurons or microglia is shown in the middle images. Presence of CD45 cells in all types of mice is shown in the left images.
(B) A local cluster of CD45 cells close to axotomized FB motoneurons. Different images show FB motoneurons (blue), CD45 cells (white), and Iba1 microglia (green) in different combinations. Some CD45 cells are in contact with motoneurons (yellow arrow), others associate with microglia. The circle (dashed line) indicates a local accumulation of CD45 cells coincident with a region containing microglia at high density.
(C) Number of CD45high cells per ventral horn. Each dot is the estimate from a single animal. Average and ±SD are illustrated. Two-way ANOVA for injured side and genetics (statistics in the Table S17) showed significant differences according to spinal cord side (ipsilateral or contralateral to the injury), but not according to cell-type-specific ccl2 deletions. *p < 0.05, **p < 0.01, ***p < 0.001 in pairwise Bonferroni’s corrected t test.
Next, we tested whether recovered VGluT1 synapses in MGΔccl2 mice could elicit stretch reflexes. We did not find any recovery of reflex force or EMG 12 weeks post-injury after muscle stretches (100 trials per animal) elicited by ramp-hold-release (1 g background force, 5 mm/s stretch) or tendon vibration at 100 Hz (80 μm) (Figures 6D–6G). We confirmed that muscle spindles were reinnervated by sensory afferents and motor axons in MGΔccl2 mice 12 weeks after injury (Figure 6H). In summary, removing CCL2 from microglia recovered Ia synapses on dendrites, but these did not recover stretch reflexes.
Deletion of ccl2 from microglia or motoneurons does not decrease infiltration of peripheral immune cells
To confirm whether the structural preservation of Ia afferent/VGluT1 synapses was correlated with a change in infiltration of peripheral immune cells, we examined immune cells with the leukocyte marker CD45. We compared the number of CD45 cells in the side ipsilateral to the injury with the contralateral (control) uninjured side after unilateral sciatic nerve cut and repair injury in MNΔccl2 mice (n = 5), MGΔccl2 mice (n = 4), and ccl2flx/flx genetic controls (n = 4 mice). We selected for analysis peak infiltration at 14 days post-injury. The sections were also immunolabeled with antibodies against the reporter (mCherry) and Iba1 (Figure 7A). Weak CD45 immunoreactivity was observed in dorsal and ventral horn activated Iba1+ microglia, but the strongest immunolabeled cells (CD45high) were rounded cells that infiltrated the spinal cord preferentially in ventral horn regions containing injured motoneurons and activated microglia (Figure 7B). CD45high cell numbers significantly increased in the side ipsilateral to the injury in all mice but did not differ in number according to genetic model (MNΔccl2, MGΔccl2, and ccl2flx/flx; two-way ANOVA, injury side p < 0.0001, genetic model p = 0.6116) (Figure 7C; Table S17). Correspondingly, post hoc tests between injured and non-injured sides were all significant (p < 0.0001, Bonferroni’s t test). Thus, anatomical preservation of Ia synapses in mice with microglia-deleted ccl2 is not correlated with absence of peripheral immune cells.
The data also suggest that cell infiltration into the spinal cord is independent of motoneuron or microglia CCL2. Although we cannot rule out the possibility that motoneuron- and microglia-derived CCL2 compensate for each other, the results agree with a recent communication reaching similar conclusions in DRGs and peripheral nerves after similar injuries.24 The main difference we observed in mice with ccl2 removed from microglia was less variation in average number of cells per section. Coefficient of variations were relatively low for MGΔccl2 mice (19.6%) and larger for MNΔccl2 (47.5%) and ccl2flx/flx (73.0%) mice. This corresponded to the presence of large clusters of infiltrating CD45 cells (one example in Figure 7B) in some sections. These were absent in MGΔccl2 mice. CD45 cell clusters always occurred in areas with high densities of CCL2-expressing microglia (Figure 7B), and they are suggestive of microbreaches in the spinal cord-blood barrier (SCBB). CCL2 increases blood-brain barrier (BBB) permeability26; thus, high concentrations of microglia-derived CCL2 might locally disrupt the SCBB, facilitating CD45 cell invasion.
DISCUSSION
This study shows that the Ia-motoneuron monosynaptic stretch reflex is a simple and favorable model to study microglia-dependent circuit plasticity according to nerve injury severity and microglia activation profiles. Our findings show that neural circuit disorganization and its reversibility depends on a time-dependent switch in the microglia phenotype resulting in the emergence of pro-inflammatory ccl2-expressing microglia. This in turn depends on the duration of CSF1 expression in injured motoneurons, which might be regulated by differences in the muscle reinnervation time course after different injuries. This mechanism can thus explain differences in Ia synaptic plasticity after nerve crush or cut injuries and between distal (close to muscle target) and more proximal nerve injuries, each requiring different regeneration times.8
CSF1 is a multifunctional protein that mediates the proliferation and survival of macrophages and microglia.27,28 Motoneuron CSF1 is necessary for ventral horn microglia proliferation, activation, and chemotaxis toward motoneurons axotomized after nerve injury.8 We propose that CSF1 from injured motoneurons first induces microgliosis and chemotaxis and later a pro-inflammatory phenotype. One explanation for this progression is the accumulation with time of CSF1-induced tyrobp (DNAX-activating protein of 12 kDa, or DAP12).29 DAP12 is a convergent hub for several signaling cascades, and CSF1-mediated DAP12 upregulation could be permissive of further signals modifying microglia polarity. Spinal microglia polarization after CSF1 upregulation is also reported in multiple sclerosis30–32 and in the dorsal horn after CSF1 release from pain sensory afferents in hyperalgesia and chronic pain models.29,33,34 Evolving microglia phenotype in response to continuous high local CSF1 is also supported in neurodegenerative models in which blocking CSF1 action during the induction phase or preceding pathology stops microglia activation and is frequently detrimental, but blocking CSF1 later in the disease and preventing microglia polarization is usually beneficial.27 This mechanism provides a framework to explain microglia-mediated synaptic plasticity graded to injury severity coupled to the timing/efficiency of recovery/regeneration. CSF1 downregulation and microgliosis termination seem to be regulated by muscle reinnervation in our mouse model, but alternative mechanisms could reduce microglia activation at longer time courses when muscle reinnervation is prevented.35
CCL2 and synapse elimination
Microglial synapse elimination during development and neuropathology commonly depends on complement signaling through the C1q classical pathway.36 Indeed, Ia-synapse pruning during normal circuit refinement in neonates and excessive Ia-synapse loss in spinal muscular atrophy are both dependent on C1q.37 We propose that a mechanism based on CCL2 critically mediates Ia-synapse deletions after injury in adults. CCL2-CCR2 mechanisms have widespread and heterogeneous effects frequently associated with CCR2+ immune cell tissue infiltration, but a role in synapse elimination has been rarely proposed. It, however, resembles microglial synaptic pruning in cortical neurons after recurrent viral infections modeling Rasmussen encephalitis.38 Whereas in this model, CCL2 upregulation occurs in neurons and targets microglia, in our model microglia are a critical source of CCL2, and we found no evidence of CCR2 in resident microglia. The only microglia-like cells expressing CCR2 are infiltrates from blood, but their low numbers make them unlikely candidates for Ia input deletion. Their exact contribution awaits future experiments using specific cell deletions. Alternative CCR2+ cell infiltrates after nerve cut injury are T cells.8 In the Rasmussen encephalitis model, CCL2 Neuronal expression is down-stream of T cell interferon. However, a contribution of T cells in our model is at this point speculative, because CD45 cell entry (including T cells) was similar in animals that lost or recovered Ia synapses.
If infiltrating immune cells are not responsible, then which spinal cord cells respond to microglia-derived CCL2? Two possible candidates are endothelial cells and astrocytes, which are both responsible for changes in BBB permeability after CCR2 activation.26 Astrocytes also have the capability of inducing synaptic plasticity around axotomized motoneurons.39 They can engulf synapses through the phagocytic receptor MERTK (Mer proto-oncogene tyrosine kinase) in concert with microglia40 and induce synaptic plasticity in response to CCL2.41 It is possible that the ccr2::RFP allele is too weak in these cells for detection, and future studies should explore more thoroughly astrocyte involvement in Ia-synapse plasticity and in response to different levels of CCL2. Finally, microglia themselves could be sensitive to CCL2 through an autocrine mechanism, despite little evidence that they express CCR2 after nerve injury. Alternative non-CCR2-dependent pathways for CCL2 action have been reported.42,43
Functional recovery
Our findings in mice confirm previous conclusions in cats and rats demonstrating lack of stretch reflexes following regeneration from peripheral nerve transection14,16,17 and their recovery after nerve crush.12,15 Surprisingly, we also found that recovery of Ia-motoneuron synapses after manipulating microglia is not sufficient for restoring stretch reflexes. A recent study used minocycline to preserve Ia synapses on rat motoneurons after nerve cut-repair and also failed to recover stretch reflexes.9 One possible explanation is lack of specificity in muscle reinnervation. For example, centrally connected Ia-motoneuron pairs might be rerouted to different muscles. Alternatively, muscle spindles could be reinnervated by afferents not projecting to LIX (i.e., Ib afferents). In both cases the spinal reflex circuit will become disconnected by mismatches between central spinal connectivity and peripheral muscle/receptor innervation following regeneration. This mismatch is not expected after nerve crush with very specific nerve regeneration and targeting.19 These explanations, however, seem insufficient, because we failed to observe any trace of activity despite simultaneously stretching close synergists and sometimes using stimuli that co-activate Ia and Ib afferents. A more likely interpretation is that recovered Ia synapses remained subthreshold and unable to recruit motoneurons to elicit stretch reflexes. Although the exact silencing mechanism is yet unknown, the results emphasize that structural preservation of synapses is only one step toward recovery of function.
Limitations of the study
There are two principal limitations to this study. First, the exact target of microglia-derived CCL2 needs to be elucidated. We suggest several possibilities that need experimental testing. Second, the reason for the lack of functional recovery despite significant synaptic rescue remains intriguing. One factor is the lack of recovery of synapses on the cell body and whether these might have an unexpected overwhelming influence during the stretch reflex. The lack of rescue of somatic synapses when interfering with CCL2-CCR2 mechanisms or blocking function of activated microglia with minocycline9 is interesting, given that they are rescued when microglia activation is fully abolished by interfering with motoneuron CSF1.8 Future studies should analyze stretch reflexes with this genetic intervention to test the functional impact of Ia-synapse recovery on cell bodies. Alternatively, the long period of Ia-afferent silence during regeneration may degrade synaptic organization and needs to be overcome to preserve synaptic function.
STAR★METHODS
RESOURCE AVAILABILITY
Lead contact
Further information and requests for any resource, reagent, or original data files should be directed to the corresponding author, Francisco J. Alvarez (francisco.j.alvarez@emory.edu).
Materials availability
This study did not generate any non-commercial reagents.
Data and code availability
All data reported in this study were included in one Excel file available at https://doi.org/10.15139/S3/E8O8PB
No original code has been generated in this study.
Any additional information necessary for further or reanalysis in this paper is available from the lead contact upon written request.
EXPERIMENTAL MODEL AND STUDY PARTICIPANT DETAILS
All experiments were performed at Emory University or Georgia Institute of Technology and approved by the Institutional Animal Care and Use Committee (IACUC) prior to any data collection. Furthermore, these experiments adhere to NIH and ARRIVE guidelines. Mice were housed 2-5 per cage until survival surgeries were conducted at which point mice were single housed to decrease the probability of suture removal by cage companions. Animal facilities maintained constant temperature and regular light cycles (12h light/dark). Food and water were both provided ad libitum. All animal experiments were performed in adult C57Blk/6J/6N background mice. All transgenic lines, unless otherwise stated, were purchased from the Jackson Laboratory (Bar Harbor, ME) and colonies were generated and maintained at Emory University and Georgia Institute of Technology.
All animals used were between 2 and 3 months of age (18-25 gr) during initial surgeries. We use animals of both sexes. Lack of sex differences on the parameters we measured are reported in Figures S1 and S5.
METHOD DETAILS
Motoneuron labeling and peripheral nerve injury procedures
For all survival surgeries, mice were anesthetized via isoflurane inhalation (induction: 4%; maintenance: 2%, both in 100% O2) and injected with buprenorphine subcutaneously (0.05 mg/kg). The left lateral gastrocnemius (LG) muscle was exposed and injected with 5 μl of 1.5% Fast Blue or 5 μl of 0.1% Cholera Toxin subunit B conjugated to an Alexa Fluor 555 (CTB-555) using a 10 μl Hamilton syringe. The skin was realigned and closed using absorbable sutures.
Approximately one-week later the mice underwent either a sham surgery, a sciatic nerve cut-repair, a nerve crush injury or a nerve cut and ligation. Again, mice were isoflurane anesthetized, the left hindlimb was secured and a medial incision parallel to the femur bone was made. The biceps femoris was retracted exposing the sciatic nerve at mid-thigh level. Surrounding connective tissue was blunt dissected to isolate the sciatic nerve. For nerve cut-repair injuries, the sciatic was partially lifted and a small silicone rubber scaffolding matrix (approximately 1 mm2, Dow Corning #501-1) placed under the nerve. The nerve was then completely transected using fine surgical scissors, realigned, and glued back together using a fibrin glue mixture composed of thrombin, fibronectin, and fibrinogen (full details of this procedure have been published in Akhter et al., 2019b). For nerve cut-ligation injuries and 5-0 non-absorbable suture was tied at the end of the proximal stump to prevent regeneration. For nerve crush injuries, the nerve was exposed in the same manner and compressed with a pair of #5 jewelers’ forceps for 10 seconds. For sham surgeries the sciatic nerve was similarly exposed and isolated but then not cut or crushed and placed back. Dissected muscle and skin were sutured back together.
Tissue collection
Perfusion-fixed muscles and spinal cords were collected from mice at different time points after injury as well as from sham control animals. Mice were deeply anesthetized with Euthasol (≥ 100 mg/kg) and transcardially perfused with 10-15 ml of heparin vascular rinse followed by 25 ml of 4% paraformaldehyde (PFA) prepared in 0.1M phosphate buffer (PB, pH=7.4). The LG muscles were collected from the left and right hindlimbs, and the spinal cord was dissected out of the spinal column. All tissues were placed in 4% PFA overnight at 4°C unless otherwise reported. Tissue samples were then rinsed with PB and cryo-protected in 30% sucrose at 4°C. Spinal lumbar segments 4 and 5 (L4-L5) were sectioned in a sliding freezing microtome and processed free floating (50 μm thick). Muscle tissue was sectioned using a cryostat (30 μm thick) and collected for further processing directly onto charged microscopy slides (Frost®Plus Fisherbrand, Fisher Scientific).
General histological and immunohistochemistry procedures
Spinal cord sections were first washed in 0.01M PBS with 0.3% Triton X-100 (PBS-Tx) and incubated in 10% normal donkey serum (NDS) blocking agent for one hour at room temperature. Then the sections were incubated in primary antibody cocktails with different combinations of the following: chicken anti-EGFP (Serotec, 1:1000), rabbit anti-DsRed (Takara, 1:1000), guinea pig anti-VGluT1 (Synaptic Systems, 1:1000), goat anti-CSF1 (R&D Systems, 1:500), mouse anti-ATF3 (Novus Biological, 1:100), mouse anti-Ki-67 (BD Biosciences, 1:100), rabbit anti-Iba1 (Wako Chemicals, 1:500), mouse anti-NeuN (EMD Millipore, 1:100) and goat anti-ChAT (ED Millipore, 1:100). Sections were gently agitated at room temperature for approximately 24 hours. Primary antibodies were aspirated off and after the sections were washed in PBS-Tx, a cocktail of secondary antibodies was used for immunofluorescence detection. We use species-specific secondary antibodies with minimal cross-reactivity among species. All secondaries were raised in donkey (Jackson ImmunoResearch Labs, West Grove, PA) and diluted to 1:100 in PBS-Tx. We used a combination of FITC (anti-chicken IgY), Cy3 or FITC (anti-rabbit IgG), DyLight 647 (anti-guinea pig IgG), FITC or Cy5 (anti-goat IgG), and Cy5 (anti-mouse IgG) for recognition of corresponding primary antibodies. After a two-hour incubation, the sections were washed in PBS, mounted on slides, and cover-slipped with Vectashield (Vector Labs). All fluorescent proteins were amplified in all analyses: EGFP was amplified using chicken anti-EGFP antibodies (Serotec); tdTomato, mCherry and RFP using anti-DsRed antibodies (Takara).
Slides with muscle sections were processed for immunohistochemistry in a hydration incubation chamber. A primary antibody cocktail containing chicken anti-neurofilament H (NFH, Aves Labs, 1:1000) and guinea pig anti-vesicular acetylcholine transporter (VAChT) (Synaptic Systems, 1:100) were used to identify the motor axons and presynaptic terminals. Guinea pig anti-vesicular glutamate transporter antibodies (VGluT1) (Synaptic Systems, 1:500) was usued to located msucle spindles. Bungarotoxin-555 (Btx-555, 1:100) was used to reveal the post-synaptic nicotinic receptor filed. Antibody reactive sites were revealed with FITC (anti-Chicken IgY) and Alexa Fluor 647 (anti-guinea pig IgG).
Immunolabelings to detect specific CD markers (CD45 and CD3ε) are described below; for these markers postfixation times were reduced to 4 hours, instead than overnight.
All microscopy images were obtained with confocal microscopy using an Olympus FV1000 laser scanning confocal systems.
Densitometric analysis of VGluT1 and GFP immunofluorescence
Six spinal cord sections containing FB motoneurons were randomly selected from each mouse (n=4 mice per condition) and imaged at low magnification (10x1, N.A. 0.40, z-step=1.5 μm; Figures 1B, 1C, and S4). We analyzed n=3-4 cx3cr1-GFP::ccr2-RFP mice at 5 time points after nerve crush or cut-repair injuries (3, 7, 14, 21 and 8 weeks after the nerve surgery) and in sham controls (total 43 mice). The sections were immunolabelled for EGFP (FITC), RFP (Cy3) and VGluT1 (Cy5). Both the ipsilateral and contralateral sides were imaged using identical imaging parameters. Image files were uploaded to ImageJ and a region of interest (ROI) with a diameter of 270 μm was placed around the motor pool containing LG FB labeled motoneurons ipsilateral side to the injury. Another ROI of identical dimensions was placed in the corresponding contralateral side of the spinal cord. VGluT1 and GFP fluorescence integrated pixel densities were measured and compared as a ratio between the control and injury sides.
Motoneuron imaging and reconstructions
Fast Blue labeled motoneurons in spinal cord ventral horns of L4/L5 segments were imaged at high magnification (60x1, N.A. 1.4, z-step=0.5 μm) and uploaded to Imaris and Neurolucida for 3D reconstruction (6-8 motoneurons per animal, n = 4-6 mice per condition). Both the soma and proximal dendrites were manually reconstructed through each optical plane and a synaptic marker was placed at the corresponding location of a VGluT1 immunoreactive bouton. Whenever confirmation was needed for individual VGluT1 contacts we used the 3D rendering capabilities of Imaris. We analyzed VGluT1 somatic and dendritic densities and conducted Sholl analyses along dendritic trees in these motoneuron tracings (Figures 1D–1G). Previously, we confirmed “VGluT1 contacts” were in >95% of cases actual synapses containing the presynaptic active zone organizer bassoon opposite to the motoneuron somatic or dendritic surface.8
ATF3 quantification
Ten spinal cord sections containing CTB-555 labeled motoneurons and immunolabeled for ATF3 (in FITC) or NeuN (in Cy5) were randomly selected from either cut-repair or crush mice 7 days post-injury. Tissue sections containing labeled motoneurons were imaged at 20x (z-step=1 μm). Sections were uploaded to Neurolucida and the total number of NeuN+ cells that co-expressed ATF3 and the total number retrogradely labeled motoneurons that also expressed ATF3 were quantified and compared between the two injury models (Figures 1H–1J).
Quantification of microglia numbers
Randomly selected L4-L5 sections, containing FB+ motoneurons, were fully imaged (dorsal and ventral horn) and tiled using the FV1000 Olympus confocal microscope (20x, z-step: 1.0 μm) (n=4 mice per time point, 6 sections per animal). Image files were then uploaded to the Imaris 3D neural analysis software (Bitplane, Zurich, Switzerland). We used the “spot function” algorithm to automatically detect and count the cell bodies of cx3cr1-GFP cells in the ventral and dorsal horn of the spinal cord (both grey and white matter) in 50 μm thick tissue sections. The ventral horn was defined by an arbitrary horizontal line drawn directly above the central canal. We quantified six spinal cord sections from four animals at each survival time after a nerve crush or cut-repair injury (Figures 2A and 2B). We do not report the dorsal horn data in this report.
EdU injections and Ki67 labeling
After sciatic nerve cut-repair or crush, mice were injected with 5-ethynyl-2’-deoxyuridine (EdU, i.p., 50 mg/kg) at either 2 days post-injury and perfused 24 hours later (three-day time point) or injected at 6 days post-injury and perfused 24 hours later (seven day time point). We used the Click-iT EdU Alexa Fluor 647 imaging kit for EdU detection (ThermoFisher Scientific) and processed the spinal cord sections according to the manufacturers protocol. Following the Click-iT reaction, spinal cord sections were incubated in a cocktail of primary antibodies consisting of chicken anti-EGFP (Sterotec, 1:1000) and mouse anti-Ki67 (BD Biosciences, 1:100) then revealed with FITC (anti-chicken IgY) and Cy3 (anti-mouse IgG). Ipsilateral L4-L5 spinal cord sections were selected at random and imaged using automatic tiling (20x, z-step=1 μm). Each image consisted of six tiles stitched together using the Olympus multiarea time lapse module. These image files were uploaded to Neurolucida for analysis. We manually counted the number of cx3cr1+/EdU+ and cx3cr1+/Ki67+ cells in the ventral horn of the spinal cord in six sections per animal and obtained an average for each animal for statistical analyses (Figures 2C–2F).
CSF1 analyses
Spinal cord sections from animals with crush or cut-repair injuries 14 days prior and containing FB-labeled LG motoneurons were immunoatsined for Iba1 (FITC) and CSF1 (Cy3) and imaged at 20x magnification (z step=2.0 μm). Images were uploaded to Image ProPlus (7.0.0) for analysis. All FB-labeled LG motoneurons that contained a nucleus within the 50 μm thick sections were included in the analysis. Tracing was performed at the z-plane that corresponded with each FB motoneuron midplane. This was determined by the point with the largest nucleolus cross-section. The cell body of each cell was traced with the nucleus excluded. For each tracing a corresponding background trace of equal area to the motoneuron was taken. Fluorescent intensity of CSF1 was measured as the average pixel density throughout the traced area. Background-corrected CSF1 intensity values of all motoneurons per animal were compiled and evaluated. If the fluorescent intensity for a given motoneurons was determined to be statistically greater than the background (average +2 standard deviations), it was considered CSF1+. We calculated the percentage of positive motoneurons in each animal and the average fluorescence pixel density of those motoneurons that were detected as positive (Figures 3G–3K).
ccr2::RFP and CD45 cell quantification
We manually counted cells using an epifluorescence widefield Olympus BX52 microscope (20x, N.A. 0.75). Cell numbers are represented as the average number of cells per 50 μm thick section in the ventral horn. All sections in the lumbar 4/5 region containing at least one FB motoneurons were quantified in both analyses.
For analyzing the time course of ccr2-RFP cell entry (Figures 4A–4E) we used n = 3–4 cx3cr1-GFP::ccr2-RFP mice and 5 time points after nerve crush or cut-repair injuries (3, 7, 14, 21 and 8 weeks after the nerve surgery) and in sham controls (total 43 mice). These are the same cx3cr1-GFP::ccr2-RFP sections and images (20X) used for VGluT1 and microglia quantification (see above). We counted both RFP+ cells and GFP+/RFP+ cells and estimated the number of cells per section in the ventral horn, dorsal horn, ventral white matter and dorsal white mater. We report only the most relevant results in the ventral horn (ventral horn plus ventral white matter) in sections with FB labeled motoneurons. We counted 15 to 37 sections per animal, average 27.6 ±4.4 (±SD).
For CD45 quantification after ccl2 deletions (Figure 7) we used the ccl2-mCherryflx mouse model crossed or not to ChAT-Cre or cx3cr1-CreERT2 mice: n=4 ccl2flx/flx mice, n=5 MNΔccl2 mice and n=4 MGΔccl2 mice. In these analyses we compared the numbers of cells found ipsilateral and contralateral to the injury side. We counted all sections with FB labeled motoneurons in the ipsilateral side: 14 to 25 sections per animal; average 20.3 ±2.9 (±SD). The sections were triple immunostained for Iba1 (Cy5) dsRed (mCherry) (Cy3) and CD45 (Alexa 647). Rat anti-CD45 was revealed with a donkey biotinylated anti-rat IgG followed by streptavidin conjugated to Alexa 647. Iba1 and DsRed immunoreactivities were revealed with fluorescently conjugated secondary antibodies. (all secondaries and streptavidin were diluted 1:100).
Lineage labeling of ccr2-expressing cells
For lineage labeling we used ccr2-CreERT2 mice (n=2) crossed to the Ai9 tdTomato reporter line. Cre recombination was induced by tamoxifen injections 24 hours before the injury (5 mg per mouse dissolved and injected in peanut oil). This dose should label all CCR2 expressing myeloid cells for approximately four weeks according to the known turnover of these cells in the blood. Qualitative analysis of spinal cord infiltration were done 14 days after cut-repair nerve injuries for comparison with the ccr2-RFP model. The animals were previously injected with Fast Blue in the LG muscle as in other experiments. For this analysis the sections were co-labeled with the primary antibodies against DsRed (in Cy3 for tdTomato signal amplification), Iba1 (FITC) and the T-cell marker CD3ε (Cy5). We performed qualitative examination of confocal images (10x, 20X and 60x) of tdTomato cell labeling and colocalization with CD3ε or Iba1 (Figures 4F–4J).
ccl2 expression and cell-specific removal
We used transgenic mice expressing mCherry under the ccl2 promoter that were injected with Fast Blue in the LG one week before different types of nerve surgeries.
First, (Figures 5A–5H) we compared ccl2 expression at 3 and 14 days after a nerve cut-repair and a nerve crush. Two mice were analyzed per condition (n=8 mice in total). Spinal cord sections from these animals were triple immunostained with antibodies against ChAT (FITC), DsRed (Cy3 to detect mCherry) and Iba1 (Cy5). Confocal images (20x, z-step=1 μm) were collected from lumbar 4 and 5 spinal cord sections to estimate the number of ChAT+ motoneurons in LIX, the percentage of FB motoneurons expressing ccl2::mCherry, the number of Iba1 microglia with ccl2::mCherry and the percentage of Iba1 microglia with ccl2:mCherry. All quantifications were performed by manually constructing cell plots in Neurolucida. To constrain the microglia count to those activated around axotomized motoneurons we counted only microglia in a circular region of interest (800 in perimeter, ~250 μm in diameter) centered around FB motoneurons. We counted six sections per animal.
Second, we estimated a time course of ccl2:mCherry expression after nerve cut-ligation injuries to examine ccl2 in the absence of regeneration (Figures 5I and 5J). We analyzed 5 different post-injury times (8-10 sections per animal, n=2 mice per time point per injury). In this series, serial sections were immunolabeled for ChAT or Iba1 using in both cases FITC-conjugated secondary antibodies, while mCherry was amplified in Cy3 with DsRed antibodies. Confocal images (20x, z-step=1 μm) were collected from lumbar 4 and 5 spinal cord sections and the numbers of ChAT motoneurons and the percent of FB labeled motoneurons that co-expressed mCherry in the section was quantified. In addition, we calculated the numbers and percent of Iba1 microglia that also expressed mCherry within the ROI centered around the FB motoneurons. We quantified all 5 time points post-injury as well as at baseline (control).
To examine cell-specific removal of ccl2, the ccl2-mCherry construct flanked by loxp sites was removed in a Cre dependent manner. Mice were crossed with cx3cr1CreER/+ mice (MGΔccl2) or ChATCre/+ mice (MNΔccl2) to selectively delete ccl2 from microglia or motoneurons. Cre expression was inducible in MGΔccl2 mice. Therefore, 2 doses of 5 mg of tamoxifen were given: 1 dose seven days prior to the nerve injury experiment and a second dose on the day of injury. Peanut oil was used as vehicle. These animals were then immunostained for Iba1 (Cy5) and we examined whether ccl2::mCherry (amplified in Cy3 with DsRed antibodies) was adequately removed from either FB motoneurons or from Iba1+ microglia. Two series of these experiments were performed. One relates to the animals used in physiological experiments and that were perfused at the end of the experiments to confirm genetic deletions. (Figure 6A). The second was to examine CD45 entry following ccl2 deletion specifically from motoneurons or microglia (Figure 7).
Neuromuscular junction analysis
Cryostat muscle sections from a series of animals undergoing a sham injury (control n=4), nerve crush (n=20, 4 per post-injury date) or nerve cut-repair (n=20, 4 per post-injury date) were immunostained with antibodies against NFH (FITC) and VAChT (Cy5). The neuromuscular junctions (NMJs) were labeled with Alexa-555 coupled alpha-bungarotoxin (BTx-555). We imaged with confocal microscopy (FV1000 Olympus) 3-4 NMJ fields per animal (20x, z-step=1.0 μm) and fifty randomly (and blindly) selected NMJs were analyzed per animal. Each image was uploaded to ImageJ and each labeled neuromuscular junction was scored on two criteria: 1) NFH presence on the NMJ (yes or no) and 2) VAChT immunoreactivity on the NMJ (fully, partially, or none). A percent was generated per total 50 NMJs based on these criteria. We report data in which NFH and VAChT were observed both on top of the αBTx labeled NMJ. NFH labels the motor axon, VAChT labels the accumulation of synaptic vesicles in the motor end-plate (Figures S2A–S2D).
Specificity of motoneuron muscle reinnervation
The LG muscle was first injected with FB to pre-label the motoneurons in this pool. Approximately one week later the sciatic nerve was either cut and repaired or crushed. Mice were allowed to survive eight weeks at which point the LG muscle was injected with CTB-555 (details of tracer injections are described above). Mice survived another week before being perfused. We analyzed 3 control naïve animals, 4 animals after nerve crush, and 4 animals after nerve crush-repair. The entire lumbar segment was serially sectioned, collected serially on slides, and stained with a fluorescent Nissl (Neurotrace-640/660, ThermoFisher) overnight at room temperature in a hydration chamber. Slides were washed in 0.01M PBS (no triton) and cover-slipped with Vectashield. The slides were analyzed on an Olympus BX-53 wide-field fluorescence microscope coupled to the Neurolucida imaging system. A contour was drawn around each individual spinal cord section containing labeled motoneurons. Then, FB+ only, CTB-555+ only, or dual labeled motoneurons were plotted for each section. When all sections had been analyzed each contour was uploaded in the Neurolucida and aligned to create a 3D representation of the rostro-caudal distribution of all FB motoneurons throughout the lumbar region. We also calculated and compared the percent of dual labeled motoneurons in each condition. Motoneuron cell counts were performed in four animals in each condition. We obtained x,y coordinates for each plotted motoneuron, being 0,0 the x,y coordinates at the top of the central canal. These data were uploaded to a custom Matlab script and using the kde2d function (Matlab File Exchange) we generated density map plots to compare distribution of motoneurons before and after injuries. The nine contours represent the 5th percentile (innermost contour) to the 95th percentile (outermost) of all motoneurons (Figures S2E–S2L).
Muscle reflex testing
For these experiments we used first a cohort of wild-type mice after sham (n=4), nerve crush (n=5 mice) or cut-repair injuries (n=5) (Figures 2A–2E) and a second cohort with only cut-repair injuries for the genotypes ccl2flx/flx (n=4), MGΔccl2 (n=6) or MNΔccl2 (n=6) compared to naïve animals (n=5) (Figures 6D–6G). Following survival times after nerve surgeries that allow for nerve regeneration and reinnervation of muscle fibers and muscle spindles (3 months or more), all the mice were deeply anesthetized with isoflurane (induction: 5% in 100% O2) to ensure absence of withdrawal reflex to noxious stimuli. Once a surgical plane of anesthesia is obtained, a small vertical incision was performed along the skin overlying the trachea to expose both carotid arteries. Both arteries are then tied to ensure blood restriction during decerebration44. Throughout the surgical procedure and data collection oxygen saturation, heart rate, and core body temperature were continuously monitored. Normal values are maintained by adjusting isoflurane concentrations/flow and subcutaneous delivery of Lactated Ringer solution. Body temperature is maintained at 37°C through a rectal probe connected a to a servocontrolled heating platform.
A rostro-caudal incision was made from the hip to the knee to expose the triceps surae and surrounding tissue. Nerves supplying antagonists and hip flexors were crushed with a pair of #5 forceps and the Achilles tendon was tied with a small 3-0 silk suture and detached from the calcaneus. Another vertical incision was made along the spinal column to expose the lumbar vertebrae. Surrounding muscle and connective tissue were cleared from the bone to ensure proper spinal clamp placement. The mouse was then transferred and secured in a stereotaxic device (Narishige, ST-7M-HT) with the snout placed in an isoflurane anesthetic mask (Narishige, GM-4) and ear bars inserted to stabilize the head (Narishige, EB-3B). A heated platform was also used to support the mouse body and provide additional warmth (Stoelting, cat#51625-1). For further stabilization during stretches, the lumbar vertebrae (Narishige, STS-A) were secured to the frame and the knee and the foot fixed with custom made clamps. The tendon was then tied to a servomotor lever to control length and force (Aurora Scientific, Ontario, Canada, model #300CLR) and two fine electromyographic (EMG) wires (California Fine Wire Company, Grover Beach, CA) were inserted in the belly of the LG muscle. EMG wires were connected to custom made preamplifiers and differential amplifiers and recorded at 20 Khz sampling rates. EMGs, force signals and stretch and electrical stimuli are all recorded and controlled in CED Power 1401 and Spike2 software (Cambridge Electronic Design, Cambridge, England). All neural and muscle tissue is bathed in warm mineral oil through the duration of the experiment which lasted up to 4 hours.
Data collection began 30 mins after decerebration and removal of isoflurane anesthesia (100% O2 continued to be delivered through the face mask for the duration of the experiment). We used two different stretch paradigms: a stretch-hold-release consists of stretches that raise at constant velocity (5mm/s) from L0 to 0.5 mm, held for one second, and then released at the same velocity. Background force ranged from 1g to 5g for ramp stretches and total trials ranged from 33 – 100 stretches. The second paradigm was a one second pulse of 100 Hz vibration stimulus and 80 mm amplitude conducted at 1g of background force to selectively activate Ia muscle spindle afferents. The number of vibration trials ranged from 21 – 100 stretches. Determination of reflexor non-reflexive test is gaited on the presence of a corresponding EMG signal in response to muscle stretch. Passive force was first measured under isoflurane prior to decerebration and again at the end of the experiment post tibial nerve crush.
We quantified the percentage of trials resulting in an EMG signal in either stretch stimulation paradigm. Only trials that produce an EMG signal are used for a final force analysis. Force measurements were obtained by subtracting the peak force obtained during reflexive trials by the average passive force of the muscle to stretch, measured in the absence of reflex activity under isoflurane anesthesia or at the end of the experiment after cutting the nerve. We obtained one individual reflex force average value per animals. EMG analysis is obtained by rectifying and integrating the signal to obtain the EMG envelope. In this trace we measure duration and average area. We also obtain average values per animal. All the animals were perfusion fixed at the end of the experiment to confirm genetic deletions of ccl2 in motoneurons or microglia (see above)
Dorsal root recordings
Dorsal root recordings were collected from wild-type control and cut-repair mice approximately 3-4 months post-injury. The initial experimental configuration is similar to that for muscle reflex testing with an isoflurane anaesthetized mouse being placed in a stereotaxic frame with spinal clamps. The triceps surae muscle group was freed, and the corresponding tendons were tied to a servomotor (Aurora Scientific, Ontario, Canada, model #300CLR). A laminectomy was performed over the 4/5 lumbar region of the spinal cord. Skin flaps were made using string ties and pre-warmed mineral oil was placed over the tissue. Following a lumbar laminectomy the dura matter was removed to expose the entry zone of the dorsal roots. Two silver wire hook electrodes were placed under the L5 root which contain afferents corresponding to the triceps surae pool. Wire electrodes were connected to a custom-made differential amplifier to record extracellular signals. Independently, two ball electrodes were placed on the sciatic nerve (proximal to the injury site in the cut-repair mice) and a 2 Hz electrical stimulus was applied at threshold using an isolated pulse stimulator (A.M.P.I., Jerusalem, Israel, Master8) to elicit a muscle contraction.
To recruit muscle afferents and generate a dorsal root potential a series of ramp stretches were conducted at constant velocity (5 mm/s) from L0 to 0.5 mm, held for one second, and then released at the same velocity (ramp-hold-release). A one second vibration stimulus of 40 μm amplitude, conducted at 10 g of background force, was applied to selectively activate Ia muscle spindle afferents and generate a dorsal volley. Dorsal potentials and force records were recorded using a CED Power 1401 and Spike2 software (Cambridge Electronic Design, Cambridge, England). Electrical signals from ramp stretches were averaged, DC removed, rectified, and smoothed. Traces from vibration and muscle twitches were averaged across trials and presented as raw data (Figures S2A).
Figure composition
All figures were composed using CorelDraw (ver.24) and graphs were obtained in Prism (GraphPad, ver 9). Microscopy images were all obtained in an Olympus FV1000 confocal microscope and processed with Image-Pro Plus (Media Cybernetics) for optimization of image brightness and contrast. Frequently we used a high gaussian filter to increase sharpness. Electromyography and force traces were imported from Spike 2 into CorelDraw and the points changed from square to circular.
QUANTIFICATION AND STATISTICAL ANALYSIS
Male and female animals were included in the experiments. Lack of sex differences are shown in Figures S1 and S5, therefore we pooled data from both sexes for all analyses. In all analyses, except otherwise noted, n refer to animals in which repeated observations were used to obtain an average that was compared across time, injury type or sham control and genetic manipulation or genetic controls. All statistical comparisons were performed in Prism (GraphPad vs 9.4.0). data samples were first evaluated for Normality using a Shapiro-Wilk test. When normality criteria were fulfilled, we performed group comparisons with either One or Two-way ANOVAS followed by post-hoc Bonferroni corrected t-tests. When comparing two groups we use standard two-way t-tests. When normality failed, we used a Kruskal-Wallis ANOVA on ranks followed by pair wise post-hoc comparisons using Dunn’s test. In all cases we also estimated using Prism effect sizes of the mean average differences between samples and the 95% confidence interval (CI). Average differences (effect size) and CI were transformed to percentage of change for reporting in statistical tables and in the text. We reported effect sizes only for samples where statistically significant differences were detected. For hypothesis testing (ANOVAs, t-tests) we considered significant p<0.005. Effect sizes were considered significant if 95% CI intervals do not cross 0 (i.e., no difference). All statistical parameters for all comparisons presented in figures are reported in corresponding statistical tables in supplementary information.
Supplementary Material
KEY RESOURCES TABLE
| REAGENT or RESOURCE | SOURCE | IDENTIFIER |
|---|---|---|
| Antibodies | ||
| Chicken anti-GFP | Serotec | Cat# GFP-1020; RRID#: AB_100000240 |
| Rabbit anti-DsRed | Takara | Cat# 632496; RRID#: AB_10013483 |
| Guinea Pig anti-Vesicular Glutamate Transporter 1 |
Synaptic Systems | Cat#135304; RRID#: AB_887878 |
| Mouse anti-NeuN Clone 1B7 |
EMD Millipore | Cat# MAB377; RRID#: AB_2298772 |
| Mouse anti-Ki-67 Clone B56 |
BD Biosciences | Cat# 550609; RRID#: AB_393778 |
| Chicken anti-Neurofilament Heavy Chain | Aves Labs | Cat# NFH; RRID#: AB_2313552 |
| Guinea Pig anti-Vesicular Acetylcholine Transporter |
Synaptic Systems | Cat# 139105; RRID#: AB_10893979 |
| Goat anti-Choline acetyltransferase | EMD Millipore | Cat#AB144P; RRID#: AB_2079751 |
| Mouse anti-ATF3 Clone CL1685 |
Novus Biologicals | Cat# NBP2-34489; Clone CL1685 |
| Goat anti-CSF1 | R&D Systems | Cat# AF416; RRID#: AB_355351 |
| Rabbit anti-Iba1 | Wako Chemical | Cat#019-19741; RRID#AB_839504 |
| Chicken anti-Iba1 | Synaptic Systems | Cat#234 009; RRID#AB_2891282 |
| Rat anti-CD45 | Pharmigen | Cat#553078 |
| Syrian hamster anti-CD3ε Clone 500A2 | BD Biosciences | Cat#553238; RRID#AB_394727 |
| Donkey anti-chicken-FITC | Jackson ImmunoResearch Labs | Cat# 703-095-155; RRID#: AB_2340356 |
| Donkey anti-rabbit-CY3 | Jackson ImmunoResearch Labs | Cat# 711-005-152; RRID#: AB_2340585 |
| Donkey anti-guinea pig- Dylight 647 | Jackson ImmunoResearch Labs | Cat# 706-605-148; RRID#: AB_2340476 |
| Donkey anti-goat-Cy5 | Jackson ImmunoResearch Labs | Cat# 705-175-147; RRID#: AB_2340415 |
| Donkey anti-mouse-Cy5 | Jackson ImmunoResearch Labs | Cat# 715-175-150; RRID#: AB_2340819 |
| Donkey anti-rat-Biotin-SP | Jackson ImmunoResearch Labs | Cat# 712-065-153; RRID#: AB_2315779 |
| Goat anti-Syrian Hamster-Alexa 647 | Jackson ImmunoResearch Labs | Cat# 107-605-142; RRID: AB_2337482 |
| Cy5 Streptavidin | Jackson ImmunoResearch Labs | Cat# 016-170-084; RRID#: AB_2337245 |
| Chemicals, peptides, and recombinant proteins | ||
| Bungarotoxin – Alexa Fluor 555 | ThermoFisher Scientific | Cat# B35451; RRID#: AB_2617152 |
| NeuroTrace 640/660 | ThermoFisher Scientific | Cat#N21483 RRID:AB_2572212 |
| Fast Blue | Polysciences | Cat# 17740 |
| Cholera Toxin Subunit B – Alexa Fluor 555 | ThermoFisher Scientific | Cat# C34776 |
| Tamoxifen | Millipore Sigma | Cat# T5648 |
| Critical commercial assays | ||
| Click-iT EdU Alexa Fluor 647 | ThermoFisher Scientific | Cat# C10340 |
| Experimental models: Organisms/strains | ||
| cx3cr1-GFP | The Jackson Laboratory | RRID:IMSR_JAX:005582 |
| ccr2-RFP | The Jackson Laboratory | RRID:IMSR_JAX:017586 |
| ccr2-CreERT2 | Gift from Dr. Burkhard Becher | https://doi.org/10.1016/j.immuni.2015.08.010 |
| ChAT-IRES-Cre | The Jackson Laboratory | RRID:IMSR_JAX:031661 |
| cx3cr1-CreERT2 | The Jackson Laboratory | RRID:IMSR_JAX:020940 |
| ccl2-RFP-Flx | The Jackson Laboratory | RRID:IMSR_JAX:016849 |
| Ai9 R26 Isl-TdTomato | The Jackson Laboratory | RRID:IMSR_JAX:007909 |
| VGluT1-Cre | The Jackson Laboratory | RRID:IMSR JAX:037512 |
| Software and algorithms | ||
| Neurolucida | MicroBrightField | V12.0 |
| Imaris | Bitplane | V7.2.2 |
| ImageJ | NIH | RRID:SCR_003070 |
| ImagePro | Molecular Devices | 7.0.0 |
| Prism | GraphPad | V9.4.0 |
| SigmaPlot | Systat | 12 |
| Spike2 | Cambridge Electronic Design | V5.13 |
| RStudio | Posit | V1.3.1073 |
Highlights.
Preservation of the stretch-reflex circuit after nerve injuries varies with injury severity
More severe injuries activate microglia for longer because of continuous CSF1 availability
Extended microglia activation induces CCL2 expression and pro-inflammatory properties
CCL2 deletion from microglia rescues stretch-reflex synapses but not their function
ACKNOWLEDGMENTS
This work was supported by NIH-NINDS grant R01NS057228 (F.J.A.) and Ruth L. Kirschstein NRSA fellowships F31NS095528, F32NS112556, and K99NS126576 (T.M.R.). During this study S.F. was a Summer Undergraduate Research Experience (SURE) fellow supported by Emory University College. Some of the imaging analysis packages used in this study were made available by the Integrated Cellular Imaging Core (Emory) supported in part by NINDS Core facilities grant P30NS055077.
Footnotes
SUPPLEMENTAL INFORMATION
Supplemental information can be found online at https://doi.org/10.1016/j.celrep.2024.113776.
DECLARATION OF INTERESTS
The authors have no competing interests.
REFERENCES
- 1.Bisicchia E, Sasso V, Molinari M, and Viscomi MT (2019). Plasticityof microglia in remote regions after focal brain injury. Semin. Cell Dev. Biol 94, 104–111. 10.1016/j.semcdb.2019.01.011. [DOI] [PubMed] [Google Scholar]
- 2.Whitelaw BS, Stoessel MB, and Majewska AK (2023). Movers and shakers: Microglial dynamics and modulation of neural networks. Glia 71, 1575–1591. 10.1002/glia.24323. [DOI] [PMC free article] [PubMed] [Google Scholar]
- 3.Wilton DK, Dissing-Olesen L, and Stevens B (2019). Neuron-Glia Signaling in Synapse Elimination. Annu. Rev. Neurosci 42, 107–127. 10.1146/annurev-neuro-070918-050306. [DOI] [PubMed] [Google Scholar]
- 4.Costigan M, Scholz J, and Woolf CJ (2009). Neuropathic pain: a maladaptive response of the nervous system to damage. Annu. Rev. Neurosci 32, 1–32. 10.1146/annurev.neuro.051508.135531. [DOI] [PMC free article] [PubMed] [Google Scholar]
- 5.Kuner R, and Flor H (2016). Structural plasticity and reorganisation in chronic pain. Nat. Rev. Neurosci 18, 20–30. 10.1038/nrn.2016.162. [DOI] [PubMed] [Google Scholar]
- 6.Yousefpour N, Locke S, Deamond H, Wang C, Marques L, St-Louis M, Ouellette J, Khoutorsky A, De Koninck Y, and Ribeiro-da-Silva A (2023). Time-dependent and selective microglia-mediated removal of spinal synapses in neuropathic pain. Cell Rep. 42, 112010. 10.1016/j.celrep.2023.112010. [DOI] [PubMed] [Google Scholar]
- 7.Alvarez FJ, Rotterman TM, Akhter ET, Lane AR, English AW, and Cope TC (2020). Synaptic Plasticity on Motoneurons After Axotomy: A Necessary Change in Paradigm. Front. Mol. Neurosci 13, 68. 10.3389/fnmol.2020.00068. [DOI] [PMC free article] [PubMed] [Google Scholar]
- 8.Rotterman TM, Akhter ET, Lane AR, MacPherson KP, Garcia VV, Tansey MG, and Alvarez FJ (2019). Spinal Motor Circuit Synaptic Plasticity after Peripheral Nerve Injury Depends on Microglia Activation and a CCR2 Mechanism. J. Neurosci 39, 3412–3433. 10.1523/JNEUROSCI.2945-17.2019. [DOI] [PMC free article] [PubMed] [Google Scholar]
- 9.Rotterman TM, García VV, Housley SN, Nardelli P, Sierra R, Fix CE, and Cope TC (2023). Structural preservation does not ensure function at sensory Ia - motoneuron synapses following peripheral nerve injury and repair. J. Neurosci 43, 4390–4404. 10.1523/JNEUROSCI.0103-23.2023. [DOI] [PMC free article] [PubMed] [Google Scholar]
- 10.Alvarez FJ, Titus-Mitchell HE, Bullinger KL, Kraszpulski M, Nardelli P, and Cope TC (2011). Permanent central synaptic disconnection of proprioceptors after nerve injury and regeneration. I. Loss of VGLUT1/IA synapses on motoneurons. J. Neurophysiol 106, 2450–2470. 10.1152/jn.01095.2010. [DOI] [PMC free article] [PubMed] [Google Scholar]
- 11.Rotterman TM, Nardelli P, Cope TC, and Alvarez FJ (2014). Normal distribution of VGLUT1 synapses on spinal motoneuron dendrites and their reorganization after nerve injury. J. Neurosci 34, 3475–3492. 10.1523/JNEUROSCI.4768-13.2014. [DOI] [PMC free article] [PubMed] [Google Scholar]
- 12.Schultz AJ, Rotterman TM, Dwarakanath A, and Alvarez FJ (2017). VGLUT1 synapses and P-boutons on regenerating motoneurons after nerve crush. J. Comp. Neurol 525, 2876–2889. 10.1002/cne.24244. [DOI] [PMC free article] [PubMed] [Google Scholar]
- 13.Barker D, and Young JZ (1947). Recovery of stretch reflexes after nerve injury. Lancet 1, 704–707. [DOI] [PubMed] [Google Scholar]
- 14.Cope TC, Bonasera SJ, and Nichols TR (1994). Reinnervated muscles fail to produce stretch reflexes. J. Neurophysiol 71, 817–820. 10.1152/jn.1994.71.2.817. [DOI] [PubMed] [Google Scholar]
- 15.Prather JF, Nardelli P, Nakanishi ST, Ross KT, Nichols TR, Pinter MJ, and Cope TC (2011). Recovery of proprioceptive feedback from nerve crush. J. Physiol 589, 4935–4947. 10.1113/jphysiol.2011.210518. [DOI] [PMC free article] [PubMed] [Google Scholar]
- 16.Bullinger KL, Nardelli P, Pinter MJ, Alvarez FJ, and Cope TC (2011). Permanent central synaptic disconnection of proprioceptors after nerve injury and regeneration. II. Loss of functional connectivity with motoneurons. J. Neurophysiol 106, 2471–2485. 10.1152/jn.01097.2010. [DOI] [PMC free article] [PubMed] [Google Scholar]
- 17.Haftel VK, Bichler EK, Wang QB, Prather JF, Pinter MJ, and Cope TC (2005). Central suppression of regenerated proprioceptive afferents. J. Neurosci 25, 4733–4742. 10.1523/JNEUROSCI.4895-04.2005. [DOI] [PMC free article] [PubMed] [Google Scholar]
- 18.Brushart TM, and Mesulam MM (1980). Alteration in connections between muscle and anterior horn motoneurons after peripheral nerve repair. Science 208, 603–605. 10.1126/science.7367884. [DOI] [PubMed] [Google Scholar]
- 19.Nguyen QT, Sanes JR, and Lichtman JW (2002). Pre-existing pathways promote precise projection patterns. Nat. Neurosci 5, 861–867. 10.1038/nn905. [DOI] [PubMed] [Google Scholar]
- 20.Valero-Cabré A, Tsironis K, Skouras E, Navarro X, and Neiss WF (2004). Peripheral and spinal motor reorganization after nerve injury and repair. J. Neurotrauma 21, 95–108. 10.1089/089771504772695986. [DOI] [PubMed] [Google Scholar]
- 21.Campos RMP, Barbosa-Silva MC, and Ribeiro-Resende VT (2021). Comparison of effect of crush or transection peripheral nerve lesion on lumbar spinal cord synaptic plasticity and microglial dynamics. IBRO Neurosci. Rep 10, 225–235. 10.1016/j.ibneur.2021.05.002. [DOI] [PMC free article] [PubMed] [Google Scholar]
- 22.Pottorf TS, Rotterman TM, McCallum WM, Haley-Johnson ZA, and Alvarez FJ (2022). The Role of Microglia in Neuroinflammation of the Spinal Cord after Peripheral Nerve Injury. Cells 11. 10.3390/cells11132083. [DOI] [PMC free article] [PubMed] [Google Scholar]
- 23.Zigmond RE, and Echevarria FD (2019). Macrophage biology in the peripheral nervous system after injury. Prog. Neurobiol 173, 102–121. 10.1016/j.pneurobio.2018.12.001. [DOI] [PMC free article] [PubMed] [Google Scholar]
- 24.Talsma AD, Niemi JP, Pachter JS, and Zigmond RE (2022). The primary macrophage chemokine, CCL2, is not necessary after a peripheral nerve injury for macrophage recruitment and activation or for conditioning lesion enhanced peripheral regeneration. J. Neuroinflammation 19, 179. 10.1186/s12974-022-02497-9. [DOI] [PMC free article] [PubMed] [Google Scholar]
- 25.Shi C, Hohl TM, Leiner I, Equinda MJ, Fan X, and Pamer EG (2011). Ly6G+ neutrophils are dispensable for defense against systemic Listeria monocytogenes infection. J. Immunol 187, 5293–5298. 10.4049/jimmunol.1101721. [DOI] [PMC free article] [PubMed] [Google Scholar]
- 26.Yao Y, and Tsirka SE (2014). Monocyte chemoattractant protein-1 and the blood-brain barrier. Cell. Mol. Life Sci 71, 683–697. 10.1007/s00018-013-1459-1. [DOI] [PMC free article] [PubMed] [Google Scholar]
- 27.Chitu V, Biundo F, and Stanley ER (2021). Colony stimulating factors in the nervous system. Semin. Immunol 54, 101511. 10.1016/j.smim.2021.101511. [DOI] [PMC free article] [PubMed] [Google Scholar]
- 28.Stanley ER, and Chitu V (2014). CSF-1 receptor signaling in myeloid cells. Cold Spring Harb. Perspect. Biol 6, a021857. 10.1101/cshperspect.a021857. [DOI] [PMC free article] [PubMed] [Google Scholar]
- 29.Guan Z, Kuhn JA, Wang X, Colquitt B, Solorzano C, Vaman S, Guan AK, Evans-Reinsch Z, Braz J, Devor M, et al. (2016). Injured sensory neuron-derived CSF1 induces microglial proliferation and DAP12-dependent pain. Nat. Neurosci 19, 94–101. 10.1038/nn.4189. [DOI] [PMC free article] [PubMed] [Google Scholar]
- 30.Gushchina S, Pryce G, Yip PK, Wu D, Pallier P, Giovannoni G, Baker D, and Bo X (2018). Increased expression of colony-stimulating factor-1 in mouse spinal cord with experimental autoimmune encephalomyelitis correlates with microglial activation and neuronal loss. Glia 66, 2108–2125. 10.1002/glia.23464. [DOI] [PubMed] [Google Scholar]
- 31.Nissen JC, Thompson KK, West BL, and Tsirka SE (2018). Csf1R inhibition attenuates experimental autoimmune encephalomyelitis and promotes recovery. Exp. Neurol 307, 24–36. 10.1016/j.expneurol.2018.05.021. [DOI] [PMC free article] [PubMed] [Google Scholar]
- 32.Wlodarczyk A, Benmamar-Badel A, Cédile O, Jensen KN, Kramer I, Elsborg NB, and Owens T (2018). CSF1R Stimulation Promotes Increased Neuroprotection by CD11c+ Microglia in EAE. Front. Cell. Neurosci 12, 523. 10.3389/fncel.2018.00523. [DOI] [PMC free article] [PubMed] [Google Scholar]
- 33.Okubo M, Yamanaka H, Kobayashi K, Dai Y, Kanda H, Yagi H, and Noguchi K (2016). Macrophage-Colony Stimulating Factor Derived from Injured Primary Afferent Induces Proliferation of Spinal Microglia and Neuropathic Pain in Rats. PLoS One 11, e0153375. 10.1371/journal.pone.0153375. [DOI] [PMC free article] [PubMed] [Google Scholar]
- 34.Yu X, Basbaum A, and Guan Z (2021). Contribution of colony-stimulating factor 1 to neuropathic pain. Pain Rep. 6, e883. 10.1097/PR9.0000000000000883. [DOI] [PMC free article] [PubMed] [Google Scholar]
- 35.Akhter ET, Griffith RW, English AW, and Alvarez FJ (2019). Removal of the Potassium Chloride Co-Transporter from the Somatodendritic Membrane of Axotomized Motoneurons Is Independent of BDNF/TrkB Signaling But Is Controlled by Neuromuscular Innervation. eNeuro 6, ENEURO.0172, 19.2019.2019. 10.1523/ENEURO.0172-19. [DOI] [PMC free article] [PubMed] [Google Scholar]
- 36.Stephan AH, Barres BA, and Stevens B (2012). The complement system: an unexpected role in synaptic pruning during development and disease. Annu. Rev. Neurosci 35, 369–389. 10.1146/annurev-neuro-061010-113810. [DOI] [PubMed] [Google Scholar]
- 37.Vukojicic A, Delestrée N, Fletcher EV, Pagiazitis JG, Sankaranarayanan S, Yednock TA, Barres BA, and Mentis GZ (2019). The Classical Complement Pathway Mediates Microglia-Dependent Remodeling of Spinal Motor Circuits during Development and in SMA. Cell Rep. 29, 3087–3100.e7. 10.1016/j.celrep.2019.11.013. [DOI] [PMC free article] [PubMed] [Google Scholar]
- 38.Di Liberto G, Pantelyushin S, Kreutzfeldt M, Page N, Musardo S, Coras R, Steinbach K, Vincenti I, Klimek B, Lingner T, et al. (2018). Neurons under T Cell Attack Coordinate Phagocyte-Mediated Synaptic Stripping. Cell 175, 458–471.e19. 10.1016/j.cell.2018.07.049. [DOI] [PubMed] [Google Scholar]
- 39.Tyzack GE, Sitnikov S, Barson D, Adams-Carr KL, Lau NK, Kwok JC, Zhao C, Franklin RJM, Karadottir RT, Fawcett JW, and Lakatos A (2014). Astrocyte response to motor neuron injury promotes structural synaptic plasticity via STAT3-regulated TSP-1 expression. Nat. Commun 5, 4294. 10.1038/ncomms5294. [DOI] [PMC free article] [PubMed] [Google Scholar]
- 40.Chung WS, Clarke LE, Wang GX, Stafford BK, Sher A, Chakraborty C, Joung J, Foo LC, Thompson A, Chen C, et al. (2013). Astrocytes mediate synapse elimination through MEGF10 and MERTK pathways. Nature 504, 394–400. 10.1038/nature12776. [DOI] [PMC free article] [PubMed] [Google Scholar]
- 41.Nelson TE, Hao C, Manos J, Ransohoff RM, and Gruol DL (2011). Altered hippocampal synaptic transmission in transgenic mice with astrocyte-targeted enhanced CCL2 expression. Brain Behav. Immun 25 (Suppl 1), S106–S119. 10.1016/j.bbi.2011.02.013. [DOI] [PMC free article] [PubMed] [Google Scholar]
- 42.Cai K, Qi D, Hou X, Wang O, Chen J, Deng B, Qian L, Liu X, and Le Y (2011). MCP-1 upregulates amylin expression in murine pancreatic beta cells through ERK/JNK-AP1 and NF-kappaB related signaling pathways independent of CCR2. PLoS One 6, e19559. 10.1371/journal.pone.0019559. [DOI] [PMC free article] [PubMed] [Google Scholar]
- 43.Jablonski CL, Leonard C, Salo P, and Krawetz RJ (2019). CCL2 But Not CCR2 Is Required for Spontaneous Articular Cartilage Regeneration Post-Injury. J. Orthop. Res 37, 2561–2574. 10.1002/jor.24444. [DOI] [PubMed] [Google Scholar]
- 44.Meehan CF, Mayr KA, Manuel M, Nakanishi ST, and Whelan PJ (2017). Decerebrate mouse model for studies of the spinal cord circuits. Nat. Protoc 12, 732–747. 10.1038/nprot.2017.001. [DOI] [PMC free article] [PubMed] [Google Scholar]
Associated Data
This section collects any data citations, data availability statements, or supplementary materials included in this article.
Supplementary Materials
Data Availability Statement
All data reported in this study were included in one Excel file available at https://doi.org/10.15139/S3/E8O8PB
No original code has been generated in this study.
Any additional information necessary for further or reanalysis in this paper is available from the lead contact upon written request.