

Abstract
The rapid progress in nanopore sensing has sparked interest in protein sequencing. Despite recent notable advancements in amino acid recognition using nanopores, chemical modifications usually employed in this process still need further refinements. One of the challenges is to enhance chemical specificity to avoid downstream misidentification of amino acids. By employing adamantane to label proteinogenic amino acids, we developed an approach to fingerprint individual amino acids using the wild-type α-hemolysin nanopore. The unique structure of adamantane-labeled amino acids (ALAAs) improved the spatial resolution, resulting in distinctive current signals. Various nanopore parameters were explored using a machine-learning algorithm and achieved a validation accuracy of 81.3 % for distinguishing nine selected amino acids. Our results not only advance the effort in single-molecule protein characterization using nanopore, but also offer a potential platform for studying intrinsic and variant structures of individual molecules.
Keywords: Amino acid, α-hemolysin nanopore, Adamantane derivatization, Signal distribution
Graphical Abstract

De novo protein sequencing is crucial for understanding the diverse functions of proteins resulting from their highly variable amino acid (AA) sequences in all living systems.1-3 Compared to traditional methods like Edman degradation and mass spectrometry, which require larger amount of protein and have limited sensitivity,3,4 the nanopore technology presents a promising alternative.5-8 Nanopore-based analytical techniques allow for high-throughput single-molecule observation and direct identification of analytes via ionic or transverse tunneling current measurements.9-11 Over the past decade, nanopore sequencing of deoxyribonucleic acid (DNA) and ribonucleic acid (RNA) has become a mainstay of biomedical research and has led to substantial improvements in accuracy, read length, and throughput.4 These rapid advances have motivated attempts to realize nanopore sequencing of peptides in a similar manner.12-14 In the past few years, there has been a concerted effort to improve the spatial resolution,15,16 where innovations are necessary to generate and capture distinctively featured current signals for all of the 20 different AAs constructing a given protein.17,18
Biological nanopores are promising for identifying single AAs due to their nano-confined spaces and customizable sensing interfaces,19 which enable high spatiotemporal resolution and ultimate sensitivity for proteome analysis.20-24 Especially, the inherent reproducibility of biological nanopore allows precise engineering of the internal pore structure to discriminate the miniscule differences between AAs (i.e., volume differences as small as 0.001 nm3).21,23,25 For instance, full discrimination of all 20 proteinogenic AAs was recently realized by using a biological MspA nanopore containing a sole nickel-nitrilotriacetic acid (Ni-NTA) adapter at its pore constriction and machine learning assisted data analysis.17
In addition to geometry modification of the nanopore constriction, which demands precise control at specific sites of protein, another viable approach involves introducing functional groups to modify the AAs being analyzed. For example, fingerprinting schemes utilizing polypeptides have been developed to identify different AAs.26 Oukhaled et al. demonstrated that the wild-type aerolysin nanopore could discriminate the size of short, uniformly charged homopeptides mixed in a solution, achieving single AA resolution in length.27 Additionally, they outlined an approach for electrically identifying the 20 proteinogenic AAs attached to a short polycationic carrier,28 which represents a significant step toward single-molecule protein sequencing with nanopore technology. Most recently, Wu et al. discovered that any AAs in a particular position of a FGGCD8⊂CB[7] peptide probe could be determined via current blockage during translocation of the peptide through α-hemolysin (α-HL) nanopore, and short peptides sequencing based on the combination of enzymatic cleavage and host-guest interaction was achieved.18
Above recent advances have suggested that chemical alterations to the AA structure could result in a distinct nanopore ionic current signal, which can even be measured by commercially available wild-type α-HL nanopore, greatly benefiting the popularization and wide adoption of nanopore-based protein sequencing. Given this, there’s a pressing need to innovate straightforward and effective chemical modification techniques. In our previous research,29,30 we showed N-terminal derivatization of AAs using aromatic tag like 2,3-naphthalenedicarboxaldehyde (NDA) and 2-naphthylisothiocyanate (NITC), can enhance the distinguishability of different AAs with the α-HL nanopore. However, some derivatives form benzoisoindolone structures with complex spatial conformations in nanopore, leading to broad current blockade distributions and reduced discriminatory power.
To address above issues, we hypothesize that using more stable, rigid structured derivatization reagents could narrow the signal distribution of AA derivatives, thereby improving signal-to-noise ratio and spatial resolution for nanopore-based AA identification. Here, we utilized adamantane, a stable C10H16 isomer and diamondoid unit, as a novel modifier for AA derivatization. By attaching 1-adamantyl isocyanate (ADIC) to nine selected AAs via a simple and efficient reaction, we achieved improved differentiation resolution. This was determined by machine-learning assisted analysis of the ionic current's temporal pattern, blockade, capture rate, and fluctuation. Moreover, the enhancement in resolution afforded us a glimpse into the conformational changes in AA derivatives in the nanopore, a perspective not previously reported.
To modify proteinogenic AAs with adamantane, we utilized ADIC containing an isocyanate group (─N═C═O) as the primary reagent. The ─N═C═O group in isocyanates is highly unsaturated, exhibiting marked chemical reactivity to allow ADIC to effectively react with the amine group in AAs as a universal modification strategy.31,32 The modification process as outlined in the synthetic route (Figure 1a) is straightforward, efficient, performed under mildly basic buffer conditions, and the crude products could be readily purified by recrystallization.
Figure 1. Preparation and characterization of ADIC labeled AAs (ALAAs).
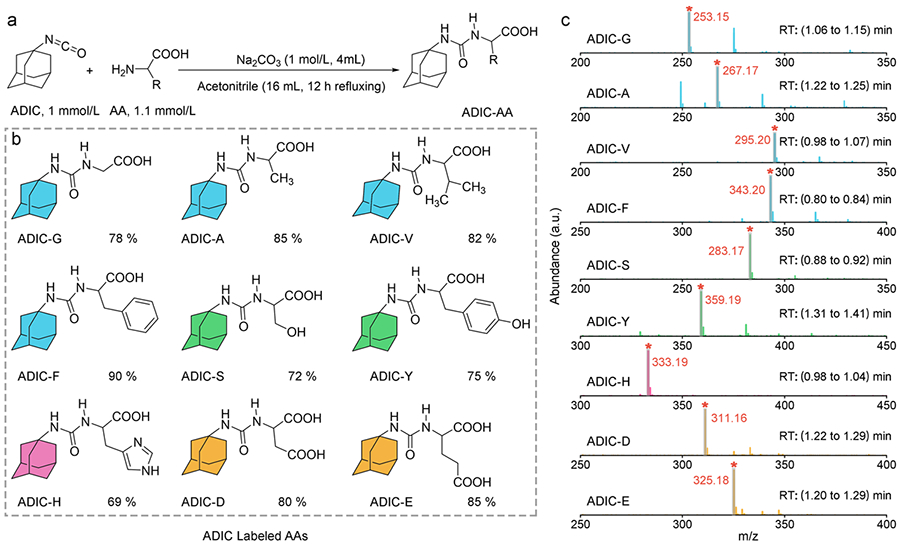
a. Synthetic route of ALAAs. The AAs and ADIC were reacted in the mixed solvent of acetonitrile/water at 90 °C under basic condition for 12 hours. b. Chemical structures and yield (%) of nine randomly selected ALAAs, the colors represent different properties of AAs: non-polar (cyan: G, A, V, and F), polar (green: S and Y), positive charged (pink: H), and negative charged (yellow: D and E). c. High-resolution mass spectra (HRMS) of ALAAs within the corresponding retention time (RT). The gray shadow and red asterisk highlight the representative peak of [M+H] + ion for each ALAA in methanol.
In our proof-of-concept approach, nine target AAs were randomly selected from each of the three classes for modification with adamantane (Figure 1b), including non-polar AAs: Glycine (Gly, G), Alanine (Ala, A), Valine (Val, V), and Phenylalanine (Phe, F); polar AAs: Serine (Ser, S) and Tyrosine (Tyr, Y); and charged AAs: Histidine (His, H), Glutamic Acid (Glu, E), Aspartic Acid (Asp, D). This selection represents the full spectrum of AAs, allowing for a thorough evaluation of the current derivatization method. The molecular structures of all ALAAs with yields varying from 69 % to 90 % shown in Figure 1b were characterized and confirmed by 1H and 13C nuclear magnetic resonance spectroscopy (Supporting Information, Figure S5-S22). High-resolution mass spectrometry (HRMS) results showed the presence of [M+H]+ ion peak for each individual product, attesting to the successful ADIC labeling for each AA (Figure 1c).
Next, the purified ALAAs were introduced to the nanopore sensing system for analysis. Figure 2a illustrates a schematic of the orientation of the α-HL nanopore setup. Upon applying a positive bias (100 mV) to the trans side of the nanopore, electrophoretic force promotes the movement of ions from cis to trans to establish a steady ionic current of mean value I0 through the nanopore in the absence of analytes. The addition of ALAAs on the cis side of the bilayer induced transient blockages of the ionic current under the concentration diffusion and the electroosmotic flow generated by electrophoretic force,17 followed by complete translocation of analyte or analyte-pore interaction, which generated a distinct square-shaped pulse. Each transient event of the ionic current corresponds to the presence of an individual ALAA in the nanopore and is characterized by the current blockade (ΔI/I0), dwell time (τ), and the standard deviation of ionic current blockade fluctuations (σb) (Figure 2b).
Figure 2. Single-molecule sensing of ADIC-labeled AAs (ALAAs) with α-HL nanopore.

a. Schematic of nine ALAAs in three classes and the experimental setup (not to scale). Two chambers containing 3 mol/L KCl, 10 mM Tris at pH 8.0 were separated by a lipid membrane, into which an α-HL nanopore was inserted. The electrically grounded chamber is defined as cis, and the opposing chamber is defined as trans. An external voltage is applied to the trans side of the lipid bilayer, while the cis side is grounded. b. Representative fragment of ionic current recording after ALAA derivatives were added to the cis side. The current blockade that represents the capture of single molecules and their translocation through the nanopore is defined as ΔI/I0 (ΔI: I-I0; I: the average current blockade measured with the molecules inside the pore; I0: the average baseline current in absence of analytes). Dwell time (τ) represents the effective interaction time between nanopore and single molecule analyte. The noise amplitude (σb) is defined as the standard deviation of the ionic current blockade fluctuations. c. Scatter plot showing the average baseline current (I0) through an open pore for each experiment. Each data point represents I0 for an individual run; the lines represent the mean baseline currents calculated from all runs for each experiment (see SI for details). d. Mean capture rate and its standard deviation (error bar) produced by each of the nine different ALAAs in all runs. e. Representative sensing events generated by translocation of ALAAs (top) and two-dimensional contour scatter plots of blockade (ΔI/I0) versus dwell time (τ) from the signals (bottom, left), together with the corresponding frequency distributions of blockade (bottom, center) and dwell time (bottom, right). In the contour plots, darker colors represent greater densities in the corresponding statistics. In the histograms, black lines indicate Gaussian fit, either unimodal or bimodal, as detailed in the Supporting Information. For ease of reference and comparison, we categorized the peaks into two populations based on their mean values: “subpopulation I”, at the high blockade level region, and “subpopulation II”, at the low blockade level region. As a blockade subpopulation evolves, dwell time likewise exhibits concomitant distribution variations, notably with one subpopulation markedly disparate from the other, which underscores the non-random nature of these subpopulations’ emergence.
The capability of ADIC derivatization for distinguishing different AAs under identical experimental conditions was then assessed. Figure 2c displays the baseline current (I0) distribution of each experiment under 100 mV. Each experimental run exhibited a similar average baseline, allowing direct comparison between results obtained from different ALAAs studied. The open current at around 279 pA is consistent with our prior research.33,34 The capture rates of different ALAAs were characterized by statistical analysis of inter-event times known as the mean time delays between two successive events,35 and then calculated and fitted based on the exponential distribution governing translocation signal statistics.36 Ion distributions inside the confines of the nanopore rearranged to accommodate the type and orientation of the translocating ALAAs, producing visible differences in capture rates, from (0.37±0.1) Hz (ADIC-G) to (23.90±1.0) Hz (ADIC-E) (Figure 2d and Figure S1). Our previous studies showed that unmodified AAs yield minimal traces in the α-HL nanopore due to mismatched sizes.29 Above results indicate that the ADIC modification amplified the distinctive characteristics of individual AAs, facilitating their analysis and differentiation using α-HL nanopore.
When the ALAAs were captured by the α-HL nanopore, the resulting single-molecule signals exhibited various distinctive features (Figure 2e, top). We first characterized these nanopore events by extracting the current blockade and dwell time. The 2D scatter density plot in Figure 2e (bottom, left) was generated from the calculated ΔI/I0 and log(τ) values. The histograms of the frequency distribution (Figure 2e, bottom, center and right) show the variation in frequency for ΔI/I0 and τ, respectively. For all the ALAAs, dwell times exhibit similar distributions to those of NITC and NDA derivatives reported previously,30 and the corresponding Gaussian fitted values are shown in Table S1. Compared with the dwell time, the distribution of the blockade is widely variable among the ALAAs. Notably, ADIC-A, -V, -D, and -S, exhibit higher values and narrower distributions of ΔI/I0 (0.903±0.033, 0.923±0.022, 0.883±0.053, and 0.917±0.016) in contrast to ADIC-G (0.595±0.105). While these first five ALAAs display a single peak in blockade distribution, the remaining four (ADIC-H, -Y, -E, and -F) demonstrate two distinct peaks (Table S1, Subpopulations I&II) that are narrow, well-separated with clear boundaries, and do not indicate peak broadening due to the generation of subpopulations. These subpopulations were ascribed to different translocation behavior or collisions of the analyte with the cis opening of the α-HL pore.22,29 Previous research indicates that the aerolysin nanopore with a narrow constriction ( ≈1.0 nm diameter) and highly charged sensing interface is more sensitive than the α-HL nanopore for narrowing analyte blockade distributions and enhancing sensitivity.37,38 Above results from our strategy show that the sensitivity of α-HL can be greatly improved by specific chemical modifications to the AAs.
The primary measure used to identify AAs, and to evaluate the efficacy of the ADIC modification strategy, is the current blockade, ΔI/I0. In Figure 3a-c, left panel, the nine selected AAs were categorized into three groups based on their chemical properties: non-polar AAs (G, A, V, F), polar AAs (S and Y), and charged AAs (H, D and E). The non-polar group showed clear discrimination between ADIC-G, -A, -V, and -F, despite minor overlaps between ADIC-A and -V. In the polar group, significant overlap was observed between ADIC-S and -Y at high blockade level region, where the ΔI/I0 values were centered at 0.917±0.016 and 0.923±0.015 (Y1), respectively. However, distinct differences in blockade level and characteristics were noted between the subpopulation II of ADIC-Y, with ΔI/I0 centered at 0.319±0.068 (Y2), and the single distribution of ADIC-S. In the charged AA group, overlaps was detected between the three ALAAs at the high blocked level region, with more severe distribution overlap between ADIC- H and -E, both in the high-level and the low-level regions. Typically, dwell time aids in identification when current blockade is insufficient. But in this study, the overlapping normalized dwell time distributions (Figure S2a-c) offer limited extra insight.
Figure 3. Differentiation and conformational analysis of different ADIC-labeled AAs (ALAAs).

a-c. Superimposed histograms of ΔI/I0 (left) and blockade fluctuation σb (right) obtained from nanopore experiments performed for each of the nine ALAAs, analyzed individually and grouped according to the properties of AAs: (a) polar, (b) non-polar, and (c) charged amino acids. For each ALAA, the normalized distribution was fitted with a Gaussian equation. d. Mean relative current blockade and standard deviation produced by each ALAAs versus its spatial volume. The error bar represents standard deviation of ΔI/I0 from the Gaussian fitting. Shaded area highlights the four ALAAs (H, Y, E, and F) with two subpopulations in their blockade distributions. e. The size (length, width, and height) extracted from the corresponding space-filling structure of each ALAA versus its volume. Shaded area highlights the decrease trend of the length for ALAAs (H, Y, E, and F).
Recent studies have shown that ionic current blockade fluctuations (σb), indicating nanopore current “noise”, can distinguish analyte species differently from the traditional blockade and dwell time measurements.11,39,40 This “noise” varies with each analyte, reflecting diverse interaction dynamics in the nanopore sensing space.39,41-43 We analyzed the standard deviation of these fluctuations in individual events, presenting them as distribution histograms with Gaussian fitting (Figure 3a-c, right panel and Figure S3) for better discrimination of the ALAAs. With such additional information, all AAs in each group were successfully distinguished, despite minor overlaps of the distributions. Particularly, in the group of charged AAs, σb histograms of ADIC-E, -H, and -D can be easily differentiated with their well-separated peaks (Table S1). This parameter compensates for the blockade distribution’s limited discrimination ability and provides valuable information for enhancing the discrimination of ALAAs.
While there are overlaps in ALAA blockade distributions, their measurable differences and distinct subpopulations allow us to explore their relationship with ALAA structures and probe the mechanism underlying the blockade current. We calculated the volumes of different ALAAs from their molecular modeling structures (Figure S4) and plotted the relationship between the mean ΔI/I0 and the ALAA volume in Figure 3d. Due to the complex Brownian movement of the analytes in the work solution, it is difficult to quantitatively describe the inherent impact of translocation/collision on the subpopulation distributions. The blockade distributions of subpopulations exhibit a dependence on volume differences between the different ALAAs (Figure 3d). The mean ΔI/I0 of subpopulation I sharply increases from ≈0.6 to ≈0.9 as ALAA volume increases from 0.669 nm3 (ADIC-G) to 0.708 nm3 (ADIC-A). Interestingly, the mean ΔI/I0 value remains steady at ≈0.9, with small fluctuations, over a volume range spanning ≈0.70 nm3 to ≈0.95 nm3, where it then falls precipitously to ≈0.4 (for ADIC-F), the lowest value of the subpopulation I set, at the largest volume, 1.009 nm3. Subpopulation II first appears when the volume reaches 0.8879 nm3 (ADIC-H). Moreover, the dwell time distributions of Subpopulation II are consistently shorter than that of subpopulation I (Figure S2d), providing additional evidence that the molecular conformation within these secondary distributions represents a characteristic variation.
Compared to previous studies which demonstrated a positive correlation between the dominant blockade distribution and the volume of derivatives,30 above results indicate a different trend: an increase in volume further leads to the formation of subpopulations, exhibiting new patterns of variation. These differences might stem from the spatial orientation variations caused by changes in the derivative structures. Thus, the relationship between volume and sizes in three dimensions of each ALAA was further investigated. As shown in Figure 3e, the length, width, and height of ALAAs gradually increase with volume at the initial stage. When the volume reaches 0.8879 nm3 (ADIC-H), the length of the remaining ALAAs with higher volumes begins to decline, while the trend for width shows a more rapid rise with volume than exhibited in the lower-volume ALAAs. This turning point coincides with the point where subpopulation II emerges in blockade distributions, along with a gradual increase in mean ΔI/I0 with volume. Drawing from this result, a potential mechanistic explanation can be outlined as follows: Smaller ALAAs exhibit a singular spatial conformation within the nanopore system. As larger AAs consistently increase in size, their dimensions undergo a transition beyond a certain molecular volume, marked by shorter length and longer width and height. This leads to a new signal distribution (subpopulation II) possibly due to a different spatial orientation of ALAAs in the nanopore system. While further simulations and experiments are necessary for confirmation, the above finding offers new insights not previously reported to our knowledge. Previous studies have linked AA volume to ΔI/I0 signal changes due to molecular mass.28,44,45 However, our initial results reveal that spatial conformation of AA molecules also significantly influences nanopore blockade signals.
Finally, a machine-learning algorithm was established to automatically identify ALAAs. The overall training process includes dataset input, feature extraction, and model building (Figure 4a). All models demonstrated satisfactory validation accuracies ranging from 0.672 to 0.813, even with the inclusion of all events regardless of time length, indicating high quality of input data. Specifically, the MLP model demonstrated the highest accuracy score of 0.813 and was selected for all further investigations. The parallel coordinate plot generated by the 4D feature matrix shows that, among the four evaluated parameters, baseline demonstrated the least variability, while mean blockade, dwell time, and blockade fluctuation revealed marked differences, attributable to the diverse structures and properties of ALAAs (Figure 4b). The confusion matrix of the MLP discriminant model indicates accuracies exceeding 70 % for most ALAAs (Figure 4c). ADIC-G and -F achieved the highest accuracies, 100 % and 98.7 %, respectively, while ADIC-H had the lowest at 50.3 %.
Figure 4. Machine learning assisted AA identification.

a. The flow diagram of the training process. A total of 11874 translocation events from the nine classes of ALAAs, including ADIC-G, -A, -V, -S, -D, -H, -Y, -E, and -F, with known identities were acquired and applied as the input dataset. Four parameters, including the baseline, mean blockade (ΔI/I0), dwell time (τ), and blockade fluctuation (σb) of each event were extracted to form an event feature matrix. Results in the matrix were further randomly split into a training set (80 %) for model training and a testing set (20 %) for model validation. The classification learner toolbox of MATLAB was used to train models for classification. A set of classifiers including MLP, SVM, decision tree, random forest, and XGB boost were evaluated. The validation accuracies were evaluated by 10-fold cross-validation. The quadratic MLP model, reporting a validation accuracy of 0.813, is one of the optimum models. b. The parallel coordinate plot generated from the 4D feature matrix with four feature parameters for ALAAs events. All events were tested and recorded under identical conditions. c. The confusion matrix of AA classification generated using the MLP model.
Over the past decade, the rapid progress in nanopore sensing has sparked significant research interests in single-molecule protein sequencing.46-50 Recent identification strategy via nanopore has achieved distinct current signals for all twenty AAs,17,18 yet the development of more universally adoptable methods to enhance spatial resolution is still needed. The N-terminal amino group of AAs, with a lower pKa (≈6.0 to 8.0) and stronger affinity, provides a unique chemical site for modifications in comparison to the C-terminus. Based on this characteristic, we have proposed an advanced “N-terminus derivatization strategy” that may enhance a biological nanopore’s resolution for individual AAs.29,30 In this study, we utilized ADIC, an optimized modifier with a rigid and stress-free structure of three cyclohexane rings, to label nine representative AAs. This approach led to distinct signal characteristics of the translocation events of derivatized AAs through the α-HL nanopore, notably narrow blockade distributions. This advancement enabled us to distinguish various AAs based on nanopore signal parameters and start unraveling connections between spatial conformational changes, blockade distributions, and volumes of labeled AAs.
Compared with our previously employed modifiers (i.e., NITC and NDA), the trend of increasing volume in ADIC-labeled AAs is magnified, which provides more room for differentiating other AAs using the same method. Moreover, ADIC’s rigid and closed-ring structure not only allows for clearer observation of spatial conformational changes in labeled AAs, but also enhances the interaction between the modification group and the nanopore. Additionally, the sp3 hybridized carbon in ADIC's isocyanate group offers greater electrophilicity than the sp2 carbon in NITC, thus leads to faster and more efficient AA modification. Furthermore, using ADIC as a modifier, similar to adamantane, can provide more possibilities for improving the specificity of nanopore signals. For instance, the interaction between adamantane and CB[6] produces unique oscillation signals in the nanopore,51-53 which could lead to innovative strategies for AA discrimination and protein sequencing. Building on these advantages, a viable approach to protein sequencing could entail enzymatic digestion to peptide fragments, size-based separation of peptides, anchoring the C-terminus of a peptide on a solid phase, ADIC labeling and enzymatic cleavage of the N-terminal AAs into a mobile phase, followed by subsequent identification of each released AA via nanopore to sequentially decode the peptide’s structure. While our current capabilities in identifying post-translational modifications and analyzing complex mixed samples are limited, and there is still room for improvement in derivatization efficiency and translocation driving force, the general approach holds considerable promise. We believe that an efficient, universal derivatization strategy, enhancing the interaction between AA analytes and the lumen surface of the pore can significantly advance the practical application of nanopore sequencing. This strategy has potential implications not only in nanopore sequencing but also in other areas such as drug development, food science, and metabolism research.
Supplementary Material
ACKNOWLEDGMENTS
C. Liu acknowledges support from the National Institute of Allergy and Infectious Diseases (NIAID) grants K22AI136686 and R61AI174295, and the National Science Foundation (NSF) CAREER Award 2047503. Q. Wang acknowledges partial support by the National Science Foundation EPSCoR Program under NSF Award OIA-2242812.
Footnotes
Supporting Information
The Methods section includes protocols from preparation and characterization of ALAAs, as well as nanopore measurements and data analysis; The Figures section includes capture rate, typical ionic current blockade fluctuations, superimposed histograms of events per bin of dwell time, space-filling structures, and spectral data of AlAAs; The summary table includes the volume, mean ΔI/I0, dwell time (τ), and blockade fluctuations (σb), together with respective standard derivation (SD) of ALAAs; The spectral results section includes 1H and 13C nuclear magnetic resonance analyses of all ALAAs.
The authors declare no competing financial interest.
References
- (1).Boynton P; Di Ventra M Sequencing proteins with transverse ionic transport in nanochannels. Scientific Reports 2016, 6, 1–10. [DOI] [PMC free article] [PubMed] [Google Scholar]
- (2).Timp W; Timp G Beyond mass spectrometry, the next step in proteomics. Science Advances 2020, 6, eaax8978. [DOI] [PMC free article] [PubMed] [Google Scholar]
- (3).Restrepo-Pérez L; Joo C; Dekker C Paving the way to single-molecule protein sequencing. Nature Nanotechnology 2018, 13, 786–796. [DOI] [PubMed] [Google Scholar]
- (4).Wang YH; Zhao Y; Bollas A; Wang YR; Au KF Nanopore sequencing technology, bioinformatics and applications. Nature Biotechnology 2021, 39, 1348–1365. [DOI] [PMC free article] [PubMed] [Google Scholar]
- (5).Tang Z; Choi G; Nouri R; Guan W Loop-Mediated Isothermal Amplification-Coupled Glass Nanopore Counting Toward Sensitive and Specific Nucleic Acid Testing. Nano Letters 2019, 19, 7927–7934. [DOI] [PubMed] [Google Scholar]
- (6).Nouri R; Tang Z; Guan W Quantitative Analysis of Factors Affecting the Event Rate in Glass Nanopore Sensors. ACS Sensors 2019, 4, 3007–3013. [DOI] [PubMed] [Google Scholar]
- (7).Hussein EA; White RJ Silver Nanoneedle Probes Enable Sustained DC Current, Single-Channel Resistive Pulse Nanopore Sensing. Analytical Chemistry 2021, 93, 11568–11575. [DOI] [PubMed] [Google Scholar]
- (8).Angevine CE; Robertson JW; Dass A; Reiner JE Laser-based temperature control to study the roles of entropy and enthalpy in polymer-nanopore interactions. Science Advances 2021, 7, eabf5462. [DOI] [PMC free article] [PubMed] [Google Scholar]
- (9).Liu S-C; Ying Y-L; Li W-H; Wan Y-J; Long Y-T Snapshotting the transient conformations and tracing the multiple pathways of single peptide folding using a solid-state nanopore. Chemical Science 2021, 12, 3282–3289. [DOI] [PMC free article] [PubMed] [Google Scholar]
- (10).Balijepalli A; Robertson JW; Reiner JE; Kasianowicz JJ; Pastor RW Theory of polymer–nanopore interactions refined using molecular dynamics simulations. Journal of the American Chemical Society 2013, 135, 7064–7072. [DOI] [PMC free article] [PubMed] [Google Scholar]
- (11).Chavis AE; Brady KT; Hatmaker GA; Angevine CE; Kothalawala N; Dass A; Robertson JW; Reiner JE Single molecule nanopore spectrometry for peptide detection. ACS Sensors 2017, 2, 1319–1328. [DOI] [PMC free article] [PubMed] [Google Scholar]
- (12).Hu ZL; Huo MZ; Ying YL; Long YT Biological nanopore approach for single-molecule protein sequencing. Angewandte Chemie 2021, 133, 14862–14873. [DOI] [PubMed] [Google Scholar]
- (13).Tang L. Sensing proteinogenic amino acids. Nature Methods 2020, 17, 126–126. [DOI] [PubMed] [Google Scholar]
- (14).Cressiot B; Bacri L; Pelta J The promise of nanopore technology: Advances in the discrimination of protein sequences and chemical modifications. Small Methods 2020, 4, 2000090. [Google Scholar]
- (15).Wang F; Zhao C; Zhao P; Chen F; Qiao D; Feng J MoS2 nanopore identifies single amino acids with sub-1 Dalton resolution. Nature Communications 2023, 14, 2895. [DOI] [PMC free article] [PubMed] [Google Scholar]
- (16).Ali M; Nasir S; Ensinger W Stereoselective detection of amino acids with protein-modified single asymmetric nanopores. Electrochimica Acta 2016, 215, 231–237. [Google Scholar]
- (17).Wang K; Zhang S; Zhou X; Yang X; Li X; Wang Y; Fan P; Xiao Y; Sun W; Zhang P; Li W; Huang S Unambiguous discrimination of all 20 proteinogenic amino acids and their modifications by nanopore. Nature Methods 2024, 21, 92–101. [DOI] [PubMed] [Google Scholar]
- (18).Zhang Y; Yi Y; Li Z; Zhou K; Liu L; Wu H-C Peptide sequencing based on host–guest interaction-assisted nanopore sensing. Nature Methods 2024, 21, 102–109. [DOI] [PubMed] [Google Scholar]
- (19).Ying Y-L; Long Y-T Nanopore-based single-biomolecule interfaces: from information to knowledge. Journal of the American Chemical Society 2019, 141, 15720–15729. [DOI] [PubMed] [Google Scholar]
- (20).Wang J; Prajapati JD; Gao F; Ying Y-L; Kleinekathöfer U; Winterhalter M; Long Y-T Identification of single amino acid chiral and positional isomers using an electrostatically asymmetric nanopore. Journal of the American Chemical Society 2022, 144, 15072–15078. [DOI] [PMC free article] [PubMed] [Google Scholar]
- (21).Wei X; Penkauskas T; Reiner JE; Kennard C; Uline MJ; Wang Q; Li S; Aksimentiev A; Robertson JWF; Liu C Engineering Biological Nanopore Approaches toward Protein Sequencing. ACS Nano 2023, 17, 16369–16395. [DOI] [PMC free article] [PubMed] [Google Scholar]
- (22).Kim M; Foster JC; Moore MD; Chen M Improving Single-Molecule Antibody Detection Selectivity through Optimization of Peptide Epitope Presentation in OmpG Nanopore. ACS Sensors 2023, 8, 2673–2680. [DOI] [PubMed] [Google Scholar]
- (23).Yuan B; Li S; Ying Y-L; Long Y-T The analysis of single cysteine molecules with an aerolysin nanopore. Analyst 2020, 145, 1179–1183. [DOI] [PubMed] [Google Scholar]
- (24).Guo Y; Niu A; Jian F; Wang Y; Yao F; Wei Y; Tian L; Kang X Metal–organic complex-functionalized protein nanopore sensor for aromatic amino acids chiral recognition. Analyst 2017, 142, 1048–1053. [DOI] [PubMed] [Google Scholar]
- (25).Boersma AJ; Bayley H Continuous stochastic detection of amino acid enantiomers with a protein nanopore. Angewandte Chemie 2012, 124, 9744–9747. [DOI] [PubMed] [Google Scholar]
- (26).Ge Y; Cui M; Zhang Q; Wang Y; Xi D Aerolysin Nanopore-Based Identification of Proteinogenic Amino Acids Using a Bipolar Peptide Probe. Nanoscale Advances 2022, 4, 3883–3891. [DOI] [PMC free article] [PubMed] [Google Scholar]
- (27).Piguet F; Ouldali H; Pastoriza-Gallego M; Manivet P; Pelta J; Oukhaled A Identification of single amino acid differences in uniformly charged homopolymeric peptides with aerolysin nanopore. Nature communications 2018, 9, 1–13. [DOI] [PMC free article] [PubMed] [Google Scholar]
- (28).Ouldali H; Sarthak K; Ensslen T; Piguet F; Manivet P; Pelta J; Behrends JC; Aksimentiev A; Oukhaled A Electrical recognition of the twenty proteinogenic amino acids using an aerolysin nanopore. Nature Biotechnology 2020, 38, 176–181. [DOI] [PMC free article] [PubMed] [Google Scholar]
- (29).Wei X; Ma D; Zhang Z; Wang L; Gray J; Zhang L; Zhu T; Wang X; Lenhart B; Yin Y; Wang Q; Liu C N-Terminal Derivatization-Assisted Identification of Individual Amino Acids Using a Biological Nanopore Sensor. ACS Sensors 2020, 5, 1707–1716. [DOI] [PMC free article] [PubMed] [Google Scholar]
- (30).Wei X; Ma D; Jing L; Wang LY; Wang X; Zhang Z; Lenhart BJ; Yin Y; Wang Q; Liu C Enabling nanopore technology for sensing individual amino acids by a derivatization strategy. Journal of Materials Chemistry B 2020, 8, 6792–6797. [DOI] [PMC free article] [PubMed] [Google Scholar]
- (31).Butov GM; Burmistrov V; Saad KR Synthesis of Adamantyl-Containing Compounds: Structure Elements of Rotaxanes and Supramolecular Polymers. Mod. Org. Chem. Res 2017, 4, 1910–1914. [Google Scholar]
- (32).Kapp RW In Encyclopedia of Toxicology (Third Edition); Wexler P, Ed.; Oxford Academic Press: 2014, p 1112–1131. [Google Scholar]
- (33).Wei X; Wang Q; Liu C Nanopore sensing of γ-cyclodextrin induced host-guest interaction to reverse the binding of perfluorooctanoic acid to human serum albumin. Proteomics 2022, 22, 2100058. [DOI] [PubMed] [Google Scholar]
- (34).Wei X; Zhang Z; Wang X; Lenhart B; Gambarini R; Gray J; Liu C Insight into the effects of electrochemical factors on host-guest interaction induced signature events in a biological nanopore. Nanotechnology and Precision Engineering 2020, 3, 2–8. [DOI] [PMC free article] [PubMed] [Google Scholar]
- (35).Wanunu M; Morrison W; Rabin Y; Grosberg AY; Meller A Electrostatic focusing of unlabelled DNA into nanoscale pores using a salt gradient. Nature Nanotechnology 2010, 5, 160–165. [DOI] [PMC free article] [PubMed] [Google Scholar]
- (36).Waduge P; Hu R; Bandarkar P; Yamazaki H; Cressiot B; Zhao Q; Whitford PC; Wanunu M Nanopore-Based Measurements of Protein Size, Fluctuations, and Conformational Changes. ACS Nano 2017, 11, 5706–5716. [DOI] [PubMed] [Google Scholar]
- (37).Baaken G; Halimeh I; Bacri L; Pelta J; Oukhaled A; Behrends JC High-Resolution Size-Discrimination of Single Nonionic Synthetic Polymers with a Highly Charged Biological Nanopore. ACS Nano 2015, 9, 6443–6449. [DOI] [PubMed] [Google Scholar]
- (38).Cao C; Ying Y-L; Hu Z-L; Liao D-F; Tian H; Long Y-T Discrimination of oligonucleotides of different lengths with a wild-type aerolysin nanopore. Nature Nanotechnology 2016, 11, 713–718. [DOI] [PubMed] [Google Scholar]
- (39).Xin KL; Hu ZL; Liu SC; Li XY; Li JG; Niu H; Ying YL; Long YT 3D Blockage Mapping for Identifying Familial Point Mutations in Single Amyloid-β Peptides with a Nanopore. Angewandte Chemie 2022, 134, e202209970. [DOI] [PubMed] [Google Scholar]
- (40).Li X; Ying Y-L; Fu X-X; Wan Y-J; Long Y-T Single-Molecule Frequency Fingerprint for Ion Interaction Networks in a Confined Nanopore. Angewandte Chemie International Edition 2021, 60, 24582–24587. [DOI] [PubMed] [Google Scholar]
- (41).Liu Y; Zhang S; Wang Y; Wang L; Cao Z; Sun W; Fan P; Zhang P; Chen H-Y; Huang S Nanopore Identification of Alditol Epimers and Their Application in Rapid Analysis of Alditol-Containing Drinks and Healthcare Products. Journal of the American Chemical Society 2022, 144, 13717–13728. [DOI] [PubMed] [Google Scholar]
- (42).Hwang H-J; Kim J-S; Lee J; Min JS; Jeong K-B; Kim E; Lee M-K; Chi S-W Single-Molecule Sensing of an Anticancer Therapeutic Protein–Protein Interaction Using the Chemically Modified OmpG Nanopore. Analytical Chemistry 2022, 94, 7449–7454. [DOI] [PubMed] [Google Scholar]
- (43).Li F; Fahie MA; Gilliam KM; Pham R; Chen M Mapping the conformational energy landscape of Abl kinase using ClyA nanopore tweezers. Nature Communications 2022, 13, 3541. [DOI] [PMC free article] [PubMed] [Google Scholar]
- (44).Huo M-Z; Li M-Y; Ying Y-L; Long Y-T Is the Volume Exclusion Model Practicable for Nanopore Protein Sequencing? Analytical Chemistry 2021, 93, 11364–11369. [DOI] [PubMed] [Google Scholar]
- (45).Robertson JW; Rodrigues CG; Stanford VM; Rubinson KA; Krasilnikov OV; Kasianowicz JJ Single-molecule mass spectrometry in solution using a solitary nanopore. Proceedings of the National Academy of Sciences 2007, 104, 8207–8211. [DOI] [PMC free article] [PubMed] [Google Scholar]
- (46).Shoji K; Kawano R; White RJ Spatially Resolved Chemical Detection with a Nanoneedle-Probe-Supported Biological Nanopore. ACS Nano 2019, 13, 2606–2614. [DOI] [PubMed] [Google Scholar]
- (47).Ahmad M; Ha J-H; Mayse LA; Presti MF; Wolfe AJ; Moody KJ; Loh SN; Movileanu L A generalizable nanopore sensor for highly specific protein detection at single-molecule precision. Nature Communications 2023, 14, 1374. [DOI] [PMC free article] [PubMed] [Google Scholar]
- (48).Mayse LA; Imran A; Larimi MG; Cosgrove MS; Wolfe AJ; Movileanu L Disentangling the recognition complexity of a protein hub using a nanopore. Nature Communications 2022, 13, 978. [DOI] [PMC free article] [PubMed] [Google Scholar]
- (49).Reiner JE; Kasianowicz JJ; Nablo BJ; Robertson JW Theory for polymer analysis using nanopore-based single-molecule mass spectrometry. Proceedings of the National Academy of Sciences 2010, 107, 12080–12085. [DOI] [PMC free article] [PubMed] [Google Scholar]
- (50).Yu L; Kang X; Li F; Mehrafrooz B; Makhamreh A; Fallahi A; Foster JC; Aksimentiev A; Chen M; Wanunu M Unidirectional single-file transport of full-length proteins through a nanopore. Nature Biotechnology 2023, 41, 1130–1139. [DOI] [PMC free article] [PubMed] [Google Scholar]
- (51).Wei X; Wang X; Zhang Z; Luo Y; Wang Z; Xiong W; Jain PK; Monnier JR; Wang H; Hu TY; Tang C; Albrecht H; Liu C A click chemistry amplified nanopore assay for ultrasensitive quantification of HIV-1 p24 antigen in clinical samples. Nature Communications 2022, 13, 6852. [DOI] [PMC free article] [PubMed] [Google Scholar]
- (52).Zhang Z; Wang X; Wei X; Zheng SW; Lenhart BJ; Xu P; Li J; Pan J; Albrecht H; Liu C Multiplex quantitative detection of SARS-CoV-2 specific IgG and IgM antibodies based on DNA-assisted nanopore sensing. Biosensors and Bioelectronics 2021, 181, 113134. [DOI] [PMC free article] [PubMed] [Google Scholar]
- (53).Wang X; Wei X; van der Zalm MM; Zhang Z; Subramanian N; Demers A-M; Ghimenton Walters E; Hesseling A; Liu C Quantitation of Circulating Mycobacterium tuberculosis Antigens by Nanopore Biosensing in Children Evaluated for Pulmonary Tuberculosis in South Africa. ACS Nano 2023, 17, 21093–21104. [DOI] [PMC free article] [PubMed] [Google Scholar]
Associated Data
This section collects any data citations, data availability statements, or supplementary materials included in this article.