

Abstract
Extracellular vesicle (EV) secretion has been observed in many types of both normal and tumor cells. EVs contain a variety of distinctive cargoes, allowing tumor-derived serum proteins in EVs to act as a minimally invasive method for clinical monitoring. We have undertaken a comprehensive study of the protein content of the EVs from several cancer cell lines using direct data-independent analysis. Several thousand proteins were detected, including many classic EV markers such as CD9, CD81, CD63, TSG101, and Syndecan-1, among others. We detected many distinctive cancer-specific proteins, including several known markers used in cancer detection and monitoring. We further studied the protein content of EVs from patient serum for both normal controls and pancreatic cancer and hepatocellular carcinoma. The EVs for these studies have been isolated by various methods for comparison, including ultracentrifugation and CD9 immunoaffinity column. Typically, 500–1000 proteins were identified, where most of them overlapped with the EV proteins identified from the cell lines studied. We were able to identify many of the cell-line EV protein markers in the serum EVs, in addition to the large numbers of proteins specific to pancreatic and HCC cancers.
Keywords: extracellular vesicles, immunoaffinity, CD9, ultracentrifugation, EV proteins, HCC, pancreatic cancer
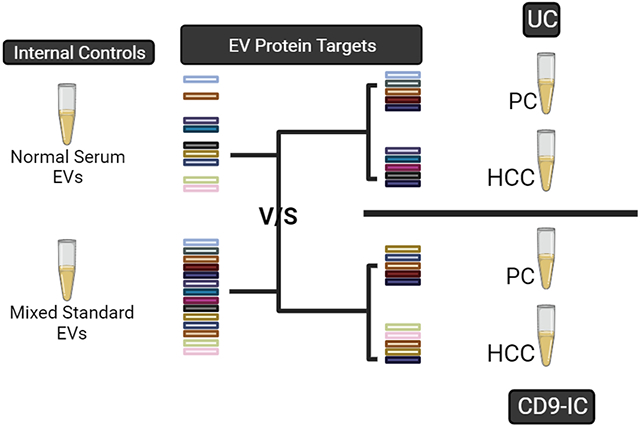
Graphical Abstract
INTRODUCTION
Extracellular vesicle secretion has been observed in most types of normal and tumor cells.1-3 EVs include small exosomes, which are typically 30–120 nm in diameter, and other larger-sized EVs. They contain a variety of distinctive cargo, including proteins, RNAs, lipids, and various metabolites. Tumor-derived EVs contain cargo specific to the parent tumor cell1,4 as EVs are involved in cell–cell signaling and intercellular communication. EVs are secreted into the bloodstream, and they can be isolated after the processing of routine blood draws. Identification of tumor-derived EVs may serve as a minimally invasive clinical monitoring method for early detection and prognosis.4-12 Exosomes in particular are selectively loaded with cargo related to the disease state, which significantly reduces the complexity with improved specificity compared to searching for markers directly in serum.
Our previous work has focused on the analysis of proteins from EVs from serum.13-17 For the isolation of exosomes from serum, high abundance of blood proteins poses a special challenge which can interfere with analysis by methods such as mass spectrometry.16,18-20 Several methods have been used to reduce the serum background21,22 including multiple cycles of ultracentrifugation (UC),15,20 combinations of UC with size exclusion chromatography (SEC),16,20,23-26 a CD9 immunoaffinity HPLC column method,27 and a novel polyester capillary channel polymer (PET C-CP) fiber phase/hydrophobic interaction chromatography (HIC) method.28,29 These methods have been used to identify several potential protein markers for various cancers.15,30,31
In our current work, we have undertaken a comprehensive study of the proteomic content of the EVs from several cancer cell lines as standards and compared them to the protein content of EVs isolated from the serum of patients with cancer (HCC and PC). Patient serum was used in this study instead of plasma, although either one could be used. Serum was chosen since it eliminates many of the clotting factors that might otherwise interfere in proteomic analysis. The analysis was performed using direct data-independent acquisition (DIA) to optimize the number and types of proteins detected.32 Several thousand proteins were identified, including many of the classic EV markers30 such as CD9, CD81, CD63, TSG101, Alix,1 and Syntenin-1.33 Many distinctive cancer-related proteins were detected in at least one cancer cell line, and several of them have been previously identified as potential markers for cancer detection and monitoring of cancer progression.15
We have further studied the protein content of EVs from patient serum for both normal controls and pancreatic and HCC cancers, where a comparison can be made between the normal EV content and EVs derived from patient serum. The EVs for these studies have been isolated by varying methods (e.g., UC and CD9-IC) for comparative analysis. Typically, 500–1500 proteins could be identified, and most of them overlapped with the EV proteins identified from the cell lines used. Many of the same EV protein markers were identified in these serum EVs, in addition to a large number of proteins related to pancreatic and HCC cancers.
EXPERIMENTAL SECTION
Overview
An overview of the experimental workflow is shown in Figure 1. The serum samples were initially processed by using low-speed centrifugation to eliminate larger particles. The EVs were then isolated using either multiple cycles of UC to eliminate most of the blood protein contamination or a CD9-IC method based on HPLC where contaminant proteins passed through the column while CD9-based EVs were captured and then eluted. The details of these methods were described in previous work.15,27 The EVs were characterized by transmission electron microscopy (TEM) combined with either NanoSight light scattering or the ZetaView method for size distribution. Most of the EVs were in the small EV (sEV) or exosome regime as shown in previous work.15,27 The EVs isolated from patient serum and the commercial EVs obtained from cell lines were then lysed and digested by a mixture of trypsin and Lys-C for mass spectrometry analysis. The mass spectrometry was performed in the DIA mode on an Orbitrap Fusion Lumos or Orbitrap Ascend (Thermo Scientific), which were found to provide improved protein numbers and reproducibility over data dependent analysis mass spectrometry (DDA-MS).32
Figure 1.

Experimental workflow for the isolation, characterization, and processing of small EVs followed by direct DIA-MS analysis.
Materials
Reagents used in the study were purchased from Sigma (St. Louis, MO) unless mentioned. Normal human serum was obtained from an EMD Millipore (Burlington, MA). Recombinant anti-CD9 antibody BSA and azide-free (ab263023) from Abcam (Cambridge, MA) was used. UltraLink hydrazide resin, Zeba spin desalting columns (7K MWCO), 2 mL of high-performance desalting resin (89890), Pierce centrifuge columns, and a chemiluminescence substrate kit were obtained from Thermo Fisher Scientific (Rockford, IL). Lys-C was obtained from Wako, and sequencing-grade trypsin was obtained from Promega (Madison, WI). The Amicon Ultra-4 Centrifugal Filter Unit and 50 kDa MWCO were from Millipore (Billerica, MA). Ultra-Clear centrifuge tube inserts (344059) for UC were obtained from Beckman Coulter (Indianapolis, IN). 1× phosphate buffered saline (PBS) and 1 M sodium chloride (NaCl) were filtered with a 0.22 μm RC syringe filter from TISCH Scientific (Cleves, OH). S-Trap filters were obtained from Protifi (Huntington, NY). The 200-mesh Formvar carbon-coated grid was obtained from Electron Microscopy Sciences (Hatfield, PA).
Human Serum Samples
The pooled human serum, which was used as the “normal” sample in this work, was purchased from Innovative Research Inc. (Novi, MI). Each donor unit was tested and found negative for HBsAG, HIV-1/2, anti-HCV, anti-HBs, anti-HBc, HCV-NAT, and HIV-1 NAT in conformance with FDA regulations. The pooled serum was filtered through a 200 nm cartridge. After purchase, it was aliquoted and stored at −80 °C until further use to avoid freeze–thaw cycles.
The pancreatic and HCC serum samples were obtained from patients with metastatic late-stage cancer diagnoses after providing informed consent. The protocol for the sample processing was the same as that utilized by the NCI EDRN, and the samples were obtained under IRB approval from the University of Michigan Hospital. The samples were stored at −80 °C and used without freeze-thaw cycles.
EV Enrichment by UC
Enrichment of extracellular vesicles (EVs) was performed using five cycles of UC with 3 mL of normal serum as the starting volume. Prior to UC, the serum was processed to eliminate large particle impurities, where 3 mL of serum was combined with an equal volume of PBS (1:1) and filtered through a 0.22 μm filter. The filtered sample was then centrifuged at 5000g for 10 min at 4 °C, and the resulting supernatant was collected. Following this, centrifugation at 10,000g for 30 min was performed, and the supernatant was collected (which was approximately 6 mL).
Next, the processed sample, along with 7 mL of PBS, was transferred to a 13.2 mL Ultra-Clear tube (Beckman Coulter, Indianapolis, IN) for UC using a Beckman Optima XL-70 ultracentrifuge. Initially, the sample was subjected to UC at 100,000g for 120 min at 4 °C, followed by four cycles of UC for 75 min (each as a cleanup step).
In our previous work, we demonstrated that five cycles of UC are necessary to eliminate contamination from blood proteins.15 Between each UC cycle, the supernatant was carefully aspirated without disturbing the EV pellet, leaving approximately 2 mm of supernatant at the bottom of the tube. The EV pellet was resuspended in approximately 13 mL of PBS for each of the cleaning cycles. After the cleanup cycles had been completed, the supernatant was carefully pipetted out and discarded. The purified EV pellet was resuspended in 200 μL of PBS and stored at −80 °C for further analysis.
EV Enrichment by CD9 Immunoaffinity Column (CD9-IC)
In a previous study, we devised a CD9-HPLC-IC technique to isolate EVs from small serum samples for subsequent proteomic analysis.27 In this work, an anti-CD9-HPLC approach for EV enrichment with slight modification was employed.27 Briefly, a CD9 immunoaffinity column was fabricated by immobilizing anti-CD9 antibody to hydrazide beads using a zeba spin desalting column prior to packing them into a PEEK column.
Next, the CD9-IC, along with a Vanquish UHPLC system (Thermo Fisher Scientific), facilitated EV isolation. 200 μL of normal serum was subjected to pretreatment by mixing with 200 μL of PBS and centrifugation at 2000g for 20 min at 4 °C to remove large particle impurities. The supernatant was collected and centrifuged at 10,000g for 30 min. Approximately 400 μL of the resulting sample was filtered through a 0.22 μm filter and aliquoted to 100 μL each, which was then loaded onto the anti-CD9 column for EV isolation.
In the UHPLC system, the mobile phase was set as PBS buffer (Phase A) and 1 M NaCl solution (Phase B) with a flow rate of 0.5 mL/min. UV detection for EVs was set at 254 nm, similar to previous reports.27 After injecting the filtered serum sample, the column was washed with Phase A (0–10 min), followed by elution with Phase B (10–19 min), and then reequilibrated with Phase A (19–30 min). The HPLC chromatogram showed a distinctive EV elution peak in the fraction between 16 and 19 min which was collected.
Subsequently, the eluted EV fractions from the four aliquots of the serum sample were pooled together and subjected to a postpurification step using an Amicon Ultra-4 Centrifugal Filter 50 kDa MWCO (Millipore Sigma) to remove coprecipitated serum proteins in the EV fraction, followed by desalting and concentration. After characterization by TEM and nanoparticle tracking analysis (NTA), the EVs were used for proteomics analysis by nano liquid chromatography-tandem mass spectrometry (nano LC-MS/MS).
Exosome Standards
HT29 (ab239690), PC3 (ab239689), and MCF7 (ab239691) exosome standards were purchased from Abcam (Waltham, MA), which were derived from human cancer cell lines and lyophilized. The lyophilized exosome standards, 100 μg per vial, were reconstituted with 200 μL of water to reach a concentration of 0.5 μg EVs/μL. EV standards were then aliquoted and stored at −80 °C until further use.
NTA
For the EV samples extracted using the UC or CD9-IC approaches, 50 μL of each EV sample was diluted with 250 μL of PBS for NanoSight analysis. A similar amount of standard EV samples was used alone or in a mix. We used the NanoSight NS300 (Malvern, UK) to measure the concentration and size distribution of the EVs. The samples were automatically infused into the NanoSight at a flow rate of 10 μL/min. The motion of the EVs was recorded 5 times and analyzed using the built-in NTA software (v3.3). The concentration of EVs was calculated automatically, and a histogram of particle size distribution was also analyzed by the NTA software.
ZetaView
For the EV samples extracted using the UC or CD9-IC approaches, 50 μL of each EV sample was diluted with 750 μL of PBS for ZetaView (Particle Metrix, Germany) analysis. A similar amount of standard EV samples was used alone or in a mix. We used the ZetaView TWIN NTA System with the NTA Cell Module or Scattering Mode to measure the size and concentration of EV samples. The following parameters were used for each run.
| camera settings | tracking parameters |
|---|---|
| sensitivity: 85 | minimum brightness: 23 |
| shutter: 100 | maximum brightness: 1000 |
| frame rate:30 f/s | minimum size: 8 |
| traces: 10 |
After each run, the size and concentration of the EV samples were analyzed by ZetaView TWIN Version 4.0 built-in software and presented in the form of a histogram.
TEM
EV samples were assessed by TEM using negative staining, where 5 μL of EV sample was loaded onto a 200 mesh Formvar/carbon-coated grid and made to sit for 10 min. The EV sample was then fixed using 5 μL of fixative (2.5% glutaraldehyde in 0.1 M PBS, pH 7.2), followed by a washing cycle with 5 μL of water for 1 min (total repeats 3). Then, the grid was negatively stained by using 5 μL of 1% uranyl acetate for 3 min. TEM images were obtained on a JEOL 1400-plus transmission electron microscope.
Protein Digestion by S-Trap
The standard and purified exosomes were lysed by 5% sodium dodecyl sulfate (SDS) in 100 mM triethylammonium bicarbonate (TEAB) buffer. The protein solutions were denatured with 10 mM dithiothreitol for 15 min at 37 °C and alkylated with 50 mM iodoacetamide in the dark for 15 min at 25 °C. Afterward, the samples were acidified by 1% phosphoric acid and then diluted by six volumes of binding buffer (90% methanol in 100 mM TEAB; pH 7.1). After mixing, the protein solution was loaded into an S-Trap filter from Protifi (Huntington, NY), spun at 4000g for 30 s, and then the filter was washed with 150 μL of binding buffer three times. Proteins were digested with Lys-C (Wako) (0.5 μg) and sequencing-grade trypsin (Promega) (2 μg) in 20 μL of digestion buffer (50 mM TEAB) at 37 °C for 16 h (enzyme to protein ratio 1:10, μg/μg). To elute peptides, three stepwise buffers with 40 μL each, 50 mM TEAB, 0.2% formic acid in H2O, and 50% acetonitrile in H2O, were added and centrifuged (4000 rcf, 1 min). The peptide solutions were pooled and dried by a SpeedVac concentrator. The peptide solutions were pooled for the BCA assay to estimate the peptide amount. The peptides were dried with a SpeedVac concentrator and stored at −80 °C until LC-MS/MS analysis.
LC-MS/MS Analysis
Lyophilized peptides were reconstituted in 12 μL of 0.1% TFA with 2% ACN and 0.01% DDM. A five μL aliquot of the resulting sample was analyzed by nanoLC-MS/MS. An Orbitrap Fusion Lumos Tribrid mass spectrometer (Thermo Scientific) was mainly used and operated at the DIA mode. It was connected to a nanoACQUITY UPLC system (Waters) using two buffers for peptide separation (buffer A, 0.1% FA with 3% ACN, and buffer B, 0.1% FA with 90% ACN). Peptides were separated by a gradient mixture with an analytical column (75 μm i.d. × 20 cm) packed using 1.9 μm ReproSil C18 and with a column heater set at 48 °C. For DIA data acquired on an Orbitrap Ascend Tribrid mass spectrometer (Thermo Scientific), a Vanquish Neo UPLC system (Thermo Scientific) was used with buffer A (0.1% FA/3% ACN in water) and buffer B (0.1% FA/90% ACN in water). Peptides were separated by a gradient mixture with an analytical column (in-house prepared, 75 μm i.d. × 25 cm) packed with 1.7 μm Waters BEH C18 particles.
Peptides were separated by an LC gradient: 2–6% buffer B in 1 min, 6–30% buffer B in 84 min, 30–60% buffer B in 9 min, 60–90% buffer B in 1 min, and finally 90% buffer B for 5 min at 200 nL/min. The DIA-MS/MS scan was performed in HCD mode with the following parameters. Precursor ions from 350–1650 m/z were scanned at a resolution of 120,000 with an ion injection time of 50 ms and an AGC target of 4E5. The scan range of m/z (isolation window) of DIA windows, 377 (54), 419(32), 448(28), 473.5(25), 497.5(25), 520.5 (23), 542.5 (23), 564.5 (23), 587 (24), 610.5 (25), 635 (26), 660 (26), 685.5 (27), 712.5 (29), 741 (30), 771 (32), 803.5 (35), 838.5 (37), 877 (42), 921 (48), 972 (52), 1034.5 (71), 1133.5 (129), and 1423.5 (453), were scanned at a resolution of 30,000 with an ion injection time of 54 ms and an AGC target of 3 × 10⁶. The isolated ions were fragmented with HCD at a collision energy of 30% level.
Data Analysis for DIA Experiment
The raw DIA data were processed by Spectronaut (v18.0)34 and searched against a human UniProt database (fasta file dated June 15, 2022 with 20,420 sequences containing common contaminants) with a default mode with slight modification. A peptide search was performed with strict tryptic digestion (trypsin) and allowed a maximum of two missed cleavages. Carbamidomethyl (C) was set as a fixed modification, and acetylation (protein N-term) and oxidation (M) were set as variable modifications. Precursor, peptide, and protein-level FDR values were set to 1%. DirectDIA with deep learning was enabled by setting the dynamic XIC extraction window. Quantification was done at the MS2 level using peak area. Retention time normalization uses the default parameter, incorporating directDIA with the deep learning workflow. A cross-run normalization strategy was chosen, and the selected row was identified in at least 70% of runs.
Data Availability
The raw MS data and the identified results from Spectronaut were deposited in the Japan ProteOme STandard Repository (jPOST: https://repository.jpostdb.org/) with JPST002290 for jPOST and PXD045198 for ProteomeXchange. The access link is https://repository.jpostdb.org/preview/35471092064fa2e59c0527 and access key is 1715.
RESULTS AND DISCUSSION
In our initial work, we studied the proteomic profiling of EVs from three different types of cancer that were obtained commercially. This included EVs from the breast cancer cell line MCF7, prostate cancer cell line PC3, and the colon cancer cell line HT29. A mix of the EVs generated from these cancer cell lines may serve as standard internal controls in future EV studies. In addition, we studied an equal mix of the EVs from these three cell lines to determine the overlap between the mix and the individual cell lines. This was important since some of the essential markers may be observed in EVs from one cancer cell line but not from another. These three EV types were selected since they were commercially available; however, EVs from other types of cancer should be included when available.
In Table 1, we present 46 key proteins detected in the EVs from these three cancer cell lines. Several thousand proteins were detected in each EV type using DIA-MS based on an injection of 0.5 μg of the starting material. The proteins detected are markers for EVs including CD9, CD81, CD63, Syntenin-1(SDCBP), TSG101, and Alix (PDCD6IP), among others. The numbers in the table indicate relative quantitation based on the DIA analysis, where the signals for most of these markers are similar among each standard and the mix of the three standards. Abundance values for each protein obtained by DIA-MS are shown on the Log10 scale and ranked from the highest to the lowest. Notably, several of the top 10 markers in the table are for EVs, including CD9, CD81, Syntenin-1, and Alix (PDCD6IP) along with CD63 and TSG101 were observed.
Table 1.
Comparison of Standard Cancer Cell EVs with the Mixed Standarda
| No | Genes | Accessions | MixedStd | HT29 | MCF7 | PC3 |
|---|---|---|---|---|---|---|
| 1 | CD9 | P21926 | 6.3 | 6.3 | 5.7 | 6.2 |
| 2 | CD81 | P60033 | 6.2 | 6.8 | 5.3 | 6.6 |
| 3 | ANXA2 | P07355 | 5.9 | 6.5 | 5.6 | 6.1 |
| 4 | LGALS3BP | Q08380 | 5.4 | 5.2 | 4.7 | 5.1 |
| 5 | SDCBP | O00560 | 5.4 | 5.9 | 5.0 | 5.4 |
| 6 | ITGB1 | P05556 | 5.3 | 4.7 | 4.5 | 5.7 |
| 7 | FN1 | P02751 | 5.1 | 5.0 | 5.3 | 5.5 |
| 8 | VIM | P08670 | 5.1 | 4.8 | 3.2 | 5.3 |
| 9 | PDCD6IP | Q8WUM4 | 5.1 | 6.4 | 4.8 | 5.3 |
| 10 | ANXA1 | P04083 | 5.1 | 5.3 | 4.6 | 5.2 |
| 11 | ANXA4 | P09525 | 5.1 | 6.1 | 5.0 | 5.1 |
| 12 | ANXA11 | P50995 | 5.0 | 5.5 | 4.9 | 5.5 |
| 13 | ANXA7 | P20073 | 5.0 | 4.8 | 5.0 | 5.3 |
| 14 | TFRC | P02786 | 5.0 | 5.0 | 4.7 | 5.4 |
| 15 | ANXA5 | P08758 | 4.9 | 5.0 | 4.9 | 5.1 |
| 16 | ANXA6 | P08133 | 4.8 | 4.5 | 4.8 | 5.3 |
| 17 | LYZ | P61626 | 4.7 | 5.6 | 4.7 | 4.4 |
| 18 | PF4 | P02776 | 4.7 | - | 4.8 | - |
| 19 | ANXA3 | P12429 | 4.6 | 5.3 | 4.7 | 4.2 |
| 20 | CD63 | P08962 | 4.5 | 5.0 | 4.6 | 5.4 |
| 21 | ALDH1A1 | P00352 | 4.5 | 5.3 | 4.1 | 4.1 |
| 22 | NT5E | P21589 | 4.4 | 5.3 | 3.4 | 4.9 |
| 23 | TSG101 | Q99816 | 4.4 | 5.0 | 4.0 | 4.4 |
| 24 | SDC1 | P18827 | 4.3 | 4.8 | 4.2 | 4.3 |
| 25 | MAPRE2 | Q15555 | 4.3 | 4.1 | 4.4 | 4.7 |
| 26 | ALDH1A3 | P47895 | 4.2 | 4.3 | 3.8 | 4.4 |
| 27 | CDH1 | P12830 | 4.1 | 4.9 | 4.0 | 3.9 |
| 28 | ALDH1L1 | O75891 | 4.1 | 3.8 | 4.7 | 5.0 |
| 29 | ALDH2 | P05091 | 4.1 | 5.5 | 4.2 | 4.2 |
| 30 | HGFAC | Q04756 | 4.0 | 3.6 | 4.1 | 4.3 |
| 31 | ALDH18A1 | P54886 | 4.0 | 5.2 | 3.7 | 4.7 |
| 32 | ALDH7A1 | P49419 | 4.0 | 4.5 | 4.2 | 4.4 |
| 33 | ALDH3A2 | P51648 | 4.0 | 4.5 | - | 4.5 |
| 34 | ALDH3A1 | P30838 | 3.9 | 5.1 | - | 4.1 |
| 35 | ALDH16A1 | Q8IZ83 | 3.9 | 4.5 | 4.3 | 3.9 |
| 36 | PARVB | Q9HBI1 | 3.9 | 3.8 | 4.4 | 4.5 |
| 37 | ALDH9A1 | P49189 | 3.9 | 4.4 | 3.9 | 4.4 |
| 38 | ALDH3B1 | P43353 | 3.8 | 4.4 | - | 4.5 |
| 39 | CDH2 | P19022 | 3.7 | - | - | 4.2 |
| 40 | PLEK | P08567 | 3.6 | 4.3 | 4.3 | 4.7 |
| 41 | CDH11 | P55287 | 3.1 | - | 3.9 | 4.0 |
| 42 | ALDH4A1 | P30038 | - | 4.0 | - | - |
| 43 | ALDH1B1 | P30837 | - | 4.4 | 2.7 | 4.0 |
| 44 | CDH6 | P55285 | - | - | - | 3.6 |
| 45 | AIFM2 | Q9BRQ8 | - | 4.2 | 3.4 | 3.6 |
| 46 | ALDH8A1 | Q9H2A2 | - | - | 3.3 | 4.3 |
A total of 46 EV markers were detected with varying levels of abundance. Abundance values were shown in Log10 scale and ranked from the highest to lowest in mixed standard sample.
Other proteins in Table 1 include markers for cancer that have been reported to play an important role in previous studies.30,35 These include several of the annexins, known markers related to different types of cancer, especially AnnexinA2.36-38 Also, included among cancer-related proteins are vimentin,39,40 an important EMT marker and CD2941,42 also known as integrin beta 1 (ITGB1), which is often associated with aggressive cancers. CD73, also known as NT5E, is involved in cancer-related processes and upregulated in many cancers, making it an important marker for cancer.43 It is a key molecule in cancer regulation and development and is involved in tumor progression. These proteins are detected in the EVs from all three cell lines and the mix of these cell lines.
We also detected many of the target markers for monitoring cancer therapy in pancreatic cancer15 including, lysozyme (LYZ), PARVB, transferrin receptor 1 (CD73) (TFRC), fibronectin, pleckstrin, and HGFCA. Platelet factor 4 (PF4) was also detected, where this protein from EVs has been shown to be an important marker for pancreatic15 and liver cancers.17 It is also readily detected by MALDI-TOF from serum as a marker for various liver diseases.17 Other proteins include various forms of aldehyde dehydrogenases (ALDH), which is an important cancer stem cell marker.44 In addition to the markers listed, there are also many Ras and Rab proteins detected, which are related to these cancers. These Ras and Rab proteins are found in EVs in every cancer cell line and are listed in Supplemental Table 1.
Figure 2 shows the amount of each marker detected for each of the EV standards obtained from cancer cell lines and the mix in bar graph form. This is shown for several of the important EV and cancer markers in Table 1. In most cases, the same EV protein signal from each of the cancer cell lines is very similar. However, there are cases, such as PF4, where this protein is detected in some cell lines but not others. This protein is detected when the mix of three different EVs is analyzed, which demonstrates the need for a mix of EVs from different cell lines as a standard for detection. This is especially important where PF4 detection from EVs will be important in HCC and pancreatic cancer marker studies.15,17
Figure 2.

Quantified expression of EV- and cancer-specific markers upon comparing EVs from cancer cell lines and their mix. (a) CD9 (dark blue), (b) CD81 (purple), (c) TSG101 (green), (d) CD29 (orange), (e) vimentin (red), (f) Platelet factor 4 (PF4) (mustard), (g) CD73 (yellow), (h) lysozyme (LYZ) (light blue), and (i) PARVB (black).
The reproducibility of these DIA-MS measurements was evaluated by using the mix of three EVs (Figure 3). These measurements used normal injection of 0.5 μg of EVs and were analyzed by DIA-MS on an Orbitrap Exploris Mass Spectrometer. Figure 3c shows the reproducibility for four different runs for the same sample in terms of the number of proteins detected which is around 1000. Figure 3a-d shows the reproducibility in terms of the number of identified precursors, peptides, and protein groups.
Figure 3.

DIA-MS performance evaluation for the analysis of extracellular vesicles. The identification number at the precursor, peptide and protein levels from four replicates of EVs from standard commercial samples extracted from PC3, HT29, and MCF7. Average identification number (a), and those quantified within 20 and 10% coefficient of variation (CV) for precursors (b), peptide (c), and protein groups (d). Violin plot of CV% for 1180 protein groups (e) with a median CV of 7.7% achieved. Quantitative correlation (R2) among these replicates (f). Protein identification overlap (g). 70% were identified across all four replicates while 16, 8, and 6% were detected in 3, 2, and 1 runs, respectively. Protein dynamic range varying from 2.9 to 6.1 in Log10 value with some EV markers shown.
Figure 3e shows a violin plot for the percent CVs for the commonly detected proteins among the 4 replicates. Figure 3f shows high Pearson correlation coefficients from 0.86 to 0.97, suggesting high measurement reproducibility. Figure 3g shows the Venn diagram for the overlap of the four runs, where the use of DIA-MS allows relatively reproducible results for these EV protein measurements. Figure 3h shows the curve for the relative protein rank where several of the key proteins are noted. Supplemental Table 2 shows the signal obtained for each of the individual proteins in Table 1 for these reproducibility evaluations. The reproducibility for each individual protein between runs is excellent, although there are some cases where larger deviations are observed for low abundance proteins. Most of the proteins listed are detected in every run. DIA-MS improves the ability to detect each protein in every run compared with DDA-MS where scanning is involved.
In comparison, we isolated EVs from normal and patient sera using UC with multiple cycles of UC14 which we found to be the most effective for eliminating background proteins from the serum. In our previous work, it was shown that after every cycle of UC the amount of protein present in the eluent decreases markedly until the contamination becomes acceptable.16 Next, the morphology of EVs was evaluated using TEM (Supplementary Figure 1a,b) where we observed a characteristic lipid bilayer saucer-shaped morphology. The size of EVs was observed to be typically in the range of exosomes with a mean in the range of 100–120 nm. Nanosight light scattering was used to evaluate the size distribution and the concentration of EVs and we found that from 3 mL of starting material for serum, we typically obtained 1.73 × 10⁹ ± 2.57 × 10⁸ particles/ml sEVs after five cycles of UC having an average diameter of 136 nm (Supplementary Figure 1e). Similarly, the mix of standard EVs from cancer cells had an average diameter of 133 nm with a 1.5 × 10⁹ ± 7.22 × 10⁷ particles/ml concentration (Supplementary Figure 1d). This size distribution and concentration were further verified from the ZetaView results as shown in Supplementary Figure 1g,h.
In Table 2 is shown a comparison of the proteins detected in the mixed EV standard to those detected from the EVs of several serum samples, including a normal standard, a metastatic HCC, and a metastatic pancreatic sample. The serum EVs in this table were isolated using 5 cycles of UC, starting with 3 mL of serum. Abundance values for each protein obtained by DIA-MS are shown in a Log10 scale and ranked from the highest to the lowest in the mixed EV standard sample. There are several interesting observations that are noteworthy here. First, the EV markers detected in serum, including CD9, CD81, Syntenin-1, and Alix are observed strongly in all samples. Second, the replicate samples of the normal standard provided very similar results. Third, PF4 is detected strongly in all of the serum samples, with much higher abundance than that in the standard mix of EVs. Fourth, several cancer markers are detected in all serum samples, including integrin beta 1 (ITGB1), TFRC, LYZ, PARVB, and HGFAC, and the annexins, including AnnexinA2. Fifth, there are some markers such as vimentin and CD73 (NT5E) in pancreatic cancer that are listed as proteins not detected by DIA-MS analysis. They may be detected but the FDR value is higher than the cutoff used in the analysis. Finally, from the mix of cancer cell line EVs, we can detect our protein targets (for most of the proteins listed), whereas some of these proteins are not detected in the serum samples within the FDR. Thus, the mixed standard EVs should serve as a better potential standard than the normal serum used in our previous studies.15
Table 2.
Comparison of Serum EVs from Healthy and Patient Samples from UC with a Standard Mixture of Cancer Cellsa
| No | Genes | Accessions | MixedStd | Normal serum1 | Normal serum2 | HCC serum | Pan serum |
|---|---|---|---|---|---|---|---|
| 1 | CD9 | P21926 | 6.3 | 6.9 | 6.7 | 6.1 | 5.2 |
| 2 | CD81 | P60033 | 6.2 | 5.7 | 5.7 | 5.3 | 5.1 |
| 3 | ANXA2 | P07355 | 5.9 | 5.8 | 5.8 | 5.4 | 4.1 |
| 4 | LGALS3BP | Q08380 | 5.4 | 6.8 | 6.6 | 5.3 | 3.5 |
| 5 | SDCBP | O00560 | 5.4 | 5.6 | 5.5 | 5.1 | 4.4 |
| 6 | ITGB1 | P05556 | 5.3 | 6.1 | 5.8 | 5.5 | 4.3 |
| 7 | FN1 | P02751 | 5.1 | 6.7 | 6.5 | 6.0 | 6.2 |
| 8 | VIM | P08670 | 5.1 | 5.0 | 5.2 | 4.7 | - |
| 9 | PDCD6IP | Q8WUM4 | 5.1 | 5.4 | 5.2 | 4.9 | 4.3 |
| 10 | ANXA1 | P04083 | 5.1 | 5.5 | 5.3 | 5.1 | 4.1 |
| 11 | ANXA4 | P09525 | 5.1 | 5.2 | 5.1 | 4.5 | 4.1 |
| 12 | ANXA11 | P50995 | 5.0 | 5.7 | 5.5 | 5.0 | 4.4 |
| 13 | ANXA7 | P20073 | 5.0 | 6.0 | 5.8 | 5.4 | 4.6 |
| 14 | TFRC | P02786 | 5.0 | 7.0 | 6.8 | 6.2 | 4.9 |
| 15 | ANXA5 | P08758 | 4.9 | 5.6 | 5.4 | 5.0 | 3.3 |
| 16 | ANXA6 | P08133 | 4.8 | 5.7 | 5.5 | 5.3 | 3.4 |
| 17 | LYZ | P61626 | 4.7 | 5.7 | 6.0 | 5.9 | 4.9 |
| 18 | PF4 | P02776 | 4.7 | 6.3 | 6.0 | 6.7 | 6.6 |
| 19 | ANXA3 | P12429 | 4.6 | 5.8 | 5.6 | 5.4 | 4.3 |
| 20 | CD63 | P08962 | 4.5 | 5.2 | 5.1 | 4.5 | 3.7 |
| 21 | ALDH1A1 | P00352 | 4.5 | 5.2 | 5.1 | 3.9 | - |
| 22 | NT5E | P21589 | 4.4 | 4.6 | 4.3 | 4.4 | - |
| 23 | TSG101 | Q99816 | 4.4 | 4.7 | 4.5 | 4.2 | - |
| 24 | SDC1 | P18827 | 4.3 | - | - | - | - |
| 25 | MAPRE2 | Q15555 | 4.3 | - | - | - | 3.6 |
| 26 | ALDH1A3 | P47895 | 4.2 | - | - | - | 5.0 |
| 27 | CDH1 | P12830 | 4.1 | 4.7 | 4.9 | 5.5 | 4.8 |
| 28 | ALDH1L1 | O75891 | 4.1 | - | - | - | - |
| 29 | ALDH2 | P05091 | 4.1 | - | - | - | - |
| 30 | HGFAC | Q04756 | 4.0 | 5.5 | 5.2 | 4.1 | 3.8 |
| 31 | ALDH18A1 | P54886 | 4.0 | - | - | - | - |
| 32 | ALDH7A1 | P49419 | 4.0 | 3.7 | 3.9 | 3.9 | - |
| 33 | ALDH3A2 | P51648 | 4.0 | - | - | - | - |
| 34 | ALDH3A1 | P30838 | 3.9 | - | - | - | - |
| 35 | ALDH16A1 | Q8IZ83 | 3.9 | 5.1 | 4.8 | 4.8 | 4.5 |
| 36 | PARVB | Q9HBI1 | 3.9 | 5.4 | 5.1 | 5.0 | 4.2 |
| 37 | ALDH9A1 | P49189 | 3.9 | 4.4 | 4.3 | 4.1 | - |
| 38 | ALDH3B1 | P43353 | 3.8 | - | - | - | - |
| 39 | CDH2 | P19022 | 3.7 | - | - | - | - |
| 40 | PLEK | P08567 | 3.6 | 5.9 | 5.5 | 4.8 | 4.4 |
| 41 | CDH11 | P55287 | 3.1 | - | - | - | - |
| 42 | GYPC | P04921 | - | 4.6 | 4.4 | 4.5 | - |
| 43 | CDH5 | P33151 | - | 4.3 | 4.1 | 0.6 | - |
A total of 43 EV markers were detected with varying levels of abundance. Abundance values were shown in Log10 scale and ranked from the highest to the lowest in mixed standard sample.
Figure 4 shows the quantitative expression via bar graph of several of our marker proteins between the mixed standard EVs and EVs from various serum samples isolated by UC. Figure 4a-c shows the results for three markers, CD9, TSG101, and CD81 which are observed in all samples, except for TSG101 for the pancreatic sample, where the protein is detected but falls below the FDR cutoff. Likewise, in Figure 4d-i is shown the result for several cancer-related markers that have been identified in our previous studies. These markers are detected in all serum samples studied except occasionally in the pancreatic cancer serum, where they are detected by DIA-MS but fall below the FDR. Of note are markers such as PF4, PARVB, LYZ, VIM, and CD29, which have been important in our studies related to monitoring chemotherapy.15 These proteins are all detected in EVs in the standard mix and are shown in comparison to UC.
Figure 4.

Quantified expression of EV and cancer markers upon comparing EVs from a standard mix of cancer cell lines with serum EVs obtained by UC. (a) CD9 (dark blue), (b) CD81 (purple), (c) TSG101 (green), (d) CD29 (orange), (e) vimentin (red), platelet factor 4 (PF4) (mustard), (g) CD73 (yellow), (h) lysozyme (LYZ) (light blue), and (i) PARVB (black).
Besides the UC-DIA-MS analysis of EVs, we have also evaluated the performance of the combined EV isolation using CD9-IC and DIA-MS analysis. The CD9-IC method to purify EVs was examined since it is a simple and relatively rapid alternative to UC and also it is effective in removing background blood proteins.27 Table 3 compares the proteins detected from the mixed standard versus those detected using CD9-IC for several serum samples. The EVs from CD9-IC were first characterized based on size and morphology (Supplementary Figure 1c,f,i). After characterization, DIA-MS was performed, where only a limited amount of material (approximately 0.15 μg) was used compared with the UC experiments. The number of detected proteins from CD9-IC is much lower than that in Table 2 for the UC-isolated EVs due to the lower amount that can be loaded. There have been reports of proteomic profiles being dependent on the EV enrichment methods.45 However, it is noteworthy that many of the EV markers are still detected and several of the cancer markers are still detected in most of the samples, including AnnexinA2, CD29, TFRC, and PF4. In the case of PF4, the amount of this marker is upregulated in both HCC and pancreatic cancer serum compared to normal serum (Supplementary Figure 2). The number of identified proteins depends on the amount of starting serum, where many of the proteins that were not detected fall below the FDR limit in these DIA-MS experiments. A complete list of EV proteins identified from cancer cell line EVs and serum sample EVs using UC or CD9-IC isolation can be found in Supplementary Table 4. Protein identification overlap across cancer cell lines, UC, and CD9-IC samples for both total EV protein and target EV protein was performed (Supplementary Figure S3). It is noteworthy that cancer cell line EVs (mixed EV standard) contribute comprehensively to the several thousand proteins detected.
Table 3.
Comparison of Serum EVs from Healthy and Patient Samples from CD9-IC with a Standard Mixture of Cancer Cellsa
| No | Genes | Accessions | MixedStd | Normal serum | HCC serum | Pan serum |
|---|---|---|---|---|---|---|
| 1 | CD9 | P21926 | 6.3 | - | 5.1 | - |
| 2 | CD81 | P60033 | 6.2 | - | - | - |
| 3 | ANXA2 | P07355 | 5.9 | 3.4 | 4.5 | 3.2 |
| 4 | LGALS3BP | Q08380 | 5.4 | 4.9 | - | 5.0 |
| 5 | SDCBP | O000560 | 5.4 | - | 5.3 | - |
| 6 | ITGB1 | P05556 | 5.3 | 4.1 | 4.7 | - |
| 7 | FN1 | P02751 | 5.1 | 6.4 | 5.0 | 6.5 |
| 8 | VIM | P08670 | 5.1 | - | 4.2 | - |
| 9 | PDCD6IP | Q8WUM4 | 5.1 | 3.1 | - | - |
| 10 | ANXA1 | P04083 | 5.1 | - | 4.5 | - |
| 11 | ANXA4 | P09525 | 5.1 | 4.7 | - | - |
| 12 | ANXA11 | P50995 | 5.0 | - | 4.4 | - |
| 13 | ANXA7 | P20073 | 5.0 | - | 4.6 | - |
| 14 | TFRC | P02786 | 5.0 | 4.8 | 6.2 | 4.4 |
| 15 | ANXA5 | P08758 | 4.9 | 4.9 | 3.7 | - |
| 16 | ANXA6 | P08133 | 4.8 | - | - | - |
| 17 | LYZ | P61626 | 4.7 | 4.6 | 4.4 | - |
| 18 | PF4 | P02776 | 4.7 | 4.9 | 5.4 | 5.8 |
| 19 | ANXA3 | P12429 | 4.6 | - | - | - |
| 20 | CD63 | P08962 | 4.5 | - | 3.9 | - |
| 21 | ALDH1A1 | P00352 | 4.5 | - | 4.9 | 4.2 |
| 22 | NT5E | P21589 | 4.4 | - | - | - |
| 23 | TSG101 | Q99816 | 4.4 | - | - | - |
| 24 | SDC1 | P18827 | 4.3 | - | - | - |
| 25 | MAPRE2 | Q15555 | 4.3 | - | - | - |
| 26 | ALDH1A3 | P47895 | 4.2 | - | 5.9 | 4.8 |
| 27 | CDH1 | P12830 | 4.1 | - | - | - |
| 28 | ALDH1L1 | O75891 | 4.1 | - | - | - |
| 29 | ALDH2 | P05091 | 4.1 | - | - | - |
| 30 | HGFAC | Q04756 | 4.0 | 4.9 | - | 4.8 |
| 31 | ALDH18A1 | P54886 | 4.0 | - | - | - |
| 32 | ALDH7A1 | P49419 | 4.0 | - | 5.3 | - |
| 33 | ALDH3A2 | P51648 | 4.0 | - | 4.7 | 3.7 |
| 34 | ALDH3A1 | P30838 | 3.9 | - | - | - |
| 35 | ALDH16A1 | Q8IZ83 | 3.9 | - | - | - |
| 36 | PARVB | Q9HBI1 | 3.9 | - | - | - |
| 37 | ALDH9A1 | P49189 | 3.9 | - | - | - |
| 38 | ALDH3B1 | P43353 | 3.8 | - | - | - |
| 39 | CDH2 | P19022 | 3.7 | - | - | - |
| 40 | PLEK | P08567 | 3.6 | - | 5.1 | - |
| 41 | CDH11 | P55287 | 3.1 | - | - | - |
| 42 | CDH5 | P33151 | - | 4.5 | - | 4.4 |
A total of 42 EV markers were detected with varying levels of abundance. Abundance values were shown in Log10 scale and ranked from the highest to the lowest in mixed standard sample.
The mixed EV standard studied in this work serves as a potential internal standard for protein EV studies. The use of DIA-MS provides increased reproducibility for these experiments and a database for detection of key protein markers (Supplementary Table 3). Several thousand proteins were detected from the mixed EV standard, where we focused on a limited number of essential EV and cancer markers that have been of interest in our previous studies. The key markers for EVs, including CD9, CD81, Alix, CD63, Syntenin-1, and TSG101 are detected where CD9 and CD81 are at the top of this list. We could perform a quantitative comparison between the proteins detected in this mixed standard versus EVs from each of the individual cell lines and found that the mixed standard provides coverage of the target markers, whereas such coverage is often not complete for the individual samples. Also, the quantitative expression of individual proteins in the mixed EV sample was comparable to that of each of the individual EV cancer cell line samples. Of interest is PF4, which was not observed in the EVs from the PC3 or HT29 cell lines but in MCF7. This is an important potential marker for a variety of liver diseases17 and was detected in EVs in the mixture of the EVs from the three cell lines. The mixed EV sample thus serves as a potential internal standard better than that of the EVs from each of the individual cell lines.
The mixed EV sample was also compared to proteins detected from EVs from several serum samples isolated by multiple cycles of UC. The multiple cycles were used to eliminate many of the high-abundance components of serum and have also been found to minimize the presence of apo proteins. The EV markers were found to be quantitatively similar for the normal and cancer samples compared with the mixed standard samples. Most of the target cancer markers selected in this work were found to be quantitatively similar to those detected in the mixed EV sample. One exception was PF4, which was found to be markedly increased in the EVs in serum samples compared with the EVs of the mixed standards.
An important aspect of this work was that multiple runs were performed by DIA-MS on the normal samples and the proteins detected, and the levels for the EVs were found to be very consistent, as shown in Table 2 and Figure 3 where the % CV over four runs for most proteins were found to be relatively low. DIA-based label-free proteome quantification of clinical samples has become a promising tool to achieve in-depth coverage with reproducible quantification across a large number of samples.32 EV proteome analysis by DIA has been an emerging technique, with some studies already reported. Zheng et al., demonstrated the potential of DIA-MS to validate circulating extracellular vesicles biomarkers in colorectal cancer patient samples.46 Zhang et al., performed proteomic analysis of urinary EVs from prostate cancer and prostate inflammation patients using a DIA-constructed spectral library and identified 18 EV proteins that were significantly differentially expressed.47 Halal et al., also applied library-based DIA to profile circulating EVs from glioma patients and healthy controls, achieving a coverage of 4054 proteins.48 Chutipongtanate and Greis also previously reported the application of a curated library-based DIA for urinary EVs, detecting 888 proteins.49 With the recent advances in DIA data analysis, a direct DIA approach is beneficial for a low input amount of EVs.50
CONCLUSIONS
We have used quantitative DIA-MS to investigate the protein content of EVs from several cancer cell lines and compared these to EVs from patient serum isolated by either multiple cycles of UC or single-step CD9-IC. We detected many of the classic EV markers, such as CD9, CD81, CD63, TSG101, and Syndecan-1, and many of the distinctive cancer-related proteins, some of which have been identified as potential markers of cancer detection and monitoring of cancer progression. We further studied the protein content of EVs from patient serum for both normal controls and pancreatic and HCC cancers and compared the results to those obtained from a mixture of EVs from the cancer cell lines. The EV markers were found to be quantitatively similar for the normal and cancer samples compared to the mixed standard samples. For the serum EVs, we found that most of the target cancer markers selected in this work were quantitatively similar to those detected in the mixed cell line EV sample. An important aspect of this work was that multiple runs were performed by DIA-MS on the EVs from the normal samples where the proteins were detected, and the quantitative levels for the EVs were found to be very reproducible. Thus, DIA-MS can be reliably used for reproducible quantitative analysis of EVs with in-depth detection of the protein content.
Supplementary Material
ACKNOWLEDGMENTS
Special thanks to Dr. Paul Stemmer and Rita Rosati for their help with some of the proteomics runs. Also, we are thankful to Dr. Jianhui Zhu for her support with the CD9-IC runs. We would also like to acknowledge a Rogel Scholar Award (PI: V Sahai).
Funding
This work was funded by the National Cancer Institute under grant 1R01 CA258240 (D.M.L.). The research was also supported by NIH R01GM139858 (to T.S.) and NCI EDRN Interagency Agreement ACN20007-001 (to T.L.). Portions of the experimental work described herein were performed in the Environmental Molecular Sciences Laboratory, Pacific Northwest National Laboratory, a national scientific user facility sponsored by the United States Department of Energy under Contract DE-AC05-76RL0 1830. We also acknowledge the assistance of the Wayne State University Proteomics Core that is supported through NIH grants P30ES020957, P30CA022453, and S10OD030484. The research reported in this publication was also supported by the National Cancer Institutes of Health under Award Number P30 CA046592. The content is solely the responsibility of the authors and does not necessarily represent the official views of the National Institutes of Health.
Footnotes
The authors declare no competing financial interest.
Supporting Information
The Supporting Information is available free of charge at https://pubs.acs.org/doi/10.1021/acs.jproteome.3c00614.
Characterization of EVs from cancer cell lines and serum samples; quantified expression of mixed standard cancer cell line EVs and serum sample EVs produced by CD9 column for key marker PF4; and overlap of proteins identified between cancer cell lines, UC and CD9-IC for (a) total EV proteins and (b) target EV proteins (PDF)
Ras and Rab related proteins detected across cancer cell lines (Standard EV mix, HT29, MCF7, PC3) and patient serum samples (Normal, HCC, and Pancreatic)-(XLSX)
Quantitative reproducibility of EVs from four replicates of mixed cancer cell samples extracted from PC3, HT29, and MCF7 cell lines (XLSX)
Proteins as identified from cancer cell line EVs and serum sample EVs isolated by UC and CD9-IC using the DIA-MS method (XLSX)
All EV Proteins as identified from cancer cell line EVs and serum sample EVs isolated by UC and CD9-IC using the DIA-MS method (XLSX)
Contributor Information
Komal Abhange, Department of Surgery, University of Michigan Medical Center, Ann Arbor, Michigan 48109, United States.
Reta Birhanu Kitata, Biological Sciences Division, Pacific Northwest National Laboratory, Richland, Washington 99352, United States.
Jie Zhang, Department of Surgery, University of Michigan Medical Center, Ann Arbor, Michigan 48109, United States.
Yi-Ting Wang, Biological Sciences Division, Pacific Northwest National Laboratory, Richland, Washington 99352, United States.
Matthew J. Gaffrey, Biological Sciences Division, Pacific Northwest National Laboratory, Richland, Washington 99352, United States
Tao Liu, Biological Sciences Division, Pacific Northwest National Laboratory, Richland, Washington 99352, United States.
Valerie Gunchick, Department of Internal Medicine, University of Michigan, Ann Arbor, Michigan 48109, United States.
Valerie Khaykin, Department of Internal Medicine, University of Michigan, Ann Arbor, Michigan 48109, United States.
Vaibhav Sahai, Department of Internal Medicine, University of Michigan, Ann Arbor, Michigan 48109, United States.
Kyle C. Cuneo, Department of Radiation Oncology, University of Michigan, Ann Arbor, Michigan 48109, United States
Neehar D. Parikh, Department of Internal Medicine, University of Michigan, Ann Arbor, Michigan 48109, United States
Tujin Shi, Biological Sciences Division, Pacific Northwest National Laboratory, Richland, Washington 99352, United States.
David M. Lubman, Department of Surgery, University of Michigan Medical Center, Ann Arbor, Michigan 48109, United States
REFERENCES
- (1).Whiteside TL Tumor-derived exosomes and their role in cancer progression. Adv. Clin. Chem 2016, 74, 103. [DOI] [PMC free article] [PubMed] [Google Scholar]
- (2).Koga K; Matsumoto K; Akiyoshi T Purification, Characterization and Biological Significance of Tumor-derived Exosomes. Anticancer Res. 2005, 25, 3703–3707. [PubMed] [Google Scholar]
- (3).Théry C; Zitvogel L; Amigorena S Exosomes: Composition, Biogenesis and Function. Nat. Rev. Immunol 2002, 2 (8), 569–579. [DOI] [PubMed] [Google Scholar]
- (4).Abhange K; Makler A; Wen Y; et al. Small extracellular vesicles in cancer. Bioact. Mater 2021, 6, 3705–3743. [DOI] [PMC free article] [PubMed] [Google Scholar]
- (5).Bandu R; Oh JW; Kim KP Mass spectrometry-based proteome profiling of extracellular vesicles and their roles in cancer biology. Exp. Mol. Med 2019, 51, 1–10. [DOI] [PMC free article] [PubMed] [Google Scholar]
- (6).Bryl R; Borowiec B; Siroma R; et al. Current application of exosomes in medicine. Med. J. Cell Biol 2020, 8, 101–111. [Google Scholar]
- (7).Czystowska-Kuzmicz M; Whiteside TL Expert Opinion on Biological Therapy ISSN: (Print) (The potential role of tumor-derived exosomes in diagnosis, prognosis, and response to therapy in cancer The potential role of tumor-derived exosomes in diagnosis, prognosis, and response to therapy in cancer; 2020. [DOI] [PMC free article] [PubMed] [Google Scholar]
- (8).Jiao Y-J; Jin D-D; Jiang F; et al. Characterization and proteomic profiling of pancreatic cancer-derived serum exosomes. J. Cell Biochem 2019, 120 (1), 988–999. [DOI] [PubMed] [Google Scholar]
- (9).Tamura T; Yoshioka Y; Sakamoto S; Ichikawa T; Ochiya T Extracellular vesicles as a promising biomarker resource in liquid biopsy for cancer. Extracell. Vesicles Circ. Nucleic Acids 2021, 2, 148–174. [Google Scholar]
- (10).Wang YT; Shi T; Srivastava S; Kagan J; Liu T; Rodland KD; et al. Proteomic Analysis of Exosomes for Discovery of Protein Biomarkers for Prostate and Bladder Cancer. Cancers 2020, 12, 2535. [DOI] [PMC free article] [PubMed] [Google Scholar]
- (11).Zhao L; Shi J; Chang L; et al. Serum-Derived Exosomal Proteins as Potential Candidate Biomarkers for Hepatocellular Carcinoma. ACS Omega 2021, 6, 827–835. [DOI] [PMC free article] [PubMed] [Google Scholar]
- (12).Yu D; Li Y; Wang M; et al. Exosomes as a new frontier of cancer liquid biopsy. Mol. Cancer 2022, 21, 1–33. [DOI] [PMC free article] [PubMed] [Google Scholar]
- (13).Burton JB; Carruthers NJ; Stemmer PM Enriching extracellular vesicles for mass spectrometry. Mass Spectrom. Rev 2023, 42, 779–795. [DOI] [PubMed] [Google Scholar]
- (14).Kim J; Tan Z; Lubman DM Exosome Enrichment of Human Serum using Multiple Cycles of Centrifugation. Electrophoresis 2015, 36, 2017. [DOI] [PMC free article] [PubMed] [Google Scholar]
- (15).An M; Lohse I; Tan Z; et al. Quantitative Proteomic Analysis of Serum Exosomes from Patients with Locally Advanced Pancreatic Cancer Undergoing Chemoradiotherapy. J. Proteome Res 2017, 16 (4), 1763–1772. [DOI] [PMC free article] [PubMed] [Google Scholar]
- (16).An M; Wu J; Zhu J; Lubman DM Comparison of an Optimized Ultracentrifugation Method versus Size-Exclusion Chromatography for Isolation of Exosomes from Human Serum. J. Proteome Res 2018, 17 (10), 3599–3605. [DOI] [PMC free article] [PubMed] [Google Scholar]
- (17).Nguyen HQ; Lee D; Kim Y; et al. Platelet Factor 4 as a Novel Exosome Marker in MALDI-MS Analysis of Exosomes from Human Serum. Anal. Chem 2019, 91, 13297–13305. [DOI] [PubMed] [Google Scholar]
- (18).Choi D-S; Kim D-K; Kim Y-K; Gho YS Proteomics of Extracellular Vesicles: Exosomes and Ectosome. Mass Spectrom Rev. 2015, 34 (4), 474–490. [DOI] [PubMed] [Google Scholar]
- (19).Li J; He X; Deng Y; et al. An Update on Isolation Methods for Proteomic Studies of Extracellular Vesicles in Biofluids. Molecules 2019, 27 (19), 3516. [DOI] [PMC free article] [PubMed] [Google Scholar]
- (20).Jalaludin I; Lubman DM; Kim J A guide to mass spectrometric analysis of extracellular vesicle proteins for biomarker discovery. Mass Spectrom. Rev 2023, 42, 844–872. [DOI] [PubMed] [Google Scholar]
- (21).Caradec J; Kharmate G; Hosseini-Beheshti E; et al. Reproducibility and efficiency of serum-derived exosome extraction methods. Clin Biochem. 2014, 47 (13–14), 1286–1292. [DOI] [PubMed] [Google Scholar]
- (22).Gao J; Li A; Hu J; et al. Recent developments in isolating methods for exosomes. Front. Bioeng. Biotechnol 2023, 10, 1–17. [DOI] [PMC free article] [PubMed] [Google Scholar]
- (23).Askeland A; Borup A; Østergaard O; et al. Mass-Spectrometry Based Proteome Comparison of Extracellular Vesicle Isolation Methods: Comparison of ME-kit, Size-Exclusion Chromatography, and High-Speed Centrifugation. Biomedicines. 2020, 8 (8), 246. [DOI] [PMC free article] [PubMed] [Google Scholar]
- (24).Koh YQ; Almughlliq FB; Vaswani K; Peiris HN; Mitchell MD Exosome enrichment by ultracentrifugation and size exclusion chromatography. Front. Biosci. Landmark 2018, 23, 865–874. [DOI] [PubMed] [Google Scholar]
- (25).Bellotti C; Lang K; Kuplennik N; Sosnik A; Steinfeld R High-grade extracellular vesicles preparation by combined size-exclusion and affinity chromatography. Sci. Rep 2021, 11, 10550. [DOI] [PMC free article] [PubMed] [Google Scholar]
- (26).Wei R; Zhao L; Kong G; et al. Combination of Size-Exclusion Chromatography and Ultracentrifugation Improves the Proteomic Profiling of Plasma-Derived Small Extracellular Vesicles. Biol. Proced. Online 2020, 22, 1–11. [DOI] [PMC free article] [PubMed] [Google Scholar]
- (27).Zhu J; Zhang J; Ji X; Tan Z; Lubman DM Column-based Technology for CD9-HPLC Immunoaffinity Isolation of Serum Extracellular Vesicles. J. Proteome Res 2021, 20, 4901–4911. [DOI] [PMC free article] [PubMed] [Google Scholar]
- (28).Huang S; Ji X; Jackson K; et al. Rapid separation of blood plasma exosomes from low-density lipoproteins via a hydrophobic interaction chromatography method on a polyester capillary-channeled polymer fiber phase. Anal. Chim. Acta 2021, 1167, No. 338578. [DOI] [PMC free article] [PubMed] [Google Scholar]
- (29).Ji X; Huang S; Zhang J; et al. A novel method of high-purity extracellular vesicle enrichment from microliter-scale human serum for proteomic analysis. Electrophoresis 2021, 42, 245–256. [DOI] [PMC free article] [PubMed] [Google Scholar]
- (30).Lihon MV; Hadisurya M; Wu X; Iliuk A; Tao WA Isolation and Identification of Plasma Extracellular Vesicles Protein Biomarkers. Methods Mol. Biol 2023, 2660, 207–217. [DOI] [PubMed] [Google Scholar]
- (31).Yan H; Li Y; Cheng S; Zeng Y Advances in Analytical Technologies for Extracellular Vesicles. Anal. Chem 2021, 93, 4739–4774. [DOI] [PubMed] [Google Scholar]
- (32).Kitata RB; Yang JC; Chen YJ Advances in data-independent acquisition mass spectrometry towards comprehensive digital proteome landscape. Mass Spectrom. Rev 2022, 42, 2324–2348. [DOI] [PubMed] [Google Scholar]
- (33).Kugeratski FG; Hodge K; Lilla S; et al. Quantitative proteomics identifies the core proteome of exosomes with syntenin-1 as the highest abundant protein and a putative universal biomarker. Nat. Cell Biol 2021, 23, 631–641. [DOI] [PMC free article] [PubMed] [Google Scholar]
- (34).Bruderer R; Bernhardt OM; Gandhi T; et al. Extending the limits of quantitative proteome profiling with data-independent acquisition and application to acetaminophen-treated three-dimensional liver microtissues. Mol. Cell. Proteomics 2015, 14, 1400–1410. [DOI] [PMC free article] [PubMed] [Google Scholar]
- (35).Griffiths SG; Cormier MT; Clayton A; Doucette AA Differential Proteome Analysis of Extracellular Vesicles from Breast Cancer Cell Lines by Chaperone Affinity Enrichment. Proteomes 2017, 5, 25. [DOI] [PMC free article] [PubMed] [Google Scholar]
- (36).Sharma MC Annexin A2 (ANX A2): An emerging biomarker and potential therapeutic target for aggressive cancers. Int. J. Cancer 2019, 144, 2074–2081. [DOI] [PubMed] [Google Scholar]
- (37).Herrera-López EE; Guerrero-Escalera D; Aguirre-Maldonado I; et al. Annexins A2 and A5 are potential early biomarkers of hepatocarcinogenesis. Sci. Reports 2023 131 2023, 13, 1–12. [DOI] [PMC free article] [PubMed] [Google Scholar]
- (38).Li Z; Yu L; Hu B; et al. Advances in cancer treatment: a new therapeutic target, Annexin A2. J. Cancer 2021, 12, 3587–3596. [DOI] [PMC free article] [PubMed] [Google Scholar]
- (39).Satelli A; Li S Vimentin in cancer and its potential as a molecular target for cancer therapy. Cell. Mol. Life Sci 2011, 68 (18), 3033–3046. [DOI] [PMC free article] [PubMed] [Google Scholar]
- (40).Strouhalova K; Přechová M; Gandalovičová A; et al. Vimentin Intermediate Filaments as Potential Target for Cancer Treatment. Cancers 2020, 12, 184. [DOI] [PMC free article] [PubMed] [Google Scholar]
- (41).Sun Q; Zhou C; Ma R; et al. Prognostic value of increased integrin-beta 1 expression in solid cancers: a meta-analysis. Onco. Targets. Ther 2018, 11, 1787–1799. [DOI] [PMC free article] [PubMed] [Google Scholar]
- (42).Geng S; Guo Y; Wang Q; Li L; Wang J Cancer stem-like cells enriched with CD29 and CD44 markers exhibit molecular characteristics with epithelial-mesenchymal transition in squamous cell carcinoma. Arch. Dermatol. Res 2013, 305, 35–47. [DOI] [PubMed] [Google Scholar]
- (43).Bach N; Winzer R; Tolosa E; Fiedler W; Brauneck F The Clinical Significance of CD73 in Cancer. Int. J. Mol. Sci 2023, 24, No. 411759. [DOI] [PMC free article] [PubMed] [Google Scholar]
- (44).Toledo-Guzmán ME; Hernández MI; Gómez-Gallegos ÁA; Ortiz-Sánchez E ALDH as a Stem Cell Marker in Solid Tumors. Curr. Stem Cell Res. Ther 2019, 14, 375–388. [DOI] [PubMed] [Google Scholar]
- (45).Azkargorta M; Iloro I; Escobes I; et al. Human serum extracellular vesicle proteomic profile depends on the enrichment method employed. Int. J. Mol. Sci 2021, 22, 11144. [DOI] [PMC free article] [PubMed] [Google Scholar]
- (46).Zheng X; Xu K; Zhou B; et al. A circulating extracellular vesicles-based novel screening tool for colorectal cancer revealed by shotgun and data-independent acquisition mass spectrometry. J. Extracell. Vesicles 2020, 9 (1), No. 1750202. [DOI] [PMC free article] [PubMed] [Google Scholar]
- (47).Zhang H; Zhang G; Su W; et al. High Throughput Isolation and Data Independent Acquisition Mass Spectrometry (DIA-MS) of Urinary Extracellular Vesicles to Improve Prostate Cancer Diagnosis. Molecules 2022, 27 (23), 8155. [DOI] [PMC free article] [PubMed] [Google Scholar]
- (48).Hallal S; Azimi A; Wei H; et al. A Comprehensive Proteomic SWATH-MS Workflow for Profiling Blood Extracellular Vesicles: A New Avenue for Glioma Tumour Surveillance. Int. J. Mol. Sci 2020, 21, 4754. [DOI] [PMC free article] [PubMed] [Google Scholar]
- (49).Chutipongtanate S; Greis KD Multiplex Biomarker Screening Assay for Urinary Extracellular Vesicles Study: A Targeted Label-Free Proteomic Approach. Sci. Rep 2018, 8, 15039–15039. [DOI] [PMC free article] [PubMed] [Google Scholar]
- (50).Pino LK; Just SC; MacCoss MJ; Searle BC Acquiring and Analyzing Data Independent Acquisition Proteomics Experiments without Spectrum Libraries. Mol. Cell. Proteomics 2020, 19, 1088–1103. [DOI] [PMC free article] [PubMed] [Google Scholar]
Associated Data
This section collects any data citations, data availability statements, or supplementary materials included in this article.
Supplementary Materials
Data Availability Statement
The raw MS data and the identified results from Spectronaut were deposited in the Japan ProteOme STandard Repository (jPOST: https://repository.jpostdb.org/) with JPST002290 for jPOST and PXD045198 for ProteomeXchange. The access link is https://repository.jpostdb.org/preview/35471092064fa2e59c0527 and access key is 1715.