FIGURE 4.

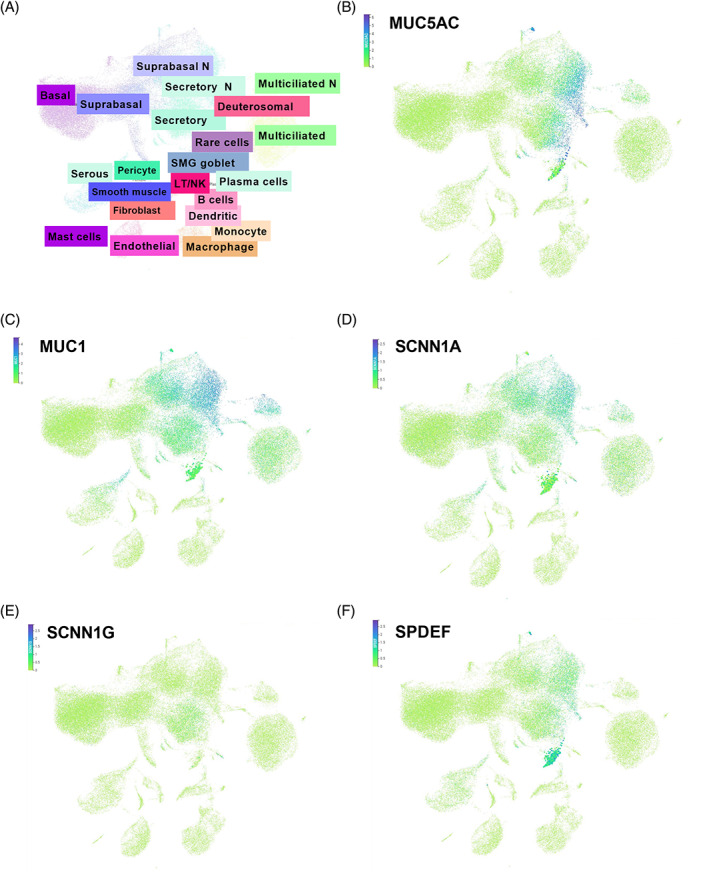
Single‐cell RNA‐sequencing of bronchial biopsies. (A) The overall distribution of cell types. tSNE plots of (B) MUC5AC, (C) MUC1, (D) SCNN1A, (E) SCNN1G and (F) SPDEF.

Single‐cell RNA‐sequencing of bronchial biopsies. (A) The overall distribution of cell types. tSNE plots of (B) MUC5AC, (C) MUC1, (D) SCNN1A, (E) SCNN1G and (F) SPDEF.