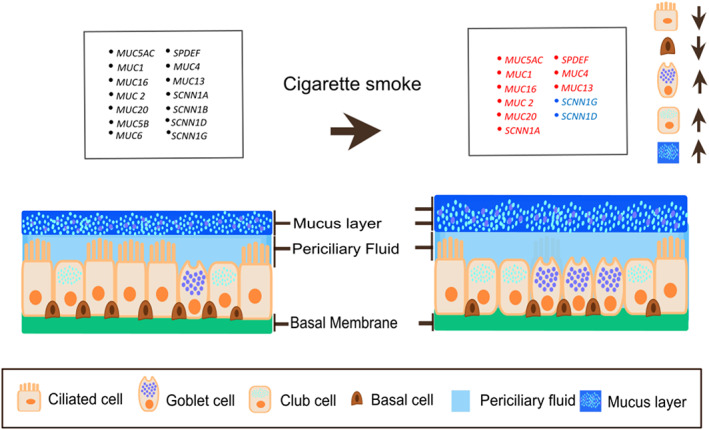
FIGURE 5.

Summary of bronchial epithelial cellular composition shifts upon smoke exposure according to our study findings. The arrows represent decreased ciliated cells and increased‐goblet and club cells with increased mucus layer when smoking compared to never‐smokers. The red and blue colours indicate the increased and decreased expression of the gene with cigarette smoking, respectively.
